Zip Codes with the Highest Percentage of Population Employed in Security & Protection in Puerto Rico
RELATED REPORTS & OPTIONS
Security & Protection
Puerto Rico
Compare Zip Codes
Map of Zip Codes with the Highest Percentage of Population Employed in Security & Protection in Puerto Rico
0.0%
25.0%
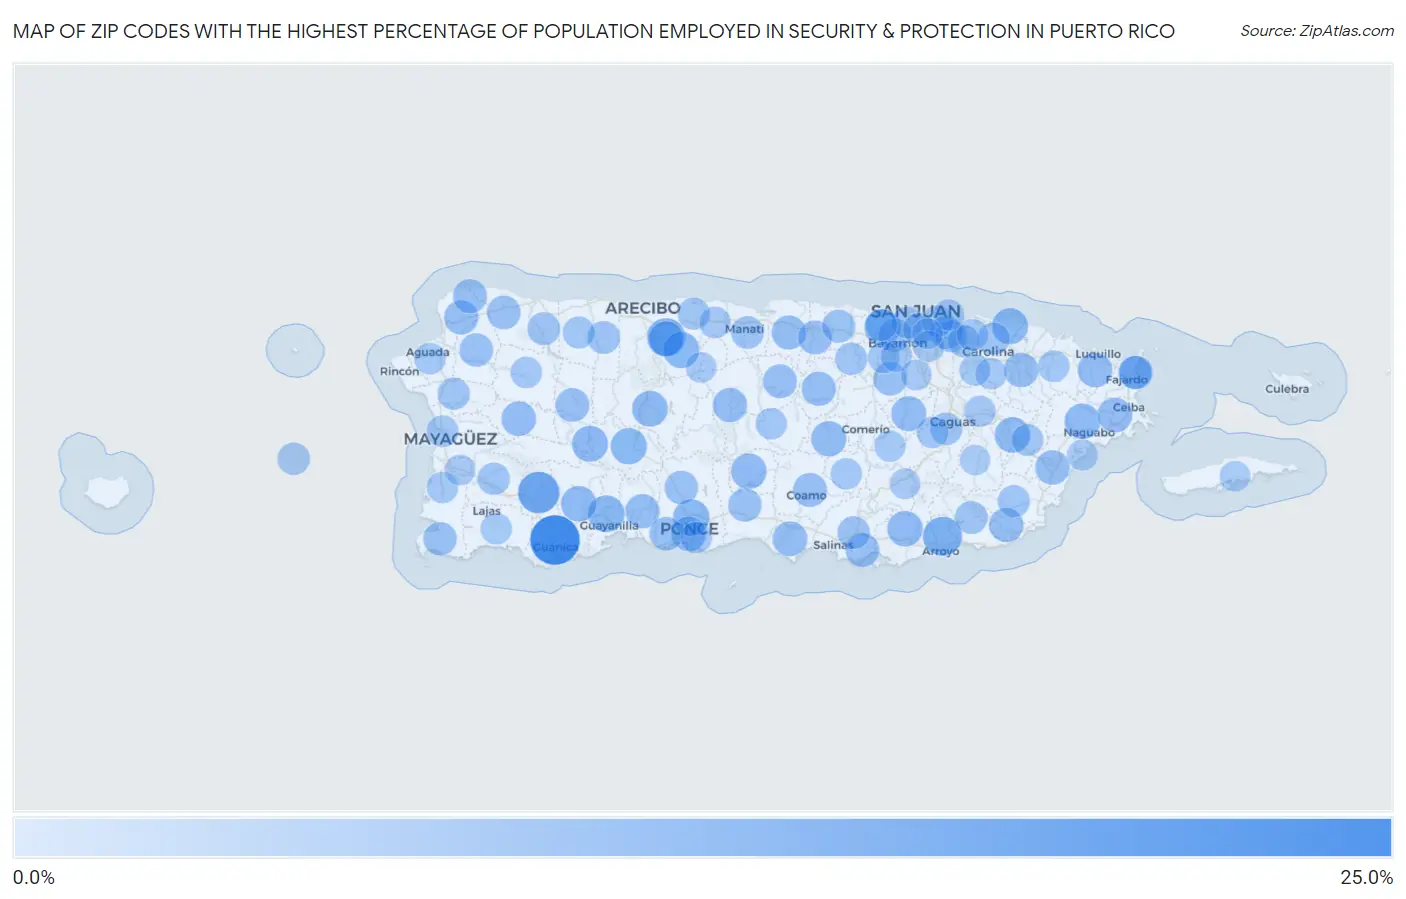
Zip Codes with the Highest Percentage of Population Employed in Security & Protection in Puerto Rico
| Zip Code | % Employed | vs State | vs National | |
| 1. | 00653 | 22.9% | 4.9%(+18.0)#1 | 2.1%(+20.8)#147 |
| 2. | 00637 | 14.3% | 4.9%(+9.36)#2 | 2.1%(+12.2)#398 |
| 3. | 00714 | 11.8% | 4.9%(+6.87)#3 | 2.1%(+9.66)#567 |
| 4. | 00616 | 11.0% | 4.9%(+6.10)#4 | 2.1%(+8.90)#643 |
| 5. | 00656 | 9.2% | 4.9%(+4.26)#5 | 2.1%(+7.05)#878 |
| 6. | 00730 | 9.0% | 4.9%(+4.03)#6 | 2.1%(+6.82)#920 |
| 7. | 00952 | 8.9% | 4.9%(+3.93)#7 | 2.1%(+6.72)#939 |
| 8. | 00688 | 8.7% | 4.9%(+3.80)#8 | 2.1%(+6.59)#963 |
| 9. | 00601 | 8.7% | 4.9%(+3.78)#9 | 2.1%(+6.57)#965 |
| 10. | 00772 | 8.6% | 4.9%(+3.71)#10 | 2.1%(+6.50)#974 |
| 11. | 00631 | 8.5% | 4.9%(+3.56)#11 | 2.1%(+6.35)#1,007 |
| 12. | 00641 | 8.3% | 4.9%(+3.33)#12 | 2.1%(+6.12)#1,080 |
| 13. | 00718 | 8.1% | 4.9%(+3.19)#13 | 2.1%(+5.98)#1,121 |
| 14. | 00777 | 8.1% | 4.9%(+3.17)#14 | 2.1%(+5.96)#1,124 |
| 15. | 00784 | 8.1% | 4.9%(+3.16)#15 | 2.1%(+5.95)#1,129 |
| 16. | 00698 | 8.1% | 4.9%(+3.12)#16 | 2.1%(+5.92)#1,143 |
| 17. | 00766 | 8.0% | 4.9%(+3.10)#17 | 2.1%(+5.90)#1,151 |
| 18. | 00794 | 7.7% | 4.9%(+2.76)#18 | 2.1%(+5.55)#1,264 |
| 19. | 00612 | 7.5% | 4.9%(+2.53)#19 | 2.1%(+5.32)#1,344 |
| 20. | 00703 | 7.4% | 4.9%(+2.45)#20 | 2.1%(+5.24)#1,367 |
| 21. | 00757 | 7.3% | 4.9%(+2.32)#21 | 2.1%(+5.11)#1,418 |
| 22. | 00735 | 7.2% | 4.9%(+2.31)#22 | 2.1%(+5.10)#1,423 |
| 23. | 00717 | 7.2% | 4.9%(+2.29)#23 | 2.1%(+5.08)#1,429 |
| 24. | 00670 | 7.1% | 4.9%(+2.21)#24 | 2.1%(+5.00)#1,466 |
| 25. | 00773 | 7.1% | 4.9%(+2.15)#25 | 2.1%(+4.95)#1,491 |
| 26. | 00791 | 7.0% | 4.9%(+2.04)#26 | 2.1%(+4.83)#1,539 |
| 27. | 00729 | 6.9% | 4.9%(+1.96)#27 | 2.1%(+4.75)#1,586 |
| 28. | 00638 | 6.8% | 4.9%(+1.86)#28 | 2.1%(+4.66)#1,628 |
| 29. | 00624 | 6.8% | 4.9%(+1.85)#29 | 2.1%(+4.64)#1,634 |
| 30. | 00603 | 6.7% | 4.9%(+1.79)#30 | 2.1%(+4.59)#1,663 |
| 31. | 00783 | 6.7% | 4.9%(+1.72)#31 | 2.1%(+4.52)#1,713 |
| 32. | 00707 | 6.7% | 4.9%(+1.72)#32 | 2.1%(+4.51)#1,714 |
| 33. | 00693 | 6.6% | 4.9%(+1.67)#33 | 2.1%(+4.46)#1,730 |
| 34. | 00690 | 6.6% | 4.9%(+1.64)#34 | 2.1%(+4.43)#1,748 |
| 35. | 00769 | 6.5% | 4.9%(+1.54)#35 | 2.1%(+4.33)#1,795 |
| 36. | 00692 | 6.4% | 4.9%(+1.43)#36 | 2.1%(+4.22)#1,850 |
| 37. | 00687 | 6.4% | 4.9%(+1.41)#37 | 2.1%(+4.20)#1,862 |
| 38. | 00704 | 6.3% | 4.9%(+1.40)#38 | 2.1%(+4.19)#1,869 |
| 39. | 00669 | 6.2% | 4.9%(+1.27)#39 | 2.1%(+4.06)#1,950 |
| 40. | 00956 | 6.2% | 4.9%(+1.24)#40 | 2.1%(+4.03)#1,963 |
| 41. | 00662 | 6.1% | 4.9%(+1.20)#41 | 2.1%(+3.99)#1,992 |
| 42. | 00728 | 6.0% | 4.9%(+1.11)#42 | 2.1%(+3.90)#2,043 |
| 43. | 00676 | 6.0% | 4.9%(+1.07)#43 | 2.1%(+3.87)#2,068 |
| 44. | 00731 | 6.0% | 4.9%(+1.07)#44 | 2.1%(+3.86)#2,076 |
| 45. | 00622 | 6.0% | 4.9%(+1.03)#45 | 2.1%(+3.82)#2,099 |
| 46. | 00795 | 5.9% | 4.9%(+0.969)#46 | 2.1%(+3.76)#2,140 |
| 47. | 00740 | 5.8% | 4.9%(+0.907)#47 | 2.1%(+3.70)#2,179 |
| 48. | 00917 | 5.7% | 4.9%(+0.729)#48 | 2.1%(+3.52)#2,309 |
| 49. | 00738 | 5.6% | 4.9%(+0.672)#49 | 2.1%(+3.46)#2,364 |
| 50. | 00961 | 5.6% | 4.9%(+0.642)#50 | 2.1%(+3.43)#2,382 |
| 51. | 00646 | 5.6% | 4.9%(+0.617)#51 | 2.1%(+3.41)#2,406 |
| 52. | 00659 | 5.3% | 4.9%(+0.318)#52 | 2.1%(+3.11)#2,668 |
| 53. | 00678 | 5.3% | 4.9%(+0.315)#53 | 2.1%(+3.11)#2,672 |
| 54. | 00723 | 5.2% | 4.9%(+0.243)#54 | 2.1%(+3.04)#2,724 |
| 55. | 00674 | 5.2% | 4.9%(+0.230)#55 | 2.1%(+3.02)#2,739 |
| 56. | 00751 | 5.1% | 4.9%(+0.175)#56 | 2.1%(+2.97)#2,797 |
| 57. | 00680 | 4.9% | 4.9%(+0.008)#57 | 2.1%(+2.80)#2,986 |
| 58. | 00953 | 4.9% | 4.9%(-0.069)#58 | 2.1%(+2.72)#3,080 |
| 59. | 00725 | 4.9% | 4.9%(-0.077)#59 | 2.1%(+2.72)#3,093 |
| 60. | 00610 | 4.8% | 4.9%(-0.107)#60 | 2.1%(+2.69)#3,128 |
| 61. | 00683 | 4.7% | 4.9%(-0.209)#61 | 2.1%(+2.58)#3,255 |
| 62. | 00985 | 4.7% | 4.9%(-0.227)#62 | 2.1%(+2.57)#3,284 |
| 63. | 00767 | 4.7% | 4.9%(-0.271)#63 | 2.1%(+2.52)#3,341 |
| 64. | 00652 | 4.5% | 4.9%(-0.483)#64 | 2.1%(+2.31)#3,672 |
| 65. | 00627 | 4.4% | 4.9%(-0.516)#65 | 2.1%(+2.28)#3,734 |
| 66. | 00923 | 4.4% | 4.9%(-0.553)#66 | 2.1%(+2.24)#3,796 |
| 67. | 00962 | 4.4% | 4.9%(-0.573)#67 | 2.1%(+2.22)#3,828 |
| 68. | 00949 | 4.4% | 4.9%(-0.584)#68 | 2.1%(+2.21)#3,848 |
| 69. | 00924 | 4.3% | 4.9%(-0.603)#69 | 2.1%(+2.19)#3,881 |
| 70. | 00771 | 4.2% | 4.9%(-0.716)#70 | 2.1%(+2.08)#4,082 |
| 71. | 00965 | 4.2% | 4.9%(-0.756)#71 | 2.1%(+2.04)#4,152 |
| 72. | 00682 | 4.2% | 4.9%(-0.782)#72 | 2.1%(+2.01)#4,199 |
| 73. | 00909 | 4.1% | 4.9%(-0.881)#73 | 2.1%(+1.91)#4,375 |
| 74. | 00983 | 4.1% | 4.9%(-0.889)#74 | 2.1%(+1.90)#4,393 |
| 75. | 00745 | 4.0% | 4.9%(-0.912)#75 | 2.1%(+1.88)#4,436 |
| 76. | 00617 | 3.9% | 4.9%(-0.998)#76 | 2.1%(+1.79)#4,601 |
| 77. | 00957 | 3.9% | 4.9%(-1.00)#77 | 2.1%(+1.79)#4,612 |
| 78. | 00602 | 3.9% | 4.9%(-1.03)#78 | 2.1%(+1.76)#4,664 |
| 79. | 00716 | 3.9% | 4.9%(-1.04)#79 | 2.1%(+1.76)#4,676 |
| 80. | 00685 | 3.9% | 4.9%(-1.07)#80 | 2.1%(+1.72)#4,757 |
| 81. | 00720 | 3.9% | 4.9%(-1.08)#81 | 2.1%(+1.71)#4,789 |
| 82. | 00623 | 3.9% | 4.9%(-1.09)#82 | 2.1%(+1.71)#4,794 |
| 83. | 00727 | 3.8% | 4.9%(-1.11)#83 | 2.1%(+1.68)#4,850 |
| 84. | 00705 | 3.8% | 4.9%(-1.15)#84 | 2.1%(+1.64)#4,923 |
| 85. | 00778 | 3.7% | 4.9%(-1.20)#85 | 2.1%(+1.60)#5,038 |
| 86. | 00987 | 3.7% | 4.9%(-1.22)#86 | 2.1%(+1.57)#5,099 |
| 87. | 00976 | 3.7% | 4.9%(-1.23)#87 | 2.1%(+1.57)#5,105 |
| 88. | 00667 | 3.7% | 4.9%(-1.25)#88 | 2.1%(+1.55)#5,163 |
| 89. | 00739 | 3.6% | 4.9%(-1.29)#89 | 2.1%(+1.50)#5,277 |
| 90. | 00959 | 3.6% | 4.9%(-1.35)#90 | 2.1%(+1.44)#5,434 |
| 91. | 00913 | 3.6% | 4.9%(-1.37)#91 | 2.1%(+1.42)#5,491 |
| 92. | 00921 | 3.5% | 4.9%(-1.40)#92 | 2.1%(+1.39)#5,571 |
| 93. | 00741 | 3.4% | 4.9%(-1.58)#93 | 2.1%(+1.22)#6,042 |
| 94. | 00920 | 3.3% | 4.9%(-1.65)#94 | 2.1%(+1.14)#6,270 |
| 95. | 00736 | 3.3% | 4.9%(-1.67)#95 | 2.1%(+1.13)#6,326 |
| 96. | 00971 | 3.2% | 4.9%(-1.71)#96 | 2.1%(+1.08)#6,454 |
| 97. | 00650 | 3.1% | 4.9%(-1.85)#97 | 2.1%(+0.937)#6,931 |
| 98. | 00660 | 3.0% | 4.9%(-1.94)#98 | 2.1%(+0.855)#7,218 |
| 99. | 00765 | 2.9% | 4.9%(-2.00)#99 | 2.1%(+0.791)#7,477 |
| 100. | 00754 | 2.8% | 4.9%(-2.17)#100 | 2.1%(+0.618)#8,252 |
1
2Common Questions
What are the Top 10 Zip Codes with the Highest Percentage of Population Employed in Security & Protection in Puerto Rico?
Top 10 Zip Codes with the Highest Percentage of Population Employed in Security & Protection in Puerto Rico are:
What zip code has the Highest Percentage of Population Employed in Security & Protection in Puerto Rico?
00653 has the Highest Percentage of Population Employed in Security & Protection in Puerto Rico with 22.9%.
What is the Percentage of Population Employed in Security & Protection in the State of Puerto Rico?
Percentage of Population Employed in Security & Protection in Puerto Rico is 4.9%.
What is the Percentage of Population Employed in Security & Protection in the United States?
Percentage of Population Employed in Security & Protection in the United States is 2.1%.