Zip Codes with the Lowest Costs of Housing as Percentage of Income in Los Angeles, CA
RELATED REPORTS & OPTIONS
Lowest Housing Costs / Income
Los Angeles
Compare Zip Codes
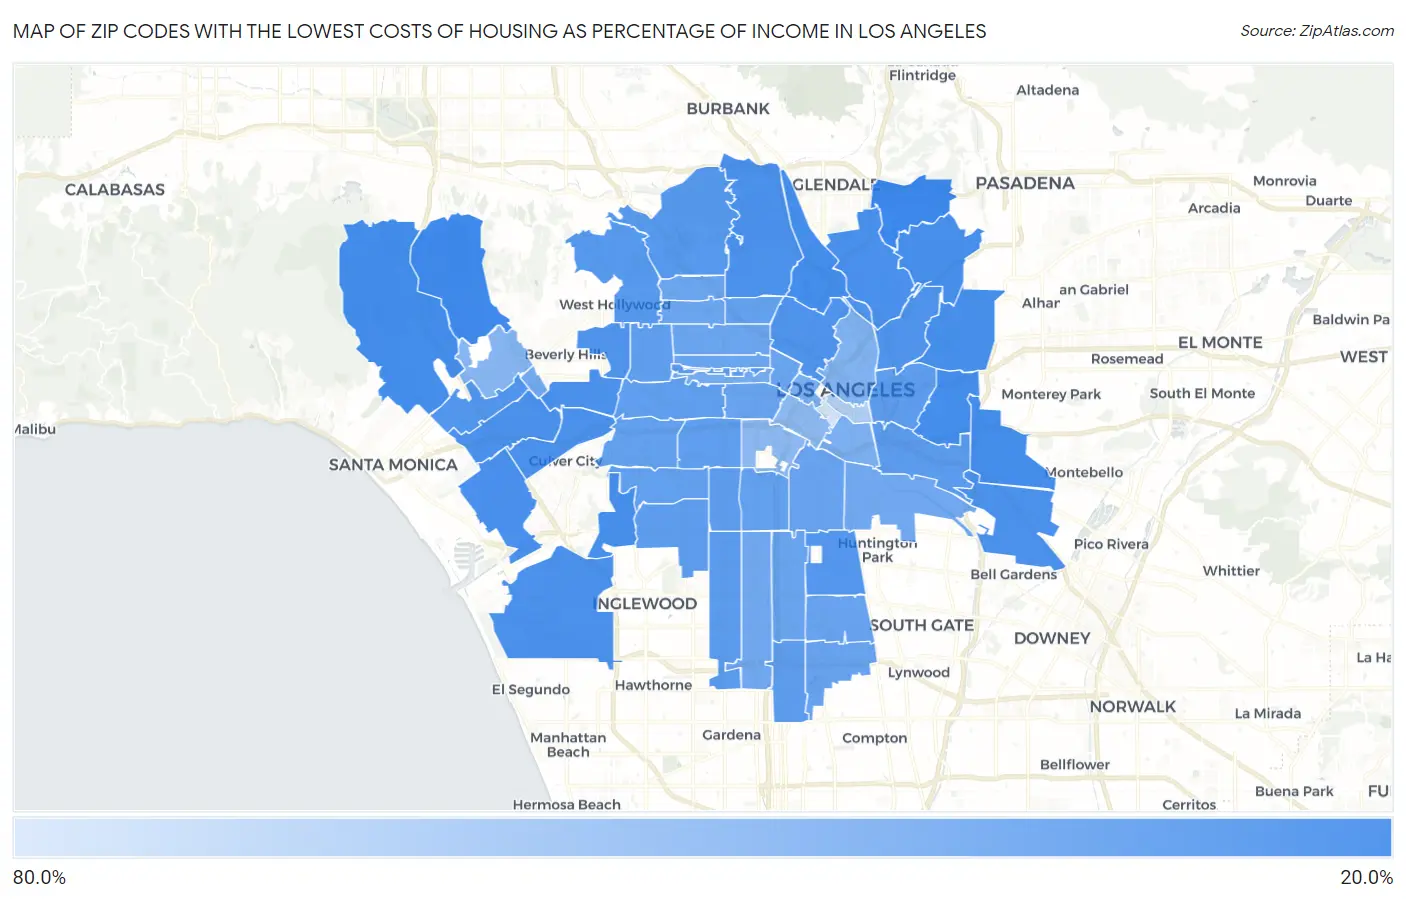
Map of Zip Codes with the Lowest Costs of Housing as Percentage of Income in Los Angeles
70.8%
22.2%
Zip Codes with the Lowest Costs of Housing as Percentage of Income in Los Angeles, CA
| Zip Code | Housing Costs / Income | vs State | vs National | |
| 1. | 90041 | 22.2% | 25.4%(-3.21)#445 | 20.4%(+1.84)#24,533 |
| 2. | 90077 | 23.6% | 25.4%(-1.79)#655 | 20.4%(+3.25)#26,020 |
| 3. | 90039 | 24.4% | 25.4%(-0.976)#772 | 20.4%(+4.07)#26,659 |
| 4. | 90049 | 24.8% | 25.4%(-0.591)#825 | 20.4%(+4.46)#26,904 |
| 5. | 90022 | 25.0% | 25.4%(-0.424)#852 | 20.4%(+4.62)#27,021 |
| 6. | 90063 | 25.1% | 25.4%(-0.368)#859 | 20.4%(+4.68)#27,052 |
| 7. | 90032 | 25.3% | 25.4%(-0.140)#895 | 20.4%(+4.91)#27,195 |
| 8. | 90056 | 25.4% | 25.4%(-0.062)#905 | 20.4%(+4.98)#27,250 |
| 9. | 90042 | 25.6% | 25.4%(+0.188)#949 | 20.4%(+5.23)#27,420 |
| 10. | 90066 | 25.9% | 25.4%(+0.457)#991 | 20.4%(+5.50)#27,579 |
| 11. | 90065 | 26.3% | 25.4%(+0.853)#1,039 | 20.4%(+5.90)#27,797 |
| 12. | 90035 | 26.5% | 25.4%(+1.08)#1,078 | 20.4%(+6.13)#27,913 |
| 13. | 90034 | 26.5% | 25.4%(+1.10)#1,081 | 20.4%(+6.14)#27,922 |
| 14. | 90045 | 26.6% | 25.4%(+1.19)#1,096 | 20.4%(+6.23)#27,961 |
| 15. | 90040 | 26.8% | 25.4%(+1.33)#1,109 | 20.4%(+6.38)#28,020 |
| 16. | 90027 | 26.8% | 25.4%(+1.39)#1,120 | 20.4%(+6.44)#28,055 |
| 17. | 90064 | 26.9% | 25.4%(+1.53)#1,136 | 20.4%(+6.57)#28,111 |
| 18. | 90026 | 27.2% | 25.4%(+1.80)#1,175 | 20.4%(+6.84)#28,230 |
| 19. | 90031 | 28.1% | 25.4%(+2.71)#1,258 | 20.4%(+7.76)#28,577 |
| 20. | 90048 | 28.2% | 25.4%(+2.77)#1,265 | 20.4%(+7.82)#28,603 |
| 21. | 90025 | 28.5% | 25.4%(+3.04)#1,278 | 20.4%(+8.09)#28,671 |
| 22. | 90001 | 29.4% | 25.4%(+3.97)#1,334 | 20.4%(+9.01)#28,901 |
| 23. | 90068 | 29.9% | 25.4%(+4.46)#1,365 | 20.4%(+9.50)#29,028 |
| 24. | 90046 | 29.9% | 25.4%(+4.48)#1,367 | 20.4%(+9.52)#29,033 |
| 25. | 90047 | 31.0% | 25.4%(+5.61)#1,419 | 20.4%(+10.7)#29,251 |
| 26. | 90010 | 31.1% | 25.4%(+5.68)#1,427 | 20.4%(+10.7)#29,268 |
| 27. | 90023 | 31.3% | 25.4%(+5.92)#1,432 | 20.4%(+11.0)#29,308 |
| 28. | 90033 | 32.2% | 25.4%(+6.82)#1,453 | 20.4%(+11.9)#29,426 |
| 29. | 90062 | 32.3% | 25.4%(+6.85)#1,454 | 20.4%(+11.9)#29,429 |
| 30. | 90043 | 32.3% | 25.4%(+6.89)#1,456 | 20.4%(+11.9)#29,437 |
| 31. | 90061 | 32.4% | 25.4%(+6.94)#1,458 | 20.4%(+12.0)#29,444 |
| 32. | 90036 | 32.6% | 25.4%(+7.19)#1,464 | 20.4%(+12.2)#29,473 |
| 33. | 90018 | 32.8% | 25.4%(+7.37)#1,469 | 20.4%(+12.4)#29,500 |
| 34. | 90019 | 33.0% | 25.4%(+7.56)#1,473 | 20.4%(+12.6)#29,518 |
| 35. | 90008 | 33.1% | 25.4%(+7.67)#1,474 | 20.4%(+12.7)#29,531 |
| 36. | 90016 | 33.4% | 25.4%(+8.02)#1,480 | 20.4%(+13.1)#29,563 |
| 37. | 90029 | 33.6% | 25.4%(+8.22)#1,486 | 20.4%(+13.3)#29,583 |
| 38. | 90037 | 33.7% | 25.4%(+8.28)#1,487 | 20.4%(+13.3)#29,584 |
| 39. | 90002 | 34.5% | 25.4%(+9.06)#1,495 | 20.4%(+14.1)#29,621 |
| 40. | 90006 | 34.5% | 25.4%(+9.09)#1,497 | 20.4%(+14.1)#29,626 |
| 41. | 90059 | 34.7% | 25.4%(+9.28)#1,501 | 20.4%(+14.3)#29,639 |
| 42. | 90011 | 34.9% | 25.4%(+9.48)#1,504 | 20.4%(+14.5)#29,659 |
| 43. | 90003 | 35.2% | 25.4%(+9.75)#1,505 | 20.4%(+14.8)#29,673 |
| 44. | 90057 | 35.5% | 25.4%(+10.1)#1,510 | 20.4%(+15.1)#29,695 |
| 45. | 90038 | 36.2% | 25.4%(+10.7)#1,511 | 20.4%(+15.8)#29,724 |
| 46. | 90020 | 36.3% | 25.4%(+10.9)#1,512 | 20.4%(+15.9)#29,729 |
| 47. | 90004 | 36.3% | 25.4%(+10.9)#1,514 | 20.4%(+15.9)#29,731 |
| 48. | 90028 | 36.5% | 25.4%(+11.0)#1,517 | 20.4%(+16.1)#29,743 |
| 49. | 90044 | 37.7% | 25.4%(+12.3)#1,525 | 20.4%(+17.4)#29,778 |
| 50. | 90058 | 37.9% | 25.4%(+12.5)#1,526 | 20.4%(+17.5)#29,782 |
| 51. | 90067 | 38.1% | 25.4%(+12.7)#1,528 | 20.4%(+17.7)#29,792 |
| 52. | 90005 | 38.9% | 25.4%(+13.5)#1,531 | 20.4%(+18.5)#29,816 |
| 53. | 90017 | 39.9% | 25.4%(+14.5)#1,534 | 20.4%(+19.5)#29,845 |
| 54. | 90021 | 42.0% | 25.4%(+16.6)#1,548 | 20.4%(+21.7)#29,895 |
| 55. | 90012 | 42.6% | 25.4%(+17.2)#1,549 | 20.4%(+22.3)#29,907 |
| 56. | 90024 | 44.8% | 25.4%(+19.4)#1,552 | 20.4%(+24.4)#29,939 |
| 57. | 90015 | 46.4% | 25.4%(+20.9)#1,554 | 20.4%(+26.0)#29,950 |
| 58. | 90007 | 46.6% | 25.4%(+21.2)#1,555 | 20.4%(+26.3)#29,953 |
| 59. | 90013 | 57.9% | 25.4%(+32.5)#1,564 | 20.4%(+37.6)#29,998 |
| 60. | 90014 | 70.8% | 25.4%(+45.4)#1,567 | 20.4%(+50.4)#30,012 |
1
Common Questions
What are the Top 10 Zip Codes with the Lowest Costs of Housing as Percentage of Income in Los Angeles, CA?
Top 10 Zip Codes with the Lowest Costs of Housing as Percentage of Income in Los Angeles, CA are:
What zip code has the Lowest Costs of Housing as Percentage of Income in Los Angeles, CA?
90041 has the Lowest Costs of Housing as Percentage of Income in Los Angeles, CA with 22.2%.
What is the Average Housing Costs as Percentage of Income in Los Angeles, CA?
Average Housing Costs as Percentage of Income in Los Angeles is 30.8%.
What is the Average Housing Costs as Percentage of Income in California?
Average Housing Costs as Percentage of Income in California is 25.4%.
What is the Average Housing Costs as Percentage of Income in the United States?
Average Housing Costs as Percentage of Income in the United States is 20.4%.