Zip Codes with the Highest Percentage of Population Employed in Security & Protection in Nevada
RELATED REPORTS & OPTIONS
Security & Protection
Nevada
Compare Zip Codes
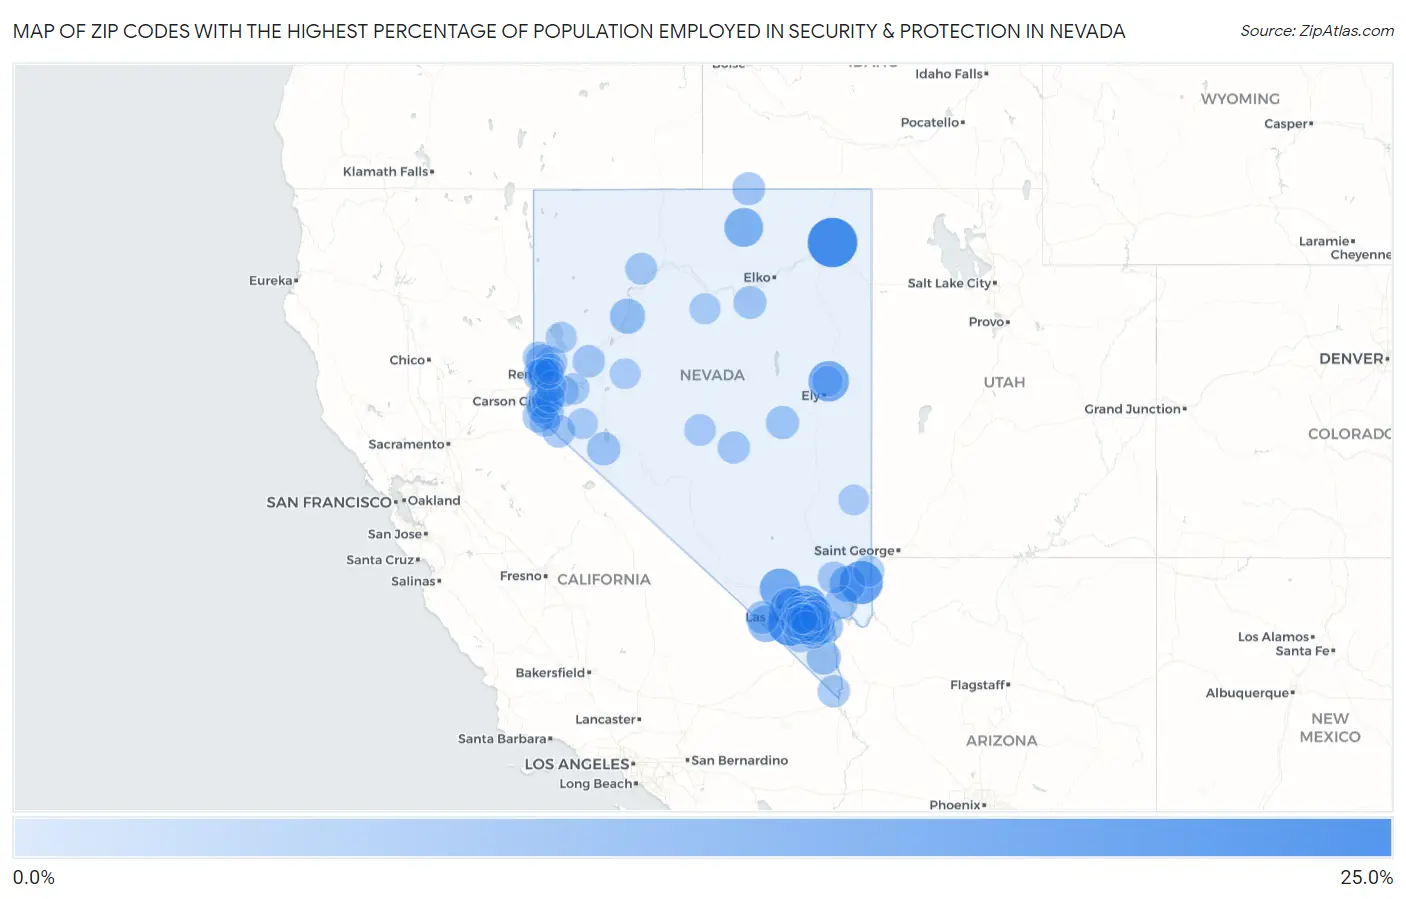
Map of Zip Codes with the Highest Percentage of Population Employed in Security & Protection in Nevada
0.0%
25.0%
Zip Codes with the Highest Percentage of Population Employed in Security & Protection in Nevada
| Zip Code | % Employed | vs State | vs National | |
| 1. | 89835 | 24.4% | 3.0%(+21.3)#1 | 2.1%(+22.2)#135 |
| 2. | 89161 | 17.9% | 3.0%(+14.9)#2 | 2.1%(+15.8)#258 |
| 3. | 89007 | 16.9% | 3.0%(+13.8)#3 | 2.1%(+14.7)#286 |
| 4. | 89085 | 14.7% | 3.0%(+11.7)#4 | 2.1%(+12.6)#374 |
| 5. | 89018 | 13.8% | 3.0%(+10.8)#5 | 2.1%(+11.7)#426 |
| 6. | 89318 | 13.7% | 3.0%(+10.7)#6 | 2.1%(+11.5)#434 |
| 7. | 89124 | 12.8% | 3.0%(+9.80)#7 | 2.1%(+10.7)#486 |
| 8. | 89834 | 11.7% | 3.0%(+8.64)#8 | 2.1%(+9.52)#584 |
| 9. | 89061 | 9.0% | 3.0%(+6.02)#9 | 2.1%(+6.90)#905 |
| 10. | 89021 | 8.5% | 3.0%(+5.50)#10 | 2.1%(+6.38)#1,001 |
| 11. | 89419 | 7.6% | 3.0%(+4.61)#11 | 2.1%(+5.49)#1,280 |
| 12. | 89046 | 6.6% | 3.0%(+3.56)#12 | 2.1%(+4.44)#1,739 |
| 13. | 89005 | 5.8% | 3.0%(+2.76)#13 | 2.1%(+3.65)#2,207 |
| 14. | 89415 | 5.5% | 3.0%(+2.45)#14 | 2.1%(+3.34)#2,466 |
| 15. | 89081 | 5.5% | 3.0%(+2.42)#15 | 2.1%(+3.31)#2,488 |
| 16. | 89506 | 5.4% | 3.0%(+2.40)#16 | 2.1%(+3.29)#2,506 |
| 17. | 89048 | 5.3% | 3.0%(+2.30)#17 | 2.1%(+3.18)#2,609 |
| 18. | 89143 | 5.3% | 3.0%(+2.28)#18 | 2.1%(+3.16)#2,626 |
| 19. | 89086 | 5.3% | 3.0%(+2.26)#19 | 2.1%(+3.14)#2,644 |
| 20. | 89314 | 5.3% | 3.0%(+2.23)#20 | 2.1%(+3.11)#2,666 |
| 21. | 89084 | 5.2% | 3.0%(+2.16)#21 | 2.1%(+3.04)#2,716 |
| 22. | 89832 | 4.9% | 3.0%(+1.89)#22 | 2.1%(+2.77)#3,024 |
| 23. | 89040 | 4.9% | 3.0%(+1.84)#23 | 2.1%(+2.72)#3,078 |
| 24. | 89822 | 4.8% | 3.0%(+1.80)#24 | 2.1%(+2.68)#3,138 |
| 25. | 89423 | 4.8% | 3.0%(+1.76)#25 | 2.1%(+2.64)#3,186 |
| 26. | 89044 | 4.7% | 3.0%(+1.70)#26 | 2.1%(+2.58)#3,262 |
| 27. | 89410 | 4.6% | 3.0%(+1.62)#27 | 2.1%(+2.50)#3,373 |
| 28. | 89131 | 4.6% | 3.0%(+1.57)#28 | 2.1%(+2.46)#3,433 |
| 29. | 89166 | 4.6% | 3.0%(+1.53)#29 | 2.1%(+2.41)#3,504 |
| 30. | 89130 | 4.5% | 3.0%(+1.46)#30 | 2.1%(+2.34)#3,626 |
| 31. | 89408 | 4.4% | 3.0%(+1.41)#31 | 2.1%(+2.29)#3,705 |
| 32. | 89449 | 4.4% | 3.0%(+1.41)#32 | 2.1%(+2.29)#3,713 |
| 33. | 89501 | 4.4% | 3.0%(+1.35)#33 | 2.1%(+2.23)#3,803 |
| 34. | 89029 | 4.3% | 3.0%(+1.29)#34 | 2.1%(+2.17)#3,906 |
| 35. | 89121 | 4.2% | 3.0%(+1.20)#35 | 2.1%(+2.08)#4,072 |
| 36. | 89441 | 4.2% | 3.0%(+1.15)#36 | 2.1%(+2.03)#4,161 |
| 37. | 89049 | 4.2% | 3.0%(+1.14)#37 | 2.1%(+2.02)#4,176 |
| 38. | 89703 | 4.1% | 3.0%(+1.04)#38 | 2.1%(+1.93)#4,352 |
| 39. | 89179 | 4.0% | 3.0%(+1.02)#39 | 2.1%(+1.90)#4,402 |
| 40. | 89705 | 4.0% | 3.0%(+0.963)#40 | 2.1%(+1.85)#4,510 |
| 41. | 89101 | 3.9% | 3.0%(+0.894)#41 | 2.1%(+1.78)#4,636 |
| 42. | 89002 | 3.9% | 3.0%(+0.868)#42 | 2.1%(+1.75)#4,689 |
| 43. | 89141 | 3.8% | 3.0%(+0.819)#43 | 2.1%(+1.70)#4,808 |
| 44. | 89445 | 3.8% | 3.0%(+0.764)#44 | 2.1%(+1.65)#4,919 |
| 45. | 89025 | 3.8% | 3.0%(+0.747)#45 | 2.1%(+1.63)#4,951 |
| 46. | 89149 | 3.8% | 3.0%(+0.738)#46 | 2.1%(+1.62)#4,978 |
| 47. | 89014 | 3.8% | 3.0%(+0.724)#47 | 2.1%(+1.61)#5,019 |
| 48. | 89503 | 3.7% | 3.0%(+0.647)#48 | 2.1%(+1.53)#5,197 |
| 49. | 89508 | 3.6% | 3.0%(+0.616)#49 | 2.1%(+1.50)#5,283 |
| 50. | 89011 | 3.6% | 3.0%(+0.605)#50 | 2.1%(+1.49)#5,318 |
| 51. | 89031 | 3.6% | 3.0%(+0.560)#51 | 2.1%(+1.44)#5,418 |
| 52. | 89045 | 3.6% | 3.0%(+0.534)#52 | 2.1%(+1.42)#5,496 |
| 53. | 89704 | 3.5% | 3.0%(+0.486)#53 | 2.1%(+1.37)#5,629 |
| 54. | 89183 | 3.5% | 3.0%(+0.460)#54 | 2.1%(+1.34)#5,688 |
| 55. | 89142 | 3.4% | 3.0%(+0.415)#55 | 2.1%(+1.30)#5,816 |
| 56. | 89557 | 3.4% | 3.0%(+0.363)#56 | 2.1%(+1.25)#5,945 |
| 57. | 89074 | 3.3% | 3.0%(+0.314)#57 | 2.1%(+1.20)#6,110 |
| 58. | 89523 | 3.3% | 3.0%(+0.304)#58 | 2.1%(+1.19)#6,137 |
| 59. | 89032 | 3.3% | 3.0%(+0.272)#59 | 2.1%(+1.15)#6,231 |
| 60. | 89129 | 3.3% | 3.0%(+0.254)#60 | 2.1%(+1.14)#6,290 |
| 61. | 89108 | 3.3% | 3.0%(+0.236)#61 | 2.1%(+1.12)#6,355 |
| 62. | 89123 | 3.3% | 3.0%(+0.228)#62 | 2.1%(+1.11)#6,375 |
| 63. | 89424 | 3.2% | 3.0%(+0.127)#63 | 2.1%(+1.01)#6,668 |
| 64. | 89027 | 3.1% | 3.0%(+0.109)#64 | 2.1%(+0.992)#6,736 |
| 65. | 89178 | 3.1% | 3.0%(+0.066)#65 | 2.1%(+0.948)#6,901 |
| 66. | 89030 | 3.1% | 3.0%(+0.060)#66 | 2.1%(+0.942)#6,916 |
| 67. | 89429 | 3.1% | 3.0%(+0.054)#67 | 2.1%(+0.937)#6,934 |
| 68. | 89701 | 3.0% | 3.0%(-0.021)#68 | 2.1%(+0.861)#7,195 |
| 69. | 89119 | 3.0% | 3.0%(-0.060)#69 | 2.1%(+0.822)#7,338 |
| 70. | 89102 | 3.0% | 3.0%(-0.079)#70 | 2.1%(+0.804)#7,421 |
| 71. | 89052 | 2.9% | 3.0%(-0.109)#71 | 2.1%(+0.774)#7,543 |
| 72. | 89460 | 2.9% | 3.0%(-0.143)#72 | 2.1%(+0.739)#7,697 |
| 73. | 89145 | 2.9% | 3.0%(-0.155)#73 | 2.1%(+0.727)#7,753 |
| 74. | 89820 | 2.9% | 3.0%(-0.171)#74 | 2.1%(+0.711)#7,821 |
| 75. | 89134 | 2.8% | 3.0%(-0.185)#75 | 2.1%(+0.698)#7,883 |
| 76. | 89106 | 2.8% | 3.0%(-0.264)#76 | 2.1%(+0.619)#8,250 |
| 77. | 89169 | 2.8% | 3.0%(-0.276)#77 | 2.1%(+0.606)#8,299 |
| 78. | 89144 | 2.8% | 3.0%(-0.280)#78 | 2.1%(+0.603)#8,310 |
| 79. | 89301 | 2.8% | 3.0%(-0.280)#79 | 2.1%(+0.602)#8,312 |
| 80. | 89122 | 2.7% | 3.0%(-0.296)#80 | 2.1%(+0.587)#8,381 |
| 81. | 89147 | 2.7% | 3.0%(-0.322)#81 | 2.1%(+0.561)#8,492 |
| 82. | 89403 | 2.6% | 3.0%(-0.393)#82 | 2.1%(+0.489)#8,835 |
| 83. | 89447 | 2.6% | 3.0%(-0.396)#83 | 2.1%(+0.487)#8,844 |
| 84. | 89115 | 2.6% | 3.0%(-0.420)#84 | 2.1%(+0.463)#8,954 |
| 85. | 89148 | 2.6% | 3.0%(-0.458)#85 | 2.1%(+0.425)#9,135 |
| 86. | 89012 | 2.6% | 3.0%(-0.481)#86 | 2.1%(+0.402)#9,250 |
| 87. | 89042 | 2.5% | 3.0%(-0.517)#87 | 2.1%(+0.366)#9,444 |
| 88. | 89104 | 2.5% | 3.0%(-0.520)#88 | 2.1%(+0.363)#9,456 |
| 89. | 89138 | 2.5% | 3.0%(-0.559)#89 | 2.1%(+0.324)#9,663 |
| 90. | 89103 | 2.5% | 3.0%(-0.566)#90 | 2.1%(+0.317)#9,698 |
| 91. | 89135 | 2.4% | 3.0%(-0.602)#91 | 2.1%(+0.281)#9,902 |
| 92. | 89521 | 2.4% | 3.0%(-0.602)#92 | 2.1%(+0.280)#9,906 |
| 93. | 89406 | 2.3% | 3.0%(-0.687)#93 | 2.1%(+0.195)#10,358 |
| 94. | 89146 | 2.3% | 3.0%(-0.744)#94 | 2.1%(+0.138)#10,726 |
| 95. | 89110 | 2.2% | 3.0%(-0.789)#95 | 2.1%(+0.093)#11,001 |
| 96. | 89139 | 2.2% | 3.0%(-0.821)#96 | 2.1%(+0.062)#11,195 |
| 97. | 89706 | 2.2% | 3.0%(-0.874)#97 | 2.1%(+0.009)#11,523 |
| 98. | 89117 | 2.2% | 3.0%(-0.880)#98 | 2.1%(+0.003)#11,563 |
| 99. | 89436 | 2.1% | 3.0%(-0.940)#99 | 2.1%(-0.058)#11,973 |
| 100. | 89431 | 2.1% | 3.0%(-0.950)#100 | 2.1%(-0.067)#12,042 |
1
2Common Questions
What are the Top 10 Zip Codes with the Highest Percentage of Population Employed in Security & Protection in Nevada?
Top 10 Zip Codes with the Highest Percentage of Population Employed in Security & Protection in Nevada are:
What zip code has the Highest Percentage of Population Employed in Security & Protection in Nevada?
89835 has the Highest Percentage of Population Employed in Security & Protection in Nevada with 24.4%.
What is the Percentage of Population Employed in Security & Protection in the State of Nevada?
Percentage of Population Employed in Security & Protection in Nevada is 3.0%.
What is the Percentage of Population Employed in Security & Protection in the United States?
Percentage of Population Employed in Security & Protection in the United States is 2.1%.