Zip Codes with the Highest Percentage of Population Employed in Cleaning & Maintenance in Los Angeles, CA
RELATED REPORTS & OPTIONS
Cleaning & Maintenance
Los Angeles
Compare Zip Codes
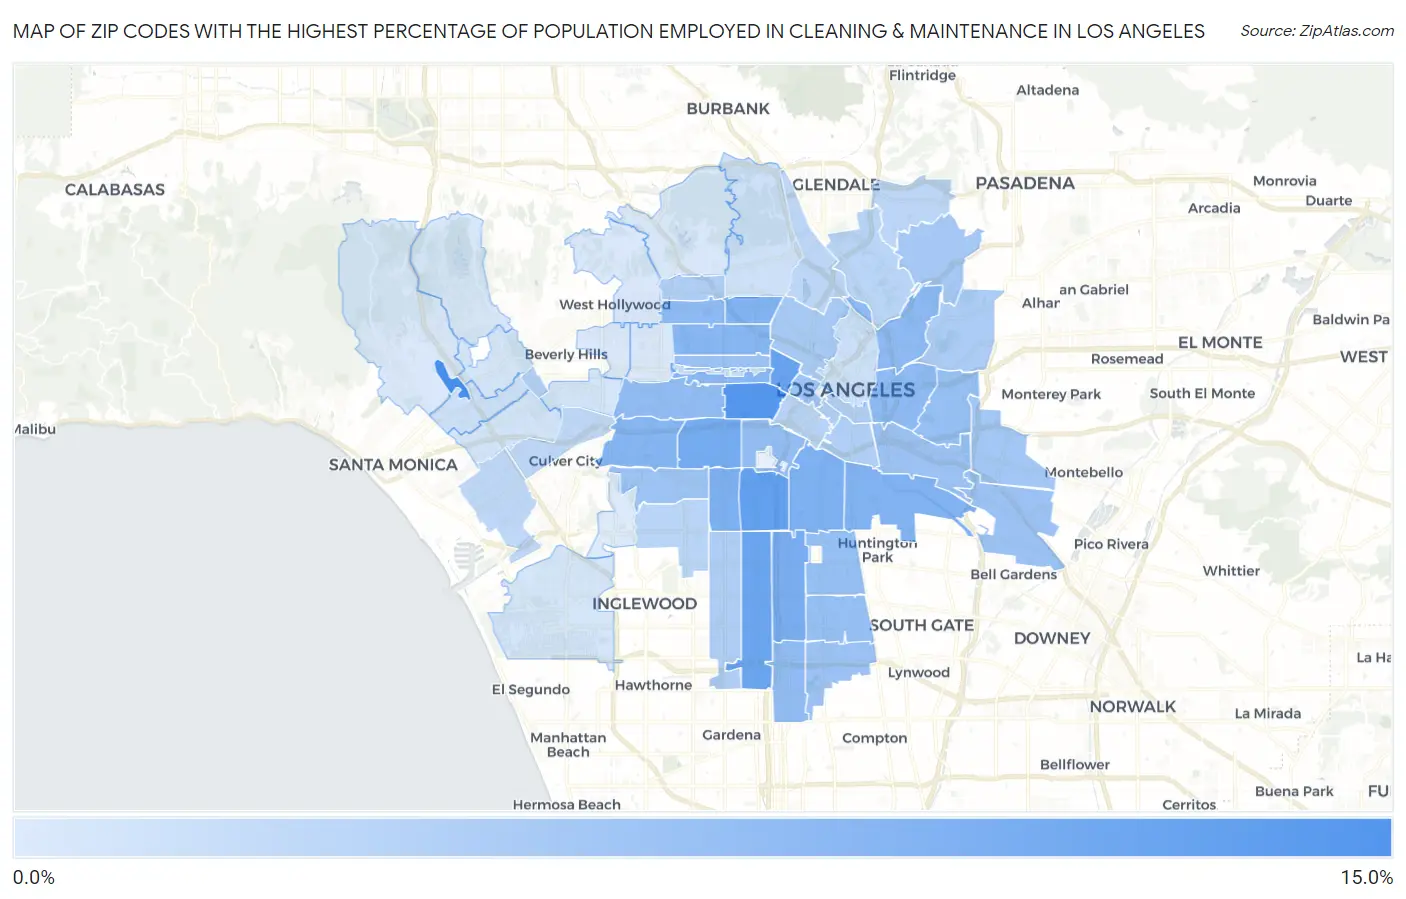
Map of Zip Codes with the Highest Percentage of Population Employed in Cleaning & Maintenance in Los Angeles
0.26%
13.1%
Zip Codes with the Highest Percentage of Population Employed in Cleaning & Maintenance in Los Angeles, CA
| Zip Code | % Employed | vs State | vs National | |
| 1. | 90073 | 13.1% | 3.7%(+9.38)#57 | 3.5%(+9.61)#1,001 |
| 2. | 90006 | 11.9% | 3.7%(+8.15)#71 | 3.5%(+8.39)#1,236 |
| 3. | 90037 | 10.7% | 3.7%(+6.99)#96 | 3.5%(+7.23)#1,567 |
| 4. | 90057 | 10.2% | 3.7%(+6.51)#105 | 3.5%(+6.75)#1,723 |
| 5. | 90044 | 9.8% | 3.7%(+6.08)#113 | 3.5%(+6.31)#1,909 |
| 6. | 90018 | 9.0% | 3.7%(+5.29)#124 | 3.5%(+5.52)#2,295 |
| 7. | 90003 | 8.6% | 3.7%(+4.91)#139 | 3.5%(+5.14)#2,517 |
| 8. | 90011 | 8.1% | 3.7%(+4.40)#176 | 3.5%(+4.64)#2,930 |
| 9. | 90062 | 8.1% | 3.7%(+4.37)#180 | 3.5%(+4.61)#2,964 |
| 10. | 90029 | 8.0% | 3.7%(+4.26)#185 | 3.5%(+4.49)#3,067 |
| 11. | 90058 | 7.9% | 3.7%(+4.16)#190 | 3.5%(+4.40)#3,147 |
| 12. | 90016 | 7.7% | 3.7%(+3.95)#209 | 3.5%(+4.19)#3,356 |
| 13. | 90004 | 7.5% | 3.7%(+3.76)#220 | 3.5%(+3.99)#3,571 |
| 14. | 90005 | 7.1% | 3.7%(+3.37)#250 | 3.5%(+3.60)#3,971 |
| 15. | 90038 | 6.8% | 3.7%(+3.08)#271 | 3.5%(+3.32)#4,338 |
| 16. | 90033 | 6.8% | 3.7%(+3.06)#273 | 3.5%(+3.29)#4,369 |
| 17. | 90031 | 6.7% | 3.7%(+3.01)#277 | 3.5%(+3.25)#4,446 |
| 18. | 90019 | 6.7% | 3.7%(+2.94)#286 | 3.5%(+3.18)#4,546 |
| 19. | 90061 | 6.5% | 3.7%(+2.78)#306 | 3.5%(+3.01)#4,776 |
| 20. | 90007 | 6.4% | 3.7%(+2.68)#314 | 3.5%(+2.92)#4,940 |
| 21. | 90063 | 6.2% | 3.7%(+2.46)#340 | 3.5%(+2.69)#5,322 |
| 22. | 90001 | 6.2% | 3.7%(+2.44)#343 | 3.5%(+2.67)#5,352 |
| 23. | 90002 | 6.1% | 3.7%(+2.38)#351 | 3.5%(+2.61)#5,473 |
| 24. | 90023 | 5.8% | 3.7%(+2.12)#383 | 3.5%(+2.36)#5,972 |
| 25. | 90040 | 5.8% | 3.7%(+2.05)#391 | 3.5%(+2.28)#6,127 |
| 26. | 90020 | 5.6% | 3.7%(+1.84)#417 | 3.5%(+2.07)#6,562 |
| 27. | 90059 | 5.5% | 3.7%(+1.81)#419 | 3.5%(+2.04)#6,651 |
| 28. | 90017 | 5.4% | 3.7%(+1.65)#439 | 3.5%(+1.89)#7,011 |
| 29. | 90008 | 5.4% | 3.7%(+1.64)#440 | 3.5%(+1.88)#7,025 |
| 30. | 90022 | 5.1% | 3.7%(+1.34)#483 | 3.5%(+1.57)#7,815 |
| 31. | 90042 | 4.9% | 3.7%(+1.18)#503 | 3.5%(+1.42)#8,229 |
| 32. | 90026 | 4.6% | 3.7%(+0.920)#545 | 3.5%(+1.15)#9,019 |
| 33. | 90032 | 4.3% | 3.7%(+0.533)#610 | 3.5%(+0.768)#10,351 |
| 34. | 90028 | 4.1% | 3.7%(+0.425)#623 | 3.5%(+0.660)#10,769 |
| 35. | 90014 | 4.0% | 3.7%(+0.329)#640 | 3.5%(+0.564)#11,157 |
| 36. | 90013 | 4.0% | 3.7%(+0.328)#641 | 3.5%(+0.563)#11,163 |
| 37. | 90047 | 4.0% | 3.7%(+0.299)#645 | 3.5%(+0.534)#11,276 |
| 38. | 90067 | 3.9% | 3.7%(+0.155)#676 | 3.5%(+0.390)#11,829 |
| 39. | 90021 | 3.8% | 3.7%(+0.049)#701 | 3.5%(+0.284)#12,300 |
| 40. | 90015 | 3.3% | 3.7%(-0.394)#771 | 3.5%(-0.159)#14,240 |
| 41. | 90043 | 3.1% | 3.7%(-0.601)#813 | 3.5%(-0.366)#15,282 |
| 42. | 90065 | 3.1% | 3.7%(-0.634)#827 | 3.5%(-0.399)#15,445 |
| 43. | 90039 | 2.9% | 3.7%(-0.799)#870 | 3.5%(-0.564)#16,312 |
| 44. | 90041 | 2.9% | 3.7%(-0.864)#881 | 3.5%(-0.629)#16,665 |
| 45. | 90066 | 2.8% | 3.7%(-0.948)#904 | 3.5%(-0.713)#17,085 |
| 46. | 90034 | 2.7% | 3.7%(-0.993)#918 | 3.5%(-0.758)#17,319 |
| 47. | 90010 | 1.9% | 3.7%(-1.82)#1,114 | 3.5%(-1.58)#21,555 |
| 48. | 90012 | 1.7% | 3.7%(-2.07)#1,162 | 3.5%(-1.83)#22,774 |
| 49. | 90025 | 1.6% | 3.7%(-2.08)#1,166 | 3.5%(-1.85)#22,868 |
| 50. | 90027 | 1.3% | 3.7%(-2.37)#1,237 | 3.5%(-2.13)#24,172 |
| 51. | 90064 | 1.1% | 3.7%(-2.65)#1,301 | 3.5%(-2.42)#25,266 |
| 52. | 90035 | 0.93% | 3.7%(-2.79)#1,327 | 3.5%(-2.56)#25,743 |
| 53. | 90024 | 0.91% | 3.7%(-2.81)#1,332 | 3.5%(-2.57)#25,803 |
| 54. | 90045 | 0.82% | 3.7%(-2.90)#1,348 | 3.5%(-2.66)#26,108 |
| 55. | 90068 | 0.69% | 3.7%(-3.03)#1,385 | 3.5%(-2.80)#26,496 |
| 56. | 90077 | 0.62% | 3.7%(-3.09)#1,399 | 3.5%(-2.86)#26,663 |
| 57. | 90046 | 0.51% | 3.7%(-3.20)#1,424 | 3.5%(-2.97)#26,958 |
| 58. | 90036 | 0.45% | 3.7%(-3.27)#1,443 | 3.5%(-3.04)#27,108 |
| 59. | 90048 | 0.44% | 3.7%(-3.28)#1,446 | 3.5%(-3.05)#27,130 |
| 60. | 90049 | 0.40% | 3.7%(-3.32)#1,451 | 3.5%(-3.08)#27,201 |
| 61. | 90056 | 0.26% | 3.7%(-3.46)#1,469 | 3.5%(-3.22)#27,416 |
1
Common Questions
What are the Top 10 Zip Codes with the Highest Percentage of Population Employed in Cleaning & Maintenance in Los Angeles, CA?
Top 10 Zip Codes with the Highest Percentage of Population Employed in Cleaning & Maintenance in Los Angeles, CA are:
What zip code has the Highest Percentage of Population Employed in Cleaning & Maintenance in Los Angeles, CA?
90073 has the Highest Percentage of Population Employed in Cleaning & Maintenance in Los Angeles, CA with 13.1%.
What is the Percentage of Population Employed in Cleaning & Maintenance in Los Angeles, CA?
Percentage of Population Employed in Cleaning & Maintenance in Los Angeles is 4.9%.
What is the Percentage of Population Employed in Cleaning & Maintenance in California?
Percentage of Population Employed in Cleaning & Maintenance in California is 3.7%.
What is the Percentage of Population Employed in Cleaning & Maintenance in the United States?
Percentage of Population Employed in Cleaning & Maintenance in the United States is 3.5%.