Zip Codes with the Highest Percentage of Population Employed in Security & Protection in Texas
RELATED REPORTS & OPTIONS
Security & Protection
Texas
Compare Zip Codes
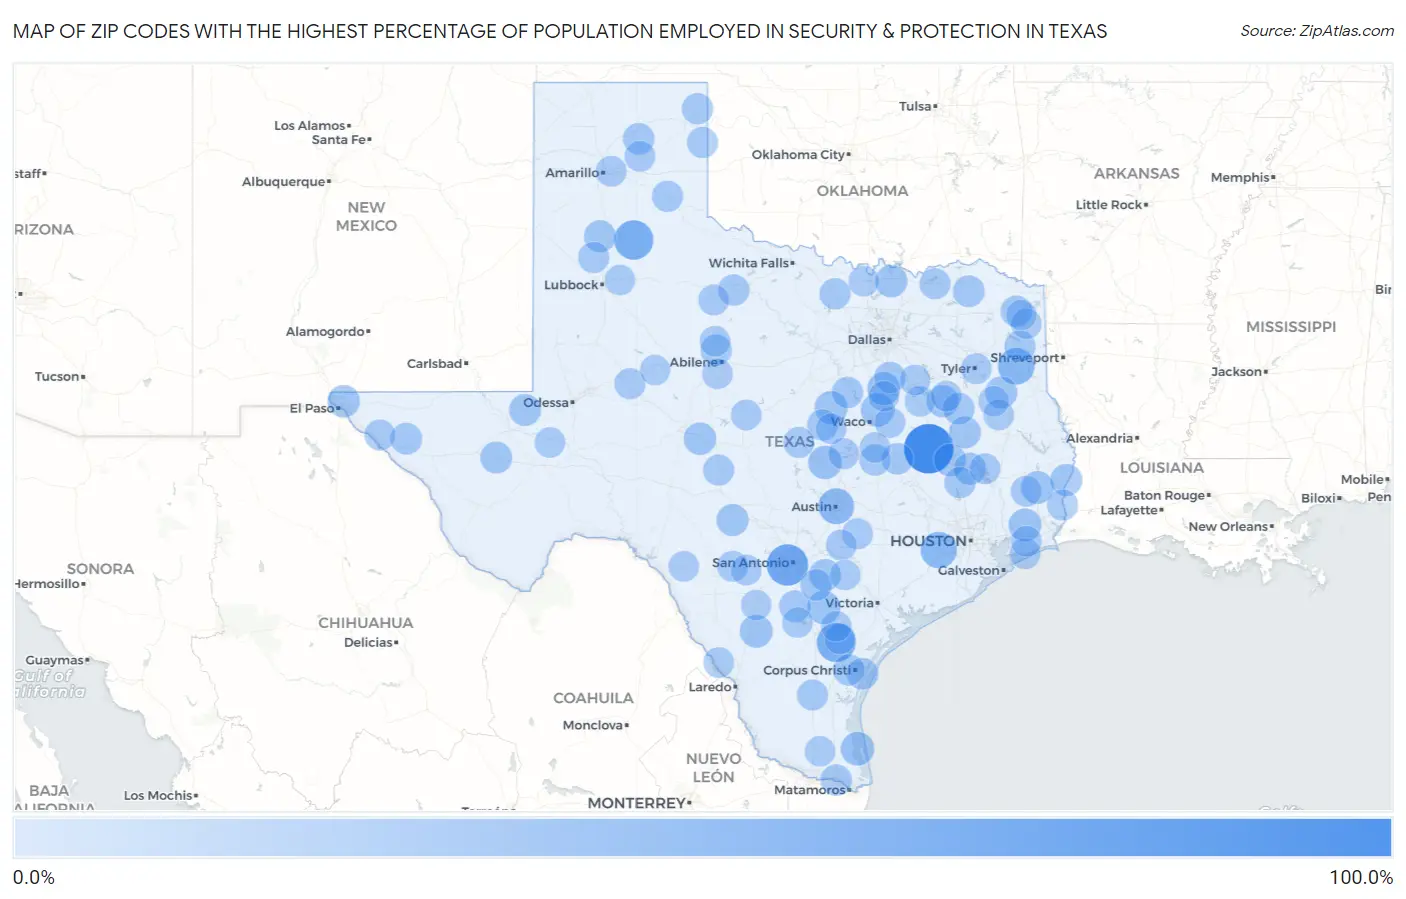
Map of Zip Codes with the Highest Percentage of Population Employed in Security & Protection in Texas
0.0%
100.0%
Zip Codes with the Highest Percentage of Population Employed in Security & Protection in Texas
| Zip Code | % Employed | vs State | vs National | |
| 1. | 77855 | 100.0% | 2.2%(+97.8)#1 | 2.1%(+97.9)#9 |
| 2. | 78243 | 60.0% | 2.2%(+57.8)#2 | 2.1%(+57.9)#26 |
| 3. | 79258 | 50.0% | 2.2%(+47.8)#3 | 2.1%(+47.9)#40 |
| 4. | 78391 | 48.7% | 2.2%(+46.5)#4 | 2.1%(+46.5)#41 |
| 5. | 75641 | 36.8% | 2.2%(+34.6)#5 | 2.1%(+34.7)#62 |
| 6. | 77464 | 35.6% | 2.2%(+33.4)#6 | 2.1%(+33.5)#70 |
| 7. | 78712 | 33.3% | 2.2%(+31.1)#7 | 2.1%(+31.2)#79 |
| 8. | 78598 | 22.2% | 2.2%(+20.0)#8 | 2.1%(+20.1)#166 |
| 9. | 78608 | 22.1% | 2.2%(+19.8)#9 | 2.1%(+19.9)#169 |
| 10. | 76654 | 21.7% | 2.2%(+19.5)#10 | 2.1%(+19.6)#172 |
| 11. | 78119 | 21.6% | 2.2%(+19.4)#11 | 2.1%(+19.4)#177 |
| 12. | 76637 | 19.8% | 2.2%(+17.5)#12 | 2.1%(+17.6)#203 |
| 13. | 78014 | 19.5% | 2.2%(+17.3)#13 | 2.1%(+17.4)#207 |
| 14. | 77629 | 19.4% | 2.2%(+17.2)#14 | 2.1%(+17.3)#210 |
| 15. | 76666 | 19.4% | 2.2%(+17.2)#15 | 2.1%(+17.3)#212 |
| 16. | 77616 | 18.9% | 2.2%(+16.6)#16 | 2.1%(+16.7)#226 |
| 17. | 76955 | 17.6% | 2.2%(+15.4)#17 | 2.1%(+15.5)#263 |
| 18. | 75852 | 17.2% | 2.2%(+14.9)#18 | 2.1%(+15.0)#282 |
| 19. | 79916 | 16.8% | 2.2%(+14.6)#19 | 2.1%(+14.7)#289 |
| 20. | 76268 | 16.7% | 2.2%(+14.4)#20 | 2.1%(+14.5)#292 |
| 21. | 75667 | 16.0% | 2.2%(+13.8)#21 | 2.1%(+13.9)#317 |
| 22. | 78058 | 15.9% | 2.2%(+13.7)#22 | 2.1%(+13.8)#322 |
| 23. | 77367 | 15.8% | 2.2%(+13.6)#23 | 2.1%(+13.7)#327 |
| 24. | 75928 | 15.4% | 2.2%(+13.2)#24 | 2.1%(+13.2)#343 |
| 25. | 79032 | 15.1% | 2.2%(+12.9)#25 | 2.1%(+12.9)#358 |
| 26. | 79789 | 15.0% | 2.2%(+12.8)#26 | 2.1%(+12.9)#360 |
| 27. | 75861 | 14.7% | 2.2%(+12.5)#27 | 2.1%(+12.5)#377 |
| 28. | 79718 | 14.6% | 2.2%(+12.4)#28 | 2.1%(+12.5)#384 |
| 29. | 75849 | 14.6% | 2.2%(+12.4)#29 | 2.1%(+12.4)#385 |
| 30. | 78160 | 14.4% | 2.2%(+12.2)#30 | 2.1%(+12.3)#392 |
| 31. | 75468 | 14.3% | 2.2%(+12.1)#31 | 2.1%(+12.2)#396 |
| 32. | 75801 | 14.3% | 2.2%(+12.1)#32 | 2.1%(+12.2)#397 |
| 33. | 79851 | 14.1% | 2.2%(+11.8)#33 | 2.1%(+11.9)#412 |
| 34. | 78012 | 14.0% | 2.2%(+11.8)#34 | 2.1%(+11.9)#416 |
| 35. | 78419 | 13.4% | 2.2%(+11.2)#35 | 2.1%(+11.3)#449 |
| 36. | 77837 | 13.3% | 2.2%(+11.1)#36 | 2.1%(+11.1)#463 |
| 37. | 79080 | 13.0% | 2.2%(+10.8)#37 | 2.1%(+10.9)#475 |
| 38. | 76623 | 12.9% | 2.2%(+10.6)#38 | 2.1%(+10.7)#483 |
| 39. | 78147 | 12.7% | 2.2%(+10.5)#39 | 2.1%(+10.6)#492 |
| 40. | 76671 | 12.7% | 2.2%(+10.5)#40 | 2.1%(+10.6)#493 |
| 41. | 76519 | 12.3% | 2.2%(+10.1)#41 | 2.1%(+10.2)#525 |
| 42. | 78406 | 12.2% | 2.2%(+10.0)#42 | 2.1%(+10.1)#531 |
| 43. | 76363 | 12.2% | 2.2%(+9.97)#43 | 2.1%(+10.0)#534 |
| 44. | 78567 | 12.1% | 2.2%(+9.83)#44 | 2.1%(+9.91)#549 |
| 45. | 75568 | 12.0% | 2.2%(+9.81)#45 | 2.1%(+9.88)#550 |
| 46. | 79525 | 11.9% | 2.2%(+9.67)#46 | 2.1%(+9.75)#559 |
| 47. | 77340 | 11.8% | 2.2%(+9.63)#47 | 2.1%(+9.70)#563 |
| 48. | 79046 | 11.7% | 2.2%(+9.45)#48 | 2.1%(+9.53)#581 |
| 49. | 75651 | 11.6% | 2.2%(+9.34)#49 | 2.1%(+9.42)#589 |
| 50. | 76566 | 11.4% | 2.2%(+9.20)#50 | 2.1%(+9.28)#610 |
| 51. | 79237 | 11.4% | 2.2%(+9.17)#51 | 2.1%(+9.25)#615 |
| 52. | 79021 | 11.1% | 2.2%(+8.89)#52 | 2.1%(+8.96)#638 |
| 53. | 76270 | 11.0% | 2.2%(+8.81)#53 | 2.1%(+8.89)#646 |
| 54. | 79003 | 10.9% | 2.2%(+8.71)#54 | 2.1%(+8.79)#653 |
| 55. | 78375 | 10.9% | 2.2%(+8.71)#55 | 2.1%(+8.79)#654 |
| 56. | 76859 | 10.8% | 2.2%(+8.62)#56 | 2.1%(+8.70)#659 |
| 57. | 75492 | 10.8% | 2.2%(+8.57)#57 | 2.1%(+8.64)#667 |
| 58. | 79839 | 10.7% | 2.2%(+8.45)#58 | 2.1%(+8.53)#680 |
| 59. | 79733 | 10.7% | 2.2%(+8.45)#59 | 2.1%(+8.53)#681 |
| 60. | 76853 | 10.5% | 2.2%(+8.32)#60 | 2.1%(+8.39)#698 |
| 61. | 77614 | 10.5% | 2.2%(+8.27)#61 | 2.1%(+8.35)#703 |
| 62. | 76559 | 10.3% | 2.2%(+8.07)#62 | 2.1%(+8.15)#731 |
| 63. | 77663 | 10.2% | 2.2%(+8.01)#63 | 2.1%(+8.09)#739 |
| 64. | 78953 | 10.2% | 2.2%(+7.98)#64 | 2.1%(+8.05)#745 |
| 65. | 77623 | 10.1% | 2.2%(+7.92)#65 | 2.1%(+7.99)#750 |
| 66. | 77360 | 9.9% | 2.2%(+7.71)#66 | 2.1%(+7.79)#775 |
| 67. | 79539 | 9.9% | 2.2%(+7.65)#67 | 2.1%(+7.73)#784 |
| 68. | 79111 | 9.8% | 2.2%(+7.62)#68 | 2.1%(+7.70)#787 |
| 69. | 78881 | 9.8% | 2.2%(+7.57)#69 | 2.1%(+7.65)#796 |
| 70. | 78648 | 9.5% | 2.2%(+7.28)#70 | 2.1%(+7.36)#838 |
| 71. | 76528 | 9.5% | 2.2%(+7.24)#71 | 2.1%(+7.31)#846 |
| 72. | 79097 | 9.5% | 2.2%(+7.23)#72 | 2.1%(+7.30)#848 |
| 73. | 78850 | 9.3% | 2.2%(+7.07)#73 | 2.1%(+7.15)#863 |
| 74. | 76878 | 9.3% | 2.2%(+7.04)#74 | 2.1%(+7.11)#868 |
| 75. | 75711 | 9.3% | 2.2%(+7.04)#75 | 2.1%(+7.11)#870 |
| 76. | 77665 | 9.2% | 2.2%(+6.93)#76 | 2.1%(+7.01)#882 |
| 77. | 78389 | 9.0% | 2.2%(+6.83)#77 | 2.1%(+6.90)#903 |
| 78. | 76664 | 9.0% | 2.2%(+6.76)#78 | 2.1%(+6.83)#918 |
| 79. | 75563 | 8.8% | 2.2%(+6.60)#79 | 2.1%(+6.68)#946 |
| 80. | 76660 | 8.8% | 2.2%(+6.54)#80 | 2.1%(+6.61)#960 |
| 81. | 79743 | 8.7% | 2.2%(+6.47)#81 | 2.1%(+6.55)#968 |
| 82. | 78832 | 8.7% | 2.2%(+6.45)#82 | 2.1%(+6.53)#971 |
| 83. | 76250 | 8.6% | 2.2%(+6.42)#83 | 2.1%(+6.50)#976 |
| 84. | 75859 | 8.6% | 2.2%(+6.38)#84 | 2.1%(+6.45)#983 |
| 85. | 75853 | 8.6% | 2.2%(+6.33)#85 | 2.1%(+6.40)#998 |
| 86. | 75943 | 8.5% | 2.2%(+6.30)#86 | 2.1%(+6.38)#1,002 |
| 87. | 78007 | 8.5% | 2.2%(+6.29)#87 | 2.1%(+6.36)#1,006 |
| 88. | 79501 | 8.5% | 2.2%(+6.25)#88 | 2.1%(+6.32)#1,016 |
| 89. | 78159 | 8.5% | 2.2%(+6.24)#89 | 2.1%(+6.32)#1,018 |
| 90. | 78102 | 8.5% | 2.2%(+6.24)#90 | 2.1%(+6.31)#1,020 |
| 91. | 75784 | 8.5% | 2.2%(+6.24)#91 | 2.1%(+6.31)#1,022 |
| 92. | 78045 | 8.4% | 2.2%(+6.16)#92 | 2.1%(+6.24)#1,043 |
| 93. | 79508 | 8.4% | 2.2%(+6.15)#93 | 2.1%(+6.23)#1,049 |
| 94. | 79512 | 8.3% | 2.2%(+6.12)#94 | 2.1%(+6.19)#1,058 |
| 95. | 75566 | 8.3% | 2.2%(+6.11)#95 | 2.1%(+6.18)#1,061 |
| 96. | 79343 | 8.3% | 2.2%(+6.08)#96 | 2.1%(+6.15)#1,076 |
| 97. | 75153 | 8.2% | 2.2%(+5.93)#97 | 2.1%(+6.01)#1,109 |
| 98. | 78017 | 8.1% | 2.2%(+5.91)#98 | 2.1%(+5.99)#1,119 |
| 99. | 78549 | 8.0% | 2.2%(+5.81)#99 | 2.1%(+5.88)#1,156 |
| 100. | 76656 | 8.0% | 2.2%(+5.76)#100 | 2.1%(+5.83)#1,176 |
Common Questions
What are the Top 10 Zip Codes with the Highest Percentage of Population Employed in Security & Protection in Texas?
Top 10 Zip Codes with the Highest Percentage of Population Employed in Security & Protection in Texas are:
What zip code has the Highest Percentage of Population Employed in Security & Protection in Texas?
77855 has the Highest Percentage of Population Employed in Security & Protection in Texas with 100.0%.
What is the Percentage of Population Employed in Security & Protection in the State of Texas?
Percentage of Population Employed in Security & Protection in Texas is 2.2%.
What is the Percentage of Population Employed in Security & Protection in the United States?
Percentage of Population Employed in Security & Protection in the United States is 2.1%.