Zip Codes with the Highest Percentage of Population Employed in Security & Protection in New Hampshire
RELATED REPORTS & OPTIONS
Security & Protection
New Hampshire
Compare Zip Codes
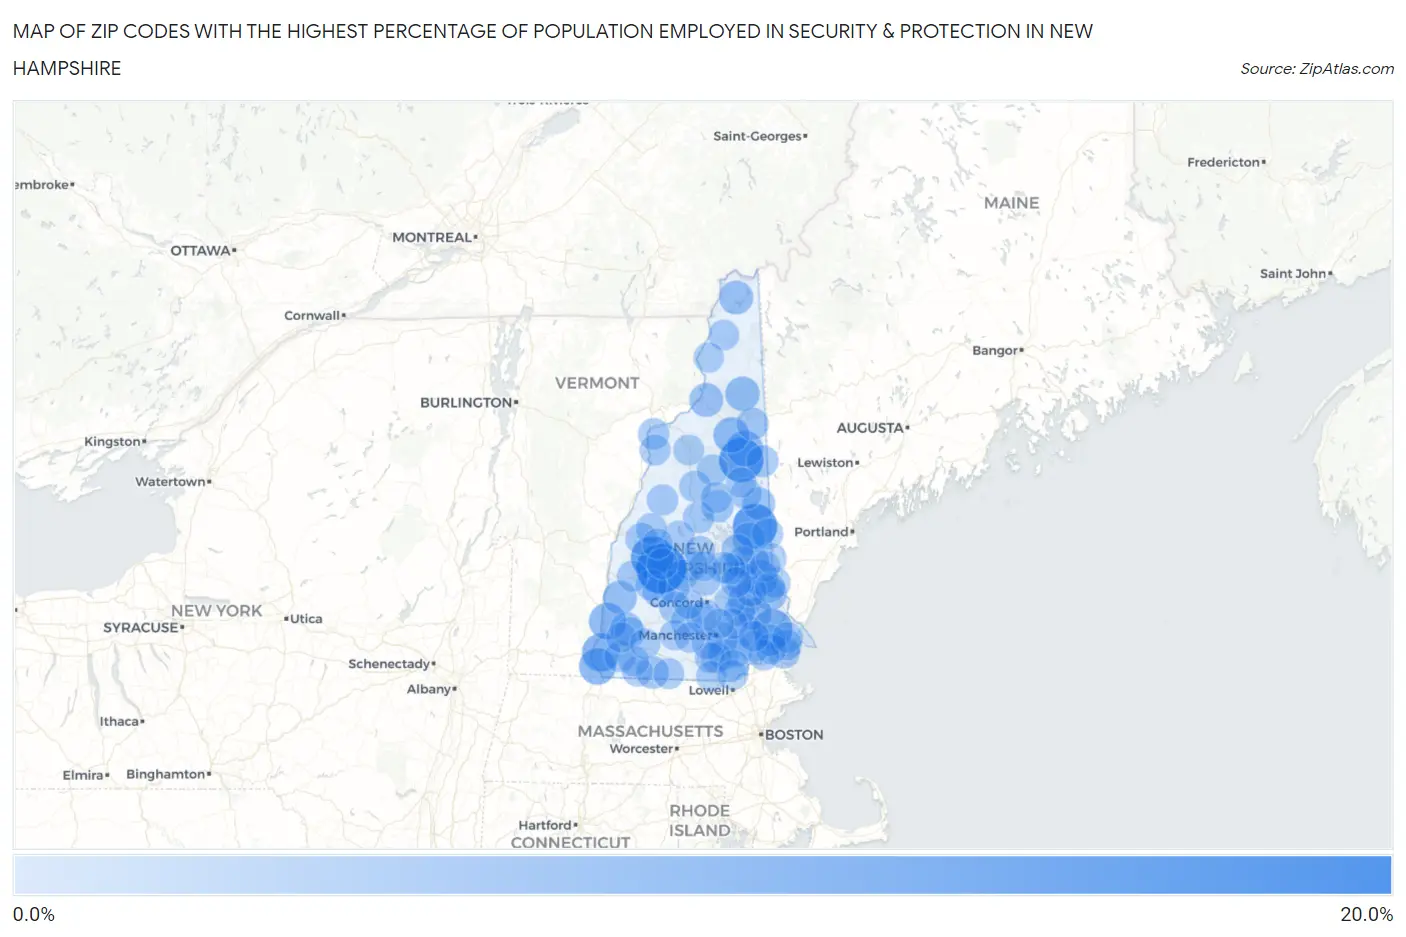
Map of Zip Codes with the Highest Percentage of Population Employed in Security & Protection in New Hampshire
0.0%
20.0%
Zip Codes with the Highest Percentage of Population Employed in Security & Protection in New Hampshire
| Zip Code | % Employed | vs State | vs National | |
| 1. | 03233 | 19.7% | 1.6%(+18.1)#1 | 2.1%(+17.6)#204 |
| 2. | 03864 | 14.8% | 1.6%(+13.2)#2 | 2.1%(+12.6)#372 |
| 3. | 03838 | 14.7% | 1.6%(+13.1)#3 | 2.1%(+12.6)#376 |
| 4. | 03284 | 13.5% | 1.6%(+11.9)#4 | 2.1%(+11.4)#444 |
| 5. | 03856 | 10.2% | 1.6%(+8.59)#5 | 2.1%(+8.07)#742 |
| 6. | 03443 | 8.8% | 1.6%(+7.17)#6 | 2.1%(+6.64)#953 |
| 7. | 03608 | 7.7% | 1.6%(+6.04)#7 | 2.1%(+5.52)#1,275 |
| 8. | 03451 | 7.5% | 1.6%(+5.92)#8 | 2.1%(+5.39)#1,317 |
| 9. | 03846 | 7.0% | 1.6%(+5.40)#9 | 2.1%(+4.87)#1,521 |
| 10. | 03593 | 6.5% | 1.6%(+4.90)#10 | 2.1%(+4.37)#1,778 |
| 11. | 03835 | 5.9% | 1.6%(+4.30)#11 | 2.1%(+3.77)#2,132 |
| 12. | 03570 | 5.4% | 1.6%(+3.78)#12 | 2.1%(+3.26)#2,538 |
| 13. | 03592 | 4.9% | 1.6%(+3.31)#13 | 2.1%(+2.79)#3,002 |
| 14. | 03584 | 4.9% | 1.6%(+3.25)#14 | 2.1%(+2.72)#3,077 |
| 15. | 03601 | 4.8% | 1.6%(+3.17)#15 | 2.1%(+2.64)#3,185 |
| 16. | 03261 | 4.8% | 1.6%(+3.15)#16 | 2.1%(+2.62)#3,209 |
| 17. | 03839 | 4.7% | 1.6%(+3.07)#17 | 2.1%(+2.54)#3,319 |
| 18. | 03290 | 4.7% | 1.6%(+3.03)#18 | 2.1%(+2.51)#3,361 |
| 19. | 03855 | 4.2% | 1.6%(+2.59)#19 | 2.1%(+2.06)#4,108 |
| 20. | 03448 | 4.0% | 1.6%(+2.39)#20 | 2.1%(+1.86)#4,475 |
| 21. | 03836 | 3.9% | 1.6%(+2.30)#21 | 2.1%(+1.78)#4,635 |
| 22. | 03077 | 3.9% | 1.6%(+2.24)#22 | 2.1%(+1.71)#4,782 |
| 23. | 03225 | 3.7% | 1.6%(+2.04)#23 | 2.1%(+1.51)#5,253 |
| 24. | 03461 | 3.7% | 1.6%(+2.03)#24 | 2.1%(+1.51)#5,256 |
| 25. | 03894 | 3.7% | 1.6%(+2.03)#25 | 2.1%(+1.50)#5,268 |
| 26. | 03109 | 3.6% | 1.6%(+2.02)#26 | 2.1%(+1.50)#5,295 |
| 27. | 03809 | 3.5% | 1.6%(+1.87)#27 | 2.1%(+1.34)#5,699 |
| 28. | 03581 | 3.4% | 1.6%(+1.76)#28 | 2.1%(+1.24)#5,987 |
| 29. | 03874 | 3.4% | 1.6%(+1.74)#29 | 2.1%(+1.21)#6,059 |
| 30. | 03227 | 3.3% | 1.6%(+1.66)#30 | 2.1%(+1.14)#6,289 |
| 31. | 03221 | 3.2% | 1.6%(+1.55)#31 | 2.1%(+1.03)#6,612 |
| 32. | 03810 | 3.0% | 1.6%(+1.40)#32 | 2.1%(+0.869)#7,155 |
| 33. | 03813 | 3.0% | 1.6%(+1.33)#33 | 2.1%(+0.806)#7,409 |
| 34. | 03278 | 2.8% | 1.6%(+1.22)#34 | 2.1%(+0.698)#7,884 |
| 35. | 03053 | 2.8% | 1.6%(+1.15)#35 | 2.1%(+0.629)#8,216 |
| 36. | 03245 | 2.7% | 1.6%(+1.11)#36 | 2.1%(+0.583)#8,397 |
| 37. | 03748 | 2.7% | 1.6%(+1.10)#37 | 2.1%(+0.571)#8,442 |
| 38. | 03038 | 2.7% | 1.6%(+1.05)#38 | 2.1%(+0.529)#8,645 |
| 39. | 03242 | 2.7% | 1.6%(+1.05)#39 | 2.1%(+0.526)#8,656 |
| 40. | 03285 | 2.7% | 1.6%(+1.04)#40 | 2.1%(+0.517)#8,694 |
| 41. | 03837 | 2.6% | 1.6%(+0.953)#41 | 2.1%(+0.427)#9,129 |
| 42. | 03819 | 2.6% | 1.6%(+0.935)#42 | 2.1%(+0.409)#9,216 |
| 43. | 03237 | 2.6% | 1.6%(+0.934)#43 | 2.1%(+0.408)#9,218 |
| 44. | 03255 | 2.5% | 1.6%(+0.902)#44 | 2.1%(+0.376)#9,388 |
| 45. | 03235 | 2.5% | 1.6%(+0.872)#45 | 2.1%(+0.346)#9,539 |
| 46. | 03268 | 2.5% | 1.6%(+0.867)#46 | 2.1%(+0.341)#9,569 |
| 47. | 03215 | 2.5% | 1.6%(+0.857)#47 | 2.1%(+0.331)#9,623 |
| 48. | 03875 | 2.5% | 1.6%(+0.830)#48 | 2.1%(+0.304)#9,768 |
| 49. | 03282 | 2.5% | 1.6%(+0.830)#49 | 2.1%(+0.304)#9,769 |
| 50. | 03842 | 2.4% | 1.6%(+0.821)#50 | 2.1%(+0.295)#9,828 |
| 51. | 03224 | 2.4% | 1.6%(+0.811)#51 | 2.1%(+0.285)#9,880 |
| 52. | 03446 | 2.4% | 1.6%(+0.807)#52 | 2.1%(+0.281)#9,901 |
| 53. | 03771 | 2.4% | 1.6%(+0.803)#53 | 2.1%(+0.277)#9,925 |
| 54. | 03830 | 2.4% | 1.6%(+0.800)#54 | 2.1%(+0.274)#9,944 |
| 55. | 03833 | 2.4% | 1.6%(+0.776)#55 | 2.1%(+0.250)#10,061 |
| 56. | 03281 | 2.3% | 1.6%(+0.723)#56 | 2.1%(+0.197)#10,349 |
| 57. | 03259 | 2.3% | 1.6%(+0.703)#57 | 2.1%(+0.177)#10,494 |
| 58. | 03287 | 2.3% | 1.6%(+0.670)#58 | 2.1%(+0.144)#10,688 |
| 59. | 03773 | 2.3% | 1.6%(+0.666)#59 | 2.1%(+0.140)#10,716 |
| 60. | 03037 | 2.3% | 1.6%(+0.664)#60 | 2.1%(+0.138)#10,730 |
| 61. | 03827 | 2.2% | 1.6%(+0.628)#61 | 2.1%(+0.102)#10,946 |
| 62. | 03222 | 2.2% | 1.6%(+0.617)#62 | 2.1%(+0.091)#11,017 |
| 63. | 03740 | 2.2% | 1.6%(+0.600)#63 | 2.1%(+0.074)#11,118 |
| 64. | 03269 | 2.2% | 1.6%(+0.559)#64 | 2.1%(+0.033)#11,360 |
| 65. | 03071 | 2.2% | 1.6%(+0.548)#65 | 2.1%(+0.022)#11,447 |
| 66. | 03234 | 2.2% | 1.6%(+0.543)#66 | 2.1%(+0.017)#11,484 |
| 67. | 03052 | 2.2% | 1.6%(+0.537)#67 | 2.1%(+0.011)#11,506 |
| 68. | 03858 | 2.1% | 1.6%(+0.489)#68 | 2.1%(-0.037)#11,832 |
| 69. | 03868 | 2.1% | 1.6%(+0.482)#69 | 2.1%(-0.044)#11,877 |
| 70. | 03741 | 2.1% | 1.6%(+0.469)#70 | 2.1%(-0.057)#11,967 |
| 71. | 03862 | 2.0% | 1.6%(+0.416)#71 | 2.1%(-0.110)#12,325 |
| 72. | 03580 | 2.0% | 1.6%(+0.374)#72 | 2.1%(-0.152)#12,578 |
| 73. | 03576 | 2.0% | 1.6%(+0.373)#73 | 2.1%(-0.153)#12,589 |
| 74. | 03445 | 1.9% | 1.6%(+0.319)#74 | 2.1%(-0.207)#12,940 |
| 75. | 03046 | 1.9% | 1.6%(+0.313)#75 | 2.1%(-0.213)#12,977 |
| 76. | 03034 | 1.9% | 1.6%(+0.304)#76 | 2.1%(-0.222)#13,042 |
| 77. | 03447 | 1.9% | 1.6%(+0.282)#77 | 2.1%(-0.244)#13,190 |
| 78. | 03110 | 1.9% | 1.6%(+0.269)#78 | 2.1%(-0.257)#13,285 |
| 79. | 03044 | 1.9% | 1.6%(+0.268)#79 | 2.1%(-0.258)#13,293 |
| 80. | 03884 | 1.9% | 1.6%(+0.250)#80 | 2.1%(-0.276)#13,426 |
| 81. | 03465 | 1.8% | 1.6%(+0.218)#81 | 2.1%(-0.308)#13,635 |
| 82. | 03851 | 1.8% | 1.6%(+0.202)#82 | 2.1%(-0.324)#13,748 |
| 83. | 03240 | 1.8% | 1.6%(+0.202)#83 | 2.1%(-0.324)#13,750 |
| 84. | 03054 | 1.8% | 1.6%(+0.145)#84 | 2.1%(-0.381)#14,174 |
| 85. | 03304 | 1.8% | 1.6%(+0.134)#85 | 2.1%(-0.392)#14,255 |
| 86. | 03218 | 1.8% | 1.6%(+0.134)#86 | 2.1%(-0.392)#14,257 |
| 87. | 03043 | 1.7% | 1.6%(+0.124)#87 | 2.1%(-0.402)#14,331 |
| 88. | 03852 | 1.7% | 1.6%(+0.117)#88 | 2.1%(-0.409)#14,398 |
| 89. | 03070 | 1.7% | 1.6%(+0.104)#89 | 2.1%(-0.422)#14,482 |
| 90. | 03818 | 1.7% | 1.6%(+0.099)#90 | 2.1%(-0.427)#14,516 |
| 91. | 03062 | 1.7% | 1.6%(+0.088)#91 | 2.1%(-0.438)#14,601 |
| 92. | 03590 | 1.7% | 1.6%(+0.080)#92 | 2.1%(-0.446)#14,672 |
| 93. | 03106 | 1.7% | 1.6%(+0.077)#93 | 2.1%(-0.449)#14,684 |
| 94. | 03087 | 1.7% | 1.6%(+0.058)#94 | 2.1%(-0.468)#14,821 |
| 95. | 03431 | 1.7% | 1.6%(+0.031)#95 | 2.1%(-0.495)#15,008 |
| 96. | 03229 | 1.6% | 1.6%(+0.015)#96 | 2.1%(-0.511)#15,135 |
| 97. | 03076 | 1.6% | 1.6%(-0.052)#97 | 2.1%(-0.578)#15,638 |
| 98. | 03450 | 1.5% | 1.6%(-0.101)#98 | 2.1%(-0.627)#16,018 |
| 99. | 03867 | 1.5% | 1.6%(-0.114)#99 | 2.1%(-0.640)#16,125 |
| 100. | 03276 | 1.5% | 1.6%(-0.118)#100 | 2.1%(-0.644)#16,153 |
Common Questions
What are the Top 10 Zip Codes with the Highest Percentage of Population Employed in Security & Protection in New Hampshire?
Top 10 Zip Codes with the Highest Percentage of Population Employed in Security & Protection in New Hampshire are:
What zip code has the Highest Percentage of Population Employed in Security & Protection in New Hampshire?
03233 has the Highest Percentage of Population Employed in Security & Protection in New Hampshire with 19.7%.
What is the Percentage of Population Employed in Security & Protection in the State of New Hampshire?
Percentage of Population Employed in Security & Protection in New Hampshire is 1.6%.
What is the Percentage of Population Employed in Security & Protection in the United States?
Percentage of Population Employed in Security & Protection in the United States is 2.1%.