Zip Codes with the Highest Percentage of Population Employed in Arts, Entertainment & Recreation in Los Angeles, CA
RELATED REPORTS & OPTIONS
Arts, Entertainment & Recreation
Los Angeles
Compare Zip Codes
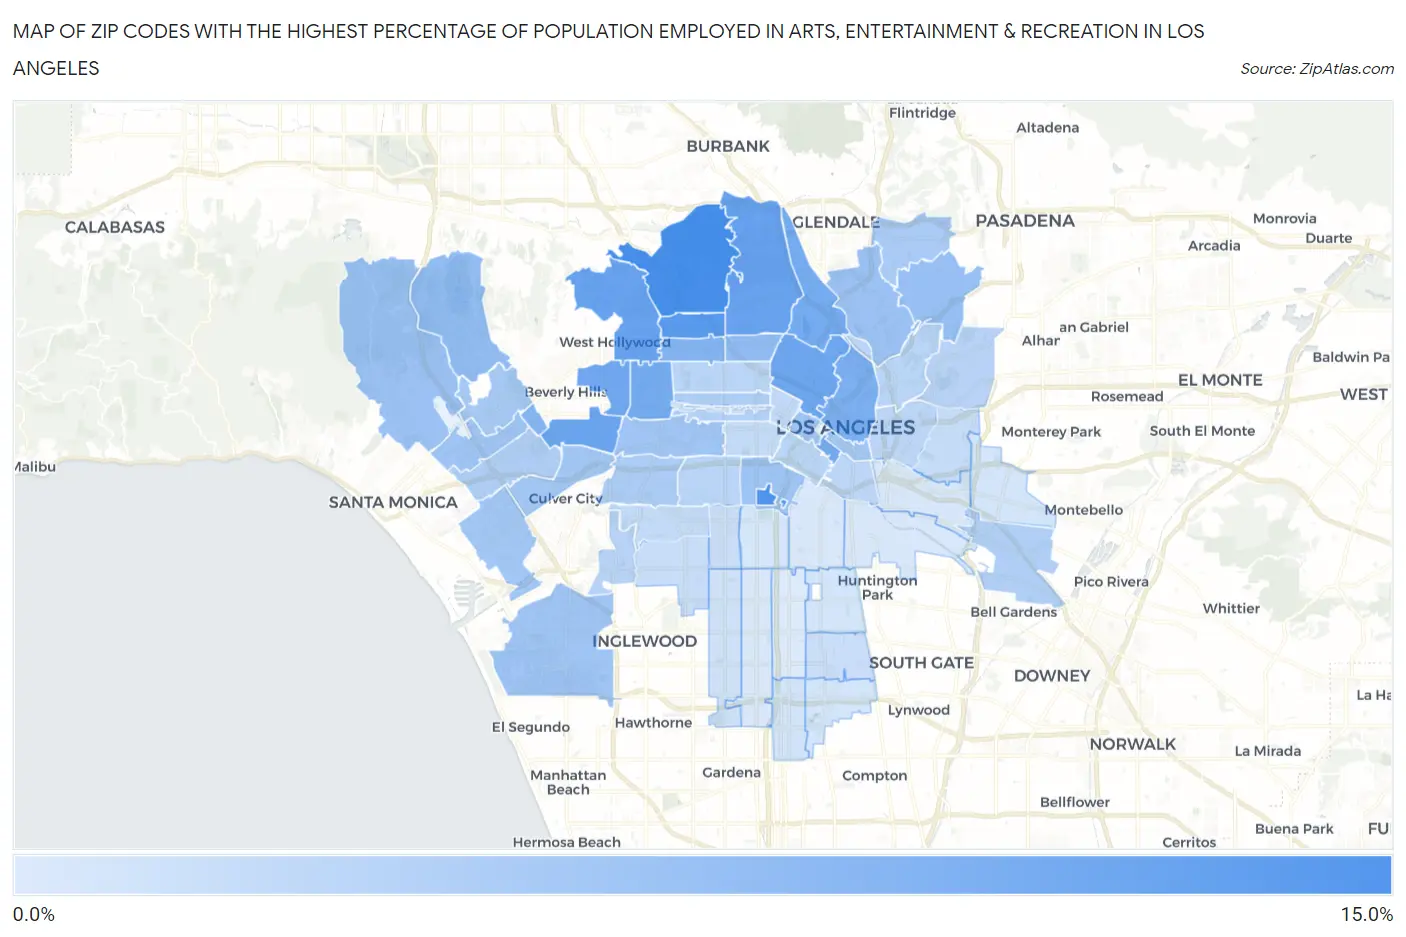
Map of Zip Codes with the Highest Percentage of Population Employed in Arts, Entertainment & Recreation in Los Angeles
0.88%
11.1%
Zip Codes with the Highest Percentage of Population Employed in Arts, Entertainment & Recreation in Los Angeles, CA
| Zip Code | % Employed | vs State | vs National | |
| 1. | 90068 | 11.1% | 2.6%(+8.50)#54 | 2.1%(+8.97)#597 |
| 2. | 90089 | 10.6% | 2.6%(+8.05)#58 | 2.1%(+8.52)#638 |
| 3. | 90028 | 9.9% | 2.6%(+7.37)#66 | 2.1%(+7.84)#713 |
| 4. | 90046 | 8.8% | 2.6%(+6.28)#83 | 2.1%(+6.75)#880 |
| 5. | 90027 | 8.8% | 2.6%(+6.21)#85 | 2.1%(+6.68)#900 |
| 6. | 90035 | 8.4% | 2.6%(+5.87)#93 | 2.1%(+6.34)#963 |
| 7. | 90026 | 8.3% | 2.6%(+5.78)#94 | 2.1%(+6.25)#982 |
| 8. | 90048 | 8.1% | 2.6%(+5.52)#100 | 2.1%(+6.00)#1,039 |
| 9. | 90014 | 8.1% | 2.6%(+5.50)#101 | 2.1%(+5.97)#1,047 |
| 10. | 90039 | 7.8% | 2.6%(+5.29)#103 | 2.1%(+5.76)#1,099 |
| 11. | 90036 | 7.8% | 2.6%(+5.23)#104 | 2.1%(+5.70)#1,111 |
| 12. | 90012 | 7.4% | 2.6%(+4.86)#111 | 2.1%(+5.33)#1,199 |
| 13. | 90038 | 6.9% | 2.6%(+4.37)#124 | 2.1%(+4.84)#1,356 |
| 14. | 90067 | 6.7% | 2.6%(+4.16)#132 | 2.1%(+4.63)#1,412 |
| 15. | 90029 | 5.9% | 2.6%(+3.36)#161 | 2.1%(+3.83)#1,742 |
| 16. | 90077 | 5.8% | 2.6%(+3.23)#168 | 2.1%(+3.70)#1,815 |
| 17. | 90042 | 5.4% | 2.6%(+2.86)#187 | 2.1%(+3.33)#2,014 |
| 18. | 90049 | 5.3% | 2.6%(+2.72)#198 | 2.1%(+3.19)#2,096 |
| 19. | 90065 | 5.2% | 2.6%(+2.62)#208 | 2.1%(+3.10)#2,169 |
| 20. | 90017 | 5.1% | 2.6%(+2.50)#215 | 2.1%(+2.98)#2,245 |
| 21. | 90007 | 5.0% | 2.6%(+2.48)#216 | 2.1%(+2.95)#2,264 |
| 22. | 90045 | 4.9% | 2.6%(+2.35)#224 | 2.1%(+2.82)#2,358 |
| 23. | 90019 | 4.9% | 2.6%(+2.32)#226 | 2.1%(+2.79)#2,382 |
| 24. | 90025 | 4.8% | 2.6%(+2.29)#231 | 2.1%(+2.76)#2,404 |
| 25. | 90013 | 4.7% | 2.6%(+2.13)#249 | 2.1%(+2.60)#2,546 |
| 26. | 90034 | 4.7% | 2.6%(+2.11)#251 | 2.1%(+2.58)#2,559 |
| 27. | 90066 | 4.6% | 2.6%(+2.08)#257 | 2.1%(+2.55)#2,601 |
| 28. | 90024 | 4.3% | 2.6%(+1.75)#285 | 2.1%(+2.22)#2,959 |
| 29. | 90041 | 4.3% | 2.6%(+1.71)#288 | 2.1%(+2.18)#3,000 |
| 30. | 90016 | 4.0% | 2.6%(+1.44)#325 | 2.1%(+1.91)#3,354 |
| 31. | 90020 | 4.0% | 2.6%(+1.40)#332 | 2.1%(+1.87)#3,393 |
| 32. | 90064 | 3.9% | 2.6%(+1.38)#335 | 2.1%(+1.86)#3,422 |
| 33. | 90040 | 3.8% | 2.6%(+1.23)#363 | 2.1%(+1.70)#3,658 |
| 34. | 90005 | 3.6% | 2.6%(+1.07)#391 | 2.1%(+1.54)#3,909 |
| 35. | 90032 | 3.3% | 2.6%(+0.780)#450 | 2.1%(+1.25)#4,497 |
| 36. | 90056 | 3.3% | 2.6%(+0.778)#451 | 2.1%(+1.25)#4,510 |
| 37. | 90015 | 3.2% | 2.6%(+0.658)#469 | 2.1%(+1.13)#4,774 |
| 38. | 90031 | 3.2% | 2.6%(+0.609)#481 | 2.1%(+1.08)#4,896 |
| 39. | 90018 | 3.1% | 2.6%(+0.593)#484 | 2.1%(+1.06)#4,931 |
| 40. | 90004 | 3.1% | 2.6%(+0.544)#496 | 2.1%(+1.02)#5,074 |
| 41. | 90021 | 3.0% | 2.6%(+0.474)#514 | 2.1%(+0.946)#5,278 |
| 42. | 90033 | 2.9% | 2.6%(+0.378)#541 | 2.1%(+0.849)#5,564 |
| 43. | 90057 | 2.6% | 2.6%(+0.088)#620 | 2.1%(+0.559)#6,606 |
| 44. | 90006 | 2.6% | 2.6%(+0.016)#650 | 2.1%(+0.487)#6,876 |
| 45. | 90008 | 2.6% | 2.6%(+0.015)#651 | 2.1%(+0.487)#6,877 |
| 46. | 90063 | 2.4% | 2.6%(-0.151)#727 | 2.1%(+0.321)#7,639 |
| 47. | 90043 | 2.2% | 2.6%(-0.359)#827 | 2.1%(+0.112)#8,671 |
| 48. | 90062 | 2.1% | 2.6%(-0.430)#861 | 2.1%(+0.041)#9,077 |
| 49. | 90002 | 2.1% | 2.6%(-0.484)#889 | 2.1%(-0.012)#9,366 |
| 50. | 90010 | 1.9% | 2.6%(-0.655)#960 | 2.1%(-0.184)#10,389 |
| 51. | 90047 | 1.8% | 2.6%(-0.780)#1,013 | 2.1%(-0.308)#11,202 |
| 52. | 90061 | 1.7% | 2.6%(-0.896)#1,060 | 2.1%(-0.425)#12,035 |
| 53. | 90001 | 1.5% | 2.6%(-1.07)#1,140 | 2.1%(-0.596)#13,321 |
| 54. | 90022 | 1.5% | 2.6%(-1.10)#1,149 | 2.1%(-0.631)#13,588 |
| 55. | 90059 | 1.4% | 2.6%(-1.14)#1,162 | 2.1%(-0.673)#13,911 |
| 56. | 90037 | 1.3% | 2.6%(-1.25)#1,202 | 2.1%(-0.781)#14,709 |
| 57. | 90044 | 1.3% | 2.6%(-1.30)#1,215 | 2.1%(-0.832)#15,096 |
| 58. | 90023 | 1.2% | 2.6%(-1.34)#1,229 | 2.1%(-0.873)#15,397 |
| 59. | 90011 | 1.2% | 2.6%(-1.35)#1,235 | 2.1%(-0.883)#15,483 |
| 60. | 90058 | 1.1% | 2.6%(-1.44)#1,266 | 2.1%(-0.966)#16,121 |
| 61. | 90003 | 0.88% | 2.6%(-1.67)#1,315 | 2.1%(-1.20)#17,803 |
1
Common Questions
What are the Top 10 Zip Codes with the Highest Percentage of Population Employed in Arts, Entertainment & Recreation in Los Angeles, CA?
Top 10 Zip Codes with the Highest Percentage of Population Employed in Arts, Entertainment & Recreation in Los Angeles, CA are:
What zip code has the Highest Percentage of Population Employed in Arts, Entertainment & Recreation in Los Angeles, CA?
90068 has the Highest Percentage of Population Employed in Arts, Entertainment & Recreation in Los Angeles, CA with 11.1%.
What is the Percentage of Population Employed in Arts, Entertainment & Recreation in Los Angeles, CA?
Percentage of Population Employed in Arts, Entertainment & Recreation in Los Angeles is 4.1%.
What is the Percentage of Population Employed in Arts, Entertainment & Recreation in California?
Percentage of Population Employed in Arts, Entertainment & Recreation in California is 2.6%.
What is the Percentage of Population Employed in Arts, Entertainment & Recreation in the United States?
Percentage of Population Employed in Arts, Entertainment & Recreation in the United States is 2.1%.