Zip Codes with the Highest Percentage of Population Employed in Security & Protection in North Carolina
RELATED REPORTS & OPTIONS
Security & Protection
North Carolina
Compare Zip Codes
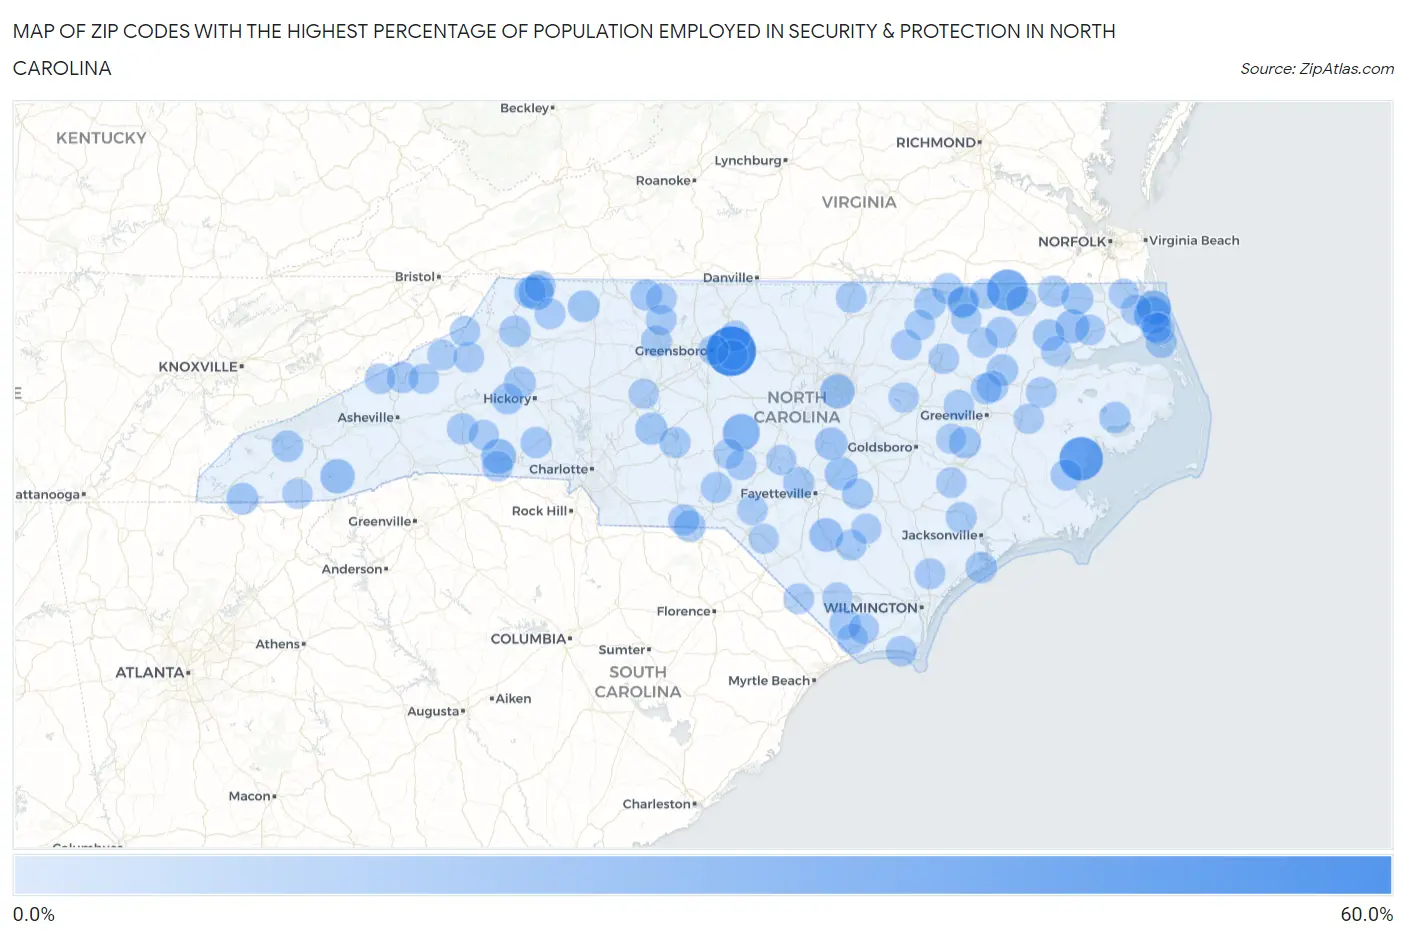
Map of Zip Codes with the Highest Percentage of Population Employed in Security & Protection in North Carolina
0.0%
60.0%
Zip Codes with the Highest Percentage of Population Employed in Security & Protection in North Carolina
| Zip Code | % Employed | vs State | vs National | |
| 1. | 27342 | 50.9% | 1.9%(+49.0)#1 | 2.1%(+48.8)#33 |
| 2. | 28552 | 35.9% | 1.9%(+34.0)#2 | 2.1%(+33.7)#67 |
| 3. | 27862 | 29.6% | 1.9%(+27.7)#3 | 2.1%(+27.4)#98 |
| 4. | 27259 | 20.0% | 1.9%(+18.1)#4 | 2.1%(+17.9)#194 |
| 5. | 27916 | 19.7% | 1.9%(+17.8)#5 | 2.1%(+17.5)#205 |
| 6. | 28672 | 15.6% | 1.9%(+13.7)#6 | 2.1%(+13.4)#337 |
| 7. | 28089 | 15.0% | 1.9%(+13.1)#7 | 2.1%(+12.9)#363 |
| 8. | 28736 | 14.0% | 1.9%(+12.1)#8 | 2.1%(+11.9)#418 |
| 9. | 27695 | 14.0% | 1.9%(+12.1)#9 | 2.1%(+11.9)#420 |
| 10. | 27923 | 13.8% | 1.9%(+11.9)#10 | 2.1%(+11.6)#430 |
| 11. | 28392 | 12.4% | 1.9%(+10.5)#11 | 2.1%(+10.3)#517 |
| 12. | 27980 | 12.2% | 1.9%(+10.3)#12 | 2.1%(+10.0)#533 |
| 13. | 28342 | 11.1% | 1.9%(+9.22)#13 | 2.1%(+8.96)#636 |
| 14. | 27506 | 10.0% | 1.9%(+8.11)#14 | 2.1%(+7.85)#763 |
| 15. | 27947 | 8.4% | 1.9%(+6.51)#15 | 2.1%(+6.26)#1,036 |
| 16. | 28071 | 8.4% | 1.9%(+6.49)#16 | 2.1%(+6.24)#1,042 |
| 17. | 28538 | 7.9% | 1.9%(+5.99)#17 | 2.1%(+5.73)#1,208 |
| 18. | 28909 | 7.9% | 1.9%(+5.99)#18 | 2.1%(+5.73)#1,209 |
| 19. | 28617 | 7.8% | 1.9%(+5.88)#19 | 2.1%(+5.63)#1,250 |
| 20. | 28683 | 7.7% | 1.9%(+5.80)#20 | 2.1%(+5.54)#1,266 |
| 21. | 27979 | 7.6% | 1.9%(+5.69)#21 | 2.1%(+5.44)#1,302 |
| 22. | 27924 | 7.5% | 1.9%(+5.65)#22 | 2.1%(+5.40)#1,314 |
| 23. | 28638 | 7.4% | 1.9%(+5.47)#23 | 2.1%(+5.22)#1,376 |
| 24. | 28713 | 7.3% | 1.9%(+5.42)#24 | 2.1%(+5.17)#1,394 |
| 25. | 28460 | 7.3% | 1.9%(+5.40)#25 | 2.1%(+5.15)#1,399 |
| 26. | 27937 | 7.2% | 1.9%(+5.28)#26 | 2.1%(+5.03)#1,454 |
| 27. | 27840 | 7.1% | 1.9%(+5.25)#27 | 2.1%(+4.99)#1,475 |
| 28. | 28618 | 7.1% | 1.9%(+5.17)#28 | 2.1%(+4.92)#1,506 |
| 29. | 27826 | 7.0% | 1.9%(+5.08)#29 | 2.1%(+4.83)#1,541 |
| 30. | 28102 | 7.0% | 1.9%(+5.08)#30 | 2.1%(+4.83)#1,545 |
| 31. | 27861 | 7.0% | 1.9%(+5.08)#31 | 2.1%(+4.83)#1,546 |
| 32. | 28455 | 6.9% | 1.9%(+5.03)#32 | 2.1%(+4.77)#1,569 |
| 33. | 27053 | 6.9% | 1.9%(+5.02)#33 | 2.1%(+4.76)#1,574 |
| 34. | 28033 | 6.9% | 1.9%(+5.00)#34 | 2.1%(+4.74)#1,587 |
| 35. | 27850 | 6.9% | 1.9%(+4.97)#35 | 2.1%(+4.72)#1,601 |
| 36. | 28310 | 6.9% | 1.9%(+4.96)#36 | 2.1%(+4.70)#1,607 |
| 37. | 28119 | 6.8% | 1.9%(+4.90)#37 | 2.1%(+4.64)#1,632 |
| 38. | 28690 | 6.7% | 1.9%(+4.82)#38 | 2.1%(+4.57)#1,678 |
| 39. | 28587 | 6.7% | 1.9%(+4.77)#39 | 2.1%(+4.52)#1,709 |
| 40. | 27832 | 6.6% | 1.9%(+4.68)#40 | 2.1%(+4.43)#1,751 |
| 41. | 27812 | 6.6% | 1.9%(+4.68)#41 | 2.1%(+4.42)#1,758 |
| 42. | 28754 | 6.6% | 1.9%(+4.66)#42 | 2.1%(+4.41)#1,766 |
| 43. | 28167 | 6.5% | 1.9%(+4.57)#43 | 2.1%(+4.32)#1,801 |
| 44. | 27872 | 6.5% | 1.9%(+4.56)#44 | 2.1%(+4.30)#1,805 |
| 45. | 28663 | 6.3% | 1.9%(+4.46)#45 | 2.1%(+4.20)#1,865 |
| 46. | 27831 | 6.3% | 1.9%(+4.39)#46 | 2.1%(+4.14)#1,906 |
| 47. | 28385 | 6.2% | 1.9%(+4.29)#47 | 2.1%(+4.04)#1,962 |
| 48. | 28009 | 6.2% | 1.9%(+4.27)#48 | 2.1%(+4.01)#1,976 |
| 49. | 27109 | 6.0% | 1.9%(+4.14)#49 | 2.1%(+3.88)#2,059 |
| 50. | 27966 | 6.0% | 1.9%(+4.12)#50 | 2.1%(+3.87)#2,069 |
| 51. | 28574 | 5.9% | 1.9%(+4.04)#51 | 2.1%(+3.79)#2,123 |
| 52. | 28337 | 5.9% | 1.9%(+3.99)#52 | 2.1%(+3.73)#2,164 |
| 53. | 27582 | 5.8% | 1.9%(+3.93)#53 | 2.1%(+3.67)#2,195 |
| 54. | 28338 | 5.8% | 1.9%(+3.92)#54 | 2.1%(+3.67)#2,198 |
| 55. | 28017 | 5.6% | 1.9%(+3.75)#55 | 2.1%(+3.50)#2,330 |
| 56. | 27973 | 5.6% | 1.9%(+3.73)#56 | 2.1%(+3.47)#2,355 |
| 57. | 27890 | 5.6% | 1.9%(+3.73)#57 | 2.1%(+3.47)#2,356 |
| 58. | 27016 | 5.6% | 1.9%(+3.72)#58 | 2.1%(+3.47)#2,360 |
| 59. | 28457 | 5.6% | 1.9%(+3.70)#59 | 2.1%(+3.45)#2,375 |
| 60. | 27846 | 5.6% | 1.9%(+3.69)#60 | 2.1%(+3.43)#2,386 |
| 61. | 27019 | 5.4% | 1.9%(+3.46)#61 | 2.1%(+3.20)#2,582 |
| 62. | 28452 | 5.4% | 1.9%(+3.46)#62 | 2.1%(+3.20)#2,583 |
| 63. | 27809 | 5.3% | 1.9%(+3.44)#63 | 2.1%(+3.18)#2,605 |
| 64. | 28657 | 5.3% | 1.9%(+3.43)#64 | 2.1%(+3.17)#2,616 |
| 65. | 28465 | 5.3% | 1.9%(+3.42)#65 | 2.1%(+3.16)#2,632 |
| 66. | 28649 | 5.3% | 1.9%(+3.39)#66 | 2.1%(+3.13)#2,648 |
| 67. | 28439 | 5.1% | 1.9%(+3.23)#67 | 2.1%(+2.97)#2,793 |
| 68. | 28753 | 5.1% | 1.9%(+3.20)#68 | 2.1%(+2.95)#2,814 |
| 69. | 27816 | 4.9% | 1.9%(+3.04)#69 | 2.1%(+2.78)#3,010 |
| 70. | 27249 | 4.9% | 1.9%(+3.03)#70 | 2.1%(+2.77)#3,020 |
| 71. | 27985 | 4.9% | 1.9%(+3.02)#71 | 2.1%(+2.77)#3,026 |
| 72. | 28420 | 4.9% | 1.9%(+3.00)#72 | 2.1%(+2.75)#3,048 |
| 73. | 27939 | 4.9% | 1.9%(+3.00)#73 | 2.1%(+2.75)#3,056 |
| 74. | 27376 | 4.9% | 1.9%(+2.99)#74 | 2.1%(+2.74)#3,064 |
| 75. | 28714 | 4.8% | 1.9%(+2.95)#75 | 2.1%(+2.69)#3,120 |
| 76. | 27880 | 4.8% | 1.9%(+2.89)#76 | 2.1%(+2.63)#3,193 |
| 77. | 27839 | 4.8% | 1.9%(+2.86)#77 | 2.1%(+2.61)#3,232 |
| 78. | 27855 | 4.7% | 1.9%(+2.84)#78 | 2.1%(+2.58)#3,258 |
| 79. | 28525 | 4.7% | 1.9%(+2.83)#79 | 2.1%(+2.58)#3,264 |
| 80. | 28705 | 4.7% | 1.9%(+2.81)#80 | 2.1%(+2.56)#3,294 |
| 81. | 27957 | 4.6% | 1.9%(+2.72)#81 | 2.1%(+2.47)#3,410 |
| 82. | 27242 | 4.6% | 1.9%(+2.72)#82 | 2.1%(+2.47)#3,411 |
| 83. | 27874 | 4.6% | 1.9%(+2.71)#83 | 2.1%(+2.45)#3,439 |
| 84. | 28622 | 4.6% | 1.9%(+2.71)#84 | 2.1%(+2.45)#3,445 |
| 85. | 27377 | 4.6% | 1.9%(+2.71)#85 | 2.1%(+2.45)#3,446 |
| 86. | 27844 | 4.6% | 1.9%(+2.67)#86 | 2.1%(+2.42)#3,496 |
| 87. | 27889 | 4.5% | 1.9%(+2.65)#87 | 2.1%(+2.40)#3,539 |
| 88. | 28441 | 4.5% | 1.9%(+2.65)#88 | 2.1%(+2.39)#3,546 |
| 89. | 28396 | 4.5% | 1.9%(+2.57)#89 | 2.1%(+2.32)#3,658 |
| 90. | 27876 | 4.4% | 1.9%(+2.49)#90 | 2.1%(+2.23)#3,807 |
| 91. | 28763 | 4.4% | 1.9%(+2.48)#91 | 2.1%(+2.23)#3,815 |
| 92. | 28326 | 4.4% | 1.9%(+2.47)#92 | 2.1%(+2.22)#3,829 |
| 93. | 27829 | 4.3% | 1.9%(+2.44)#93 | 2.1%(+2.18)#3,892 |
| 94. | 27411 | 4.3% | 1.9%(+2.43)#94 | 2.1%(+2.18)#3,895 |
| 95. | 28364 | 4.3% | 1.9%(+2.43)#95 | 2.1%(+2.18)#3,899 |
| 96. | 28018 | 4.3% | 1.9%(+2.42)#96 | 2.1%(+2.17)#3,911 |
| 97. | 27299 | 4.3% | 1.9%(+2.40)#97 | 2.1%(+2.15)#3,961 |
| 98. | 28472 | 4.3% | 1.9%(+2.39)#98 | 2.1%(+2.13)#3,980 |
| 99. | 27958 | 4.3% | 1.9%(+2.37)#99 | 2.1%(+2.12)#3,998 |
| 100. | 28580 | 4.3% | 1.9%(+2.37)#100 | 2.1%(+2.11)#4,000 |
Common Questions
What are the Top 10 Zip Codes with the Highest Percentage of Population Employed in Security & Protection in North Carolina?
Top 10 Zip Codes with the Highest Percentage of Population Employed in Security & Protection in North Carolina are:
What zip code has the Highest Percentage of Population Employed in Security & Protection in North Carolina?
27342 has the Highest Percentage of Population Employed in Security & Protection in North Carolina with 50.9%.
What is the Percentage of Population Employed in Security & Protection in the State of North Carolina?
Percentage of Population Employed in Security & Protection in North Carolina is 1.9%.
What is the Percentage of Population Employed in Security & Protection in the United States?
Percentage of Population Employed in Security & Protection in the United States is 2.1%.