Zip Codes with the Highest Percentage of Households with Income Below $10,000 in Los Angeles, CA
RELATED REPORTS & OPTIONS
Household Income | $0-10k
Los Angeles
Compare Zip Codes
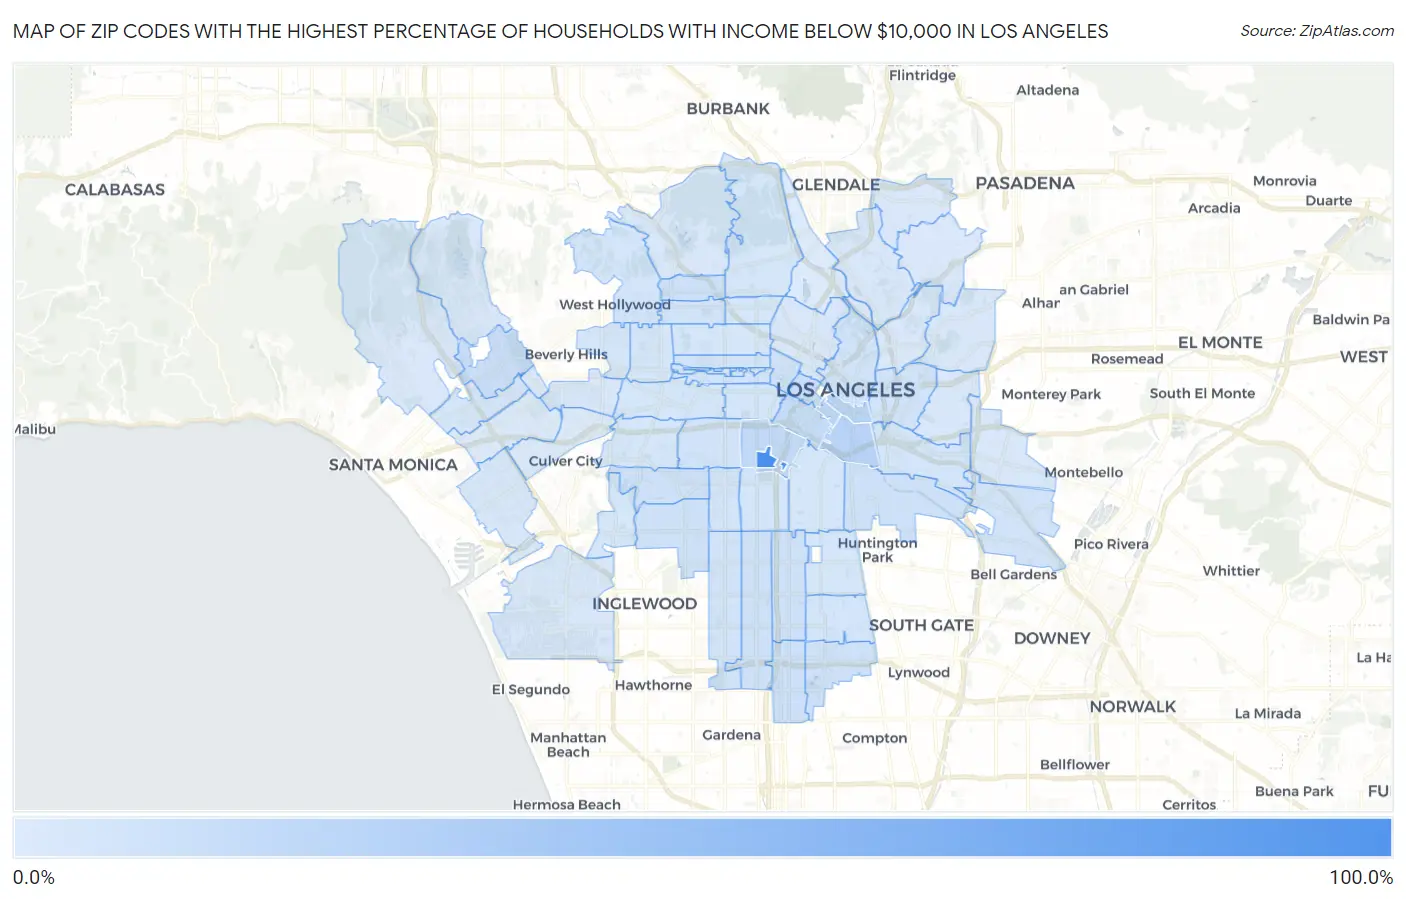
Map of Zip Codes with the Highest Percentage of Households with Income Below $10,000 in Los Angeles
2.7%
100.0%
Zip Codes with the Highest Percentage of Households with Income Below $10,000 in Los Angeles, CA
| Zip Code | Households with Income < $10k | vs State | vs National | |
| 1. | 90089 | 100.0% | 4.4%(+95.6)#1 | 4.9%(+95.1)#5 |
| 2. | 90021 | 20.4% | 4.4%(+16.0)#28 | 4.9%(+15.5)#760 |
| 3. | 90013 | 20.2% | 4.4%(+15.8)#30 | 4.9%(+15.3)#782 |
| 4. | 90014 | 19.2% | 4.4%(+14.8)#37 | 4.9%(+14.3)#880 |
| 5. | 90007 | 15.8% | 4.4%(+11.4)#55 | 4.9%(+10.9)#1,374 |
| 6. | 90015 | 13.6% | 4.4%(+9.20)#71 | 4.9%(+8.70)#1,874 |
| 7. | 90017 | 12.8% | 4.4%(+8.40)#84 | 4.9%(+7.90)#2,153 |
| 8. | 90024 | 11.9% | 4.4%(+7.50)#102 | 4.9%(+7.00)#2,499 |
| 9. | 90028 | 9.8% | 4.4%(+5.40)#154 | 4.9%(+4.90)#3,708 |
| 10. | 90061 | 9.8% | 4.4%(+5.40)#155 | 4.9%(+4.90)#3,710 |
| 11. | 90058 | 9.7% | 4.4%(+5.30)#160 | 4.9%(+4.80)#3,833 |
| 12. | 90057 | 9.6% | 4.4%(+5.20)#162 | 4.9%(+4.70)#3,865 |
| 13. | 90059 | 9.6% | 4.4%(+5.20)#163 | 4.9%(+4.70)#3,868 |
| 14. | 90044 | 9.4% | 4.4%(+5.00)#173 | 4.9%(+4.50)#4,022 |
| 15. | 90043 | 9.3% | 4.4%(+4.90)#176 | 4.9%(+4.40)#4,092 |
| 16. | 90008 | 9.3% | 4.4%(+4.90)#177 | 4.9%(+4.40)#4,096 |
| 17. | 90003 | 9.2% | 4.4%(+4.80)#182 | 4.9%(+4.30)#4,192 |
| 18. | 90020 | 8.6% | 4.4%(+4.20)#212 | 4.9%(+3.70)#4,819 |
| 19. | 90018 | 8.5% | 4.4%(+4.10)#215 | 4.9%(+3.60)#4,914 |
| 20. | 90005 | 8.5% | 4.4%(+4.10)#217 | 4.9%(+3.60)#4,919 |
| 21. | 90040 | 8.0% | 4.4%(+3.60)#247 | 4.9%(+3.10)#5,571 |
| 22. | 90033 | 7.8% | 4.4%(+3.40)#258 | 4.9%(+2.90)#5,796 |
| 23. | 90038 | 7.8% | 4.4%(+3.40)#261 | 4.9%(+2.90)#5,812 |
| 24. | 90047 | 7.7% | 4.4%(+3.30)#268 | 4.9%(+2.80)#5,930 |
| 25. | 90012 | 7.6% | 4.4%(+3.20)#273 | 4.9%(+2.70)#6,058 |
| 26. | 90037 | 7.3% | 4.4%(+2.90)#295 | 4.9%(+2.40)#6,468 |
| 27. | 90062 | 7.0% | 4.4%(+2.60)#322 | 4.9%(+2.10)#6,954 |
| 28. | 90002 | 6.9% | 4.4%(+2.50)#327 | 4.9%(+2.00)#7,098 |
| 29. | 90006 | 6.8% | 4.4%(+2.40)#340 | 4.9%(+1.90)#7,291 |
| 30. | 90046 | 6.8% | 4.4%(+2.40)#341 | 4.9%(+1.90)#7,297 |
| 31. | 90023 | 6.6% | 4.4%(+2.20)#367 | 4.9%(+1.70)#7,705 |
| 32. | 90036 | 6.4% | 4.4%(+2.00)#388 | 4.9%(+1.50)#8,103 |
| 33. | 90029 | 6.4% | 4.4%(+2.00)#389 | 4.9%(+1.50)#8,108 |
| 34. | 90016 | 6.3% | 4.4%(+1.90)#402 | 4.9%(+1.40)#8,296 |
| 35. | 90001 | 6.0% | 4.4%(+1.60)#432 | 4.9%(+1.10)#8,957 |
| 36. | 90027 | 5.9% | 4.4%(+1.50)#445 | 4.9%(+1.00)#9,200 |
| 37. | 90011 | 5.8% | 4.4%(+1.40)#451 | 4.9%(+0.900)#9,431 |
| 38. | 90019 | 5.8% | 4.4%(+1.40)#453 | 4.9%(+0.900)#9,435 |
| 39. | 90004 | 5.8% | 4.4%(+1.40)#454 | 4.9%(+0.900)#9,436 |
| 40. | 90056 | 5.8% | 4.4%(+1.40)#464 | 4.9%(+0.900)#9,549 |
| 41. | 90010 | 5.8% | 4.4%(+1.40)#465 | 4.9%(+0.900)#9,583 |
| 42. | 90048 | 5.7% | 4.4%(+1.30)#477 | 4.9%(+0.800)#9,741 |
| 43. | 90025 | 5.5% | 4.4%(+1.10)#505 | 4.9%(+0.600)#10,199 |
| 44. | 90026 | 5.3% | 4.4%(+0.900)#531 | 4.9%(+0.400)#10,710 |
| 45. | 90022 | 5.3% | 4.4%(+0.900)#532 | 4.9%(+0.400)#10,711 |
| 46. | 90066 | 4.7% | 4.4%(+0.300)#648 | 4.9%(-0.200)#12,615 |
| 47. | 90065 | 4.6% | 4.4%(+0.200)#668 | 4.9%(-0.300)#12,976 |
| 48. | 90032 | 4.6% | 4.4%(+0.200)#669 | 4.9%(-0.300)#12,977 |
| 49. | 90068 | 4.6% | 4.4%(+0.200)#683 | 4.9%(-0.300)#13,054 |
| 50. | 90045 | 4.4% | 4.4%(=0.000)#722 | 4.9%(-0.500)#13,677 |
| 51. | 90063 | 4.3% | 4.4%(-0.100)#743 | 4.9%(-0.600)#14,032 |
| 52. | 90031 | 4.3% | 4.4%(-0.100)#748 | 4.9%(-0.600)#14,061 |
| 53. | 90035 | 4.3% | 4.4%(-0.100)#755 | 4.9%(-0.600)#14,097 |
| 54. | 90067 | 4.2% | 4.4%(-0.200)#789 | 4.9%(-0.700)#14,664 |
| 55. | 90049 | 3.7% | 4.4%(-0.700)#904 | 4.9%(-1.20)#16,407 |
| 56. | 90042 | 3.6% | 4.4%(-0.800)#918 | 4.9%(-1.30)#16,773 |
| 57. | 90077 | 3.6% | 4.4%(-0.800)#942 | 4.9%(-1.30)#16,958 |
| 58. | 90041 | 3.4% | 4.4%(-1.00)#1,009 | 4.9%(-1.50)#17,678 |
| 59. | 90034 | 3.2% | 4.4%(-1.20)#1,059 | 4.9%(-1.70)#18,444 |
| 60. | 90064 | 3.2% | 4.4%(-1.20)#1,075 | 4.9%(-1.70)#18,527 |
| 61. | 90039 | 2.7% | 4.4%(-1.70)#1,219 | 4.9%(-2.20)#20,715 |
1
Common Questions
What are the Top 10 Zip Codes with the Highest Percentage of Households with Income Below $10,000 in Los Angeles, CA?
Top 10 Zip Codes with the Highest Percentage of Households with Income Below $10,000 in Los Angeles, CA are:
What zip code has the Highest Percentage of Households with Income Below $10,000 in Los Angeles, CA?
90089 has the Highest Percentage of Households with Income Below $10,000 in Los Angeles, CA with 100.0%.
What is the Percentage of Households with Income Below $10,000 in Los Angeles, CA?
Percentage of Households with Income Below $10,000 in Los Angeles is 6.2%.
What is the Percentage of Households with Income Below $10,000 in California?
Percentage of Households with Income Below $10,000 in California is 4.4%.
What is the Percentage of Households with Income Below $10,000 in the United States?
Percentage of Households with Income Below $10,000 in the United States is 4.9%.