Zip Codes with the Highest Percentage of Population Employed in Business & Financial in Los Angeles, CA
RELATED REPORTS & OPTIONS
Business & Financial
Los Angeles
Compare Zip Codes
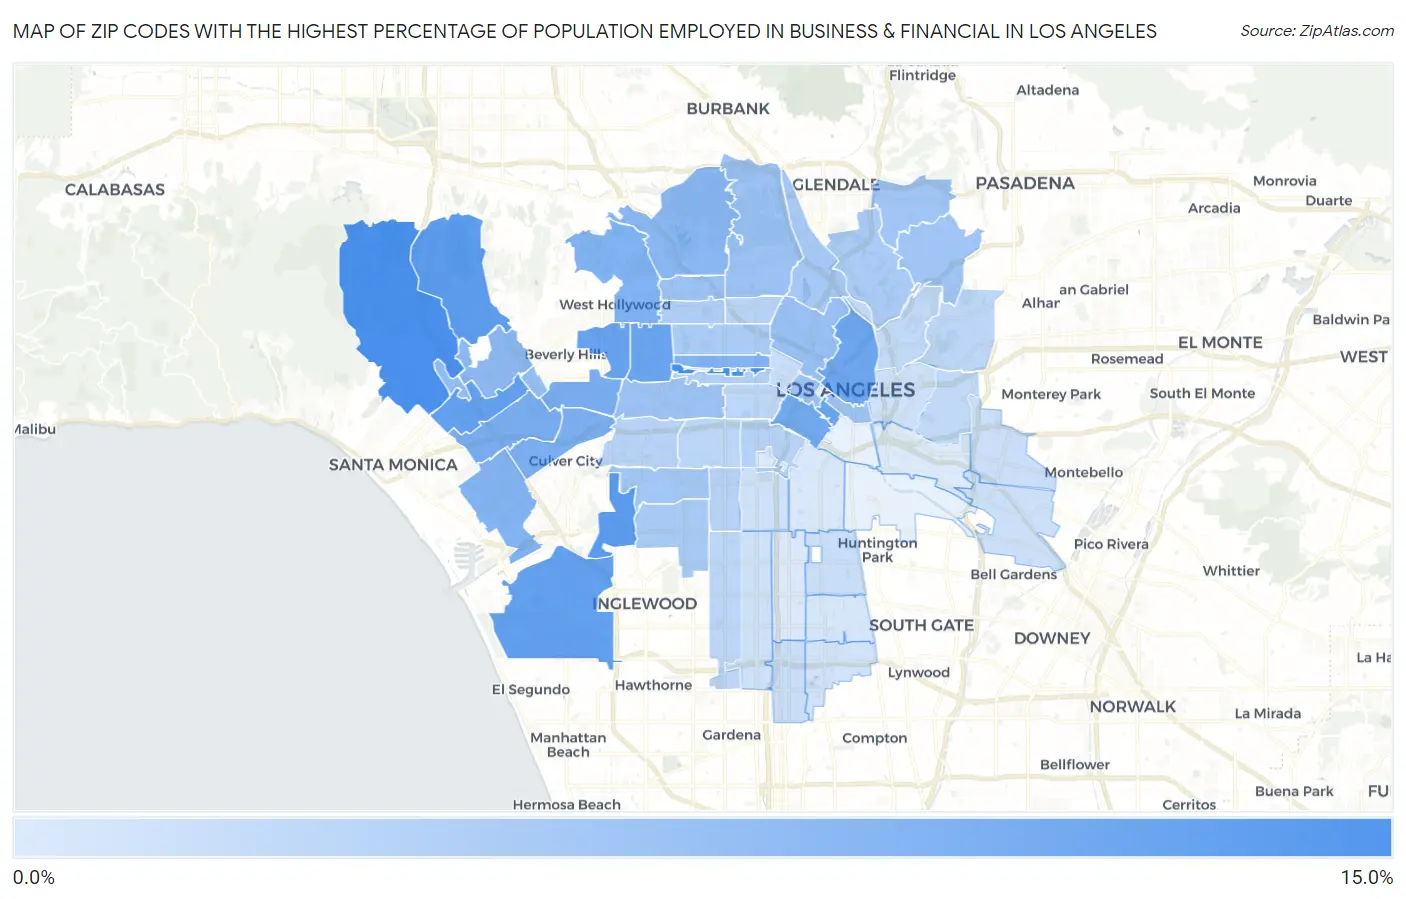
Map of Zip Codes with the Highest Percentage of Population Employed in Business & Financial in Los Angeles
0.95%
13.5%
Zip Codes with the Highest Percentage of Population Employed in Business & Financial in Los Angeles, CA
| Zip Code | % Employed | vs State | vs National | |
| 1. | 90010 | 13.5% | 5.8%(+7.72)#42 | 5.8%(+7.75)#825 |
| 2. | 90049 | 13.3% | 5.8%(+7.47)#48 | 5.8%(+7.50)#880 |
| 3. | 90056 | 11.7% | 5.8%(+5.89)#92 | 5.8%(+5.92)#1,327 |
| 4. | 90077 | 11.5% | 5.8%(+5.66)#101 | 5.8%(+5.70)#1,435 |
| 5. | 90025 | 11.2% | 5.8%(+5.37)#112 | 5.8%(+5.41)#1,566 |
| 6. | 90045 | 11.0% | 5.8%(+5.23)#121 | 5.8%(+5.26)#1,642 |
| 7. | 90048 | 10.8% | 5.8%(+4.96)#134 | 5.8%(+4.99)#1,771 |
| 8. | 90036 | 10.6% | 5.8%(+4.78)#146 | 5.8%(+4.81)#1,859 |
| 9. | 90014 | 10.4% | 5.8%(+4.62)#151 | 5.8%(+4.65)#1,942 |
| 10. | 90012 | 10.2% | 5.8%(+4.38)#161 | 5.8%(+4.41)#2,079 |
| 11. | 90015 | 9.7% | 5.8%(+3.88)#191 | 5.8%(+3.91)#2,461 |
| 12. | 90064 | 9.2% | 5.8%(+3.36)#236 | 5.8%(+3.39)#2,925 |
| 13. | 90035 | 9.1% | 5.8%(+3.28)#243 | 5.8%(+3.32)#3,006 |
| 14. | 90034 | 8.8% | 5.8%(+3.03)#273 | 5.8%(+3.07)#3,265 |
| 15. | 90046 | 8.6% | 5.8%(+2.78)#292 | 5.8%(+2.81)#3,517 |
| 16. | 90020 | 8.5% | 5.8%(+2.74)#295 | 5.8%(+2.78)#3,552 |
| 17. | 90066 | 8.4% | 5.8%(+2.60)#306 | 5.8%(+2.63)#3,727 |
| 18. | 90068 | 7.7% | 5.8%(+1.87)#377 | 5.8%(+1.90)#4,738 |
| 19. | 90024 | 7.5% | 5.8%(+1.71)#396 | 5.8%(+1.74)#4,961 |
| 20. | 90073 | 7.1% | 5.8%(+1.35)#448 | 5.8%(+1.38)#5,564 |
| 21. | 90067 | 6.8% | 5.8%(+1.00)#486 | 5.8%(+1.04)#6,173 |
| 22. | 90026 | 6.7% | 5.8%(+0.857)#505 | 5.8%(+0.891)#6,458 |
| 23. | 90013 | 6.3% | 5.8%(+0.535)#543 | 5.8%(+0.569)#7,094 |
| 24. | 90017 | 6.2% | 5.8%(+0.443)#564 | 5.8%(+0.477)#7,291 |
| 25. | 90027 | 6.1% | 5.8%(+0.353)#581 | 5.8%(+0.387)#7,499 |
| 26. | 90019 | 6.1% | 5.8%(+0.341)#582 | 5.8%(+0.375)#7,526 |
| 27. | 90028 | 6.1% | 5.8%(+0.303)#587 | 5.8%(+0.337)#7,603 |
| 28. | 90041 | 5.8% | 5.8%(+0.039)#631 | 5.8%(+0.074)#8,216 |
| 29. | 90042 | 5.8% | 5.8%(-0.024)#641 | 5.8%(+0.010)#8,356 |
| 30. | 90008 | 5.5% | 5.8%(-0.273)#683 | 5.8%(-0.239)#8,982 |
| 31. | 90039 | 5.4% | 5.8%(-0.370)#695 | 5.8%(-0.335)#9,217 |
| 32. | 90043 | 5.2% | 5.8%(-0.574)#725 | 5.8%(-0.540)#9,789 |
| 33. | 90065 | 5.1% | 5.8%(-0.733)#756 | 5.8%(-0.699)#10,282 |
| 34. | 90004 | 5.1% | 5.8%(-0.735)#758 | 5.8%(-0.701)#10,290 |
| 35. | 90038 | 4.7% | 5.8%(-1.10)#828 | 5.8%(-1.07)#11,436 |
| 36. | 90005 | 4.5% | 5.8%(-1.28)#860 | 5.8%(-1.25)#12,023 |
| 37. | 90007 | 4.2% | 5.8%(-1.63)#911 | 5.8%(-1.59)#13,226 |
| 38. | 90062 | 4.0% | 5.8%(-1.83)#947 | 5.8%(-1.79)#13,952 |
| 39. | 90029 | 3.9% | 5.8%(-1.86)#955 | 5.8%(-1.82)#14,065 |
| 40. | 90016 | 3.9% | 5.8%(-1.91)#968 | 5.8%(-1.87)#14,234 |
| 41. | 90006 | 3.5% | 5.8%(-2.27)#1,042 | 5.8%(-2.24)#15,727 |
| 42. | 90018 | 3.5% | 5.8%(-2.30)#1,049 | 5.8%(-2.27)#15,828 |
| 43. | 90047 | 3.5% | 5.8%(-2.30)#1,051 | 5.8%(-2.27)#15,831 |
| 44. | 90032 | 3.4% | 5.8%(-2.35)#1,072 | 5.8%(-2.32)#16,056 |
| 45. | 90031 | 3.2% | 5.8%(-2.55)#1,111 | 5.8%(-2.51)#16,856 |
| 46. | 90063 | 3.2% | 5.8%(-2.63)#1,124 | 5.8%(-2.60)#17,182 |
| 47. | 90001 | 2.5% | 5.8%(-3.25)#1,221 | 5.8%(-3.22)#19,648 |
| 48. | 90061 | 2.5% | 5.8%(-3.26)#1,224 | 5.8%(-3.23)#19,709 |
| 49. | 90057 | 2.4% | 5.8%(-3.36)#1,239 | 5.8%(-3.33)#20,089 |
| 50. | 90022 | 2.4% | 5.8%(-3.40)#1,244 | 5.8%(-3.37)#20,237 |
| 51. | 90040 | 2.2% | 5.8%(-3.62)#1,279 | 5.8%(-3.59)#21,086 |
| 52. | 90044 | 2.1% | 5.8%(-3.72)#1,295 | 5.8%(-3.68)#21,495 |
| 53. | 90033 | 2.0% | 5.8%(-3.75)#1,304 | 5.8%(-3.72)#21,616 |
| 54. | 90037 | 2.0% | 5.8%(-3.78)#1,307 | 5.8%(-3.75)#21,730 |
| 55. | 90059 | 1.8% | 5.8%(-3.99)#1,331 | 5.8%(-3.96)#22,500 |
| 56. | 90002 | 1.5% | 5.8%(-4.31)#1,360 | 5.8%(-4.28)#23,579 |
| 57. | 90011 | 1.3% | 5.8%(-4.45)#1,384 | 5.8%(-4.41)#24,072 |
| 58. | 90089 | 1.2% | 5.8%(-4.60)#1,400 | 5.8%(-4.56)#24,515 |
| 59. | 90003 | 1.1% | 5.8%(-4.67)#1,406 | 5.8%(-4.64)#24,718 |
| 60. | 90023 | 0.95% | 5.8%(-4.85)#1,420 | 5.8%(-4.82)#25,164 |
1
Common Questions
What are the Top 10 Zip Codes with the Highest Percentage of Population Employed in Business & Financial in Los Angeles, CA?
Top 10 Zip Codes with the Highest Percentage of Population Employed in Business & Financial in Los Angeles, CA are:
What zip code has the Highest Percentage of Population Employed in Business & Financial in Los Angeles, CA?
90010 has the Highest Percentage of Population Employed in Business & Financial in Los Angeles, CA with 13.5%.
What is the Percentage of Population Employed in Business & Financial in Los Angeles, CA?
Percentage of Population Employed in Business & Financial in Los Angeles is 5.7%.
What is the Percentage of Population Employed in Business & Financial in California?
Percentage of Population Employed in Business & Financial in California is 5.8%.
What is the Percentage of Population Employed in Business & Financial in the United States?
Percentage of Population Employed in Business & Financial in the United States is 5.8%.