Zip Codes with the Highest Wage/Income Gap (%) in Los Angeles, CA
RELATED REPORTS & OPTIONS
Highest Wage/Income Gap (%)
Los Angeles
Compare Zip Codes
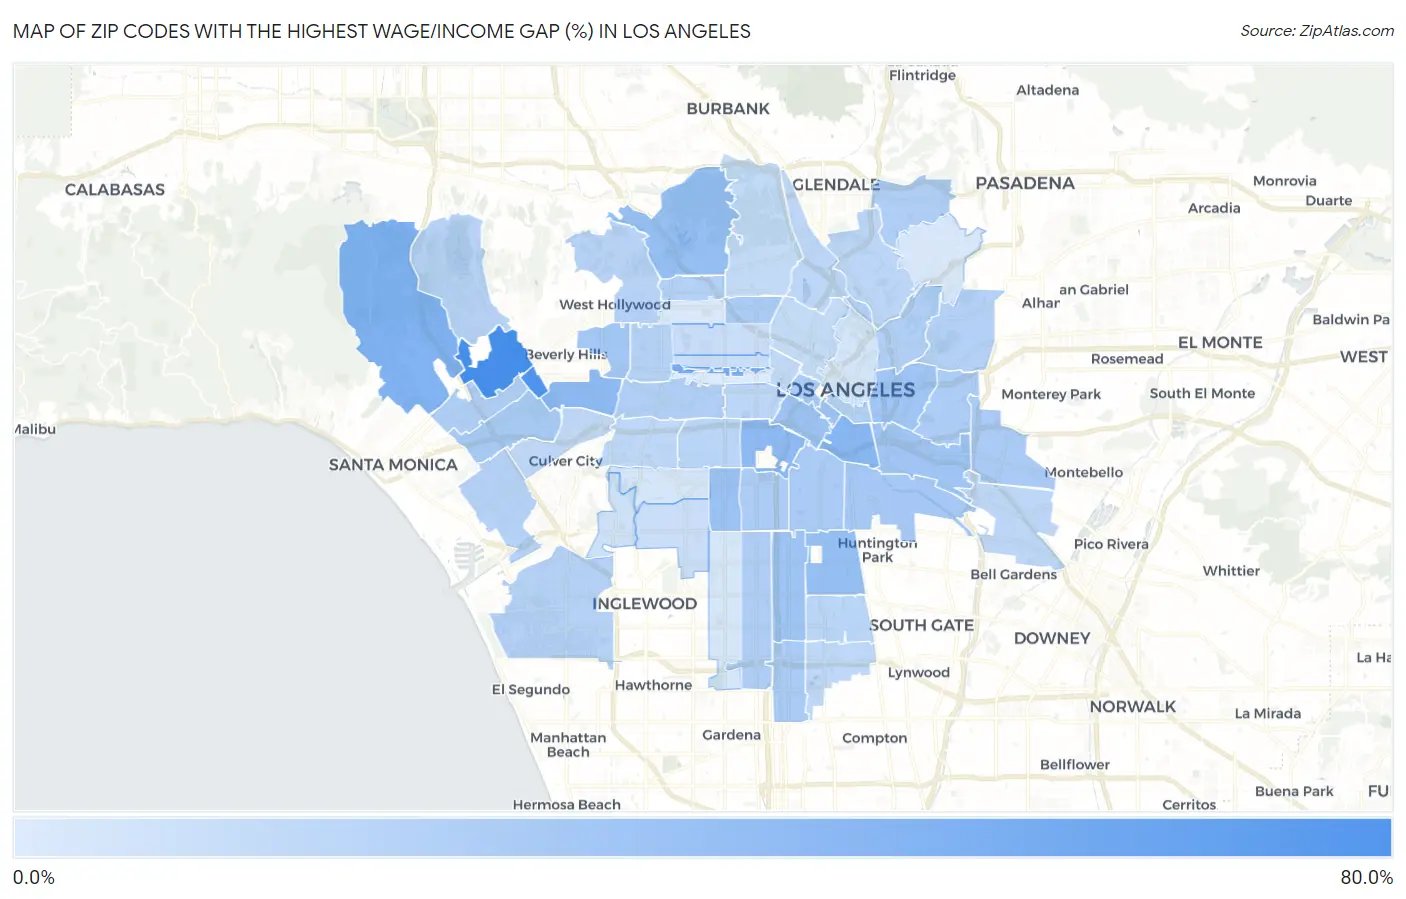
Map of Zip Codes with the Highest Wage/Income Gap (%) in Los Angeles
0.13%
70.1%
Zip Codes with the Highest Wage/Income Gap (%) in Los Angeles, CA
| Zip Code | Wage/Income Gap (%) | vs State | vs National | |
| 1. | 90024 | 70.1% | 25.7%(+0.445)#13 | 28.0%(+0.421)#370 |
| 2. | 90067 | 64.4% | 25.7%(+0.387)#28 | 28.0%(+0.364)#680 |
| 3. | 90010 | 42.6% | 25.7%(+0.169)#247 | 28.0%(+0.146)#5,863 |
| 4. | 90049 | 38.4% | 25.7%(+0.127)#348 | 28.0%(+0.104)#8,132 |
| 5. | 90021 | 35.6% | 25.7%(+0.099)#419 | 28.0%(+0.076)#9,937 |
| 6. | 90007 | 31.7% | 25.7%(+0.060)#543 | 28.0%(+0.037)#12,618 |
| 7. | 90035 | 31.6% | 25.7%(+0.059)#551 | 28.0%(+0.036)#12,717 |
| 8. | 90001 | 28.8% | 25.7%(+0.031)#645 | 28.0%(+0.008)#14,658 |
| 9. | 90068 | 28.6% | 25.7%(+0.029)#656 | 28.0%(+0.006)#14,843 |
| 10. | 90014 | 26.0% | 25.7%(+0.003)#770 | 28.0%(-0.020)#16,758 |
| 11. | 90015 | 25.5% | 25.7%(-0.001)#793 | 28.0%(-0.025)#17,071 |
| 12. | 90062 | 25.5% | 25.7%(-0.002)#795 | 28.0%(-0.025)#17,102 |
| 13. | 90003 | 24.8% | 25.7%(-0.008)#830 | 28.0%(-0.031)#17,540 |
| 14. | 90033 | 23.9% | 25.7%(-0.018)#868 | 28.0%(-0.041)#18,154 |
| 15. | 90023 | 23.6% | 25.7%(-0.020)#880 | 28.0%(-0.043)#18,350 |
| 16. | 90048 | 23.1% | 25.7%(-0.026)#910 | 28.0%(-0.049)#18,719 |
| 17. | 90058 | 21.7% | 25.7%(-0.040)#970 | 28.0%(-0.063)#19,631 |
| 18. | 90064 | 20.9% | 25.7%(-0.048)#1,008 | 28.0%(-0.071)#20,165 |
| 19. | 90011 | 20.0% | 25.7%(-0.056)#1,041 | 28.0%(-0.080)#20,695 |
| 20. | 90029 | 19.8% | 25.7%(-0.059)#1,054 | 28.0%(-0.082)#20,828 |
| 21. | 90022 | 19.8% | 25.7%(-0.059)#1,058 | 28.0%(-0.082)#20,861 |
| 22. | 90061 | 19.6% | 25.7%(-0.060)#1,060 | 28.0%(-0.084)#20,929 |
| 23. | 90017 | 19.5% | 25.7%(-0.062)#1,065 | 28.0%(-0.085)#21,012 |
| 24. | 90063 | 18.8% | 25.7%(-0.069)#1,084 | 28.0%(-0.092)#21,387 |
| 25. | 90037 | 18.4% | 25.7%(-0.073)#1,097 | 28.0%(-0.096)#21,583 |
| 26. | 90025 | 18.1% | 25.7%(-0.076)#1,111 | 28.0%(-0.099)#21,741 |
| 27. | 90041 | 17.6% | 25.7%(-0.081)#1,131 | 28.0%(-0.104)#22,016 |
| 28. | 90044 | 17.6% | 25.7%(-0.081)#1,132 | 28.0%(-0.104)#22,018 |
| 29. | 90031 | 17.0% | 25.7%(-0.087)#1,156 | 28.0%(-0.110)#22,310 |
| 30. | 90019 | 16.8% | 25.7%(-0.088)#1,164 | 28.0%(-0.112)#22,387 |
| 31. | 90013 | 16.4% | 25.7%(-0.093)#1,177 | 28.0%(-0.116)#22,610 |
| 32. | 90032 | 16.3% | 25.7%(-0.094)#1,178 | 28.0%(-0.117)#22,642 |
| 33. | 90028 | 15.7% | 25.7%(-0.100)#1,196 | 28.0%(-0.123)#22,898 |
| 34. | 90036 | 15.5% | 25.7%(-0.102)#1,201 | 28.0%(-0.125)#22,992 |
| 35. | 90045 | 15.2% | 25.7%(-0.105)#1,209 | 28.0%(-0.128)#23,100 |
| 36. | 90066 | 15.1% | 25.7%(-0.106)#1,218 | 28.0%(-0.129)#23,175 |
| 37. | 90077 | 14.4% | 25.7%(-0.113)#1,232 | 28.0%(-0.136)#23,427 |
| 38. | 90046 | 14.2% | 25.7%(-0.115)#1,235 | 28.0%(-0.138)#23,516 |
| 39. | 90018 | 13.2% | 25.7%(-0.125)#1,271 | 28.0%(-0.148)#23,896 |
| 40. | 90002 | 12.9% | 25.7%(-0.128)#1,279 | 28.0%(-0.151)#24,012 |
| 41. | 90006 | 12.3% | 25.7%(-0.133)#1,292 | 28.0%(-0.157)#24,220 |
| 42. | 90039 | 12.1% | 25.7%(-0.135)#1,298 | 28.0%(-0.159)#24,292 |
| 43. | 90040 | 12.0% | 25.7%(-0.137)#1,302 | 28.0%(-0.160)#24,360 |
| 44. | 90065 | 11.9% | 25.7%(-0.138)#1,305 | 28.0%(-0.161)#24,403 |
| 45. | 90059 | 11.7% | 25.7%(-0.140)#1,309 | 28.0%(-0.163)#24,455 |
| 46. | 90016 | 10.9% | 25.7%(-0.148)#1,331 | 28.0%(-0.171)#24,728 |
| 47. | 90057 | 10.1% | 25.7%(-0.156)#1,345 | 28.0%(-0.179)#25,010 |
| 48. | 90034 | 10.1% | 25.7%(-0.156)#1,348 | 28.0%(-0.179)#25,024 |
| 49. | 90027 | 9.9% | 25.7%(-0.158)#1,356 | 28.0%(-0.181)#25,077 |
| 50. | 90026 | 9.5% | 25.7%(-0.162)#1,360 | 28.0%(-0.185)#25,195 |
| 51. | 90004 | 7.7% | 25.7%(-0.180)#1,384 | 28.0%(-0.203)#25,747 |
| 52. | 90020 | 7.3% | 25.7%(-0.184)#1,388 | 28.0%(-0.207)#25,880 |
| 53. | 90043 | 6.5% | 25.7%(-0.192)#1,398 | 28.0%(-0.215)#26,121 |
| 54. | 90056 | 5.5% | 25.7%(-0.202)#1,412 | 28.0%(-0.225)#26,432 |
| 55. | 90012 | 3.1% | 25.7%(-0.226)#1,439 | 28.0%(-0.249)#27,044 |
| 56. | 90008 | 2.8% | 25.7%(-0.229)#1,441 | 28.0%(-0.252)#27,141 |
| 57. | 90047 | 2.6% | 25.7%(-0.231)#1,442 | 28.0%(-0.254)#27,184 |
| 58. | 90042 | 2.1% | 25.7%(-0.235)#1,450 | 28.0%(-0.259)#27,314 |
| 59. | 90038 | 1.1% | 25.7%(-0.246)#1,464 | 28.0%(-0.269)#27,591 |
| 60. | 90005 | 0.13% | 25.7%(-0.255)#1,471 | 28.0%(-0.279)#27,823 |
1
Common Questions
What are the Top 10 Zip Codes with the Highest Wage/Income Gap (%) in Los Angeles, CA?
Top 10 Zip Codes with the Highest Wage/Income Gap (%) in Los Angeles, CA are:
What zip code has the Highest Wage/Income Gap (%) in Los Angeles, CA?
90024 has the Highest Wage/Income Gap (%) in Los Angeles, CA with 70.1%.
What is the Wage / Income Gap in Percentage Terms in Los Angeles, CA?
Wage / Income Gap in Percentage Terms in Los Angeles is 16.8%.
What is the Wage / Income Gap in Percentage Terms in California?
Wage / Income Gap in Percentage Terms in California is 25.7%.
What is the Wage / Income Gap in Percentage Terms in the United States?
Wage / Income Gap in Percentage Terms in the United States is 28.0%.