San Miguel, AZ Map & Demographics
San Miguel Map
San Miguel Overview
$14,047
PER CAPITA INCOME
0.60
INEQUALITY / GINI INDEX
314
TOTAL POPULATION
205
MALE POPULATION
109
FEMALE POPULATION
188.07
MALES / 100 FEMALES
53.17
FEMALES / 100 MALES
29.2
MEDIAN AGE
4.4
AVG FAMILY SIZE
3.3
AVG HOUSEHOLD SIZE
88
LABOR FORCE [ PEOPLE ]
37.1%
PERCENT IN LABOR FORCE
21.6%
UNEMPLOYMENT RATE
Income in San Miguel
Income Overview in San Miguel
| Characteristic | Number | Measure |
| Per Capita Income | 314 | $14,047 |
| Median Family Income | 59 | $0 |
| Mean Family Income | 59 | $64,468 |
| Median Household Income | 95 | $0 |
| Mean Household Income | 95 | $45,628 |
| Income Deficit | 59 | $0 |
| Wage / Income Gap (%) | 314 | 0.00% |
| Wage / Income Gap ($) | 314 | 100.00¢ per $1 |
| Gini / Inequality Index | 314 | 0.60 |
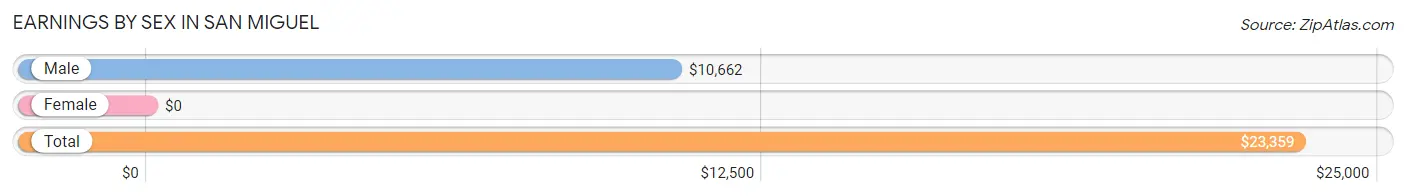
Earnings by Sex in San Miguel
| Sex | Number | Average Earnings |
| Male | 57 (61.3%) | $10,662 |
| Female | 36 (38.7%) | $0 |
| Total | 93 (100.0%) | $23,359 |
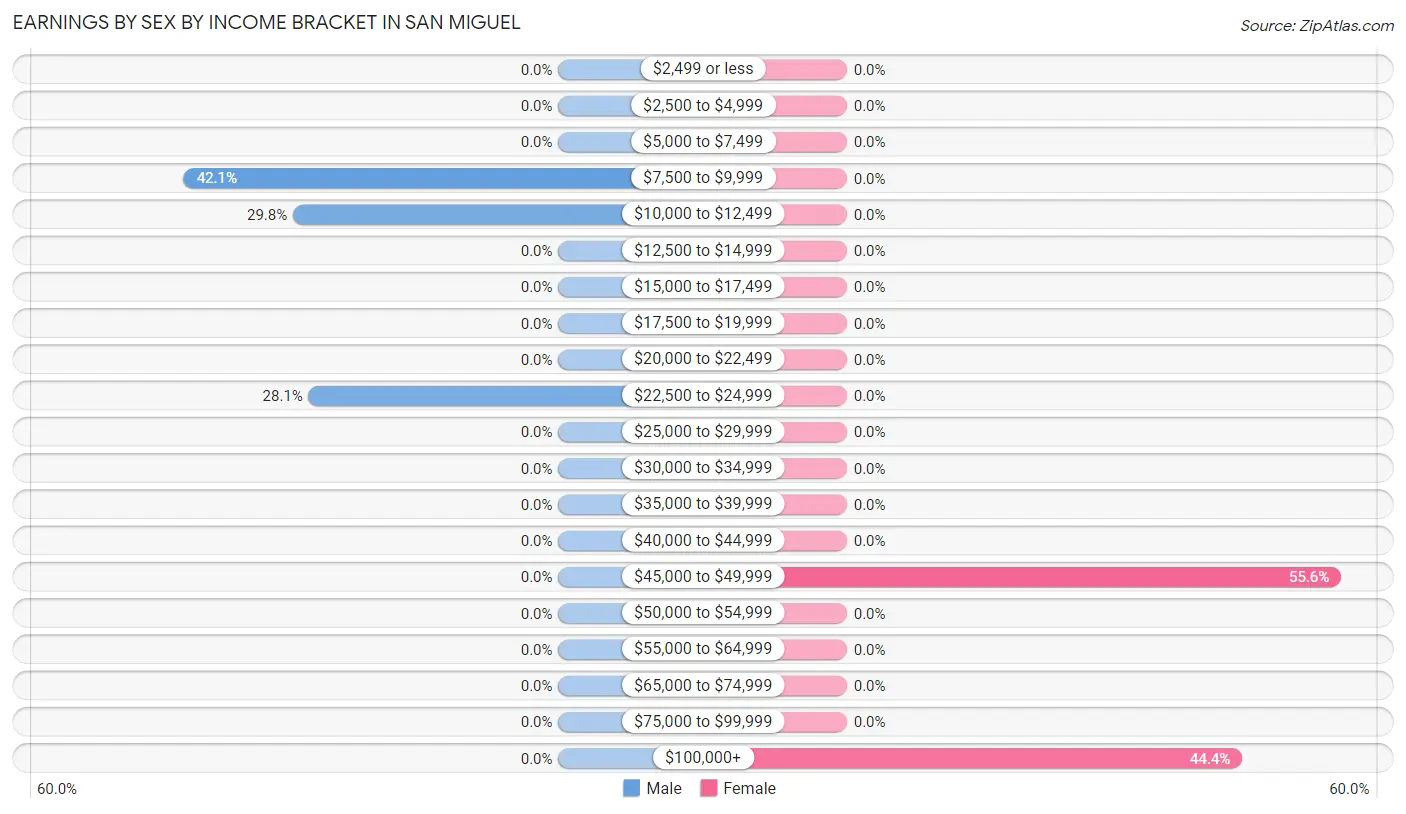
Earnings by Sex by Income Bracket in San Miguel
The most common earnings brackets in San Miguel are $7,500 to $9,999 for men (24 | 42.1%) and $45,000 to $49,999 for women (20 | 55.6%).
| Income | Male | Female |
| $2,499 or less | 0 (0.0%) | 0 (0.0%) |
| $2,500 to $4,999 | 0 (0.0%) | 0 (0.0%) |
| $5,000 to $7,499 | 0 (0.0%) | 0 (0.0%) |
| $7,500 to $9,999 | 24 (42.1%) | 0 (0.0%) |
| $10,000 to $12,499 | 17 (29.8%) | 0 (0.0%) |
| $12,500 to $14,999 | 0 (0.0%) | 0 (0.0%) |
| $15,000 to $17,499 | 0 (0.0%) | 0 (0.0%) |
| $17,500 to $19,999 | 0 (0.0%) | 0 (0.0%) |
| $20,000 to $22,499 | 0 (0.0%) | 0 (0.0%) |
| $22,500 to $24,999 | 16 (28.1%) | 0 (0.0%) |
| $25,000 to $29,999 | 0 (0.0%) | 0 (0.0%) |
| $30,000 to $34,999 | 0 (0.0%) | 0 (0.0%) |
| $35,000 to $39,999 | 0 (0.0%) | 0 (0.0%) |
| $40,000 to $44,999 | 0 (0.0%) | 0 (0.0%) |
| $45,000 to $49,999 | 0 (0.0%) | 20 (55.6%) |
| $50,000 to $54,999 | 0 (0.0%) | 0 (0.0%) |
| $55,000 to $64,999 | 0 (0.0%) | 0 (0.0%) |
| $65,000 to $74,999 | 0 (0.0%) | 0 (0.0%) |
| $75,000 to $99,999 | 0 (0.0%) | 0 (0.0%) |
| $100,000+ | 0 (0.0%) | 16 (44.4%) |
| Total | 57 (100.0%) | 36 (100.0%) |
Earnings by Sex by Educational Attainment in San Miguel
| Educational Attainment | Male Income | Female Income |
| Less than High School | - | - |
| High School Diploma | - | - |
| College or Associate's Degree | - | - |
| Bachelor's Degree | - | - |
| Graduate Degree | - | - |
| Total | $10,662 | $0 |
Family Income in San Miguel
Family Income Brackets in San Miguel
According to the San Miguel family income data, there are 23 families falling into the less than $10,000 income range, which is the most common income bracket and makes up 39.0% of all families.
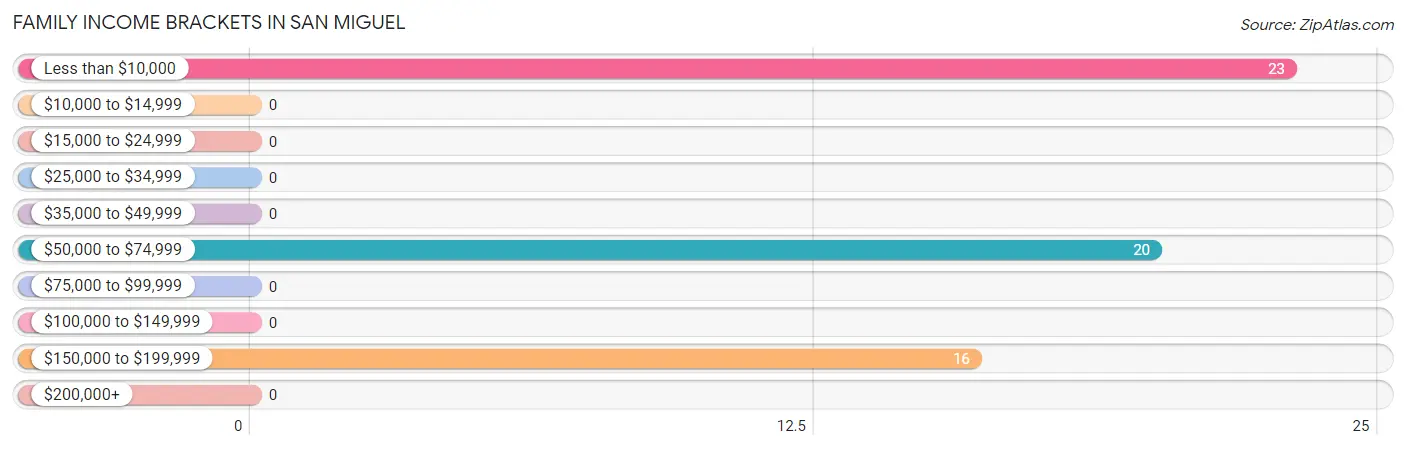
| Income Bracket | # Families | % Families |
| Less than $10,000 | 23 | 39.0% |
| $10,000 to $14,999 | 0 | 0.0% |
| $15,000 to $24,999 | 0 | 0.0% |
| $25,000 to $34,999 | 0 | 0.0% |
| $35,000 to $49,999 | 0 | 0.0% |
| $50,000 to $74,999 | 20 | 33.9% |
| $75,000 to $99,999 | 0 | 0.0% |
| $100,000 to $149,999 | 0 | 0.0% |
| $150,000 to $199,999 | 16 | 27.1% |
| $200,000+ | 0 | 0.0% |
Family Income by Famaliy Size in San Miguel
| Income Bracket | # Families | Median Income |
| 2-Person Families | 0 (0.0%) | $0 |
| 3-Person Families | 20 (33.9%) | $0 |
| 4-Person Families | 13 (22.0%) | $0 |
| 5-Person Families | 26 (44.1%) | $0 |
| 6-Person Families | 0 (0.0%) | $0 |
| 7+ Person Families | 0 (0.0%) | $0 |
| Total | 59 (100.0%) | $0 |
Family Income by Number of Earners in San Miguel
| Number of Earners | # Families | Median Income |
| No Earners | 23 (39.0%) | $0 |
| 1 Earner | 0 (0.0%) | $0 |
| 2 Earners | 36 (61.0%) | $0 |
| 3+ Earners | 0 (0.0%) | $0 |
| Total | 59 (100.0%) | $0 |
Household Income in San Miguel
Household Income Brackets in San Miguel
With 27 households falling in the category, the less than $10,000 income range is the most frequent in San Miguel, accounting for 28.4% of all households.
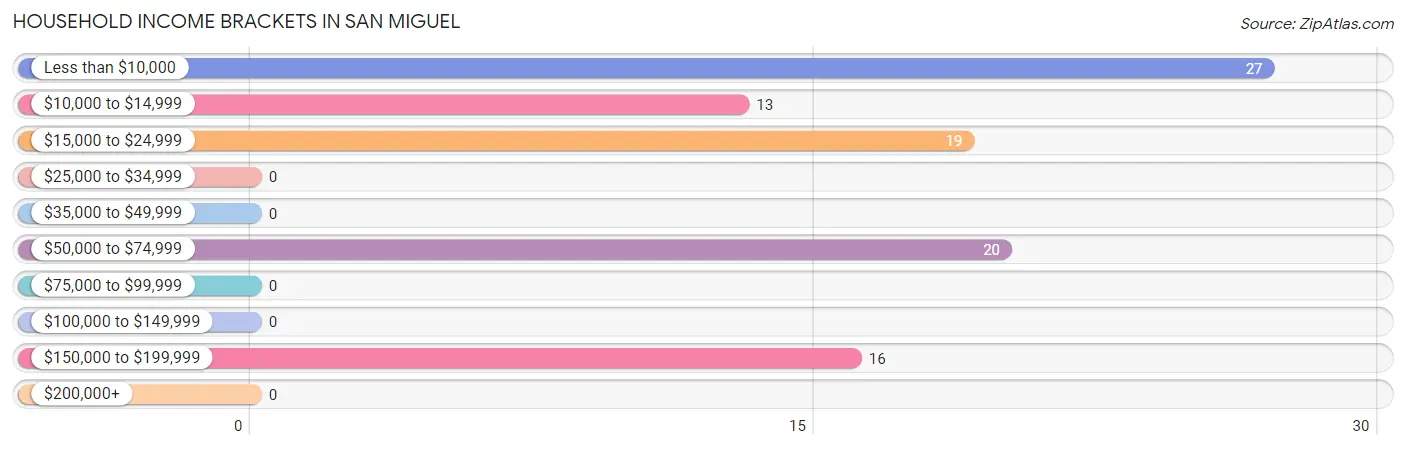
| Income Bracket | # Households | % Households |
| Less than $10,000 | 27 | 28.4% |
| $10,000 to $14,999 | 13 | 13.7% |
| $15,000 to $24,999 | 19 | 20.0% |
| $25,000 to $34,999 | 0 | 0.0% |
| $35,000 to $49,999 | 0 | 0.0% |
| $50,000 to $74,999 | 20 | 21.1% |
| $75,000 to $99,999 | 0 | 0.0% |
| $100,000 to $149,999 | 0 | 0.0% |
| $150,000 to $199,999 | 16 | 16.8% |
| $200,000+ | 0 | 0.0% |
Household Income by Householder Age in San Miguel
The median household income in San Miguel is $0, with the highest median household income of $18,625 found in the 65+ years age bracket for the primary householder. A total of 29 households (30.5%) fall into this category.
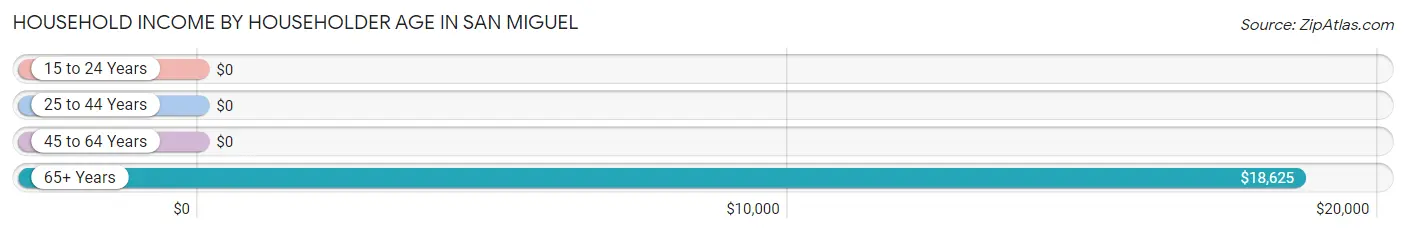
| Income Bracket | # Households | Median Income |
| 15 to 24 Years | 0 (0.0%) | $0 |
| 25 to 44 Years | 29 (30.5%) | $0 |
| 45 to 64 Years | 37 (39.0%) | $0 |
| 65+ Years | 29 (30.5%) | $18,625 |
| Total | 95 (100.0%) | $0 |
Poverty in San Miguel
Income Below Poverty by Sex and Age in San Miguel
With 50.7% poverty level for males and 49.5% for females among the residents of San Miguel, 6 to 11 year old males and 6 to 11 year old females are the most vulnerable to poverty, with 14 males (100.0%) and 15 females (100.0%) in their respective age groups living below the poverty level.
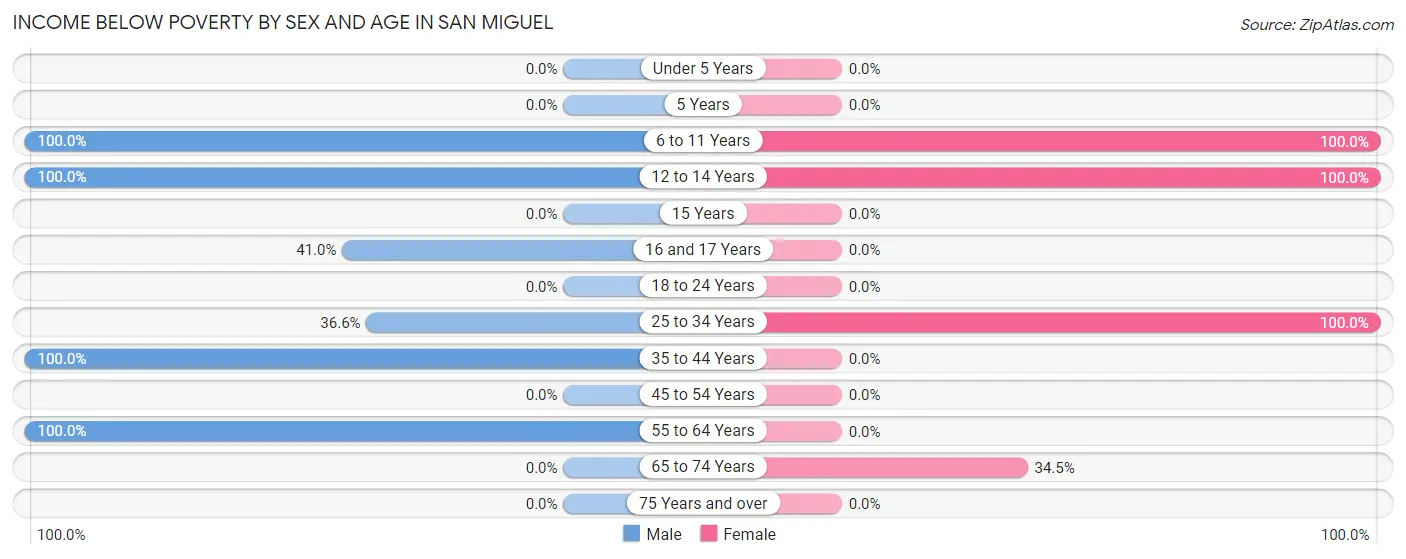
| Age Bracket | Male | Female |
| Under 5 Years | 0 (0.0%) | 0 (0.0%) |
| 5 Years | 0 (0.0%) | 0 (0.0%) |
| 6 to 11 Years | 14 (100.0%) | 15 (100.0%) |
| 12 to 14 Years | 13 (100.0%) | 16 (100.0%) |
| 15 Years | 0 (0.0%) | 0 (0.0%) |
| 16 and 17 Years | 16 (41.0%) | 0 (0.0%) |
| 18 to 24 Years | 0 (0.0%) | 0 (0.0%) |
| 25 to 34 Years | 34 (36.6%) | 13 (100.0%) |
| 35 to 44 Years | 10 (100.0%) | 0 (0.0%) |
| 45 to 54 Years | 0 (0.0%) | 0 (0.0%) |
| 55 to 64 Years | 17 (100.0%) | 0 (0.0%) |
| 65 to 74 Years | 0 (0.0%) | 10 (34.5%) |
| 75 Years and over | 0 (0.0%) | 0 (0.0%) |
| Total | 104 (50.7%) | 54 (49.5%) |
Income Above Poverty by Sex and Age in San Miguel
According to the poverty statistics in San Miguel, males aged 5 years and females aged 35 to 44 years are the age groups that are most secure financially, with 100.0% of males and 100.0% of females in these age groups living above the poverty line.
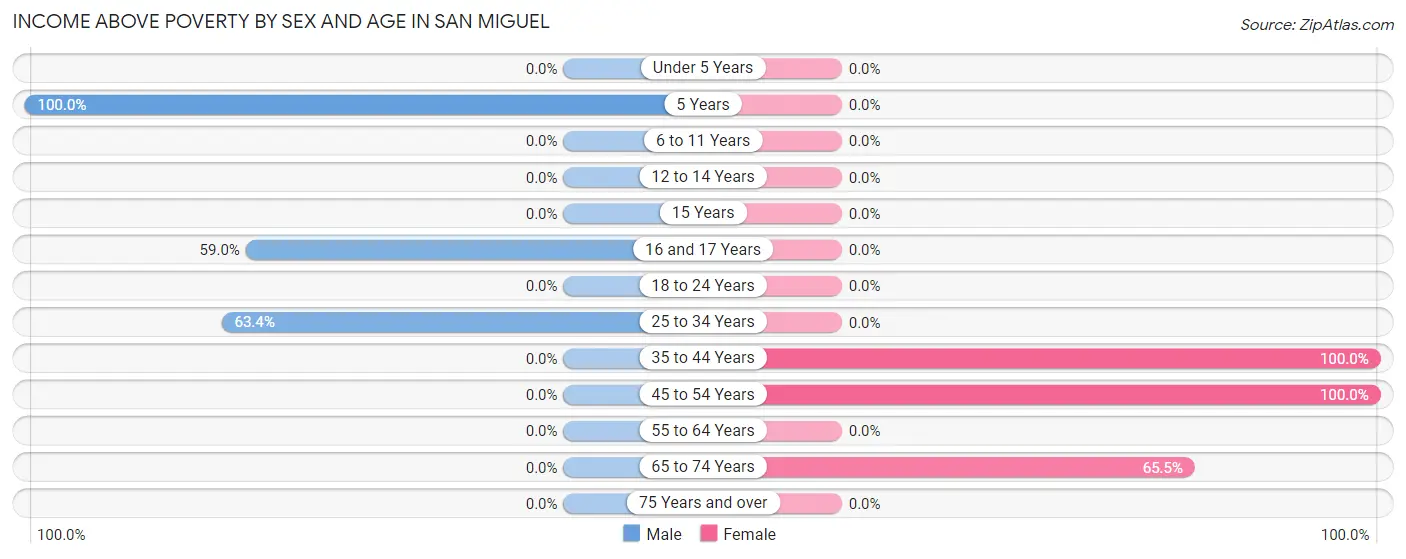
| Age Bracket | Male | Female |
| Under 5 Years | 0 (0.0%) | 0 (0.0%) |
| 5 Years | 19 (100.0%) | 0 (0.0%) |
| 6 to 11 Years | 0 (0.0%) | 0 (0.0%) |
| 12 to 14 Years | 0 (0.0%) | 0 (0.0%) |
| 15 Years | 0 (0.0%) | 0 (0.0%) |
| 16 and 17 Years | 23 (59.0%) | 0 (0.0%) |
| 18 to 24 Years | 0 (0.0%) | 0 (0.0%) |
| 25 to 34 Years | 59 (63.4%) | 0 (0.0%) |
| 35 to 44 Years | 0 (0.0%) | 16 (100.0%) |
| 45 to 54 Years | 0 (0.0%) | 20 (100.0%) |
| 55 to 64 Years | 0 (0.0%) | 0 (0.0%) |
| 65 to 74 Years | 0 (0.0%) | 19 (65.5%) |
| 75 Years and over | 0 (0.0%) | 0 (0.0%) |
| Total | 101 (49.3%) | 55 (50.5%) |
Income Below Poverty Among Married-Couple Families in San Miguel
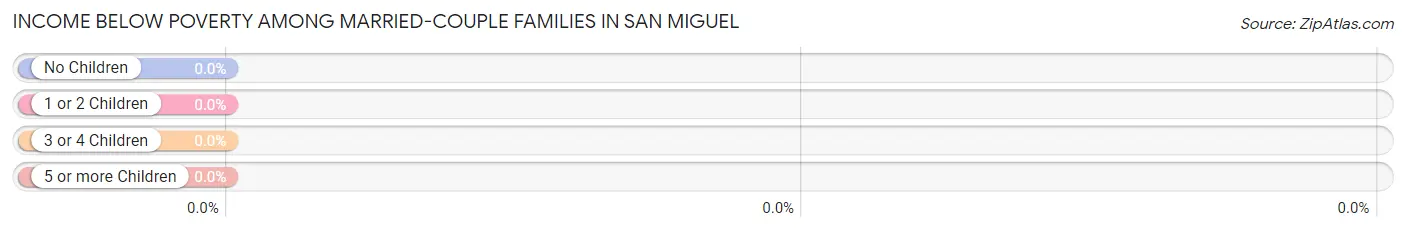
| Children | Above Poverty | Below Poverty |
| No Children | 0 (0.0%) | 0 (0.0%) |
| 1 or 2 Children | 16 (100.0%) | 0 (0.0%) |
| 3 or 4 Children | 0 (0.0%) | 0 (0.0%) |
| 5 or more Children | 0 (0.0%) | 0 (0.0%) |
| Total | 16 (100.0%) | 0 (0.0%) |
Income Below Poverty Among Single-Parent Households in San Miguel
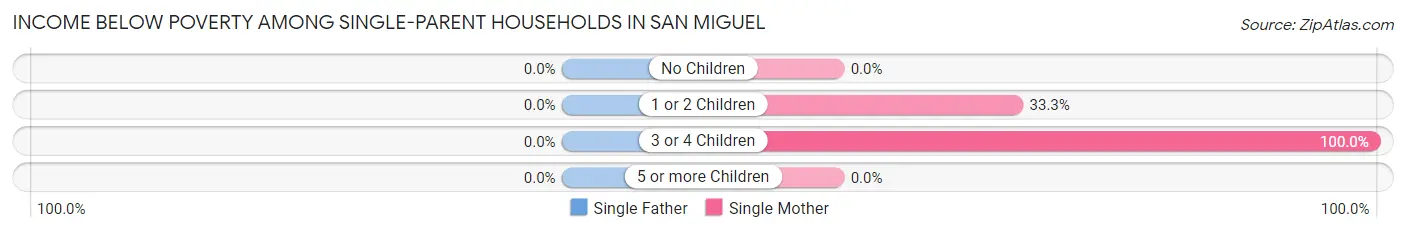
| Children | Single Father | Single Mother |
| No Children | 0 (0.0%) | 0 (0.0%) |
| 1 or 2 Children | 0 (0.0%) | 10 (33.3%) |
| 3 or 4 Children | 0 (0.0%) | 13 (100.0%) |
| 5 or more Children | 0 (0.0%) | 0 (0.0%) |
| Total | 0 (0.0%) | 23 (53.5%) |
Income Below Poverty Among Married-Couple vs Single-Parent Households in San Miguel
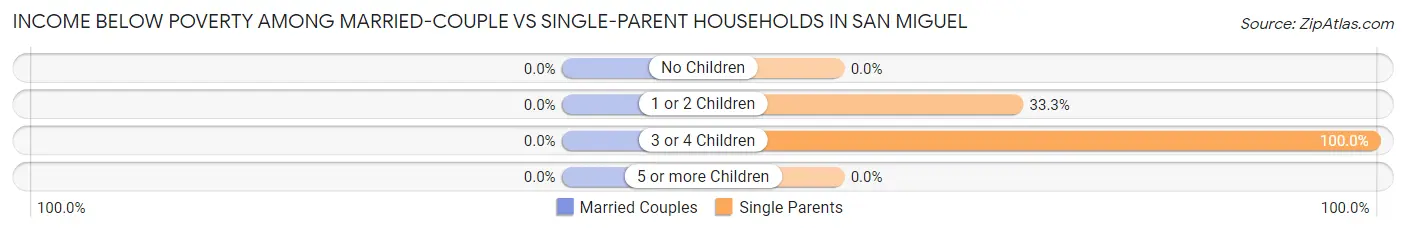
| Children | Married-Couple Families | Single-Parent Households |
| No Children | 0 (0.0%) | 0 (0.0%) |
| 1 or 2 Children | 0 (0.0%) | 10 (33.3%) |
| 3 or 4 Children | 0 (0.0%) | 13 (100.0%) |
| 5 or more Children | 0 (0.0%) | 0 (0.0%) |
| Total | 0 (0.0%) | 23 (53.5%) |
Race in San Miguel
The most populous races in San Miguel are Native / Alaskan (268 | 85.4%), and Two or more Races (46 | 14.6%).
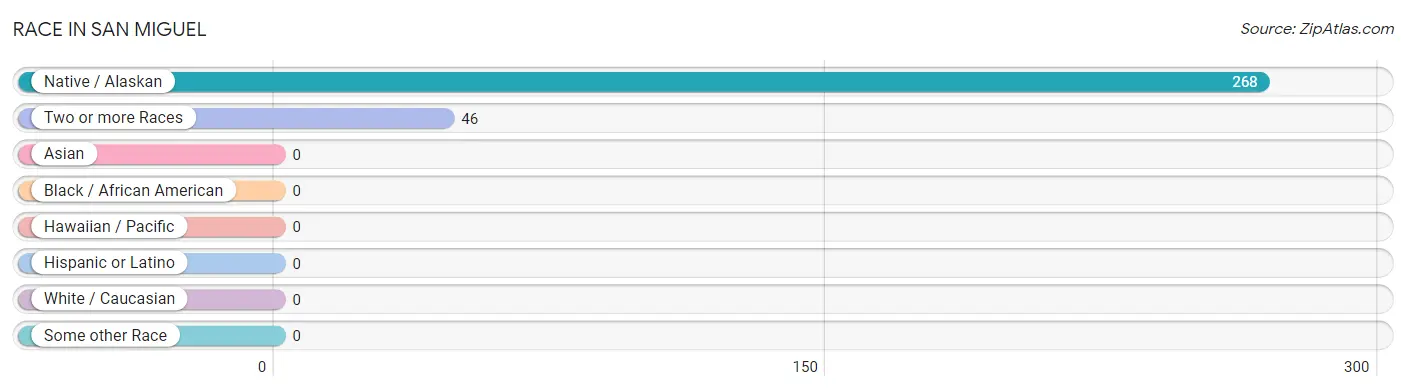
| Race | # Population | % Population |
| Asian | 0 | 0.0% |
| Black / African American | 0 | 0.0% |
| Hawaiian / Pacific | 0 | 0.0% |
| Hispanic or Latino | 0 | 0.0% |
| Native / Alaskan | 268 | 85.4% |
| White / Caucasian | 0 | 0.0% |
| Two or more Races | 46 | 14.6% |
| Some other Race | 0 | 0.0% |
| Total | 314 | 100.0% |
Ancestry in San Miguel
The most populous ancestries reported in San Miguel are Tohono O'Odham (233 | 74.2%), Arab (81 | 25.8%), Moroccan (81 | 25.8%), and American (32 | 10.2%), together accounting for 136.0% of all San Miguel residents.
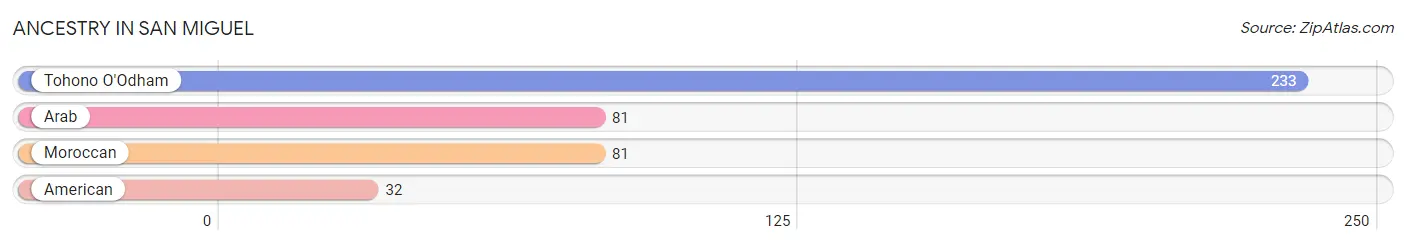
| Ancestry | # Population | % Population |
| American | 32 | 10.2% |
| Arab | 81 | 25.8% |
| Moroccan | 81 | 25.8% |
| Tohono O'Odham | 233 | 74.2% | View All 4 Rows |
Immigrants in San Miguel

| Immigration Origin | # Population | % Population | View All 0 Rows |
Sex and Age in San Miguel
Sex and Age in San Miguel
The most populous age groups in San Miguel are 25 to 29 Years (60 | 29.3%) for men and 70 to 74 Years (29 | 26.6%) for women.
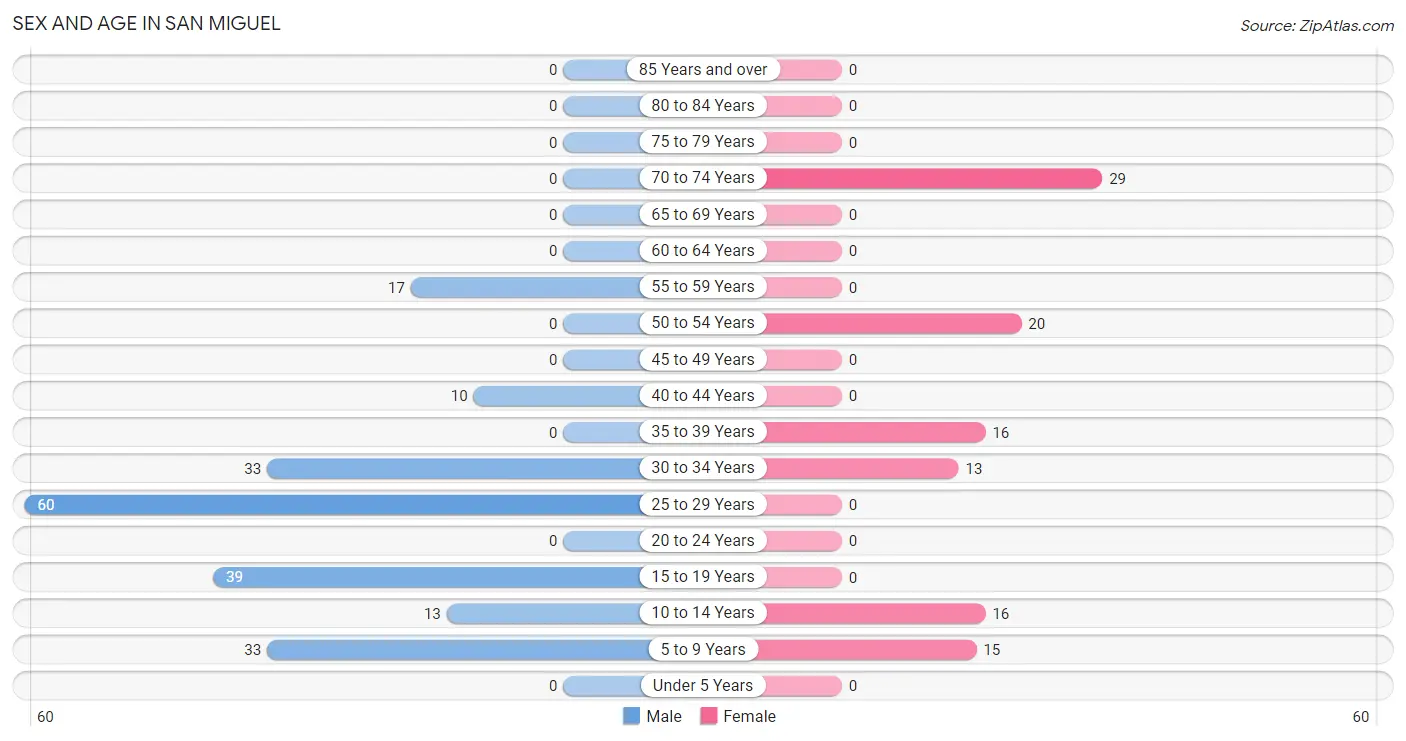
| Age Bracket | Male | Female |
| Under 5 Years | 0 (0.0%) | 0 (0.0%) |
| 5 to 9 Years | 33 (16.1%) | 15 (13.8%) |
| 10 to 14 Years | 13 (6.3%) | 16 (14.7%) |
| 15 to 19 Years | 39 (19.0%) | 0 (0.0%) |
| 20 to 24 Years | 0 (0.0%) | 0 (0.0%) |
| 25 to 29 Years | 60 (29.3%) | 0 (0.0%) |
| 30 to 34 Years | 33 (16.1%) | 13 (11.9%) |
| 35 to 39 Years | 0 (0.0%) | 16 (14.7%) |
| 40 to 44 Years | 10 (4.9%) | 0 (0.0%) |
| 45 to 49 Years | 0 (0.0%) | 0 (0.0%) |
| 50 to 54 Years | 0 (0.0%) | 20 (18.3%) |
| 55 to 59 Years | 17 (8.3%) | 0 (0.0%) |
| 60 to 64 Years | 0 (0.0%) | 0 (0.0%) |
| 65 to 69 Years | 0 (0.0%) | 0 (0.0%) |
| 70 to 74 Years | 0 (0.0%) | 29 (26.6%) |
| 75 to 79 Years | 0 (0.0%) | 0 (0.0%) |
| 80 to 84 Years | 0 (0.0%) | 0 (0.0%) |
| 85 Years and over | 0 (0.0%) | 0 (0.0%) |
| Total | 205 (100.0%) | 109 (100.0%) |
Families and Households in San Miguel
Median Family Size in San Miguel
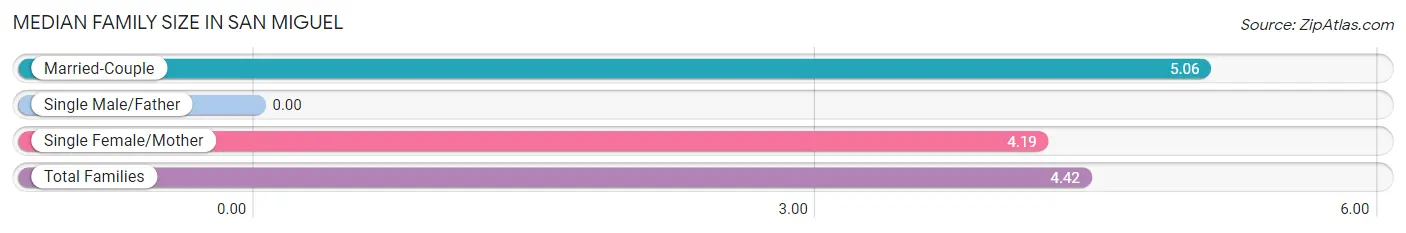
| Family Type | # Families | Family Size |
| Married-Couple | 16 (27.1%) | 5.06 |
| Single Male/Father | 0 (0.0%) | - |
| Single Female/Mother | 43 (72.9%) | 4.19 |
| Total Families | 59 (100.0%) | 4.42 |
Median Household Size in San Miguel
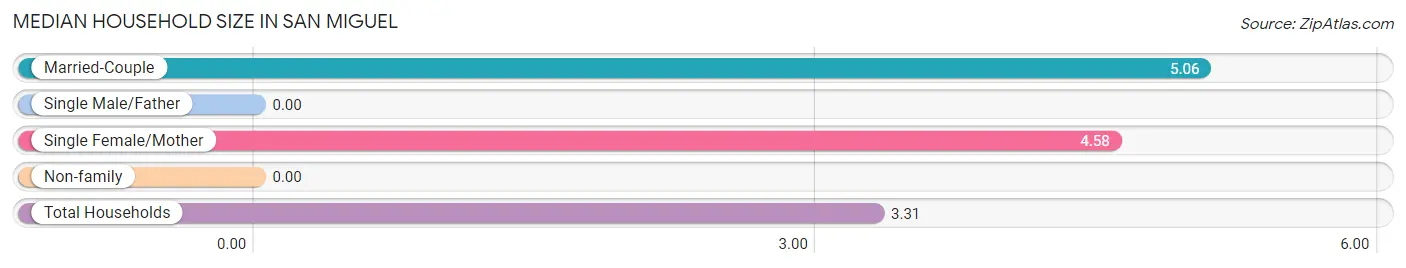
| Household Type | # Households | Household Size |
| Married-Couple | 16 (16.8%) | 5.06 |
| Single Male/Father | 0 (0.0%) | - |
| Single Female/Mother | 43 (45.3%) | 4.58 |
| Non-family | 36 (37.9%) | - |
| Total Households | 95 (100.0%) | 3.31 |
Household Size by Marriage Status in San Miguel
Out of a total of 95 households in San Miguel, 59 (62.1%) are family households, while 36 (37.9%) are nonfamily households. The most numerous type of family households are 5-person households, comprising 39, and the most common type of nonfamily households are 1-person households, comprising 36.
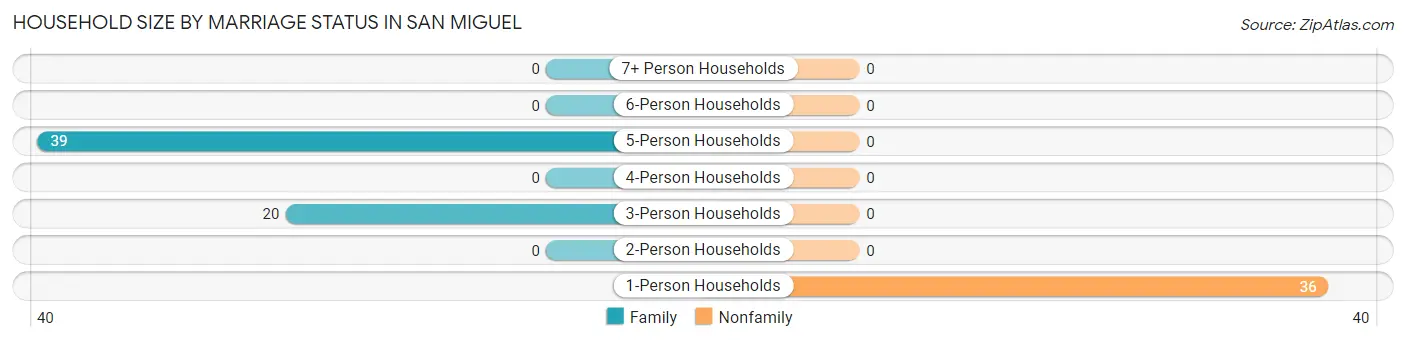
| Household Size | Family Households | Nonfamily Households |
| 1-Person Households | - | 36 (37.9%) |
| 2-Person Households | 0 (0.0%) | 0 (0.0%) |
| 3-Person Households | 20 (21.0%) | 0 (0.0%) |
| 4-Person Households | 0 (0.0%) | 0 (0.0%) |
| 5-Person Households | 39 (41.0%) | 0 (0.0%) |
| 6-Person Households | 0 (0.0%) | 0 (0.0%) |
| 7+ Person Households | 0 (0.0%) | 0 (0.0%) |
| Total | 59 (62.1%) | 36 (37.9%) |
Female Fertility in San Miguel
Fertility by Age in San Miguel
| Age Bracket | Women with Births | Births / 1,000 Women |
| 15 to 19 years | 0 (0.0%) | 0.0 |
| 20 to 34 years | 0 (0.0%) | 0.0 |
| 35 to 50 years | 0 (0.0%) | 0.0 |
| Total | 0 (0.0%) | 0.0 |
Fertility by Age by Marriage Status in San Miguel
| Age Bracket | Married | Unmarried |
| 15 to 19 years | 0 (0.0%) | 0 (0.0%) |
| 20 to 34 years | 0 (0.0%) | 0 (0.0%) |
| 35 to 50 years | 0 (0.0%) | 0 (0.0%) |
| Total | 0 (0.0%) | 0 (0.0%) |
Fertility by Education in San Miguel
| Educational Attainment | Women with Births | Births / 1,000 Women |
| Less than High School | 0 (0.0%) | 0.0 |
| High School Diploma | 0 (0.0%) | 0.0 |
| College or Associate's Degree | 0 (0.0%) | 0.0 |
| Bachelor's Degree | 0 (0.0%) | 0.0 |
| Graduate Degree | 0 (0.0%) | 0.0 |
| Total | 0 (0.0%) | 0.0 |
Fertility by Education by Marriage Status in San Miguel
| Educational Attainment | Married | Unmarried |
| Less than High School | 0 (0.0%) | 0 (0.0%) |
| High School Diploma | 0 (0.0%) | 0 (0.0%) |
| College or Associate's Degree | 0 (0.0%) | 0 (0.0%) |
| Bachelor's Degree | 0 (0.0%) | 0 (0.0%) |
| Graduate Degree | 0 (0.0%) | 0 (0.0%) |
| Total | 0 (0.0%) | 0 (0.0%) |
Employment Characteristics in San Miguel
Employment by Class of Employer in San Miguel
Among the 69 employed individuals in San Miguel, self-employed (not incorporated) (33 | 47.8%), local government employees (20 | 29.0%), and state government employees (16 | 23.2%) make up the most common classes of employment.
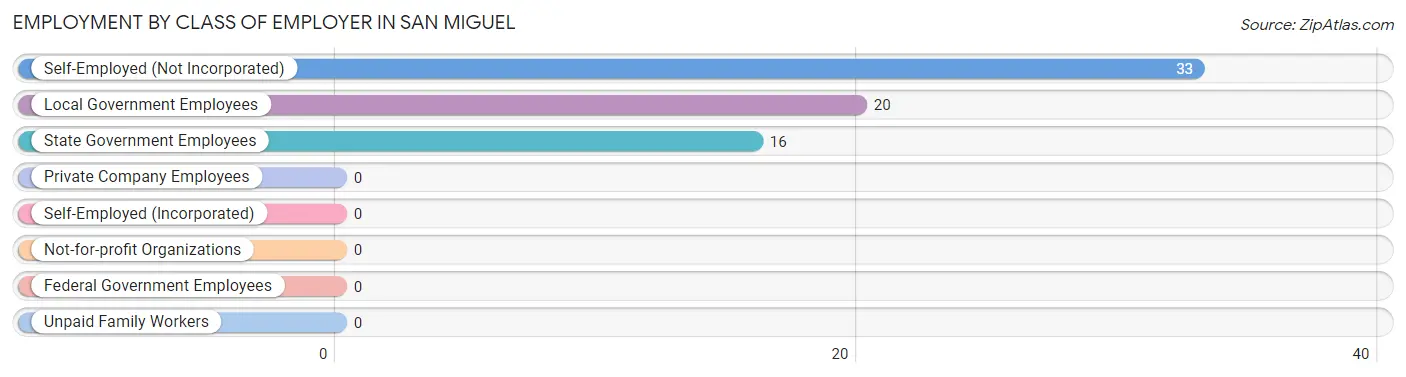
| Employer Class | # Employees | % Employees |
| Private Company Employees | 0 | 0.0% |
| Self-Employed (Incorporated) | 0 | 0.0% |
| Self-Employed (Not Incorporated) | 33 | 47.8% |
| Not-for-profit Organizations | 0 | 0.0% |
| Local Government Employees | 20 | 29.0% |
| State Government Employees | 16 | 23.2% |
| Federal Government Employees | 0 | 0.0% |
| Unpaid Family Workers | 0 | 0.0% |
| Total | 69 | 100.0% |
Employment Status by Age in San Miguel
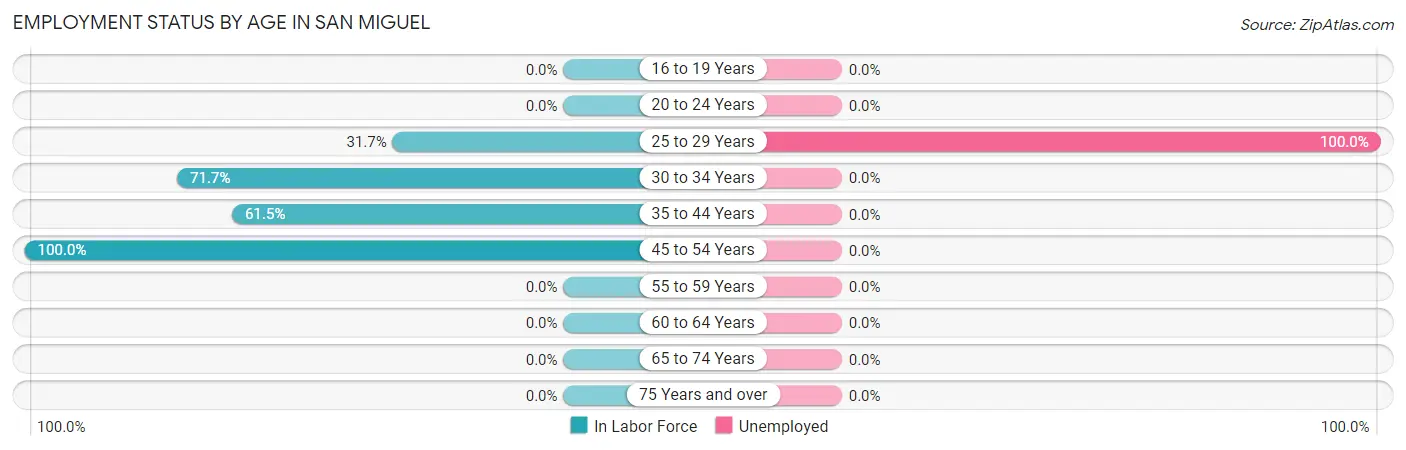
According to the labor force statistics for San Miguel, out of the total population over 16 years of age (237), 37.1% or 88 individuals are in the labor force, with 21.6% or 19 of them unemployed. The age group with the highest labor force participation rate is 45 to 54 years, with 100.0% or 20 individuals in the labor force. Within the labor force, the 25 to 29 years age range has the highest percentage of unemployed individuals, with 100.0% or 19 of them being unemployed.
| Age Bracket | In Labor Force | Unemployed |
| 16 to 19 Years | 0 (0.0%) | 0 (0.0%) |
| 20 to 24 Years | 0 (0.0%) | 0 (0.0%) |
| 25 to 29 Years | 19 (31.7%) | 19 (100.0%) |
| 30 to 34 Years | 33 (71.7%) | 0 (0.0%) |
| 35 to 44 Years | 16 (61.5%) | 0 (0.0%) |
| 45 to 54 Years | 20 (100.0%) | 0 (0.0%) |
| 55 to 59 Years | 0 (0.0%) | 0 (0.0%) |
| 60 to 64 Years | 0 (0.0%) | 0 (0.0%) |
| 65 to 74 Years | 0 (0.0%) | 0 (0.0%) |
| 75 Years and over | 0 (0.0%) | 0 (0.0%) |
| Total | 88 (37.1%) | 19 (21.6%) |
Employment Status by Educational Attainment in San Miguel
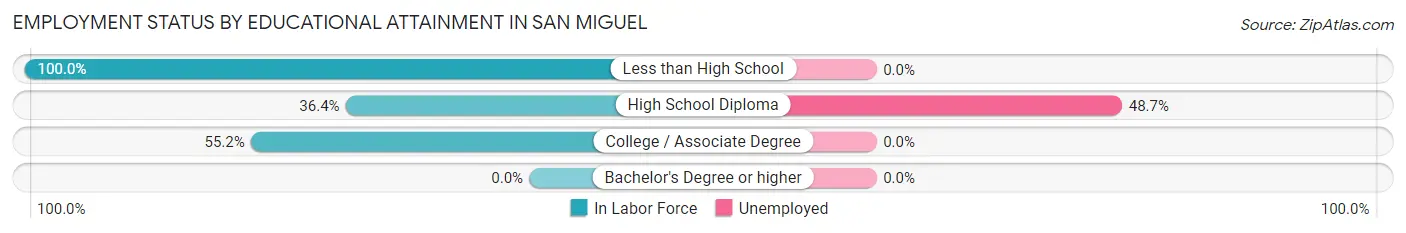
According to labor force statistics for San Miguel, 52.1% of individuals (88) out of the total population between 25 and 64 years of age (169) are in the labor force, with 21.6% or 19 of them being unemployed. The group with the highest labor force participation rate are those with the educational attainment of less than high school, with 100.0% or 33 individuals in the labor force. Within the labor force, individuals with high school diploma education have the highest percentage of unemployment, with 48.7% or 19 of them being unemployed.
| Educational Attainment | In Labor Force | Unemployed |
| Less than High School | 33 (100.0%) | 0 (0.0%) |
| High School Diploma | 39 (36.4%) | 52 (48.7%) |
| College / Associate Degree | 16 (55.2%) | 0 (0.0%) |
| Bachelor's Degree or higher | 0 (0.0%) | 0 (0.0%) |
| Total | 88 (52.1%) | 37 (21.6%) |
Employment Occupations by Sex in San Miguel
Management, Business, Science and Arts Occupations
Management, Business, Science and Arts Occupations by Sex
| Occupation | Male | Female |
| Management | 0 (0.0%) | 0 (0.0%) |
| Business & Financial | 0 (0.0%) | 0 (0.0%) |
| Computers, Engineering & Science | 0 (0.0%) | 0 (0.0%) |
| Computers & Mathematics | 0 (0.0%) | 0 (0.0%) |
| Architecture & Engineering | 0 (0.0%) | 0 (0.0%) |
| Life, Physical & Social Science | 0 (0.0%) | 0 (0.0%) |
| Community & Social Service | 0 (0.0%) | 0 (0.0%) |
| Education, Arts & Media | 0 (0.0%) | 0 (0.0%) |
| Legal Services & Support | 0 (0.0%) | 0 (0.0%) |
| Education Instruction & Library | 0 (0.0%) | 0 (0.0%) |
| Arts, Media & Entertainment | 0 (0.0%) | 0 (0.0%) |
| Health Diagnosing & Treating | 0 (0.0%) | 0 (0.0%) |
| Health Technologists | 0 (0.0%) | 0 (0.0%) |
| Total (Category) | 0 (0.0%) | 0 (0.0%) |
| Total (Overall) | 33 (47.8%) | 36 (52.2%) |
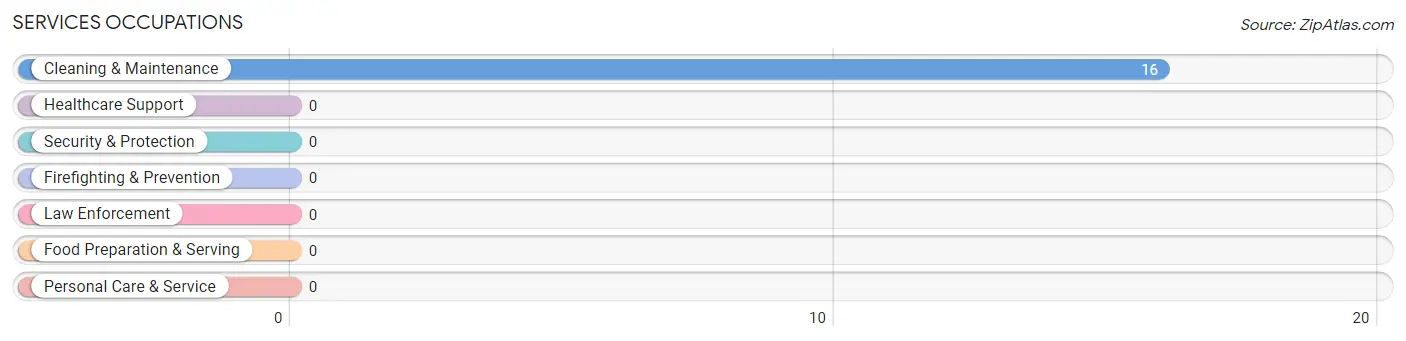
Services Occupations
The most common Services occupations in San Miguel are , and Cleaning & Maintenance (16 | 23.2%).
Services Occupations by Sex
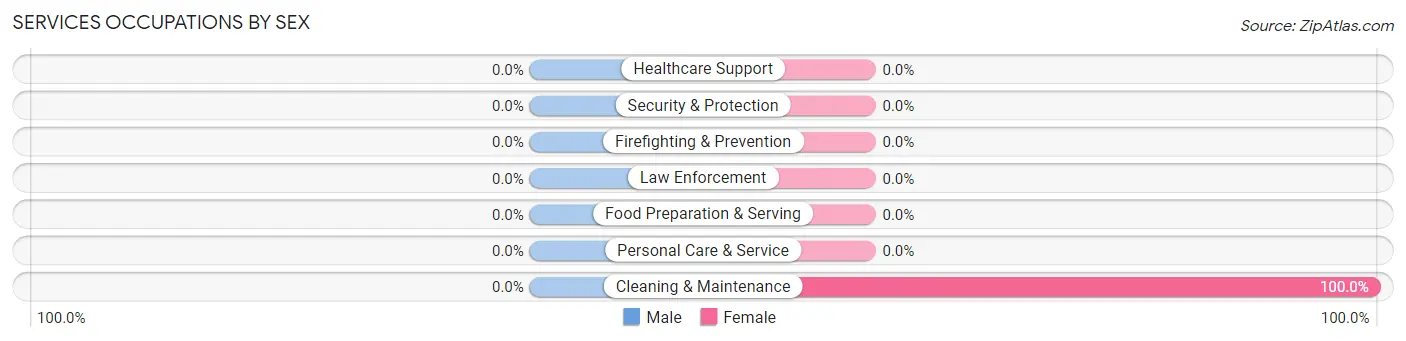
| Occupation | Male | Female |
| Healthcare Support | 0 (0.0%) | 0 (0.0%) |
| Security & Protection | 0 (0.0%) | 0 (0.0%) |
| Firefighting & Prevention | 0 (0.0%) | 0 (0.0%) |
| Law Enforcement | 0 (0.0%) | 0 (0.0%) |
| Food Preparation & Serving | 0 (0.0%) | 0 (0.0%) |
| Cleaning & Maintenance | 0 (0.0%) | 16 (100.0%) |
| Personal Care & Service | 0 (0.0%) | 0 (0.0%) |
| Total (Category) | 0 (0.0%) | 16 (100.0%) |
| Total (Overall) | 33 (47.8%) | 36 (52.2%) |
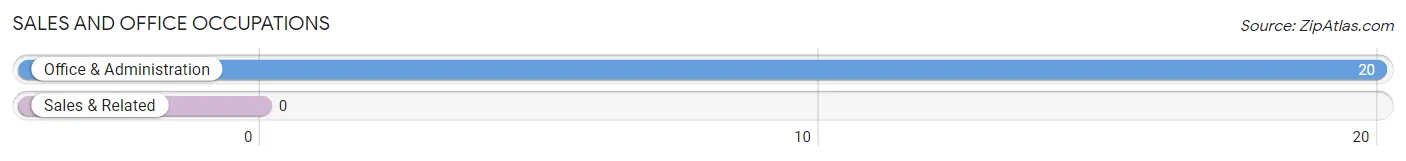
Sales and Office Occupations
The most common Sales and Office occupations in San Miguel are , and Office & Administration (20 | 29.0%).
Sales and Office Occupations by Sex

| Occupation | Male | Female |
| Sales & Related | 0 (0.0%) | 0 (0.0%) |
| Office & Administration | 0 (0.0%) | 20 (100.0%) |
| Total (Category) | 0 (0.0%) | 20 (100.0%) |
| Total (Overall) | 33 (47.8%) | 36 (52.2%) |
Natural Resources, Construction and Maintenance Occupations
The most common Natural Resources, Construction and Maintenance occupations in San Miguel are , and Construction & Extraction (17 | 24.6%).
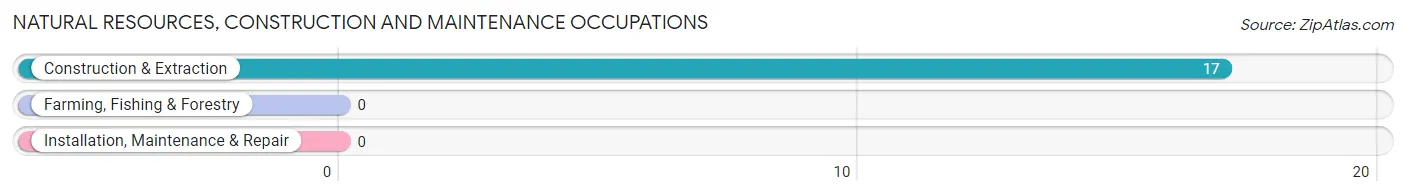
Natural Resources, Construction and Maintenance Occupations by Sex
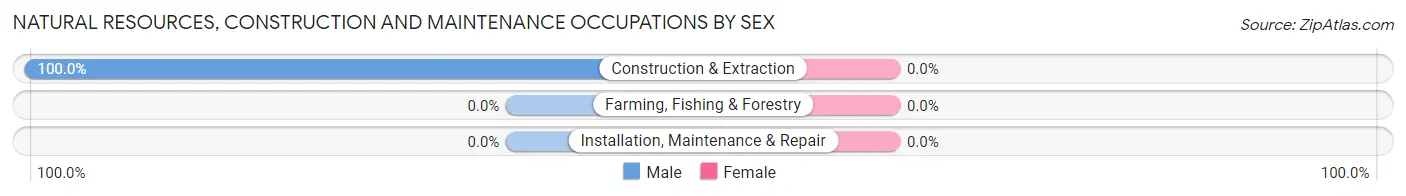
| Occupation | Male | Female |
| Farming, Fishing & Forestry | 0 (0.0%) | 0 (0.0%) |
| Construction & Extraction | 17 (100.0%) | 0 (0.0%) |
| Installation, Maintenance & Repair | 0 (0.0%) | 0 (0.0%) |
| Total (Category) | 17 (100.0%) | 0 (0.0%) |
| Total (Overall) | 33 (47.8%) | 36 (52.2%) |
Production, Transportation and Moving Occupations
The most common Production, Transportation and Moving occupations in San Miguel are , and Transportation (16 | 23.2%).
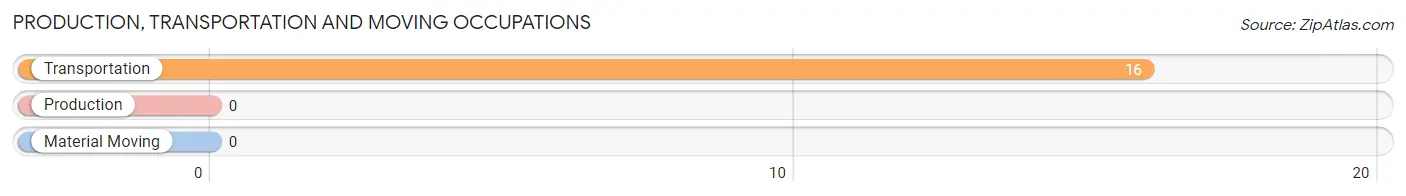
Production, Transportation and Moving Occupations by Sex
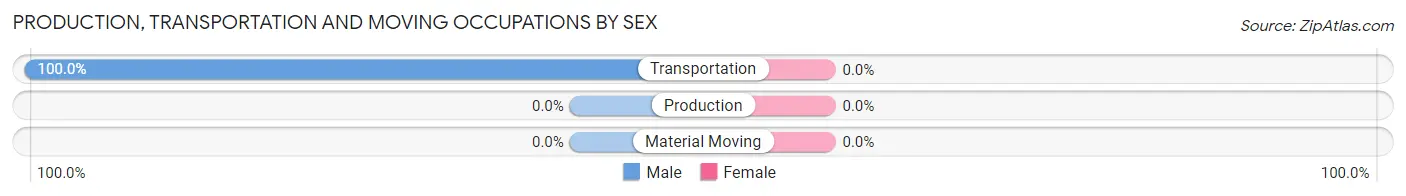
| Occupation | Male | Female |
| Production | 0 (0.0%) | 0 (0.0%) |
| Transportation | 16 (100.0%) | 0 (0.0%) |
| Material Moving | 0 (0.0%) | 0 (0.0%) |
| Total (Category) | 16 (100.0%) | 0 (0.0%) |
| Total (Overall) | 33 (47.8%) | 36 (52.2%) |
Employment Industries by Sex in San Miguel
Employment Industries in San Miguel
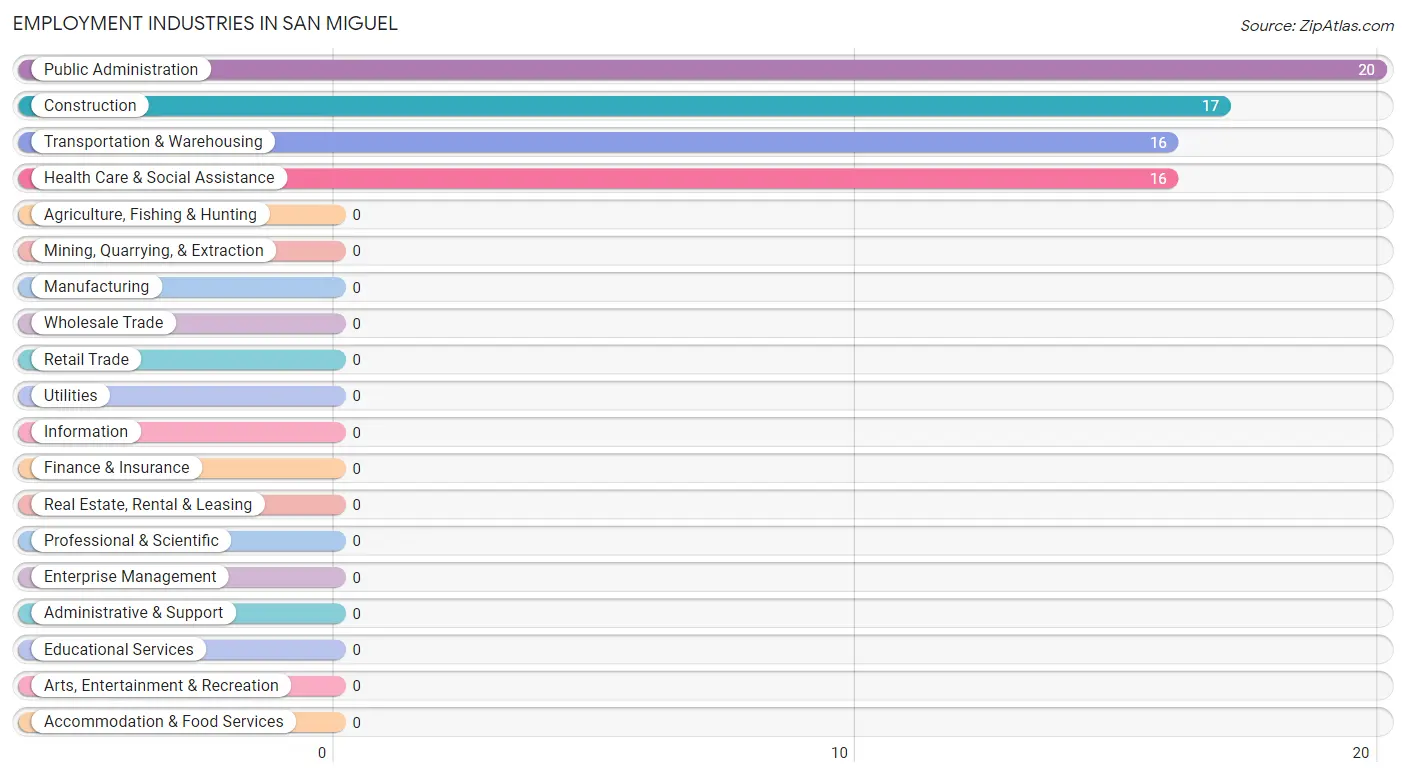
The major employment industries in San Miguel include Public Administration (20 | 29.0%), Construction (17 | 24.6%), Transportation & Warehousing (16 | 23.2%), and Health Care & Social Assistance (16 | 23.2%).
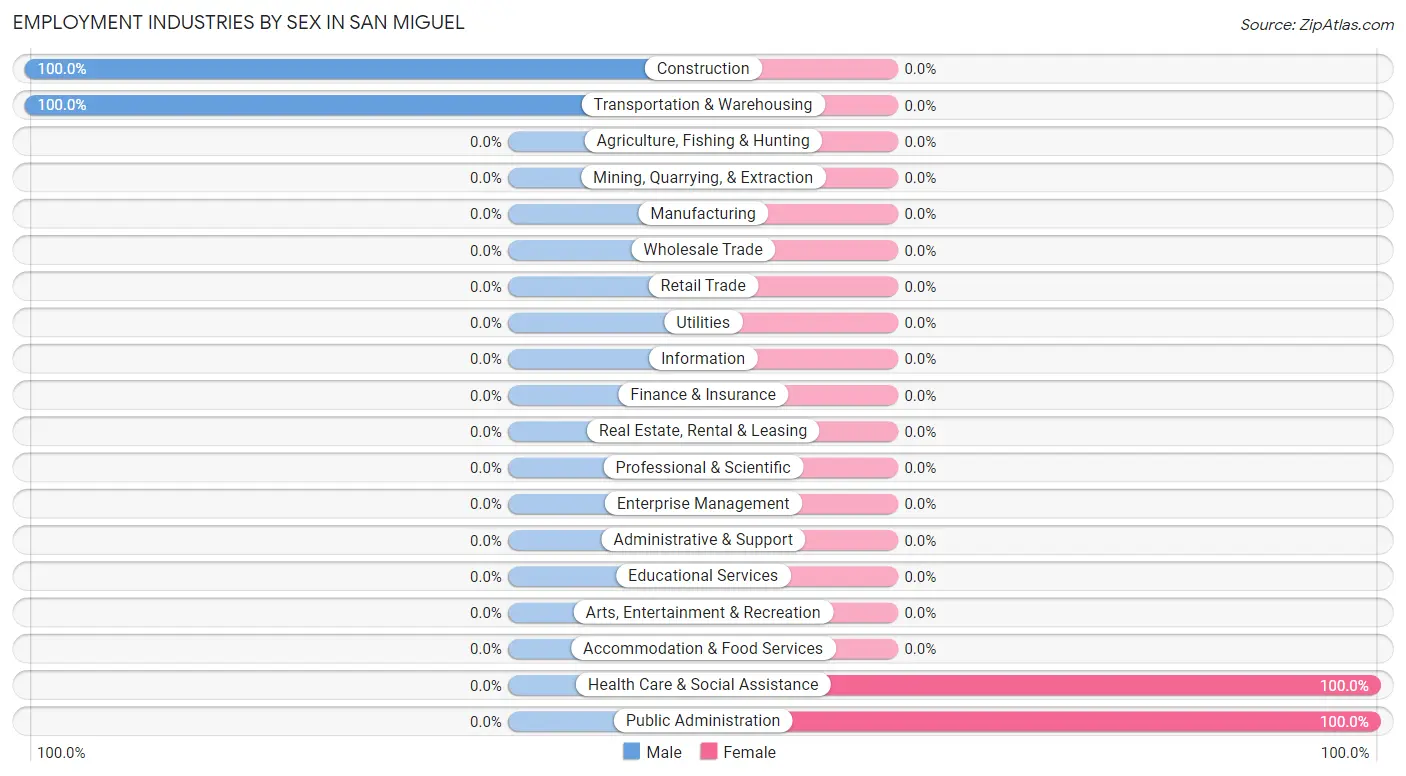
Employment Industries by Sex in San Miguel
The San Miguel industries that see more men than women are Construction (100.0%), and Transportation & Warehousing (100.0%), whereas the industries that tend to have a higher number of women are Health Care & Social Assistance (100.0%), and Public Administration (100.0%).
| Industry | Male | Female |
| Agriculture, Fishing & Hunting | 0 (0.0%) | 0 (0.0%) |
| Mining, Quarrying, & Extraction | 0 (0.0%) | 0 (0.0%) |
| Construction | 17 (100.0%) | 0 (0.0%) |
| Manufacturing | 0 (0.0%) | 0 (0.0%) |
| Wholesale Trade | 0 (0.0%) | 0 (0.0%) |
| Retail Trade | 0 (0.0%) | 0 (0.0%) |
| Transportation & Warehousing | 16 (100.0%) | 0 (0.0%) |
| Utilities | 0 (0.0%) | 0 (0.0%) |
| Information | 0 (0.0%) | 0 (0.0%) |
| Finance & Insurance | 0 (0.0%) | 0 (0.0%) |
| Real Estate, Rental & Leasing | 0 (0.0%) | 0 (0.0%) |
| Professional & Scientific | 0 (0.0%) | 0 (0.0%) |
| Enterprise Management | 0 (0.0%) | 0 (0.0%) |
| Administrative & Support | 0 (0.0%) | 0 (0.0%) |
| Educational Services | 0 (0.0%) | 0 (0.0%) |
| Health Care & Social Assistance | 0 (0.0%) | 16 (100.0%) |
| Arts, Entertainment & Recreation | 0 (0.0%) | 0 (0.0%) |
| Accommodation & Food Services | 0 (0.0%) | 0 (0.0%) |
| Public Administration | 0 (0.0%) | 20 (100.0%) |
| Total | 33 (47.8%) | 36 (52.2%) |
Education in San Miguel
School Enrollment in San Miguel
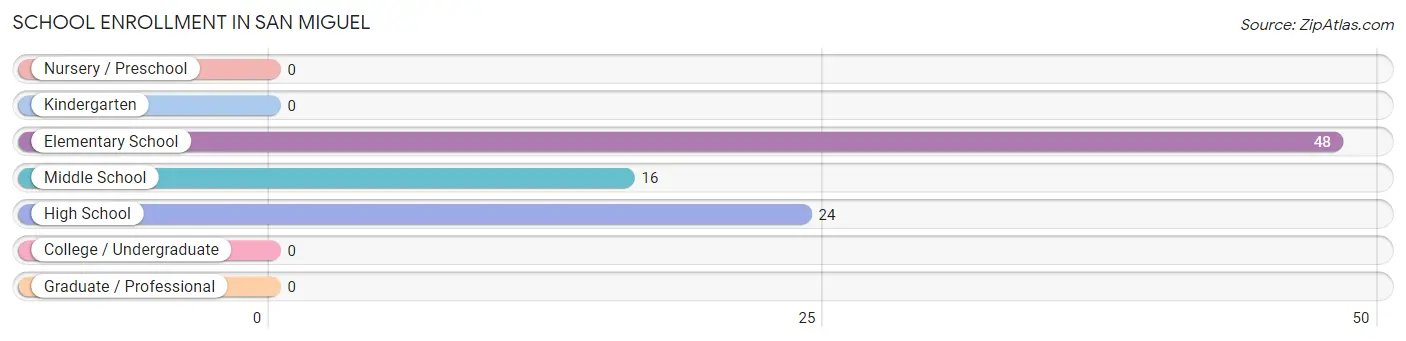
The most common levels of schooling among the 88 students in San Miguel are elementary school (48 | 54.5%), high school (24 | 27.3%), and middle school (16 | 18.2%).
| School Level | # Students | % Students |
| Nursery / Preschool | 0 | 0.0% |
| Kindergarten | 0 | 0.0% |
| Elementary School | 48 | 54.5% |
| Middle School | 16 | 18.2% |
| High School | 24 | 27.3% |
| College / Undergraduate | 0 | 0.0% |
| Graduate / Professional | 0 | 0.0% |
| Total | 88 | 100.0% |
School Enrollment by Age by Funding Source in San Miguel
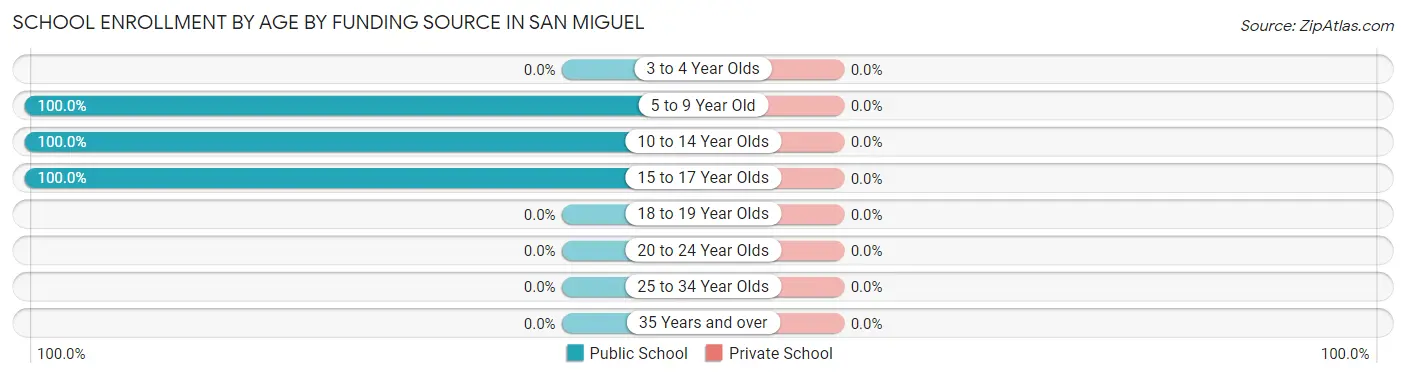
| Age Bracket | Public School | Private School |
| 3 to 4 Year Olds | 0 (0.0%) | 0 (0.0%) |
| 5 to 9 Year Old | 48 (100.0%) | 0 (0.0%) |
| 10 to 14 Year Olds | 29 (100.0%) | 0 (0.0%) |
| 15 to 17 Year Olds | 11 (100.0%) | 0 (0.0%) |
| 18 to 19 Year Olds | 0 (0.0%) | 0 (0.0%) |
| 20 to 24 Year Olds | 0 (0.0%) | 0 (0.0%) |
| 25 to 34 Year Olds | 0 (0.0%) | 0 (0.0%) |
| 35 Years and over | 0 (0.0%) | 0 (0.0%) |
| Total | 88 (100.0%) | 0 (0.0%) |
Educational Attainment by Field of Study in San Miguel
| Field of Study | # Graduates | % Graduates |
| Computers & Mathematics | 0 | 0.0% |
| Bio, Nature & Agricultural | 0 | 0.0% |
| Physical & Health Sciences | 0 | 0.0% |
| Psychology | 0 | 0.0% |
| Social Sciences | 0 | 0.0% |
| Engineering | 0 | 0.0% |
| Multidisciplinary Studies | 0 | 0.0% |
| Science & Technology | 0 | 0.0% |
| Business | 0 | 0.0% |
| Education | 0 | 0.0% |
| Literature & Languages | 0 | 0.0% |
| Liberal Arts & History | 0 | 0.0% |
| Visual & Performing Arts | 0 | 0.0% |
| Communications | 0 | 0.0% |
| Arts & Humanities | 0 | 0.0% |
| Total | 0 | 0.0% |
Transportation & Commute in San Miguel
Vehicle Availability by Sex in San Miguel
The most prevalent vehicle ownership categories in San Miguel are males with 3 vehicles (17, accounting for 51.5%) and females with 3 vehicles (0, making up 47.2%).
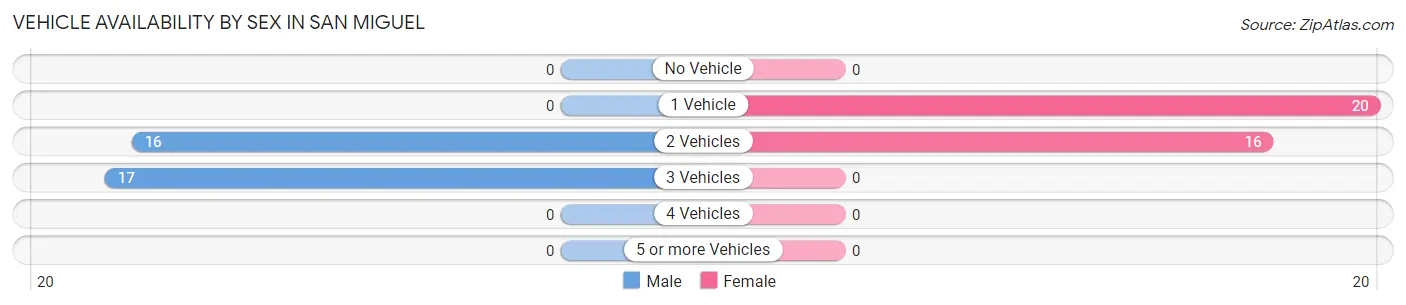
| Vehicles Available | Male | Female |
| No Vehicle | 0 (0.0%) | 0 (0.0%) |
| 1 Vehicle | 0 (0.0%) | 20 (55.6%) |
| 2 Vehicles | 16 (48.5%) | 16 (44.4%) |
| 3 Vehicles | 17 (51.5%) | 0 (0.0%) |
| 4 Vehicles | 0 (0.0%) | 0 (0.0%) |
| 5 or more Vehicles | 0 (0.0%) | 0 (0.0%) |
| Total | 33 (100.0%) | 36 (100.0%) |
Commute Time in San Miguel
The most frequently occuring commute durations in San Miguel are 25 to 29 minutes (20 commuters, 37.7%), 90 or more minutes (17 commuters, 32.1%), and 30 to 34 minutes (16 commuters, 30.2%).
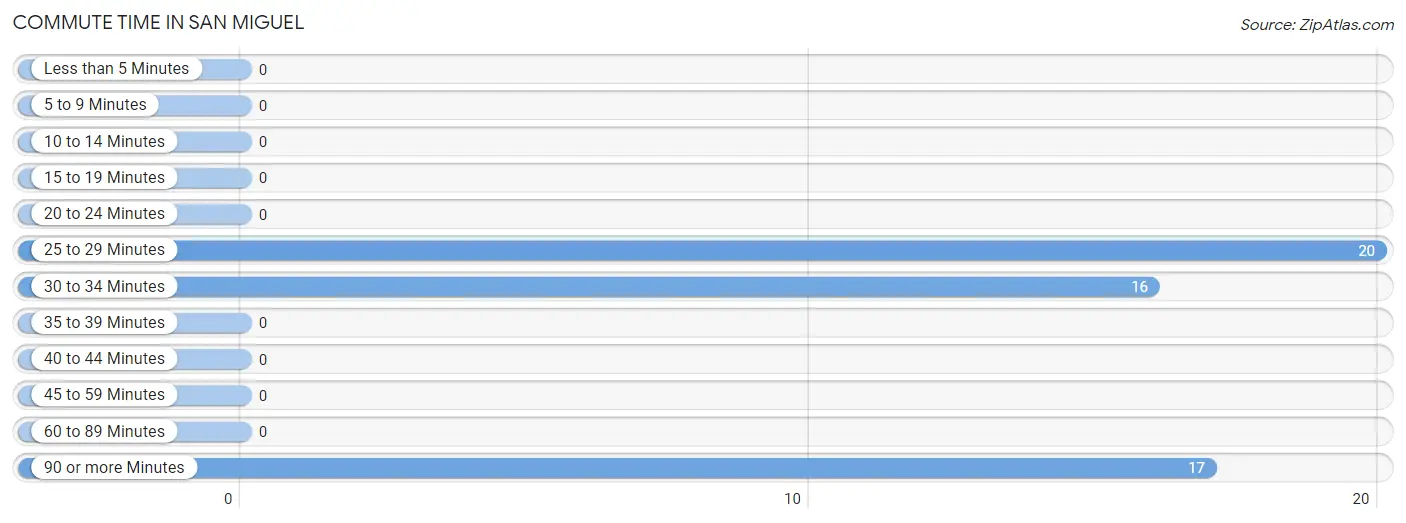
| Commute Time | # Commuters | % Commuters |
| Less than 5 Minutes | 0 | 0.0% |
| 5 to 9 Minutes | 0 | 0.0% |
| 10 to 14 Minutes | 0 | 0.0% |
| 15 to 19 Minutes | 0 | 0.0% |
| 20 to 24 Minutes | 0 | 0.0% |
| 25 to 29 Minutes | 20 | 37.7% |
| 30 to 34 Minutes | 16 | 30.2% |
| 35 to 39 Minutes | 0 | 0.0% |
| 40 to 44 Minutes | 0 | 0.0% |
| 45 to 59 Minutes | 0 | 0.0% |
| 60 to 89 Minutes | 0 | 0.0% |
| 90 or more Minutes | 17 | 32.1% |
Commute Time by Sex in San Miguel
The most common commute times in San Miguel are 90 or more minutes (17 commuters, 51.5%) for males and 25 to 29 minutes (20 commuters, 100.0%) for females.
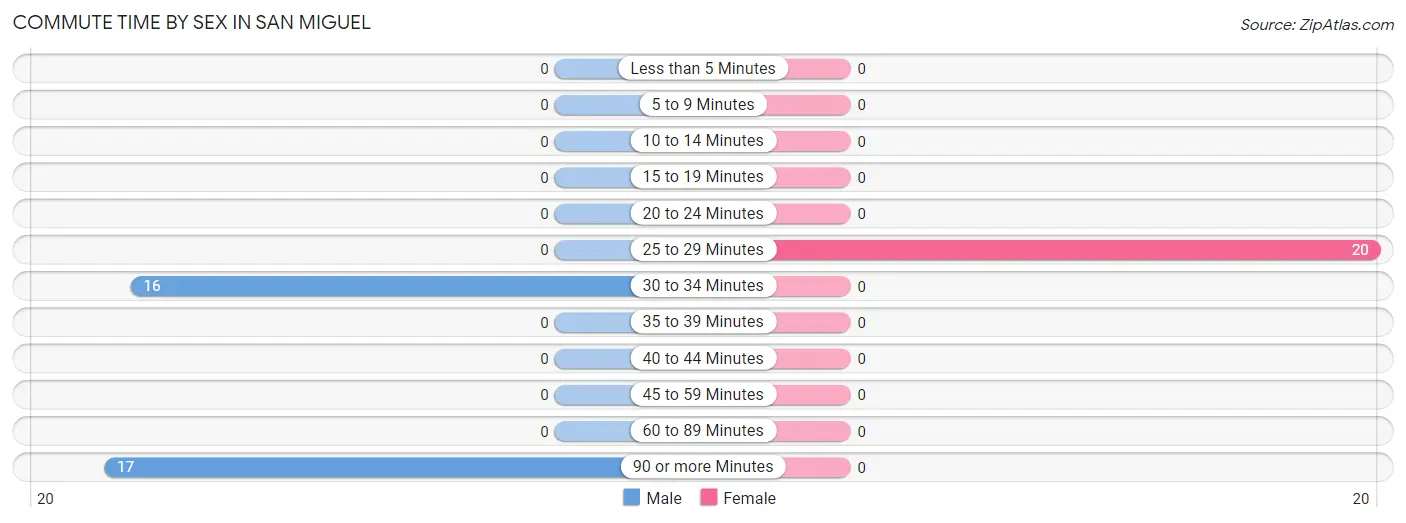
| Commute Time | Male | Female |
| Less than 5 Minutes | 0 (0.0%) | 0 (0.0%) |
| 5 to 9 Minutes | 0 (0.0%) | 0 (0.0%) |
| 10 to 14 Minutes | 0 (0.0%) | 0 (0.0%) |
| 15 to 19 Minutes | 0 (0.0%) | 0 (0.0%) |
| 20 to 24 Minutes | 0 (0.0%) | 0 (0.0%) |
| 25 to 29 Minutes | 0 (0.0%) | 20 (100.0%) |
| 30 to 34 Minutes | 16 (48.5%) | 0 (0.0%) |
| 35 to 39 Minutes | 0 (0.0%) | 0 (0.0%) |
| 40 to 44 Minutes | 0 (0.0%) | 0 (0.0%) |
| 45 to 59 Minutes | 0 (0.0%) | 0 (0.0%) |
| 60 to 89 Minutes | 0 (0.0%) | 0 (0.0%) |
| 90 or more Minutes | 17 (51.5%) | 0 (0.0%) |
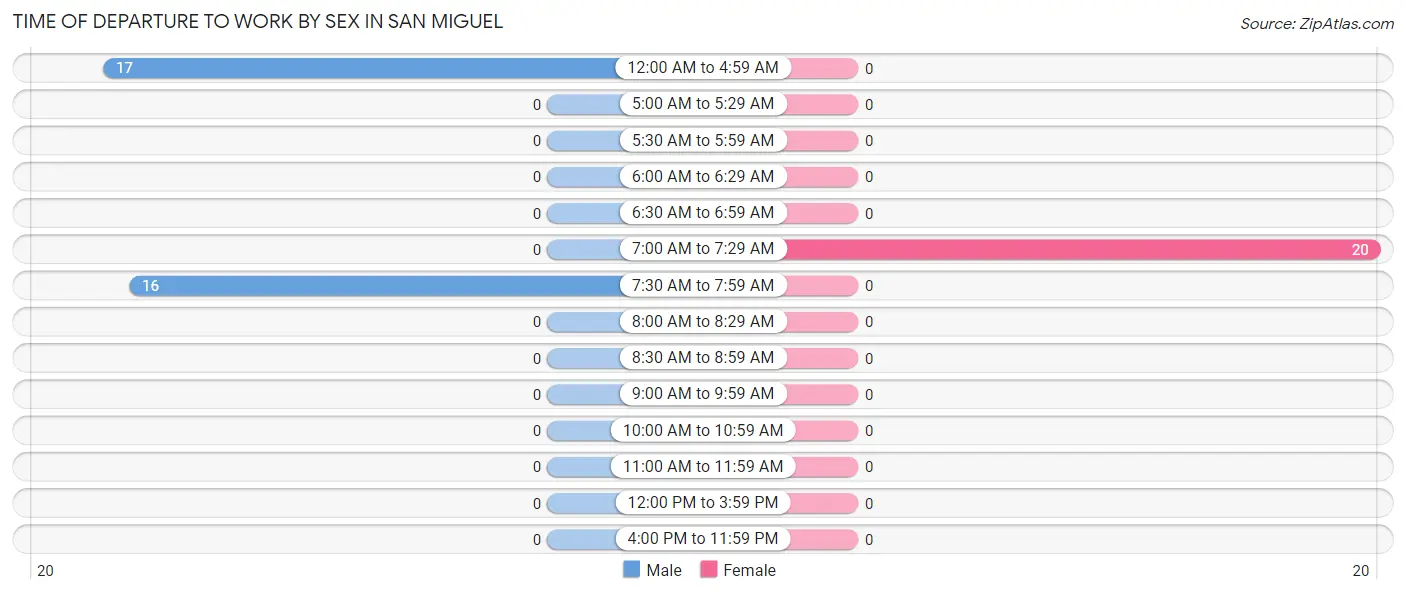
Time of Departure to Work by Sex in San Miguel
The most frequent times of departure to work in San Miguel are 12:00 AM to 4:59 AM (17, 51.5%) for males and 7:00 AM to 7:29 AM (20, 100.0%) for females.
| Time of Departure | Male | Female |
| 12:00 AM to 4:59 AM | 17 (51.5%) | 0 (0.0%) |
| 5:00 AM to 5:29 AM | 0 (0.0%) | 0 (0.0%) |
| 5:30 AM to 5:59 AM | 0 (0.0%) | 0 (0.0%) |
| 6:00 AM to 6:29 AM | 0 (0.0%) | 0 (0.0%) |
| 6:30 AM to 6:59 AM | 0 (0.0%) | 0 (0.0%) |
| 7:00 AM to 7:29 AM | 0 (0.0%) | 20 (100.0%) |
| 7:30 AM to 7:59 AM | 16 (48.5%) | 0 (0.0%) |
| 8:00 AM to 8:29 AM | 0 (0.0%) | 0 (0.0%) |
| 8:30 AM to 8:59 AM | 0 (0.0%) | 0 (0.0%) |
| 9:00 AM to 9:59 AM | 0 (0.0%) | 0 (0.0%) |
| 10:00 AM to 10:59 AM | 0 (0.0%) | 0 (0.0%) |
| 11:00 AM to 11:59 AM | 0 (0.0%) | 0 (0.0%) |
| 12:00 PM to 3:59 PM | 0 (0.0%) | 0 (0.0%) |
| 4:00 PM to 11:59 PM | 0 (0.0%) | 0 (0.0%) |
| Total | 33 (100.0%) | 20 (100.0%) |
Housing Occupancy in San Miguel
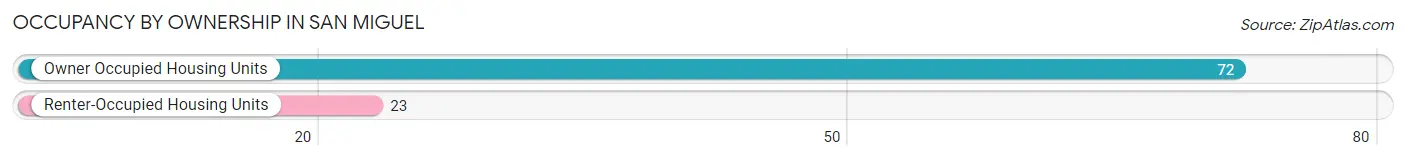
Occupancy by Ownership in San Miguel
Of the total 95 dwellings in San Miguel, owner-occupied units account for 72 (75.8%), while renter-occupied units make up 23 (24.2%).
| Occupancy | # Housing Units | % Housing Units |
| Owner Occupied Housing Units | 72 | 75.8% |
| Renter-Occupied Housing Units | 23 | 24.2% |
| Total Occupied Housing Units | 95 | 100.0% |
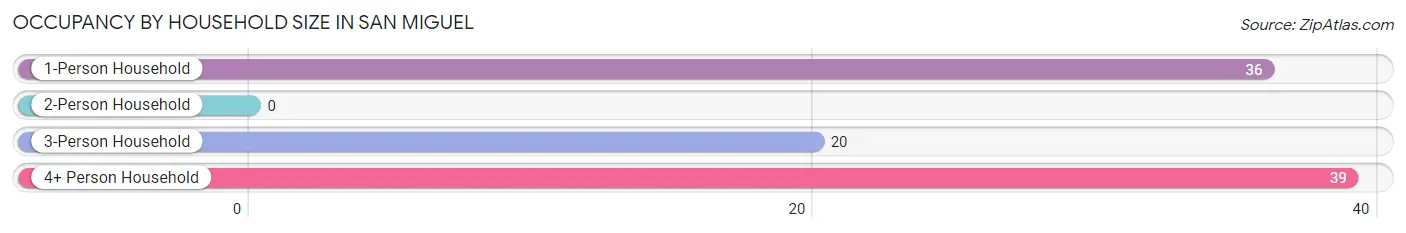
Occupancy by Household Size in San Miguel
| Household Size | # Housing Units | % Housing Units |
| 1-Person Household | 36 | 37.9% |
| 2-Person Household | 0 | 0.0% |
| 3-Person Household | 20 | 21.0% |
| 4+ Person Household | 39 | 41.0% |
| Total Housing Units | 95 | 100.0% |
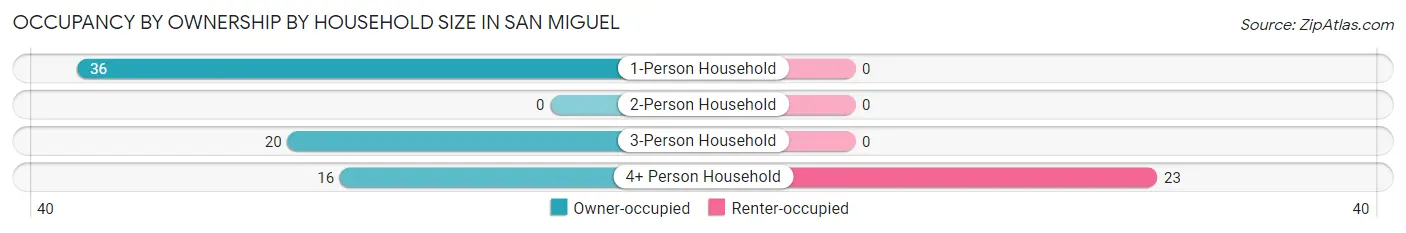
Occupancy by Ownership by Household Size in San Miguel
| Household Size | Owner-occupied | Renter-occupied |
| 1-Person Household | 36 (100.0%) | 0 (0.0%) |
| 2-Person Household | 0 (0.0%) | 0 (0.0%) |
| 3-Person Household | 20 (100.0%) | 0 (0.0%) |
| 4+ Person Household | 16 (41.0%) | 23 (59.0%) |
| Total Housing Units | 72 (75.8%) | 23 (24.2%) |
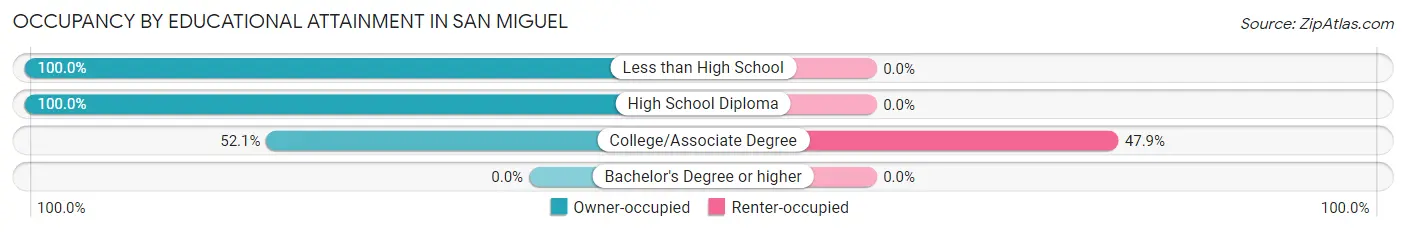
Occupancy by Educational Attainment in San Miguel
| Household Size | Owner-occupied | Renter-occupied |
| Less than High School | 10 (100.0%) | 0 (0.0%) |
| High School Diploma | 37 (100.0%) | 0 (0.0%) |
| College/Associate Degree | 25 (52.1%) | 23 (47.9%) |
| Bachelor's Degree or higher | 0 (0.0%) | 0 (0.0%) |
Occupancy by Age of Householder in San Miguel
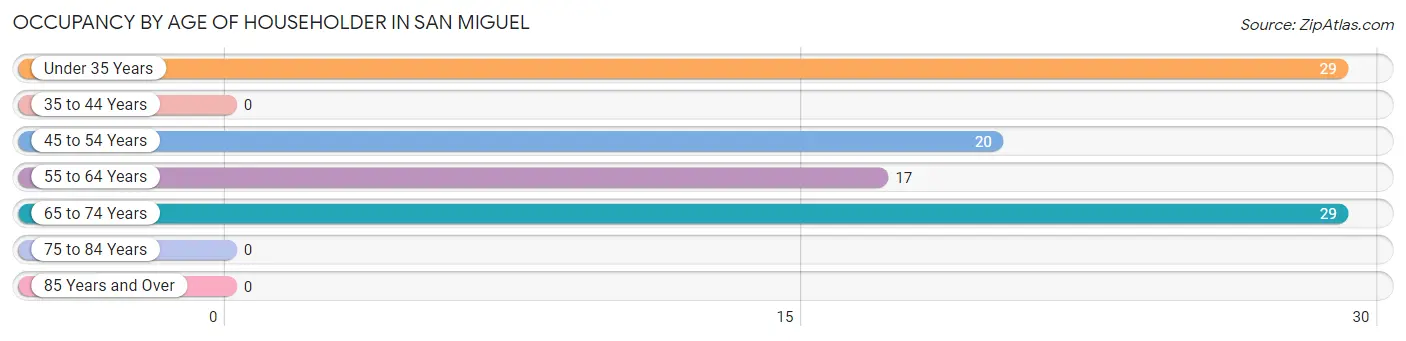
| Age Bracket | # Households | % Households |
| Under 35 Years | 29 | 30.5% |
| 35 to 44 Years | 0 | 0.0% |
| 45 to 54 Years | 20 | 21.0% |
| 55 to 64 Years | 17 | 17.9% |
| 65 to 74 Years | 29 | 30.5% |
| 75 to 84 Years | 0 | 0.0% |
| 85 Years and Over | 0 | 0.0% |
| Total | 95 | 100.0% |
Housing Finances in San Miguel
Median Income by Occupancy in San Miguel
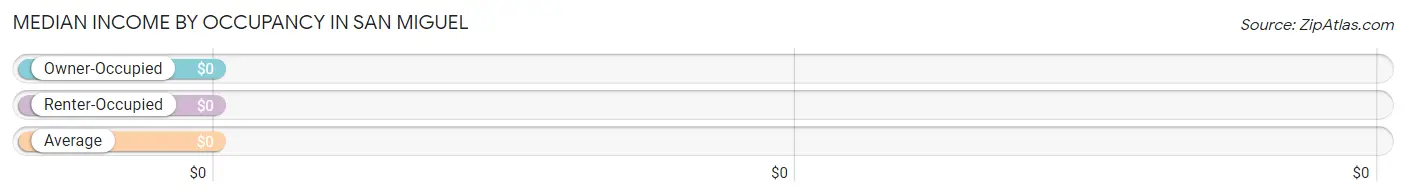
| Occupancy Type | # Households | Median Income |
| Owner-Occupied | 72 (75.8%) | $0 |
| Renter-Occupied | 23 (24.2%) | $0 |
| Average | 95 (100.0%) | $0 |
Occupancy by Householder Income Bracket in San Miguel
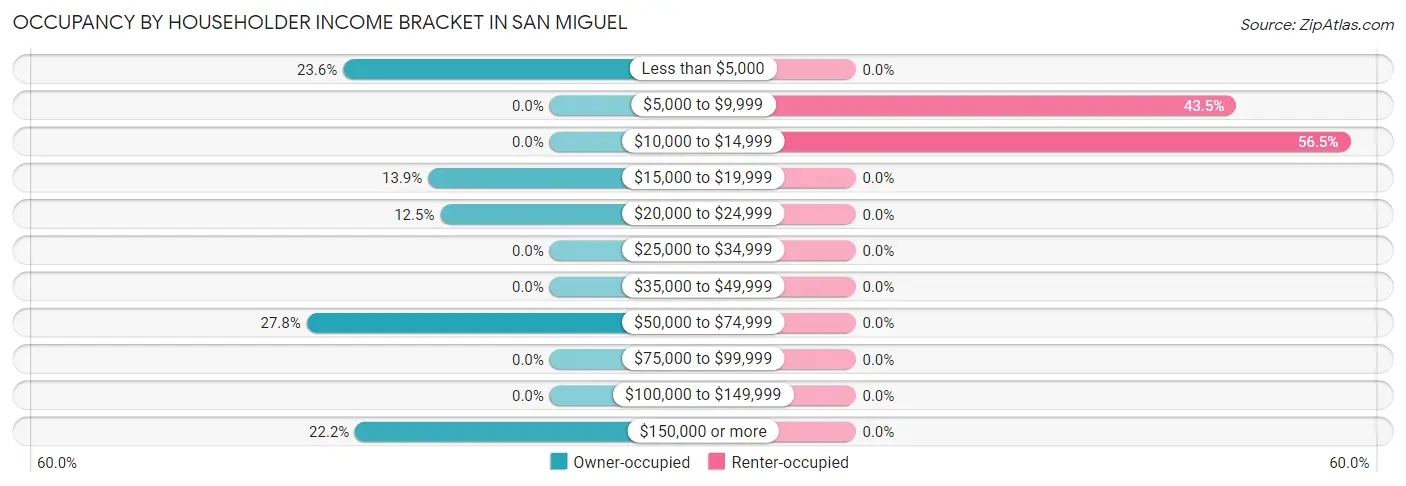
| Income Bracket | Owner-occupied | Renter-occupied |
| Less than $5,000 | 17 (23.6%) | 0 (0.0%) |
| $5,000 to $9,999 | 0 (0.0%) | 10 (43.5%) |
| $10,000 to $14,999 | 0 (0.0%) | 13 (56.5%) |
| $15,000 to $19,999 | 10 (13.9%) | 0 (0.0%) |
| $20,000 to $24,999 | 9 (12.5%) | 0 (0.0%) |
| $25,000 to $34,999 | 0 (0.0%) | 0 (0.0%) |
| $35,000 to $49,999 | 0 (0.0%) | 0 (0.0%) |
| $50,000 to $74,999 | 20 (27.8%) | 0 (0.0%) |
| $75,000 to $99,999 | 0 (0.0%) | 0 (0.0%) |
| $100,000 to $149,999 | 0 (0.0%) | 0 (0.0%) |
| $150,000 or more | 16 (22.2%) | 0 (0.0%) |
| Total | 72 (100.0%) | 23 (100.0%) |
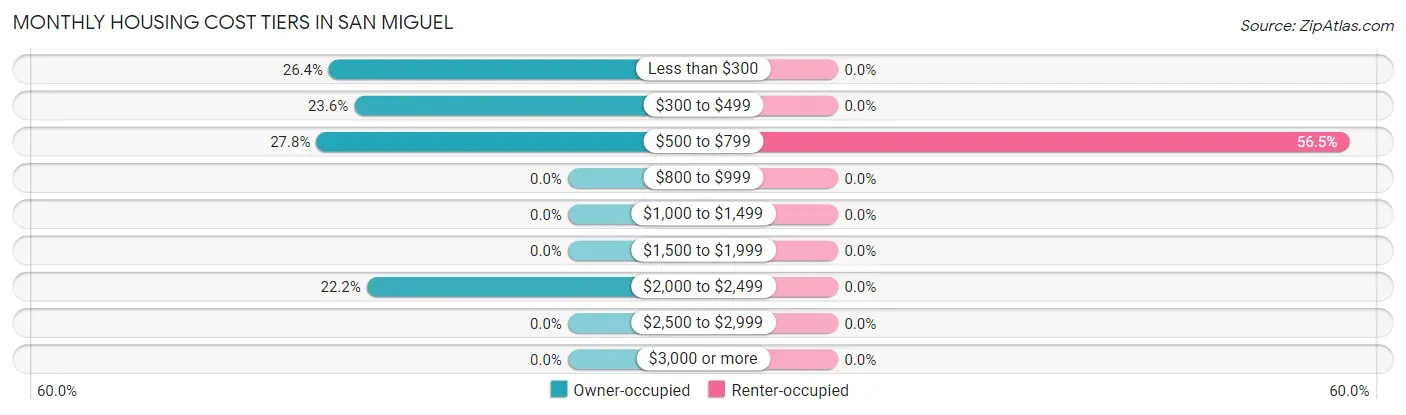
Monthly Housing Cost Tiers in San Miguel
| Monthly Cost | Owner-occupied | Renter-occupied |
| Less than $300 | 19 (26.4%) | 0 (0.0%) |
| $300 to $499 | 17 (23.6%) | 0 (0.0%) |
| $500 to $799 | 20 (27.8%) | 13 (56.5%) |
| $800 to $999 | 0 (0.0%) | 0 (0.0%) |
| $1,000 to $1,499 | 0 (0.0%) | 0 (0.0%) |
| $1,500 to $1,999 | 0 (0.0%) | 0 (0.0%) |
| $2,000 to $2,499 | 16 (22.2%) | 0 (0.0%) |
| $2,500 to $2,999 | 0 (0.0%) | 0 (0.0%) |
| $3,000 or more | 0 (0.0%) | 0 (0.0%) |
| Total | 72 (100.0%) | 23 (100.0%) |
Physical Housing Characteristics in San Miguel
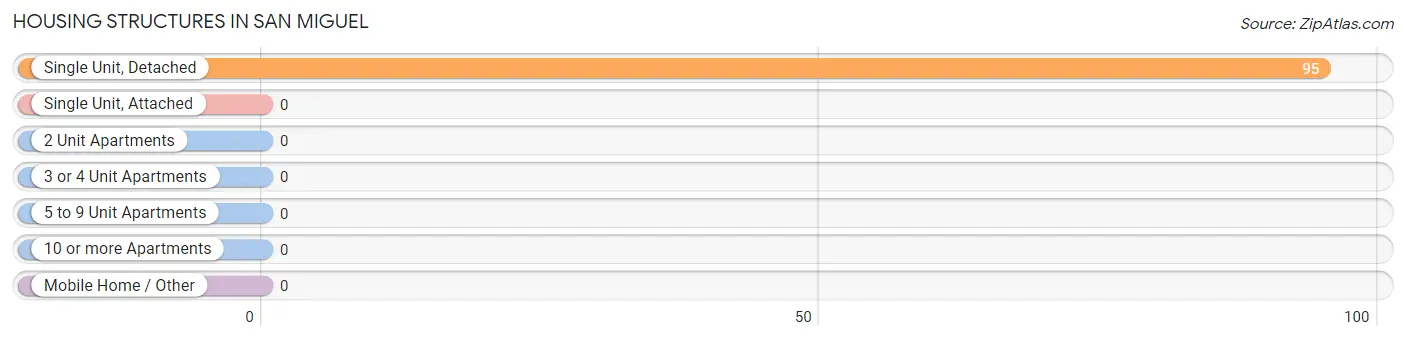
Housing Structures in San Miguel
| Structure Type | # Housing Units | % Housing Units |
| Single Unit, Detached | 95 | 100.0% |
| Single Unit, Attached | 0 | 0.0% |
| 2 Unit Apartments | 0 | 0.0% |
| 3 or 4 Unit Apartments | 0 | 0.0% |
| 5 to 9 Unit Apartments | 0 | 0.0% |
| 10 or more Apartments | 0 | 0.0% |
| Mobile Home / Other | 0 | 0.0% |
| Total | 95 | 100.0% |
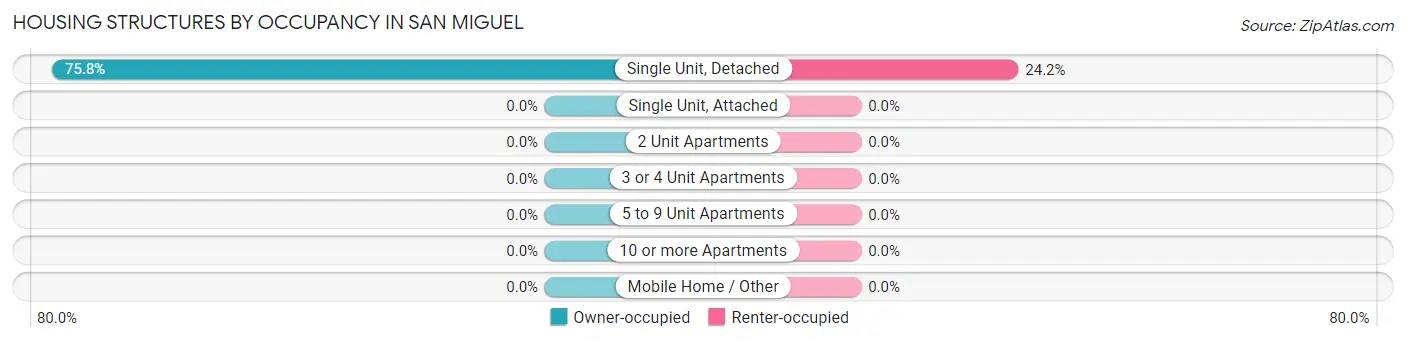
Housing Structures by Occupancy in San Miguel
| Structure Type | Owner-occupied | Renter-occupied |
| Single Unit, Detached | 72 (75.8%) | 23 (24.2%) |
| Single Unit, Attached | 0 (0.0%) | 0 (0.0%) |
| 2 Unit Apartments | 0 (0.0%) | 0 (0.0%) |
| 3 or 4 Unit Apartments | 0 (0.0%) | 0 (0.0%) |
| 5 to 9 Unit Apartments | 0 (0.0%) | 0 (0.0%) |
| 10 or more Apartments | 0 (0.0%) | 0 (0.0%) |
| Mobile Home / Other | 0 (0.0%) | 0 (0.0%) |
| Total | 72 (75.8%) | 23 (24.2%) |
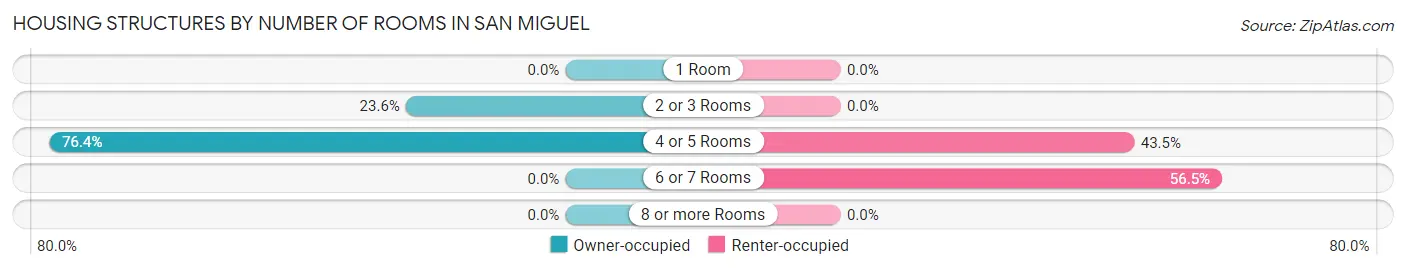
Housing Structures by Number of Rooms in San Miguel
| Number of Rooms | Owner-occupied | Renter-occupied |
| 1 Room | 0 (0.0%) | 0 (0.0%) |
| 2 or 3 Rooms | 17 (23.6%) | 0 (0.0%) |
| 4 or 5 Rooms | 55 (76.4%) | 10 (43.5%) |
| 6 or 7 Rooms | 0 (0.0%) | 13 (56.5%) |
| 8 or more Rooms | 0 (0.0%) | 0 (0.0%) |
| Total | 72 (100.0%) | 23 (100.0%) |
Housing Structure by Heating Type in San Miguel
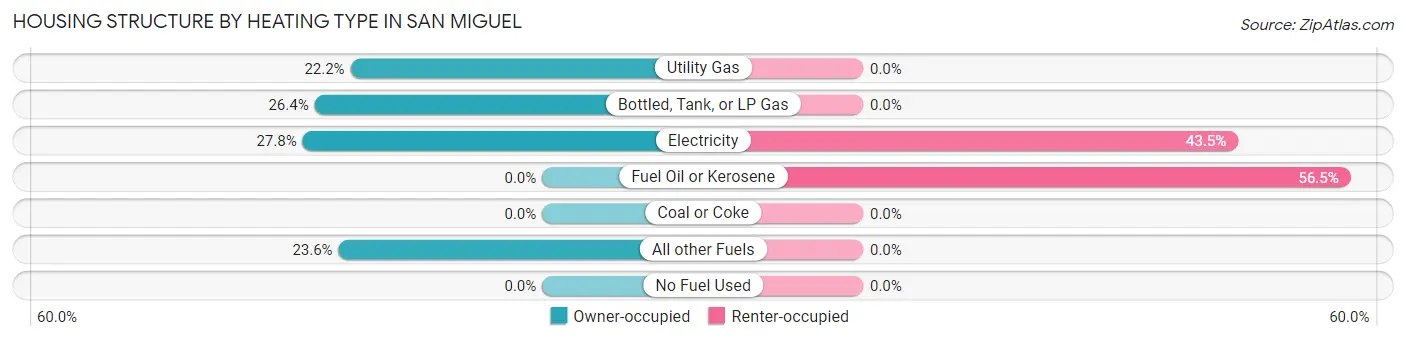
| Heating Type | Owner-occupied | Renter-occupied |
| Utility Gas | 16 (22.2%) | 0 (0.0%) |
| Bottled, Tank, or LP Gas | 19 (26.4%) | 0 (0.0%) |
| Electricity | 20 (27.8%) | 10 (43.5%) |
| Fuel Oil or Kerosene | 0 (0.0%) | 13 (56.5%) |
| Coal or Coke | 0 (0.0%) | 0 (0.0%) |
| All other Fuels | 17 (23.6%) | 0 (0.0%) |
| No Fuel Used | 0 (0.0%) | 0 (0.0%) |
| Total | 72 (100.0%) | 23 (100.0%) |
Household Vehicle Usage in San Miguel
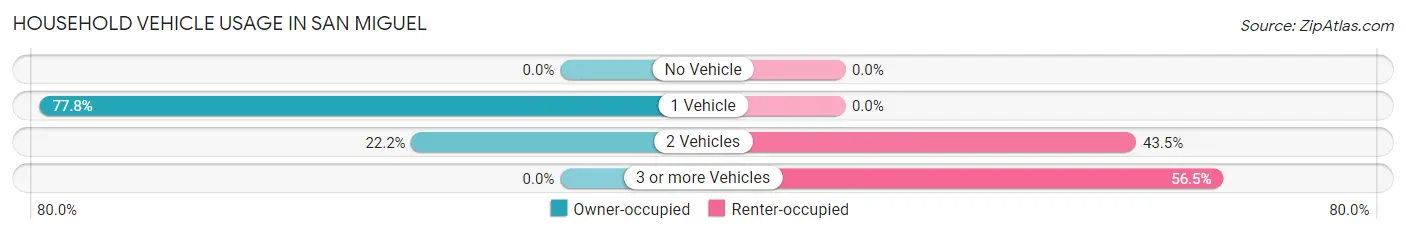
| Vehicles per Household | Owner-occupied | Renter-occupied |
| No Vehicle | 0 (0.0%) | 0 (0.0%) |
| 1 Vehicle | 56 (77.8%) | 0 (0.0%) |
| 2 Vehicles | 16 (22.2%) | 10 (43.5%) |
| 3 or more Vehicles | 0 (0.0%) | 13 (56.5%) |
| Total | 72 (100.0%) | 23 (100.0%) |
Real Estate & Mortgages in San Miguel
Real Estate and Mortgage Overview in San Miguel
| Characteristic | Without Mortgage | With Mortgage |
| Housing Units | 56 | 16 |
| Median Property Value | - | - |
| Median Household Income | - | - |
| Monthly Housing Costs | $376 | $0 |
| Real Estate Taxes | - | - |
Property Value by Mortgage Status in San Miguel
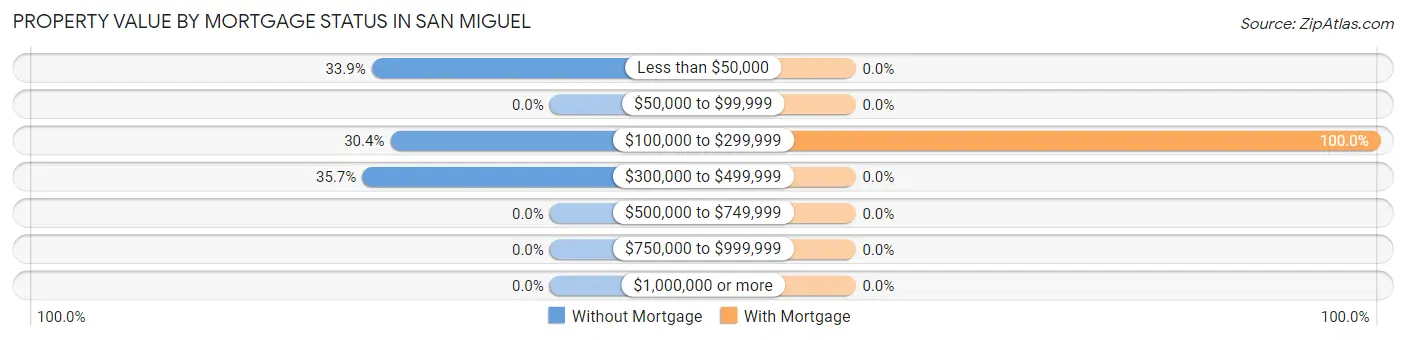
| Property Value | Without Mortgage | With Mortgage |
| Less than $50,000 | 19 (33.9%) | 0 (0.0%) |
| $50,000 to $99,999 | 0 (0.0%) | 0 (0.0%) |
| $100,000 to $299,999 | 17 (30.4%) | 16 (100.0%) |
| $300,000 to $499,999 | 20 (35.7%) | 0 (0.0%) |
| $500,000 to $749,999 | 0 (0.0%) | 0 (0.0%) |
| $750,000 to $999,999 | 0 (0.0%) | 0 (0.0%) |
| $1,000,000 or more | 0 (0.0%) | 0 (0.0%) |
| Total | 56 (100.0%) | 16 (100.0%) |
Household Income by Mortgage Status in San Miguel
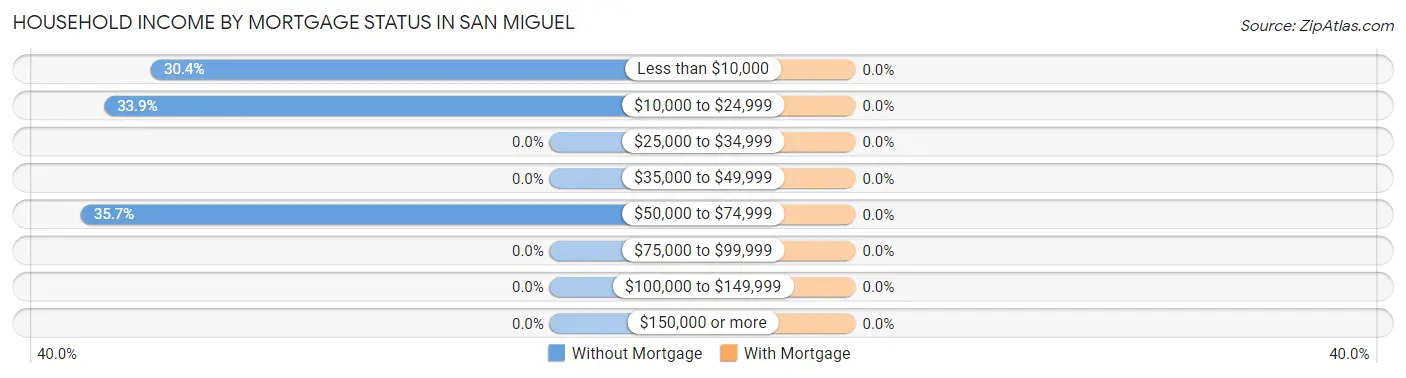
| Household Income | Without Mortgage | With Mortgage |
| Less than $10,000 | 17 (30.4%) | 0 (0.0%) |
| $10,000 to $24,999 | 19 (33.9%) | 0 (0.0%) |
| $25,000 to $34,999 | 0 (0.0%) | 0 (0.0%) |
| $35,000 to $49,999 | 0 (0.0%) | 0 (0.0%) |
| $50,000 to $74,999 | 20 (35.7%) | 0 (0.0%) |
| $75,000 to $99,999 | 0 (0.0%) | 0 (0.0%) |
| $100,000 to $149,999 | 0 (0.0%) | 0 (0.0%) |
| $150,000 or more | 0 (0.0%) | 0 (0.0%) |
| Total | 56 (100.0%) | 16 (100.0%) |
Property Value to Household Income Ratio in San Miguel
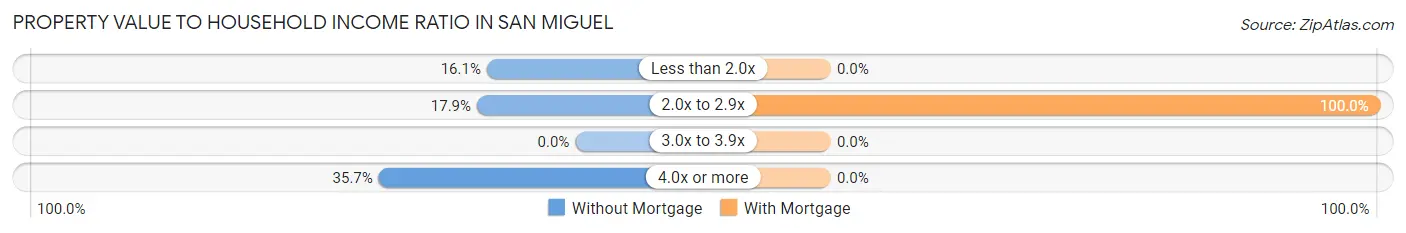
| Value-to-Income Ratio | Without Mortgage | With Mortgage |
| Less than 2.0x | 9 (16.1%) | 0 (0.0%) |
| 2.0x to 2.9x | 10 (17.9%) | 16 (100.0%) |
| 3.0x to 3.9x | 0 (0.0%) | 0 (0.0%) |
| 4.0x or more | 20 (35.7%) | 0 (0.0%) |
| Total | 56 (100.0%) | 16 (100.0%) |
Real Estate Taxes by Mortgage Status in San Miguel
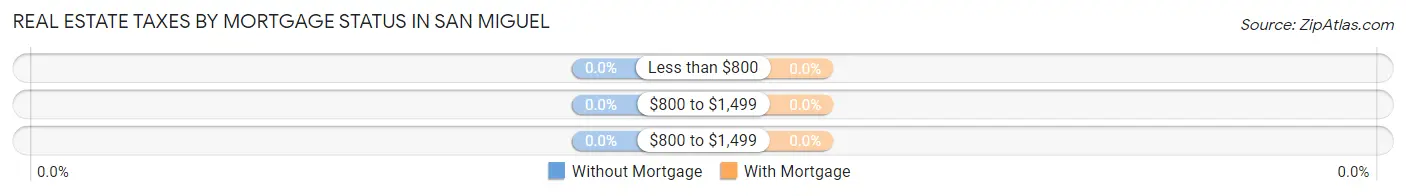
| Property Taxes | Without Mortgage | With Mortgage |
| Less than $800 | 0 (0.0%) | 0 (0.0%) |
| $800 to $1,499 | 0 (0.0%) | 0 (0.0%) |
| $800 to $1,499 | 0 (0.0%) | 0 (0.0%) |
| Total | 56 (100.0%) | 16 (100.0%) |
Health & Disability in San Miguel
Health Insurance Coverage by Age in San Miguel
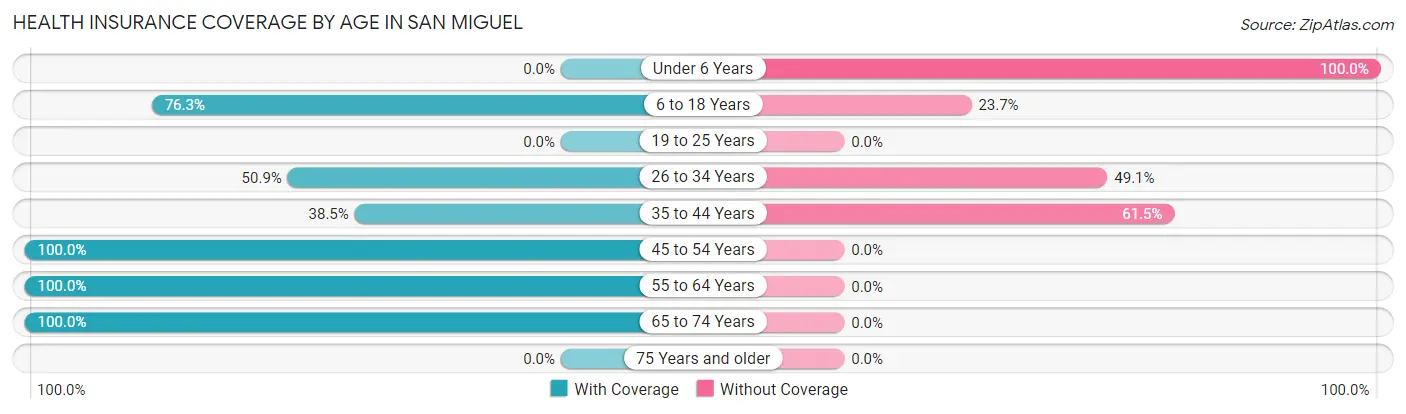
| Age Bracket | With Coverage | Without Coverage |
| Under 6 Years | 0 (0.0%) | 19 (100.0%) |
| 6 to 18 Years | 74 (76.3%) | 23 (23.7%) |
| 19 to 25 Years | 0 (0.0%) | 0 (0.0%) |
| 26 to 34 Years | 54 (50.9%) | 52 (49.1%) |
| 35 to 44 Years | 10 (38.5%) | 16 (61.5%) |
| 45 to 54 Years | 20 (100.0%) | 0 (0.0%) |
| 55 to 64 Years | 17 (100.0%) | 0 (0.0%) |
| 65 to 74 Years | 29 (100.0%) | 0 (0.0%) |
| 75 Years and older | 0 (0.0%) | 0 (0.0%) |
| Total | 204 (65.0%) | 110 (35.0%) |
Health Insurance Coverage by Citizenship Status in San Miguel
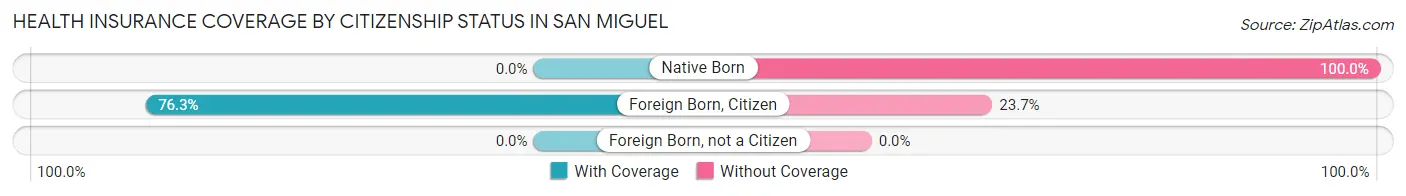
| Citizenship Status | With Coverage | Without Coverage |
| Native Born | 0 (0.0%) | 19 (100.0%) |
| Foreign Born, Citizen | 74 (76.3%) | 23 (23.7%) |
| Foreign Born, not a Citizen | 0 (0.0%) | 0 (0.0%) |
Health Insurance Coverage by Household Income in San Miguel
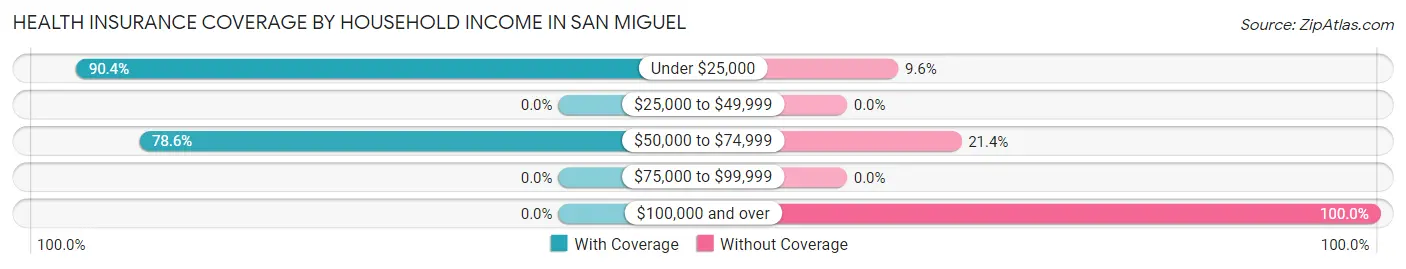
| Household Income | With Coverage | Without Coverage |
| Under $25,000 | 160 (90.4%) | 17 (9.6%) |
| $25,000 to $49,999 | 0 (0.0%) | 0 (0.0%) |
| $50,000 to $74,999 | 44 (78.6%) | 12 (21.4%) |
| $75,000 to $99,999 | 0 (0.0%) | 0 (0.0%) |
| $100,000 and over | 0 (0.0%) | 81 (100.0%) |
Public vs Private Health Insurance Coverage by Age in San Miguel
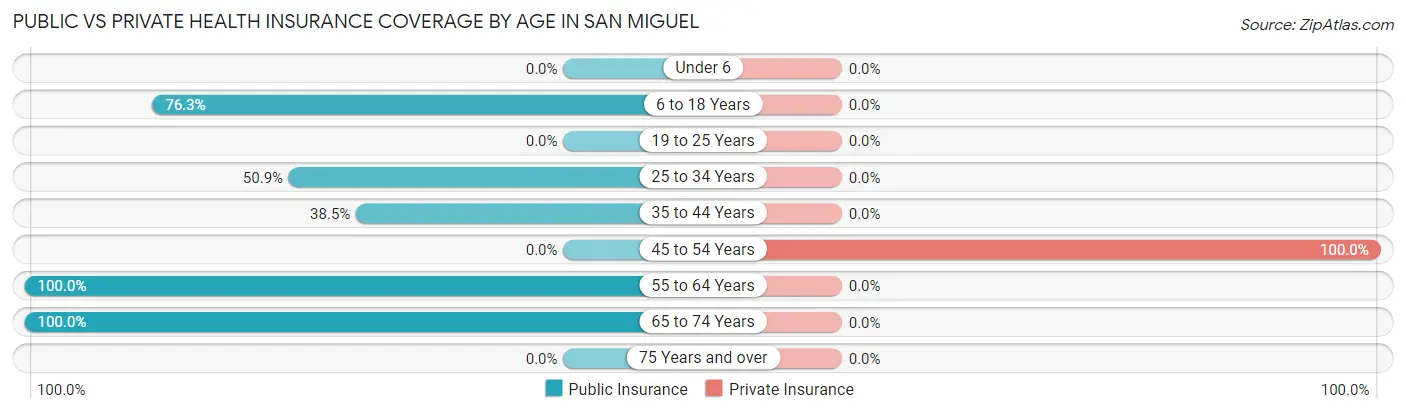
| Age Bracket | Public Insurance | Private Insurance |
| Under 6 | 0 (0.0%) | 0 (0.0%) |
| 6 to 18 Years | 74 (76.3%) | 0 (0.0%) |
| 19 to 25 Years | 0 (0.0%) | 0 (0.0%) |
| 25 to 34 Years | 54 (50.9%) | 0 (0.0%) |
| 35 to 44 Years | 10 (38.5%) | 0 (0.0%) |
| 45 to 54 Years | 0 (0.0%) | 20 (100.0%) |
| 55 to 64 Years | 17 (100.0%) | 0 (0.0%) |
| 65 to 74 Years | 29 (100.0%) | 0 (0.0%) |
| 75 Years and over | 0 (0.0%) | 0 (0.0%) |
| Total | 184 (58.6%) | 20 (6.4%) |
Disability Status by Sex by Age in San Miguel
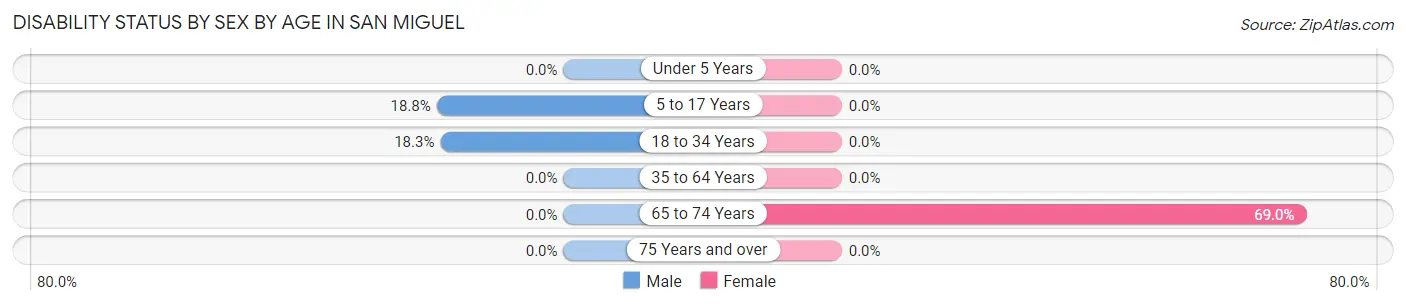
| Age Bracket | Male | Female |
| Under 5 Years | 0 (0.0%) | 0 (0.0%) |
| 5 to 17 Years | 16 (18.8%) | 0 (0.0%) |
| 18 to 34 Years | 17 (18.3%) | 0 (0.0%) |
| 35 to 64 Years | 0 (0.0%) | 0 (0.0%) |
| 65 to 74 Years | 0 (0.0%) | 20 (69.0%) |
| 75 Years and over | 0 (0.0%) | 0 (0.0%) |
Disability Class by Sex by Age in San Miguel
Disability Class: Hearing Difficulty
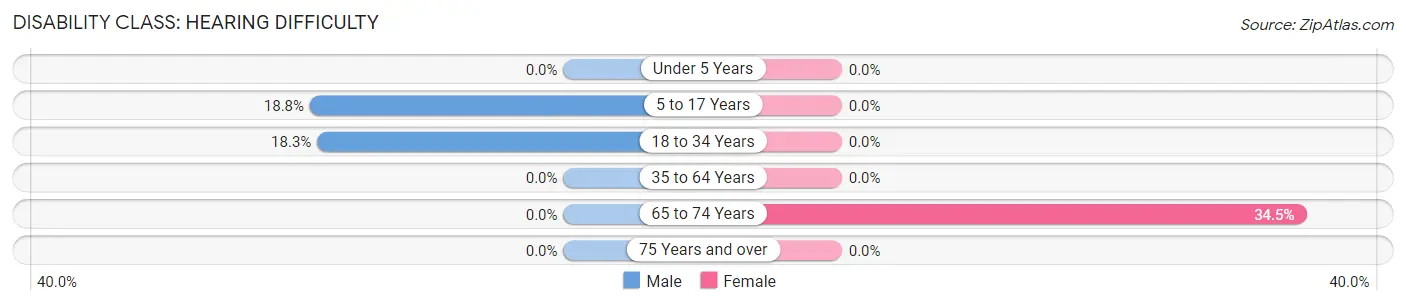
| Age Bracket | Male | Female |
| Under 5 Years | 0 (0.0%) | 0 (0.0%) |
| 5 to 17 Years | 16 (18.8%) | 0 (0.0%) |
| 18 to 34 Years | 17 (18.3%) | 0 (0.0%) |
| 35 to 64 Years | 0 (0.0%) | 0 (0.0%) |
| 65 to 74 Years | 0 (0.0%) | 10 (34.5%) |
| 75 Years and over | 0 (0.0%) | 0 (0.0%) |
Disability Class: Vision Difficulty
| Age Bracket | Male | Female |
| Under 5 Years | 0 (0.0%) | 0 (0.0%) |
| 5 to 17 Years | 0 (0.0%) | 0 (0.0%) |
| 18 to 34 Years | 0 (0.0%) | 0 (0.0%) |
| 35 to 64 Years | 0 (0.0%) | 0 (0.0%) |
| 65 to 74 Years | 0 (0.0%) | 0 (0.0%) |
| 75 Years and over | 0 (0.0%) | 0 (0.0%) |
Disability Class: Cognitive Difficulty
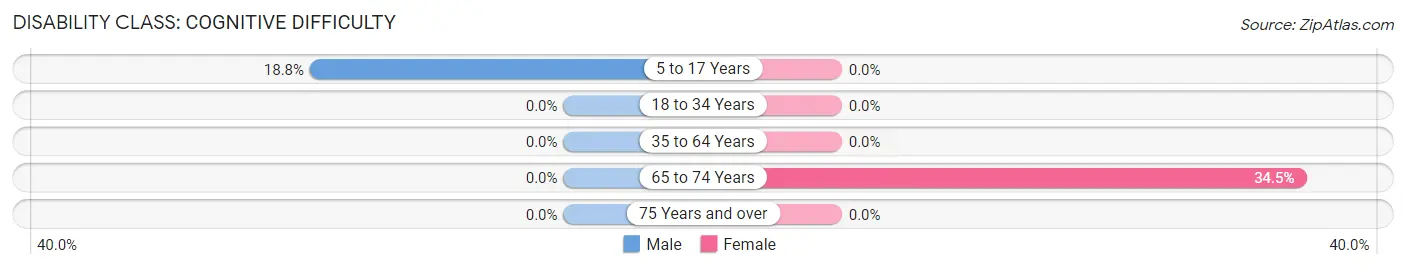
| Age Bracket | Male | Female |
| 5 to 17 Years | 16 (18.8%) | 0 (0.0%) |
| 18 to 34 Years | 0 (0.0%) | 0 (0.0%) |
| 35 to 64 Years | 0 (0.0%) | 0 (0.0%) |
| 65 to 74 Years | 0 (0.0%) | 10 (34.5%) |
| 75 Years and over | 0 (0.0%) | 0 (0.0%) |
Disability Class: Ambulatory Difficulty
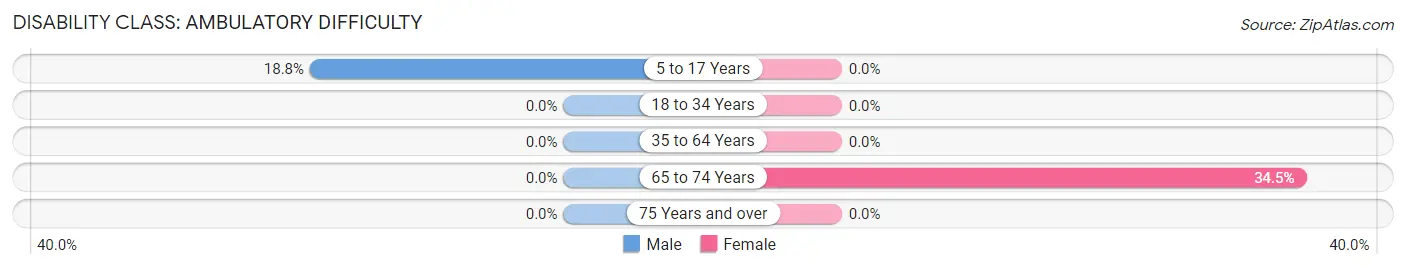
| Age Bracket | Male | Female |
| 5 to 17 Years | 16 (18.8%) | 0 (0.0%) |
| 18 to 34 Years | 0 (0.0%) | 0 (0.0%) |
| 35 to 64 Years | 0 (0.0%) | 0 (0.0%) |
| 65 to 74 Years | 0 (0.0%) | 10 (34.5%) |
| 75 Years and over | 0 (0.0%) | 0 (0.0%) |
Disability Class: Self-Care Difficulty
| Age Bracket | Male | Female |
| 5 to 17 Years | 0 (0.0%) | 0 (0.0%) |
| 18 to 34 Years | 0 (0.0%) | 0 (0.0%) |
| 35 to 64 Years | 0 (0.0%) | 0 (0.0%) |
| 65 to 74 Years | 0 (0.0%) | 0 (0.0%) |
| 75 Years and over | 0 (0.0%) | 0 (0.0%) |
Technology Access in San Miguel
Computing Device Access in San Miguel
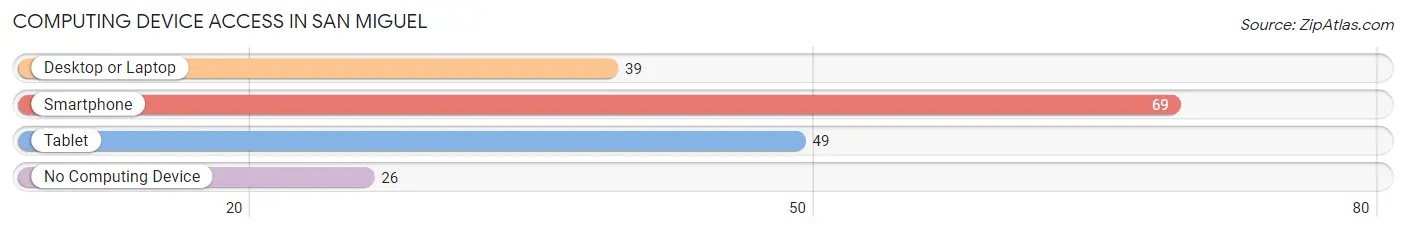
| Device Type | # Households | % Households |
| Desktop or Laptop | 39 | 41.0% |
| Smartphone | 69 | 72.6% |
| Tablet | 49 | 51.6% |
| No Computing Device | 26 | 27.4% |
| Total | 95 | 100.0% |
Internet Access in San Miguel
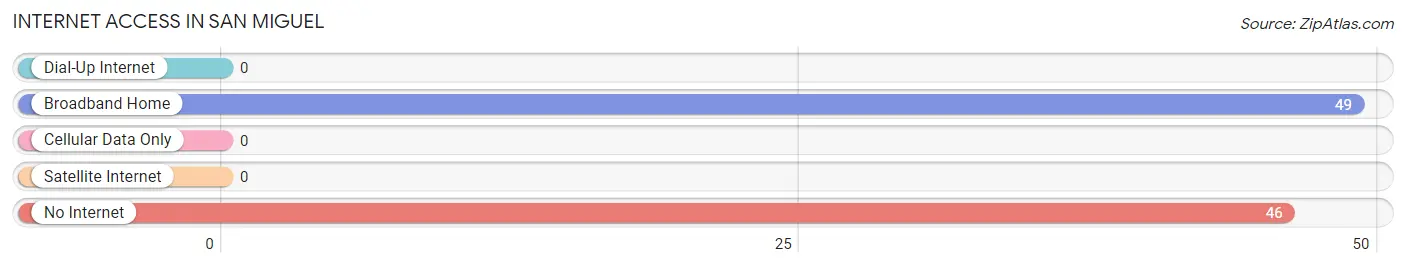
| Internet Type | # Households | % Households |
| Dial-Up Internet | 0 | 0.0% |
| Broadband Home | 49 | 51.6% |
| Cellular Data Only | 0 | 0.0% |
| Satellite Internet | 0 | 0.0% |
| No Internet | 46 | 48.4% |
| Total | 95 | 100.0% |
San Miguel Summary
Introduction
The small town of San Miguel, Arizona is located in the southeastern corner of the state, near the border of New Mexico. It is a rural community with a population of just over 1,000 people, and is known for its rich history, diverse geography, and unique economy. This paper will explore the history, geography, economy, and demographics of San Miguel in 2000 words.
History
San Miguel was founded in 1881 by a group of settlers from the nearby town of Socorro, New Mexico. The settlers were looking for a place to settle and raise their families, and they chose the area around San Miguel because of its fertile soil and abundant water sources. The town was named after the nearby San Miguel River, which was named after the Spanish explorer Miguel de Cervantes.
The town quickly grew and prospered, and by the early 1900s it had become a bustling center of commerce and industry. The town was home to several businesses, including a general store, a blacksmith shop, and a hotel. The town also had a school, a post office, and a church.
In the early 1900s, San Miguel was a popular destination for tourists, who came to enjoy the area’s natural beauty and to take advantage of the town’s many recreational activities. The town was also home to several ranches, which provided employment for many of the town’s residents.
In the late 1950s, the town began to decline as many of its businesses closed and its population began to dwindle. However, in the late 1980s, the town began to experience a resurgence as new businesses opened and the population began to grow again. Today, San Miguel is a small but vibrant community with a population of just over 1,000 people.
Geography
San Miguel is located in the southeastern corner of Arizona, near the border of New Mexico. The town is situated in the San Miguel Valley, which is surrounded by the San Miguel Mountains. The valley is home to several rivers, including the San Miguel River, which flows through the town.
The town is located in a semi-arid climate, with hot summers and mild winters. The average annual temperature is around 70 degrees Fahrenheit, and the average annual precipitation is around 10 inches.
Economy
San Miguel’s economy is largely based on agriculture and tourism. The town is home to several ranches, which produce beef, dairy, and other agricultural products. The town is also home to several tourist attractions, including the San Miguel River, which is popular for fishing and rafting.
The town is also home to several small businesses, including restaurants, shops, and other services. The town is also home to a small airport, which serves as a hub for private and commercial flights.
Demographics
As of the 2010 census, the population of San Miguel was 1,037. The population is largely Hispanic, with over 90% of the population identifying as Hispanic or Latino. The median age of the population is 37.5 years, and the median household income is $30,000.
Conclusion
San Miguel is a small but vibrant town located in the southeastern corner of Arizona. The town has a rich history, diverse geography, and unique economy. The town is home to a largely Hispanic population, and is a popular destination for tourists. San Miguel is a great place to live and work, and is a great example of a small town with a big heart.
Common Questions
What is Per Capita Income in San Miguel?
Per Capita income in San Miguel is $14,047.
What is Inequality or Gini Index in San Miguel?
Inequality or Gini Index in San Miguel is 0.60.
What is the Total Population of San Miguel?
Total Population of San Miguel is 314.
What is the Total Male Population of San Miguel?
Total Male Population of San Miguel is 205.
What is the Total Female Population of San Miguel?
Total Female Population of San Miguel is 109.
What is the Ratio of Males per 100 Females in San Miguel?
There are 188.07 Males per 100 Females in San Miguel.
What is the Ratio of Females per 100 Males in San Miguel?
There are 53.17 Females per 100 Males in San Miguel.
What is the Median Population Age in San Miguel?
Median Population Age in San Miguel is 29.2 Years.
What is the Average Family Size in San Miguel
Average Family Size in San Miguel is 4.4 People.
What is the Average Household Size in San Miguel
Average Household Size in San Miguel is 3.3 People.
How Large is the Labor Force in San Miguel?
There are 88 People in the Labor Forcein in San Miguel.
What is the Percentage of People in the Labor Force in San Miguel?
37.1% of People are in the Labor Force in San Miguel.
What is the Unemployment Rate in San Miguel?
Unemployment Rate in San Miguel is 21.6%.