Scenic, AZ Map & Demographics
Scenic Map
Scenic Overview
$14,190
PER CAPITA INCOME
$45,347
AVG FAMILY INCOME
$32,578
AVG HOUSEHOLD INCOME
0.41
INEQUALITY / GINI INDEX
1,840
TOTAL POPULATION
879
MALE POPULATION
961
FEMALE POPULATION
91.47
MALES / 100 FEMALES
109.33
FEMALES / 100 MALES
65.2
MEDIAN AGE
3.2
AVG FAMILY SIZE
2.3
AVG HOUSEHOLD SIZE
333
LABOR FORCE [ PEOPLE ]
21.4%
PERCENT IN LABOR FORCE
22.3%
UNEMPLOYMENT RATE
Scenic Area Codes
Income in Scenic
Income Overview in Scenic
Per Capita Income in Scenic is $14,190, while median incomes of families and households are $45,347 and $32,578 respectively.
| Characteristic | Number | Measure |
| Per Capita Income | 1,840 | $14,190 |
| Median Family Income | 470 | $45,347 |
| Mean Family Income | 470 | $45,349 |
| Median Household Income | 791 | $32,578 |
| Mean Household Income | 791 | $31,518 |
| Income Deficit | 470 | $0 |
| Wage / Income Gap (%) | 1,840 | 0.00% |
| Wage / Income Gap ($) | 1,840 | 100.00¢ per $1 |
| Gini / Inequality Index | 1,840 | 0.41 |
Earnings by Sex in Scenic
| Sex | Number | Average Earnings |
| Male | 140 (54.3%) | $0 |
| Female | 118 (45.7%) | $0 |
| Total | 258 (100.0%) | $0 |
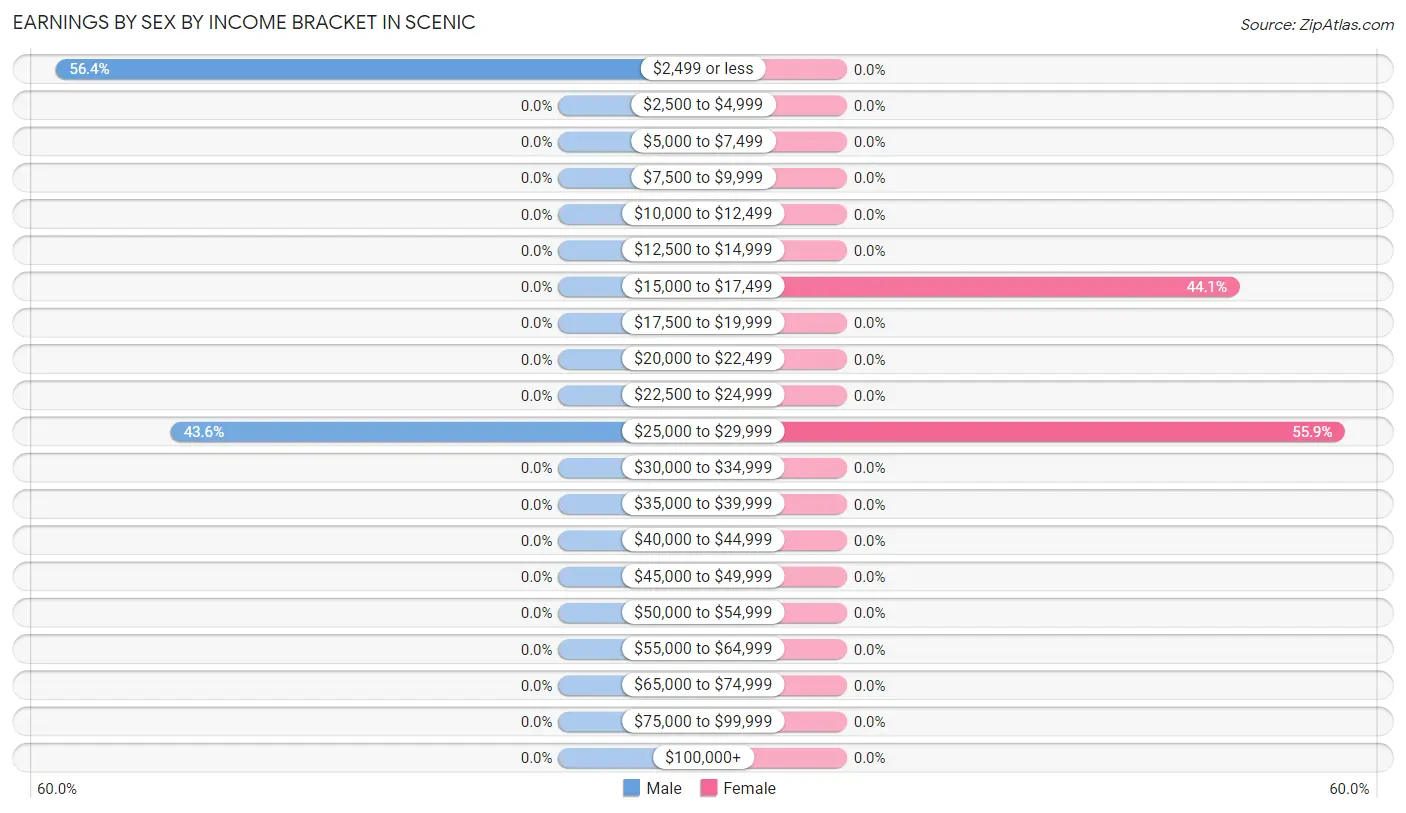
Earnings by Sex by Income Bracket in Scenic
The most common earnings brackets in Scenic are $2,499 or less for men (79 | 56.4%) and $25,000 to $29,999 for women (66 | 55.9%).
| Income | Male | Female |
| $2,499 or less | 79 (56.4%) | 0 (0.0%) |
| $2,500 to $4,999 | 0 (0.0%) | 0 (0.0%) |
| $5,000 to $7,499 | 0 (0.0%) | 0 (0.0%) |
| $7,500 to $9,999 | 0 (0.0%) | 0 (0.0%) |
| $10,000 to $12,499 | 0 (0.0%) | 0 (0.0%) |
| $12,500 to $14,999 | 0 (0.0%) | 0 (0.0%) |
| $15,000 to $17,499 | 0 (0.0%) | 52 (44.1%) |
| $17,500 to $19,999 | 0 (0.0%) | 0 (0.0%) |
| $20,000 to $22,499 | 0 (0.0%) | 0 (0.0%) |
| $22,500 to $24,999 | 0 (0.0%) | 0 (0.0%) |
| $25,000 to $29,999 | 61 (43.6%) | 66 (55.9%) |
| $30,000 to $34,999 | 0 (0.0%) | 0 (0.0%) |
| $35,000 to $39,999 | 0 (0.0%) | 0 (0.0%) |
| $40,000 to $44,999 | 0 (0.0%) | 0 (0.0%) |
| $45,000 to $49,999 | 0 (0.0%) | 0 (0.0%) |
| $50,000 to $54,999 | 0 (0.0%) | 0 (0.0%) |
| $55,000 to $64,999 | 0 (0.0%) | 0 (0.0%) |
| $65,000 to $74,999 | 0 (0.0%) | 0 (0.0%) |
| $75,000 to $99,999 | 0 (0.0%) | 0 (0.0%) |
| $100,000+ | 0 (0.0%) | 0 (0.0%) |
| Total | 140 (100.0%) | 118 (100.0%) |
Earnings by Sex by Educational Attainment in Scenic
| Educational Attainment | Male Income | Female Income |
| Less than High School | - | - |
| High School Diploma | - | - |
| College or Associate's Degree | - | - |
| Bachelor's Degree | - | - |
| Graduate Degree | - | - |
| Total | - | - |
Family Income in Scenic
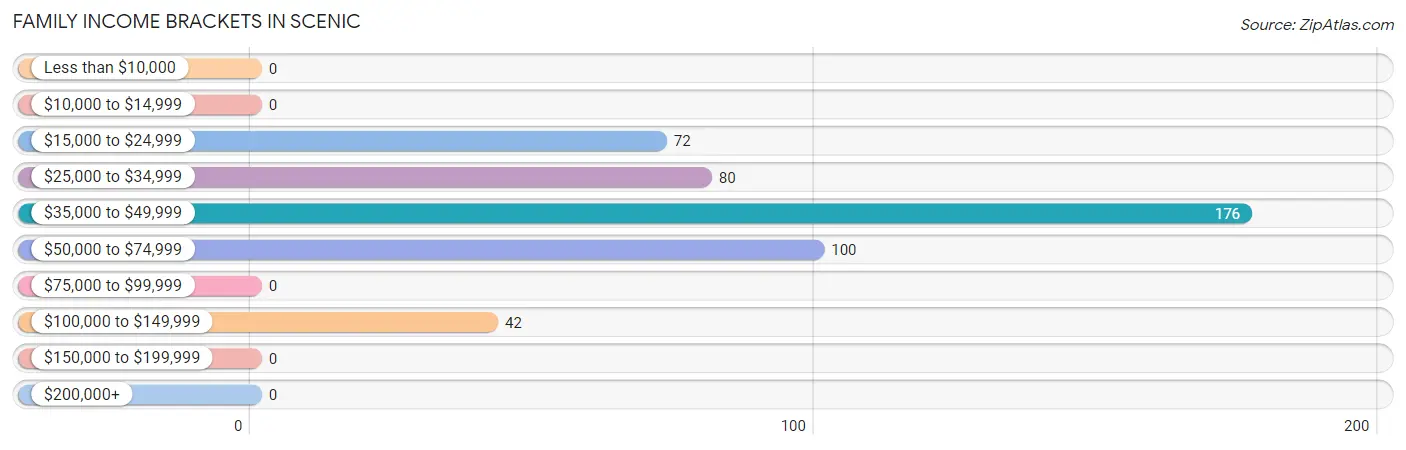
Family Income Brackets in Scenic
According to the Scenic family income data, there are 176 families falling into the $35,000 to $49,999 income range, which is the most common income bracket and makes up 37.4% of all families.
| Income Bracket | # Families | % Families |
| Less than $10,000 | 0 | 0.0% |
| $10,000 to $14,999 | 0 | 0.0% |
| $15,000 to $24,999 | 72 | 15.3% |
| $25,000 to $34,999 | 80 | 17.0% |
| $35,000 to $49,999 | 176 | 37.4% |
| $50,000 to $74,999 | 100 | 21.3% |
| $75,000 to $99,999 | 0 | 0.0% |
| $100,000 to $149,999 | 42 | 8.9% |
| $150,000 to $199,999 | 0 | 0.0% |
| $200,000+ | 0 | 0.0% |
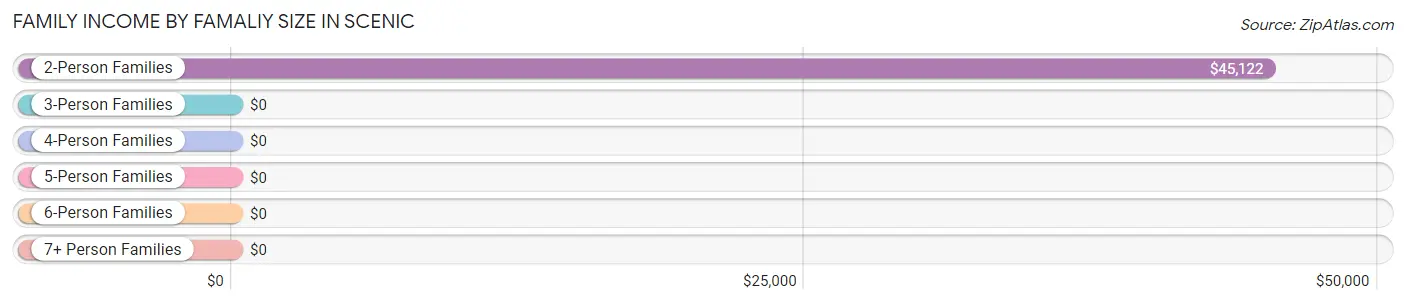
Family Income by Famaliy Size in Scenic
2-person families (284 | 60.4%) account for the highest median family income in Scenic with $45,122 per family, while 2-person families (284 | 60.4%) have the highest median income of $22,561 per family member.
| Income Bracket | # Families | Median Income |
| 2-Person Families | 284 (60.4%) | $45,122 |
| 3-Person Families | 80 (17.0%) | $0 |
| 4-Person Families | 67 (14.3%) | $0 |
| 5-Person Families | 0 (0.0%) | $0 |
| 6-Person Families | 0 (0.0%) | $0 |
| 7+ Person Families | 39 (8.3%) | $0 |
| Total | 470 (100.0%) | $45,347 |
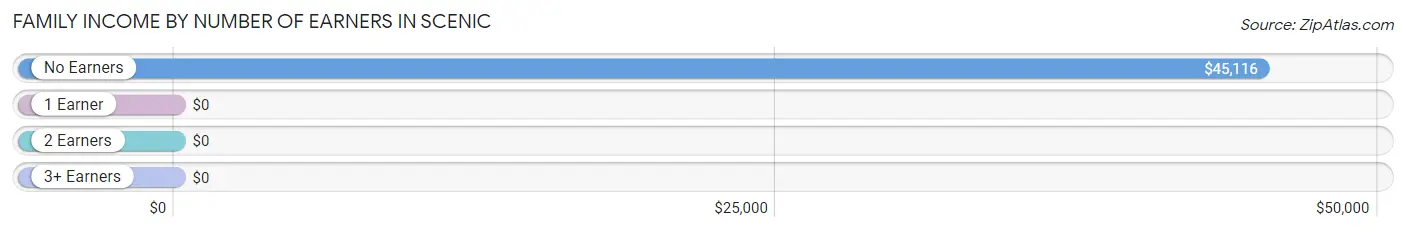
Family Income by Number of Earners in Scenic
| Number of Earners | # Families | Median Income |
| No Earners | 290 (61.7%) | $45,116 |
| 1 Earner | 141 (30.0%) | $0 |
| 2 Earners | 39 (8.3%) | $0 |
| 3+ Earners | 0 (0.0%) | $0 |
| Total | 470 (100.0%) | $45,347 |
Household Income in Scenic
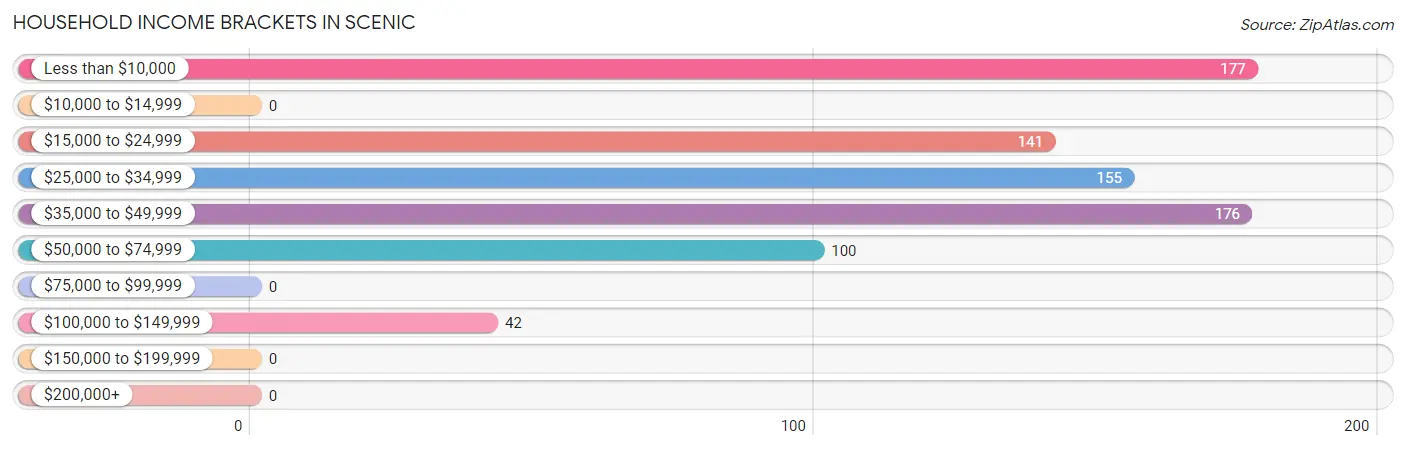
Household Income Brackets in Scenic
With 177 households falling in the category, the less than $10,000 income range is the most frequent in Scenic, accounting for 22.4% of all households.
| Income Bracket | # Households | % Households |
| Less than $10,000 | 177 | 22.4% |
| $10,000 to $14,999 | 0 | 0.0% |
| $15,000 to $24,999 | 141 | 17.8% |
| $25,000 to $34,999 | 155 | 19.6% |
| $35,000 to $49,999 | 176 | 22.3% |
| $50,000 to $74,999 | 100 | 12.6% |
| $75,000 to $99,999 | 0 | 0.0% |
| $100,000 to $149,999 | 42 | 5.3% |
| $150,000 to $199,999 | 0 | 0.0% |
| $200,000+ | 0 | 0.0% |
Household Income by Householder Age in Scenic
The median household income in Scenic is $32,578, with the highest median household income of $34,844 found in the 65+ years age bracket for the primary householder. A total of 646 households (81.7%) fall into this category.
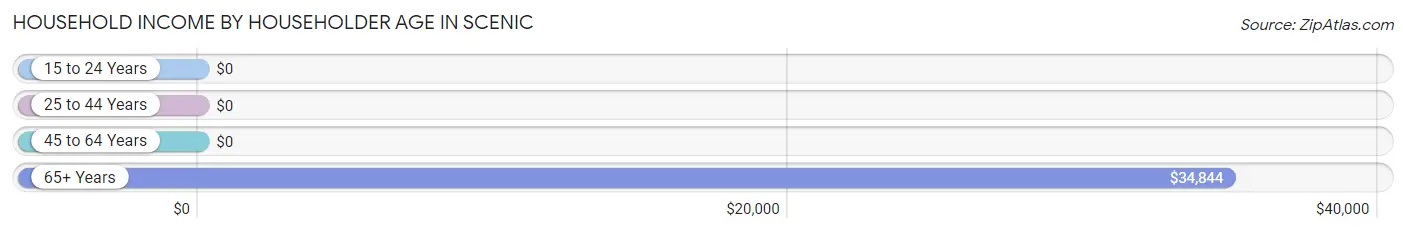
| Income Bracket | # Households | Median Income |
| 15 to 24 Years | 0 (0.0%) | $0 |
| 25 to 44 Years | 0 (0.0%) | $0 |
| 45 to 64 Years | 145 (18.3%) | $0 |
| 65+ Years | 646 (81.7%) | $34,844 |
| Total | 791 (100.0%) | $32,578 |
Poverty in Scenic
Income Below Poverty by Sex and Age in Scenic
With 25.6% poverty level for males and 38.8% for females among the residents of Scenic, 55 to 64 year old males and 6 to 11 year old females are the most vulnerable to poverty, with 145 males (66.2%) and 123 females (100.0%) in their respective age groups living below the poverty level.
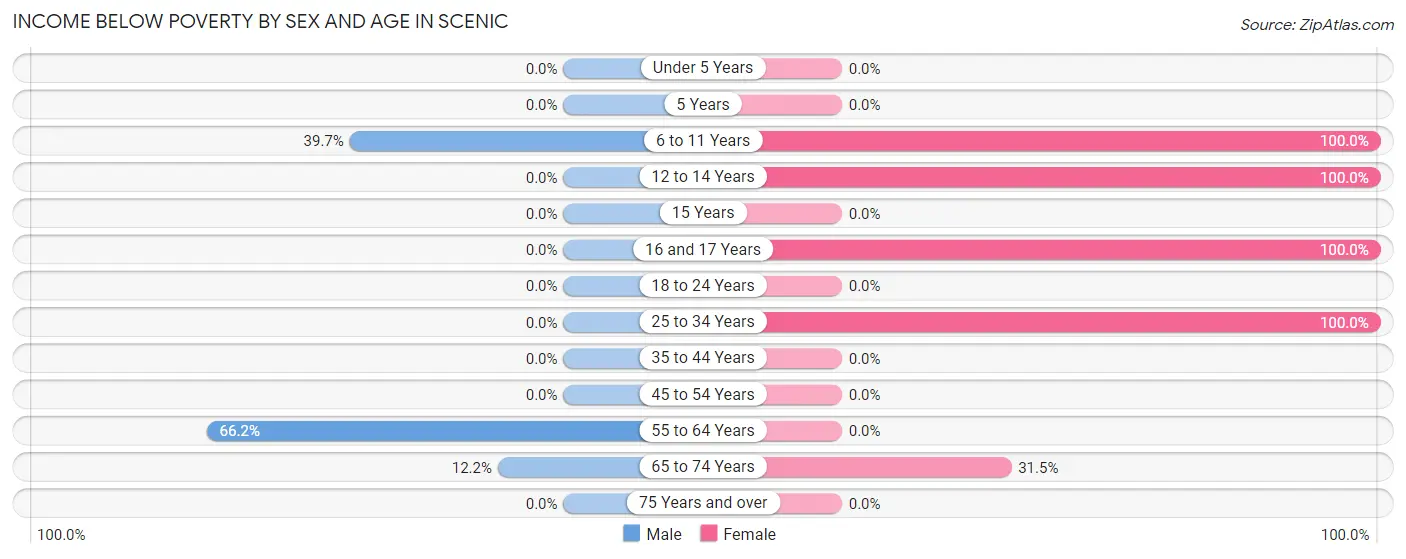
| Age Bracket | Male | Female |
| Under 5 Years | 0 (0.0%) | 0 (0.0%) |
| 5 Years | 0 (0.0%) | 0 (0.0%) |
| 6 to 11 Years | 48 (39.7%) | 123 (100.0%) |
| 12 to 14 Years | 0 (0.0%) | 41 (100.0%) |
| 15 Years | 0 (0.0%) | 0 (0.0%) |
| 16 and 17 Years | 0 (0.0%) | 52 (100.0%) |
| 18 to 24 Years | 0 (0.0%) | 0 (0.0%) |
| 25 to 34 Years | 0 (0.0%) | 118 (100.0%) |
| 35 to 44 Years | 0 (0.0%) | 0 (0.0%) |
| 45 to 54 Years | 0 (0.0%) | 0 (0.0%) |
| 55 to 64 Years | 145 (66.2%) | 0 (0.0%) |
| 65 to 74 Years | 32 (12.2%) | 39 (31.5%) |
| 75 Years and over | 0 (0.0%) | 0 (0.0%) |
| Total | 225 (25.6%) | 373 (38.8%) |
Income Above Poverty by Sex and Age in Scenic
According to the poverty statistics in Scenic, males aged 18 to 24 years and females aged 55 to 64 years are the age groups that are most secure financially, with 100.0% of males and 100.0% of females in these age groups living above the poverty line.
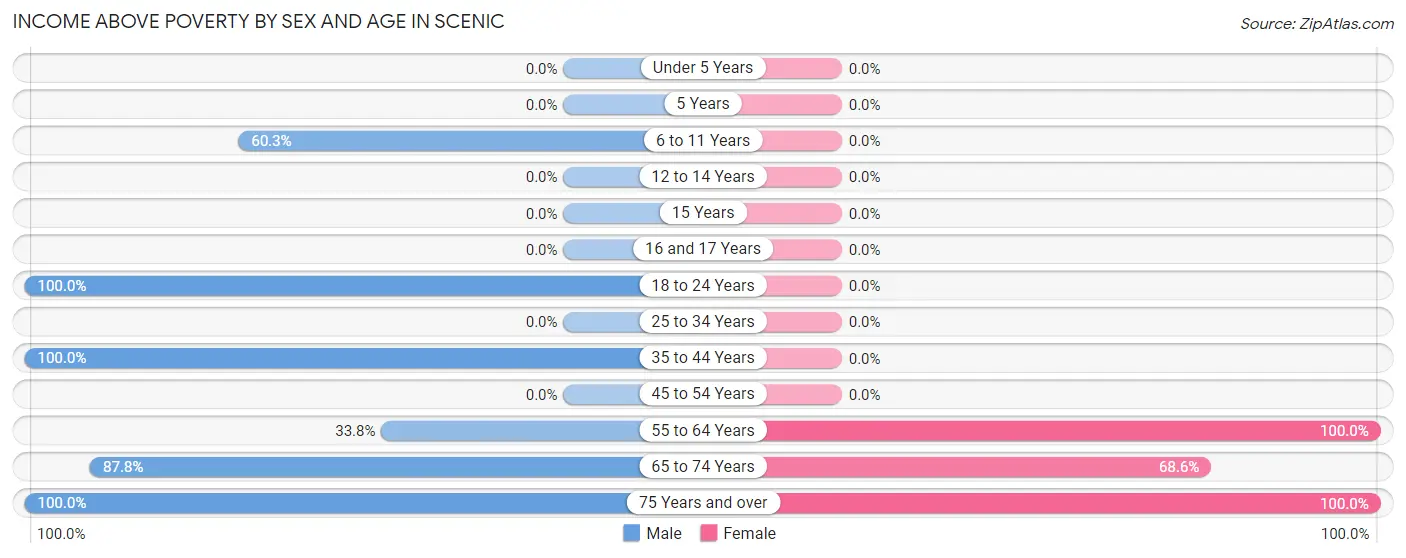
| Age Bracket | Male | Female |
| Under 5 Years | 0 (0.0%) | 0 (0.0%) |
| 5 Years | 0 (0.0%) | 0 (0.0%) |
| 6 to 11 Years | 73 (60.3%) | 0 (0.0%) |
| 12 to 14 Years | 0 (0.0%) | 0 (0.0%) |
| 15 Years | 0 (0.0%) | 0 (0.0%) |
| 16 and 17 Years | 0 (0.0%) | 0 (0.0%) |
| 18 to 24 Years | 79 (100.0%) | 0 (0.0%) |
| 25 to 34 Years | 0 (0.0%) | 0 (0.0%) |
| 35 to 44 Years | 77 (100.0%) | 0 (0.0%) |
| 45 to 54 Years | 0 (0.0%) | 0 (0.0%) |
| 55 to 64 Years | 74 (33.8%) | 69 (100.0%) |
| 65 to 74 Years | 231 (87.8%) | 85 (68.5%) |
| 75 Years and over | 120 (100.0%) | 434 (100.0%) |
| Total | 654 (74.4%) | 588 (61.2%) |
Income Below Poverty Among Married-Couple Families in Scenic
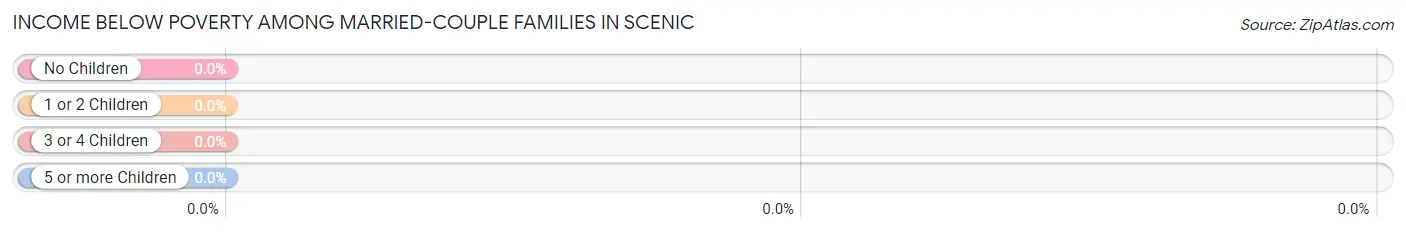
| Children | Above Poverty | Below Poverty |
| No Children | 242 (100.0%) | 0 (0.0%) |
| 1 or 2 Children | 67 (100.0%) | 0 (0.0%) |
| 3 or 4 Children | 0 (0.0%) | 0 (0.0%) |
| 5 or more Children | 0 (0.0%) | 0 (0.0%) |
| Total | 309 (100.0%) | 0 (0.0%) |
Income Below Poverty Among Single-Parent Households in Scenic
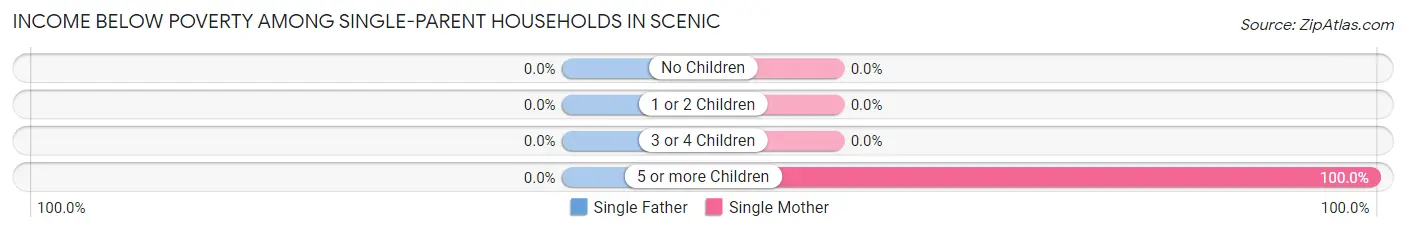
| Children | Single Father | Single Mother |
| No Children | 0 (0.0%) | 0 (0.0%) |
| 1 or 2 Children | 0 (0.0%) | 0 (0.0%) |
| 3 or 4 Children | 0 (0.0%) | 0 (0.0%) |
| 5 or more Children | 0 (0.0%) | 39 (100.0%) |
| Total | 0 (0.0%) | 39 (24.2%) |
Income Below Poverty Among Married-Couple vs Single-Parent Households in Scenic
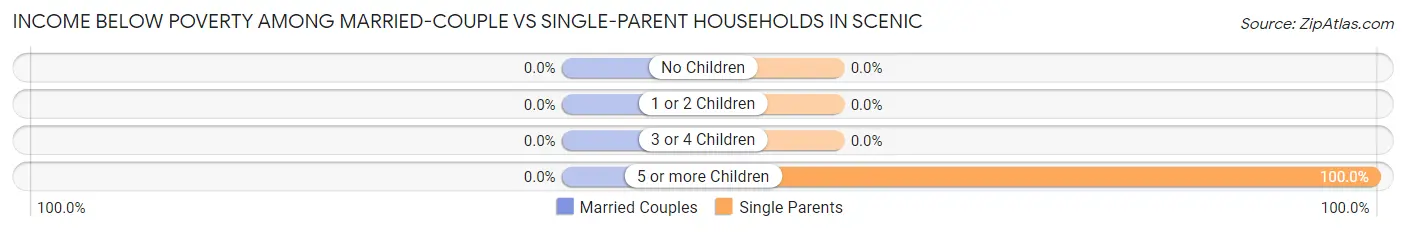
| Children | Married-Couple Families | Single-Parent Households |
| No Children | 0 (0.0%) | 0 (0.0%) |
| 1 or 2 Children | 0 (0.0%) | 0 (0.0%) |
| 3 or 4 Children | 0 (0.0%) | 0 (0.0%) |
| 5 or more Children | 0 (0.0%) | 39 (100.0%) |
| Total | 0 (0.0%) | 39 (24.2%) |
Race in Scenic
The most populous races in Scenic are White / Caucasian (1,344 | 73.0%), Hispanic or Latino (496 | 27.0%), and Some other Race (496 | 27.0%).
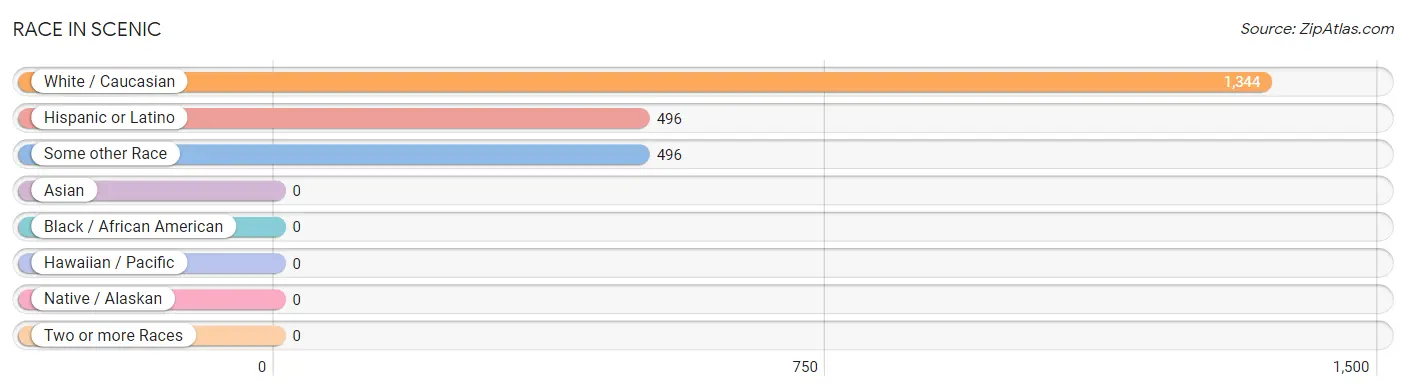
| Race | # Population | % Population |
| Asian | 0 | 0.0% |
| Black / African American | 0 | 0.0% |
| Hawaiian / Pacific | 0 | 0.0% |
| Hispanic or Latino | 496 | 27.0% |
| Native / Alaskan | 0 | 0.0% |
| White / Caucasian | 1,344 | 73.0% |
| Two or more Races | 0 | 0.0% |
| Some other Race | 496 | 27.0% |
| Total | 1,840 | 100.0% |
Ancestry in Scenic
The most populous ancestries reported in Scenic are Mexican (448 | 24.3%), English (278 | 15.1%), European (265 | 14.4%), Scottish (145 | 7.9%), and German (111 | 6.0%), together accounting for 67.8% of all Scenic residents.
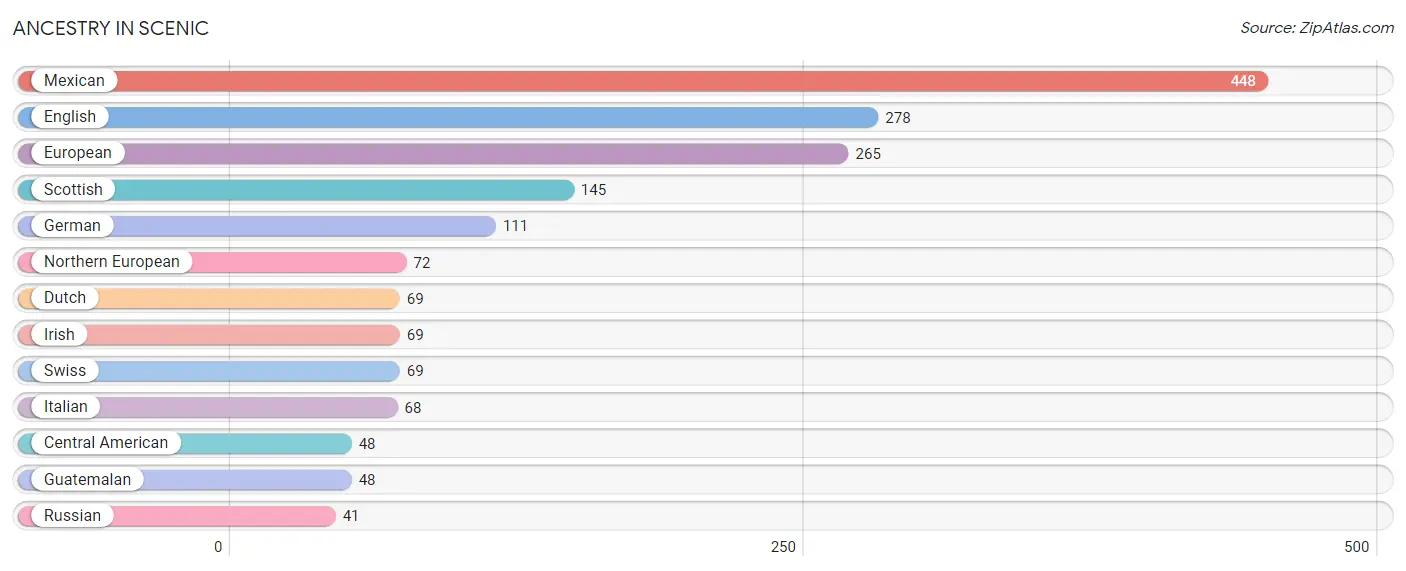
| Ancestry | # Population | % Population |
| Central American | 48 | 2.6% |
| Dutch | 69 | 3.7% |
| English | 278 | 15.1% |
| European | 265 | 14.4% |
| German | 111 | 6.0% |
| Guatemalan | 48 | 2.6% |
| Irish | 69 | 3.7% |
| Italian | 68 | 3.7% |
| Mexican | 448 | 24.3% |
| Northern European | 72 | 3.9% |
| Russian | 41 | 2.2% |
| Scottish | 145 | 7.9% |
| Swiss | 69 | 3.7% | View All 13 Rows |
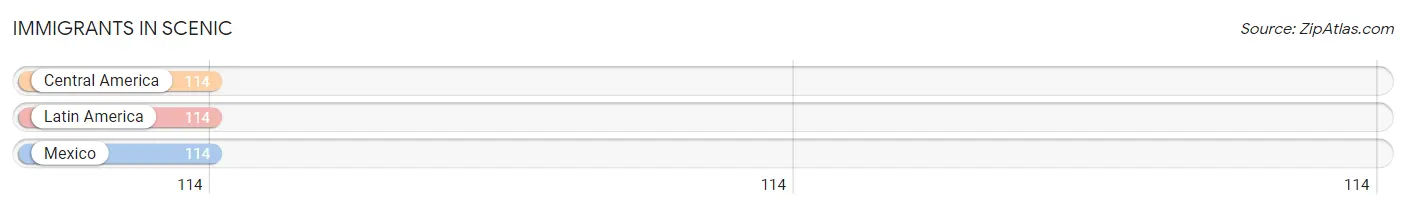
Immigrants in Scenic
The most numerous immigrant groups reported in Scenic came from Central America (114 | 6.2%), Latin America (114 | 6.2%), and Mexico (114 | 6.2%), together accounting for 18.6% of all Scenic residents.
| Immigration Origin | # Population | % Population |
| Central America | 114 | 6.2% |
| Latin America | 114 | 6.2% |
| Mexico | 114 | 6.2% | View All 3 Rows |
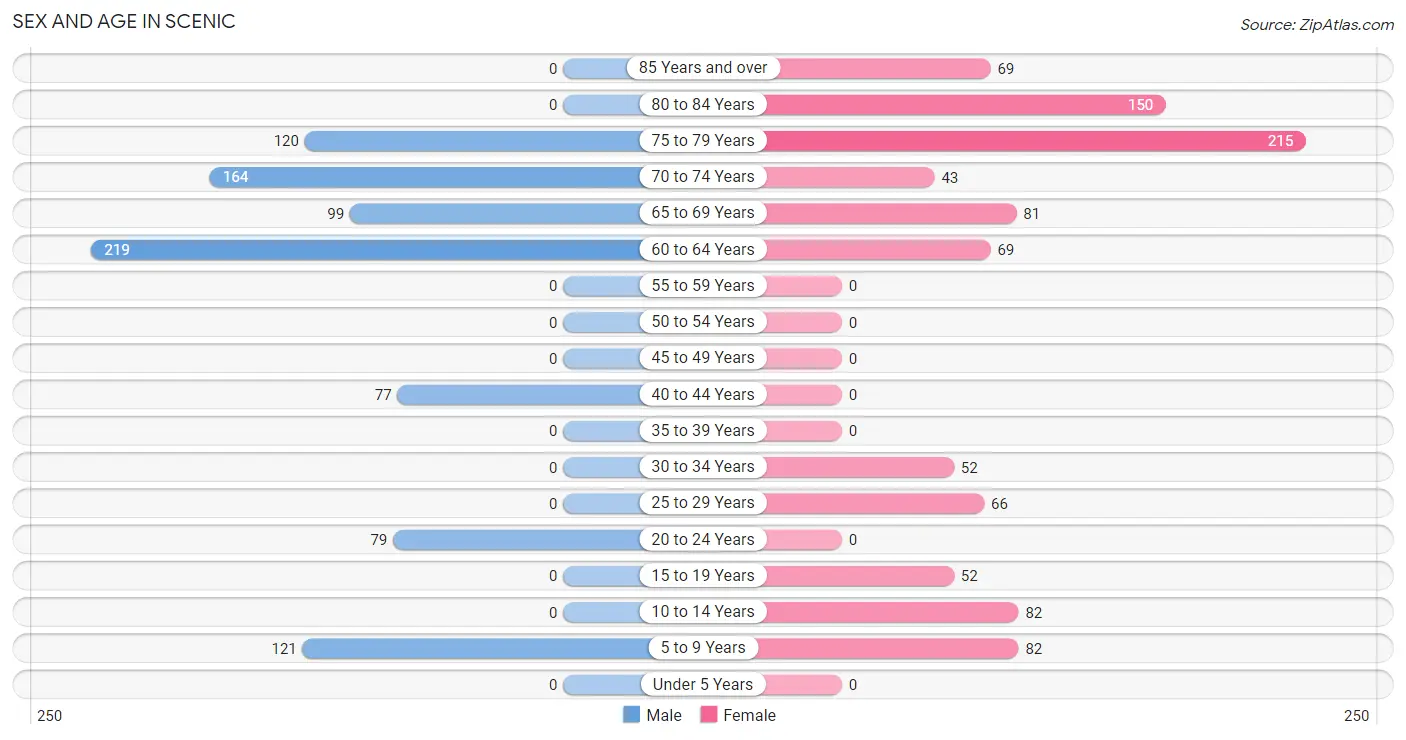
Sex and Age in Scenic
Sex and Age in Scenic
The most populous age groups in Scenic are 60 to 64 Years (219 | 24.9%) for men and 75 to 79 Years (215 | 22.4%) for women.
| Age Bracket | Male | Female |
| Under 5 Years | 0 (0.0%) | 0 (0.0%) |
| 5 to 9 Years | 121 (13.8%) | 82 (8.5%) |
| 10 to 14 Years | 0 (0.0%) | 82 (8.5%) |
| 15 to 19 Years | 0 (0.0%) | 52 (5.4%) |
| 20 to 24 Years | 79 (9.0%) | 0 (0.0%) |
| 25 to 29 Years | 0 (0.0%) | 66 (6.9%) |
| 30 to 34 Years | 0 (0.0%) | 52 (5.4%) |
| 35 to 39 Years | 0 (0.0%) | 0 (0.0%) |
| 40 to 44 Years | 77 (8.8%) | 0 (0.0%) |
| 45 to 49 Years | 0 (0.0%) | 0 (0.0%) |
| 50 to 54 Years | 0 (0.0%) | 0 (0.0%) |
| 55 to 59 Years | 0 (0.0%) | 0 (0.0%) |
| 60 to 64 Years | 219 (24.9%) | 69 (7.2%) |
| 65 to 69 Years | 99 (11.3%) | 81 (8.4%) |
| 70 to 74 Years | 164 (18.7%) | 43 (4.5%) |
| 75 to 79 Years | 120 (13.7%) | 215 (22.4%) |
| 80 to 84 Years | 0 (0.0%) | 150 (15.6%) |
| 85 Years and over | 0 (0.0%) | 69 (7.2%) |
| Total | 879 (100.0%) | 961 (100.0%) |
Families and Households in Scenic
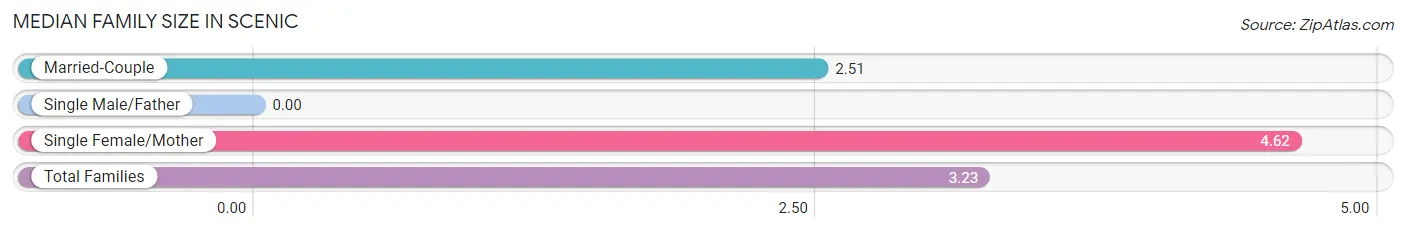
Median Family Size in Scenic
| Family Type | # Families | Family Size |
| Married-Couple | 309 (65.7%) | 2.51 |
| Single Male/Father | 0 (0.0%) | - |
| Single Female/Mother | 161 (34.3%) | 4.62 |
| Total Families | 470 (100.0%) | 3.23 |
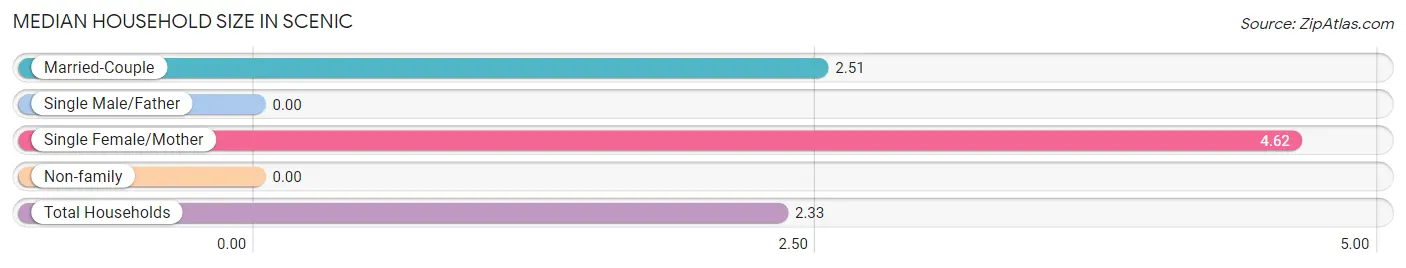
Median Household Size in Scenic
| Household Type | # Households | Household Size |
| Married-Couple | 309 (39.1%) | 2.51 |
| Single Male/Father | 0 (0.0%) | - |
| Single Female/Mother | 161 (20.3%) | 4.62 |
| Non-family | 321 (40.6%) | - |
| Total Households | 791 (100.0%) | 2.33 |
Household Size by Marriage Status in Scenic
Out of a total of 791 households in Scenic, 470 (59.4%) are family households, while 321 (40.6%) are nonfamily households. The most numerous type of family households are 2-person households, comprising 284, and the most common type of nonfamily households are 1-person households, comprising 321.
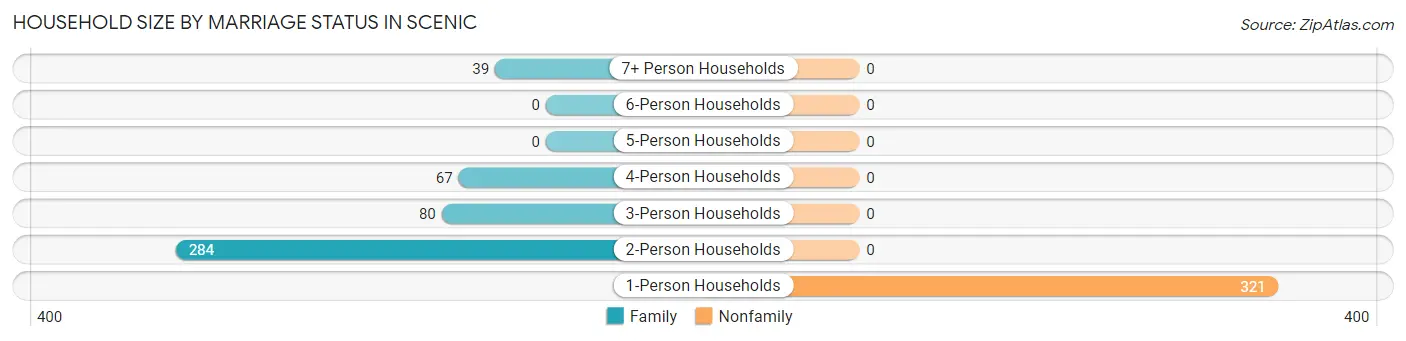
| Household Size | Family Households | Nonfamily Households |
| 1-Person Households | - | 321 (40.6%) |
| 2-Person Households | 284 (35.9%) | 0 (0.0%) |
| 3-Person Households | 80 (10.1%) | 0 (0.0%) |
| 4-Person Households | 67 (8.5%) | 0 (0.0%) |
| 5-Person Households | 0 (0.0%) | 0 (0.0%) |
| 6-Person Households | 0 (0.0%) | 0 (0.0%) |
| 7+ Person Households | 39 (4.9%) | 0 (0.0%) |
| Total | 470 (59.4%) | 321 (40.6%) |
Female Fertility in Scenic
Fertility by Age in Scenic
| Age Bracket | Women with Births | Births / 1,000 Women |
| 15 to 19 years | 0 (0.0%) | 0.0 |
| 20 to 34 years | 0 (0.0%) | 0.0 |
| 35 to 50 years | 0 (0.0%) | 0.0 |
| Total | 0 (0.0%) | 0.0 |
Fertility by Age by Marriage Status in Scenic
| Age Bracket | Married | Unmarried |
| 15 to 19 years | 0 (0.0%) | 0 (0.0%) |
| 20 to 34 years | 0 (0.0%) | 0 (0.0%) |
| 35 to 50 years | 0 (0.0%) | 0 (0.0%) |
| Total | 0 (0.0%) | 0 (0.0%) |
Fertility by Education in Scenic
| Educational Attainment | Women with Births | Births / 1,000 Women |
| Less than High School | 0 (0.0%) | 0.0 |
| High School Diploma | 0 (0.0%) | 0.0 |
| College or Associate's Degree | 0 (0.0%) | 0.0 |
| Bachelor's Degree | 0 (0.0%) | 0.0 |
| Graduate Degree | 0 (0.0%) | 0.0 |
| Total | 0 (0.0%) | 0.0 |
Fertility by Education by Marriage Status in Scenic
| Educational Attainment | Married | Unmarried |
| Less than High School | 0 (0.0%) | 0 (0.0%) |
| High School Diploma | 0 (0.0%) | 0 (0.0%) |
| College or Associate's Degree | 0 (0.0%) | 0 (0.0%) |
| Bachelor's Degree | 0 (0.0%) | 0 (0.0%) |
| Graduate Degree | 0 (0.0%) | 0 (0.0%) |
| Total | 0 (0.0%) | 0 (0.0%) |
Employment Characteristics in Scenic
Employment by Class of Employer in Scenic
Among the 258 employed individuals in Scenic, , and private company employees (258 | 100.0%) make up the most common classes of employment.
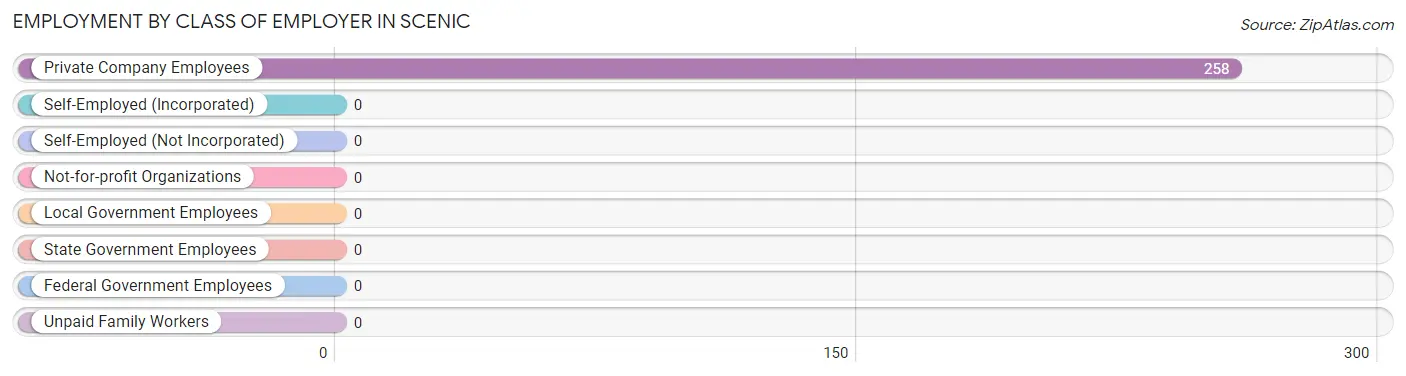
| Employer Class | # Employees | % Employees |
| Private Company Employees | 258 | 100.0% |
| Self-Employed (Incorporated) | 0 | 0.0% |
| Self-Employed (Not Incorporated) | 0 | 0.0% |
| Not-for-profit Organizations | 0 | 0.0% |
| Local Government Employees | 0 | 0.0% |
| State Government Employees | 0 | 0.0% |
| Federal Government Employees | 0 | 0.0% |
| Unpaid Family Workers | 0 | 0.0% |
| Total | 258 | 100.0% |
Employment Status by Age in Scenic
According to the labor force statistics for Scenic, out of the total population over 16 years of age (1,555), 21.4% or 333 individuals are in the labor force, with 22.3% or 74 of them unemployed. The age group with the highest labor force participation rate is 20 to 24 years, with 100.0% or 79 individuals in the labor force. Within the labor force, the 60 to 64 years age range has the highest percentage of unemployed individuals, with 100.0% or 74 of them being unemployed.
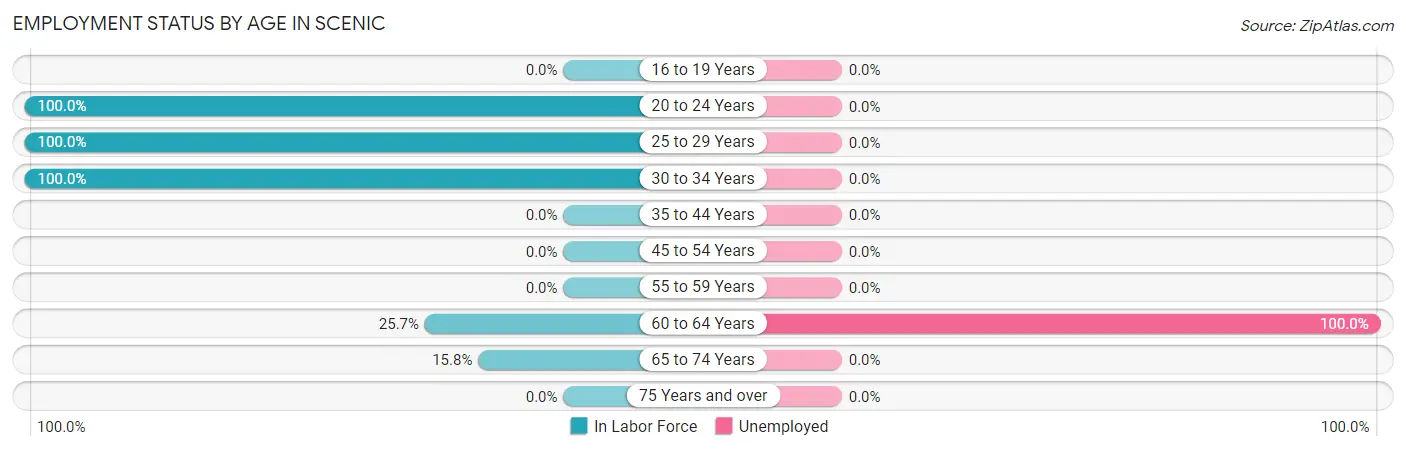
| Age Bracket | In Labor Force | Unemployed |
| 16 to 19 Years | 0 (0.0%) | 0 (0.0%) |
| 20 to 24 Years | 79 (100.0%) | 0 (0.0%) |
| 25 to 29 Years | 66 (100.0%) | 0 (0.0%) |
| 30 to 34 Years | 52 (100.0%) | 0 (0.0%) |
| 35 to 44 Years | 0 (0.0%) | 0 (0.0%) |
| 45 to 54 Years | 0 (0.0%) | 0 (0.0%) |
| 55 to 59 Years | 0 (0.0%) | 0 (0.0%) |
| 60 to 64 Years | 74 (25.7%) | 74 (100.0%) |
| 65 to 74 Years | 61 (15.8%) | 0 (0.0%) |
| 75 Years and over | 0 (0.0%) | 0 (0.0%) |
| Total | 333 (21.4%) | 74 (22.3%) |
Employment Status by Educational Attainment in Scenic
According to labor force statistics for Scenic, 39.8% of individuals (192) out of the total population between 25 and 64 years of age (483) are in the labor force, with 38.5% or 74 of them being unemployed. The group with the highest labor force participation rate are those with the educational attainment of less than high school, with 100.0% or 66 individuals in the labor force. Within the labor force, individuals with college / associate degree education have the highest percentage of unemployment, with 100.0% or 74 of them being unemployed.
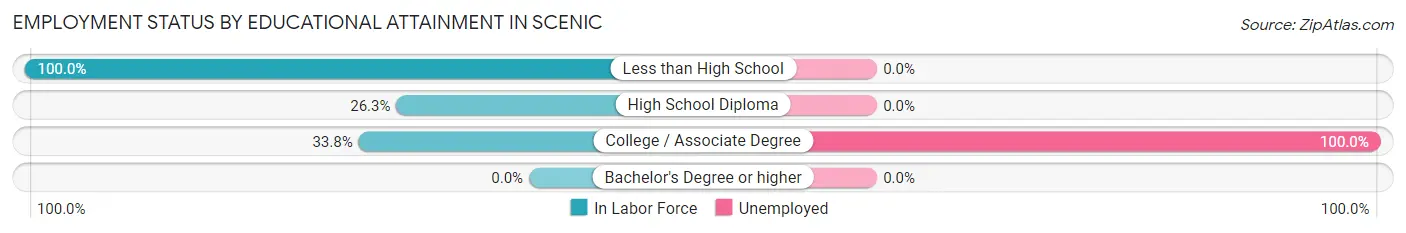
| Educational Attainment | In Labor Force | Unemployed |
| Less than High School | 66 (100.0%) | 0 (0.0%) |
| High School Diploma | 52 (26.3%) | 0 (0.0%) |
| College / Associate Degree | 74 (33.8%) | 219 (100.0%) |
| Bachelor's Degree or higher | 0 (0.0%) | 0 (0.0%) |
| Total | 192 (39.8%) | 186 (38.5%) |
Employment Occupations by Sex in Scenic
Management, Business, Science and Arts Occupations
The most common Management, Business, Science and Arts occupations in Scenic are , and Health Diagnosing & Treating (79 | 30.6%).
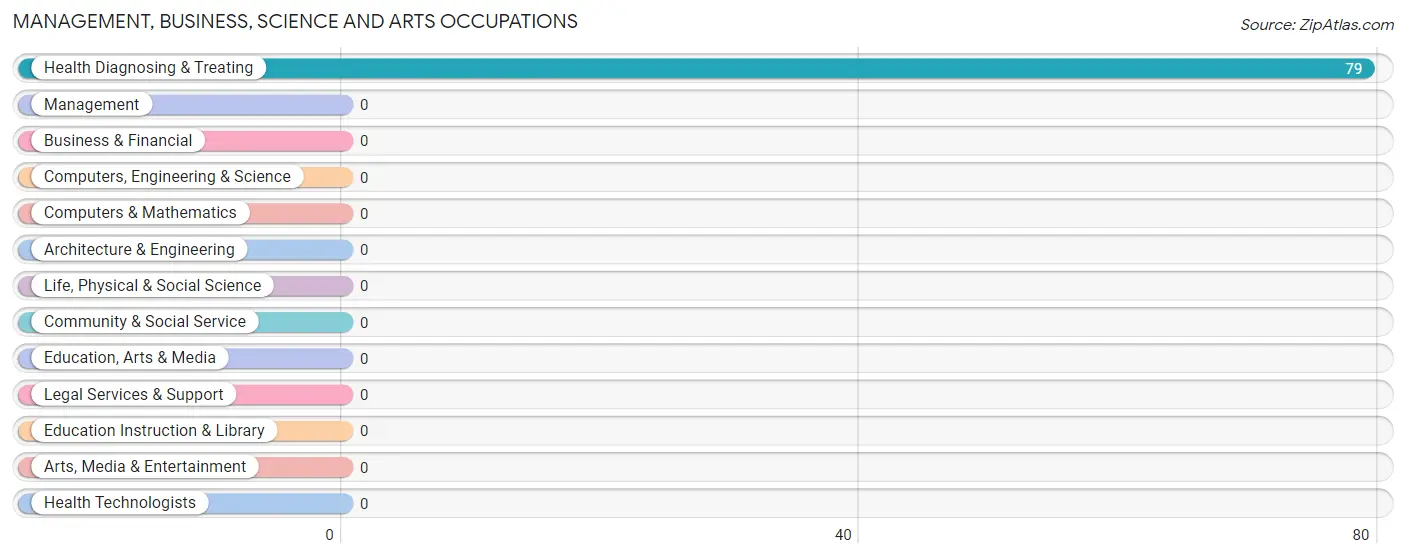
Management, Business, Science and Arts Occupations by Sex
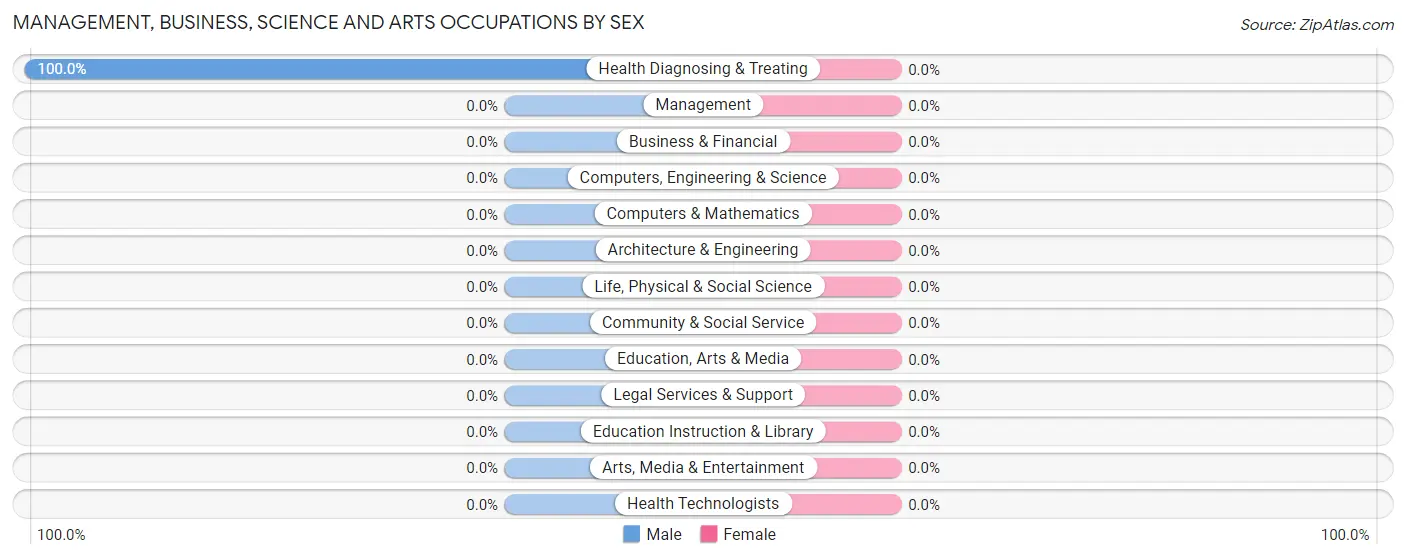
| Occupation | Male | Female |
| Management | 0 (0.0%) | 0 (0.0%) |
| Business & Financial | 0 (0.0%) | 0 (0.0%) |
| Computers, Engineering & Science | 0 (0.0%) | 0 (0.0%) |
| Computers & Mathematics | 0 (0.0%) | 0 (0.0%) |
| Architecture & Engineering | 0 (0.0%) | 0 (0.0%) |
| Life, Physical & Social Science | 0 (0.0%) | 0 (0.0%) |
| Community & Social Service | 0 (0.0%) | 0 (0.0%) |
| Education, Arts & Media | 0 (0.0%) | 0 (0.0%) |
| Legal Services & Support | 0 (0.0%) | 0 (0.0%) |
| Education Instruction & Library | 0 (0.0%) | 0 (0.0%) |
| Arts, Media & Entertainment | 0 (0.0%) | 0 (0.0%) |
| Health Diagnosing & Treating | 79 (100.0%) | 0 (0.0%) |
| Health Technologists | 0 (0.0%) | 0 (0.0%) |
| Total (Category) | 79 (100.0%) | 0 (0.0%) |
| Total (Overall) | 140 (54.3%) | 118 (45.7%) |
Services Occupations
The most common Services occupations in Scenic are , and Personal Care & Service (52 | 20.2%).
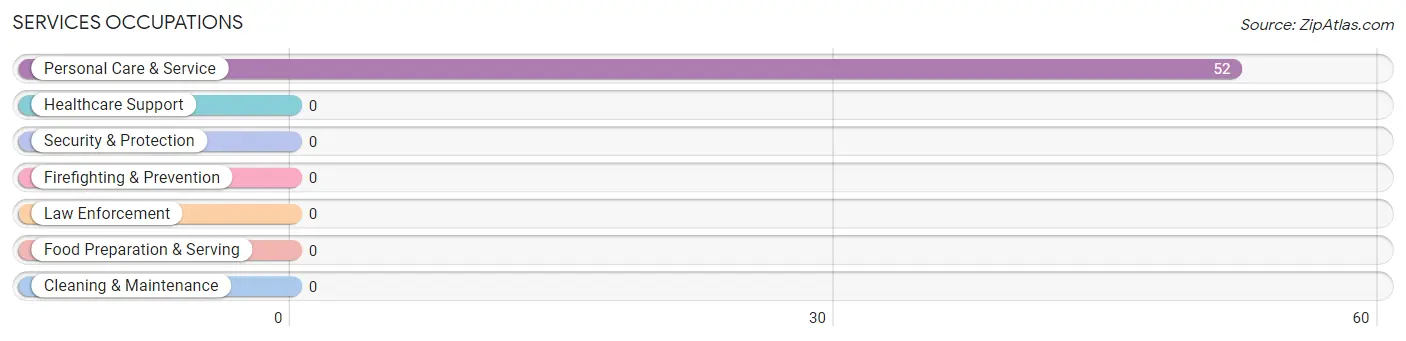
Services Occupations by Sex
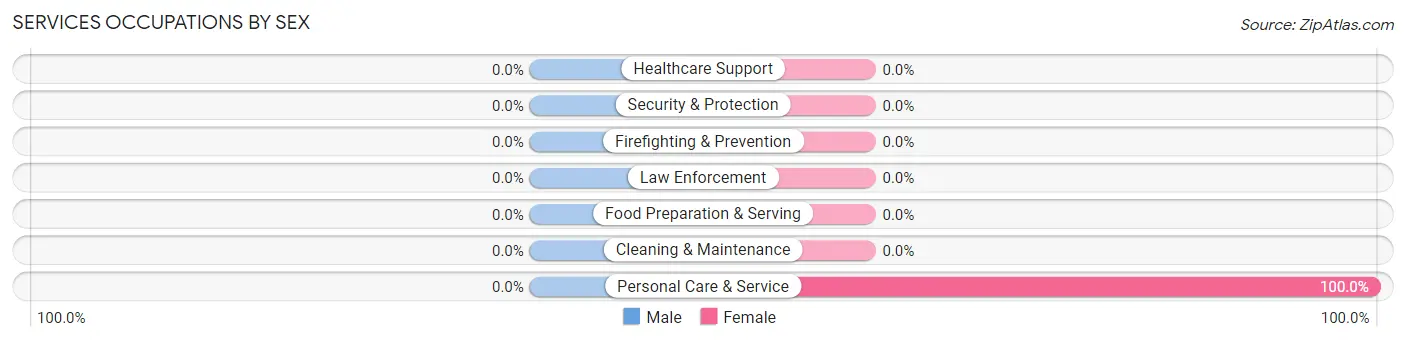
| Occupation | Male | Female |
| Healthcare Support | 0 (0.0%) | 0 (0.0%) |
| Security & Protection | 0 (0.0%) | 0 (0.0%) |
| Firefighting & Prevention | 0 (0.0%) | 0 (0.0%) |
| Law Enforcement | 0 (0.0%) | 0 (0.0%) |
| Food Preparation & Serving | 0 (0.0%) | 0 (0.0%) |
| Cleaning & Maintenance | 0 (0.0%) | 0 (0.0%) |
| Personal Care & Service | 0 (0.0%) | 52 (100.0%) |
| Total (Category) | 0 (0.0%) | 52 (100.0%) |
| Total (Overall) | 140 (54.3%) | 118 (45.7%) |
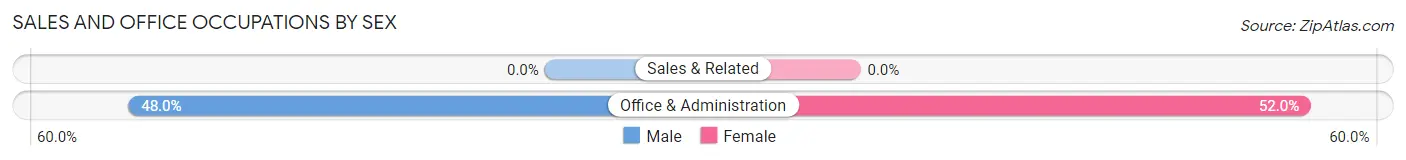
Sales and Office Occupations
The most common Sales and Office occupations in Scenic are , and Office & Administration (127 | 49.2%).
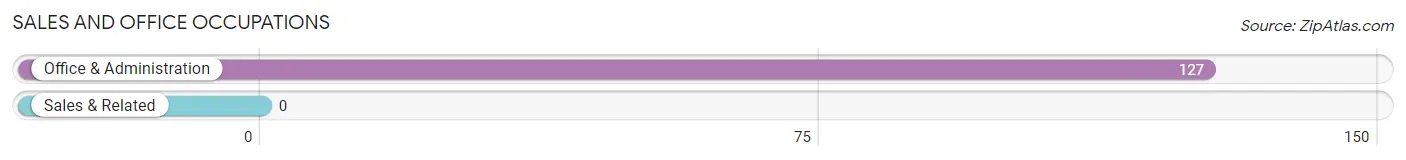
Sales and Office Occupations by Sex
| Occupation | Male | Female |
| Sales & Related | 0 (0.0%) | 0 (0.0%) |
| Office & Administration | 61 (48.0%) | 66 (52.0%) |
| Total (Category) | 61 (48.0%) | 66 (52.0%) |
| Total (Overall) | 140 (54.3%) | 118 (45.7%) |
Natural Resources, Construction and Maintenance Occupations
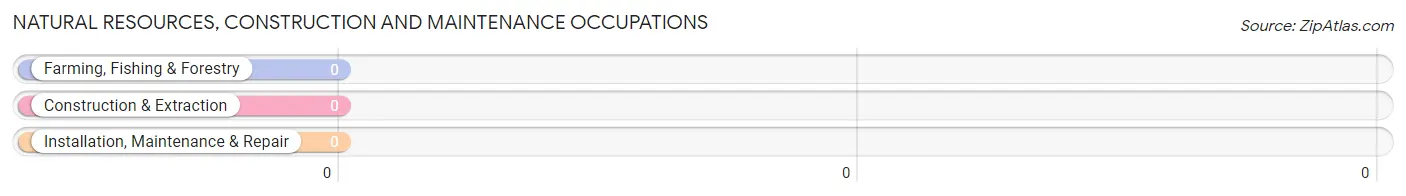
Natural Resources, Construction and Maintenance Occupations by Sex
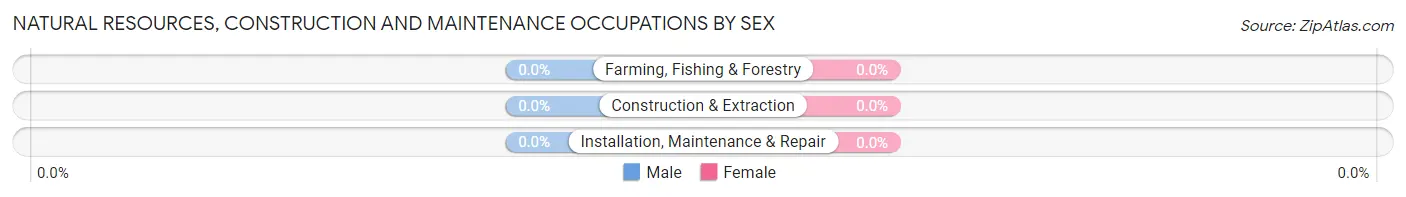
| Occupation | Male | Female |
| Farming, Fishing & Forestry | 0 (0.0%) | 0 (0.0%) |
| Construction & Extraction | 0 (0.0%) | 0 (0.0%) |
| Installation, Maintenance & Repair | 0 (0.0%) | 0 (0.0%) |
| Total (Category) | 0 (0.0%) | 0 (0.0%) |
| Total (Overall) | 140 (54.3%) | 118 (45.7%) |
Production, Transportation and Moving Occupations
Production, Transportation and Moving Occupations by Sex
| Occupation | Male | Female |
| Production | 0 (0.0%) | 0 (0.0%) |
| Transportation | 0 (0.0%) | 0 (0.0%) |
| Material Moving | 0 (0.0%) | 0 (0.0%) |
| Total (Category) | 0 (0.0%) | 0 (0.0%) |
| Total (Overall) | 140 (54.3%) | 118 (45.7%) |
Employment Industries by Sex in Scenic
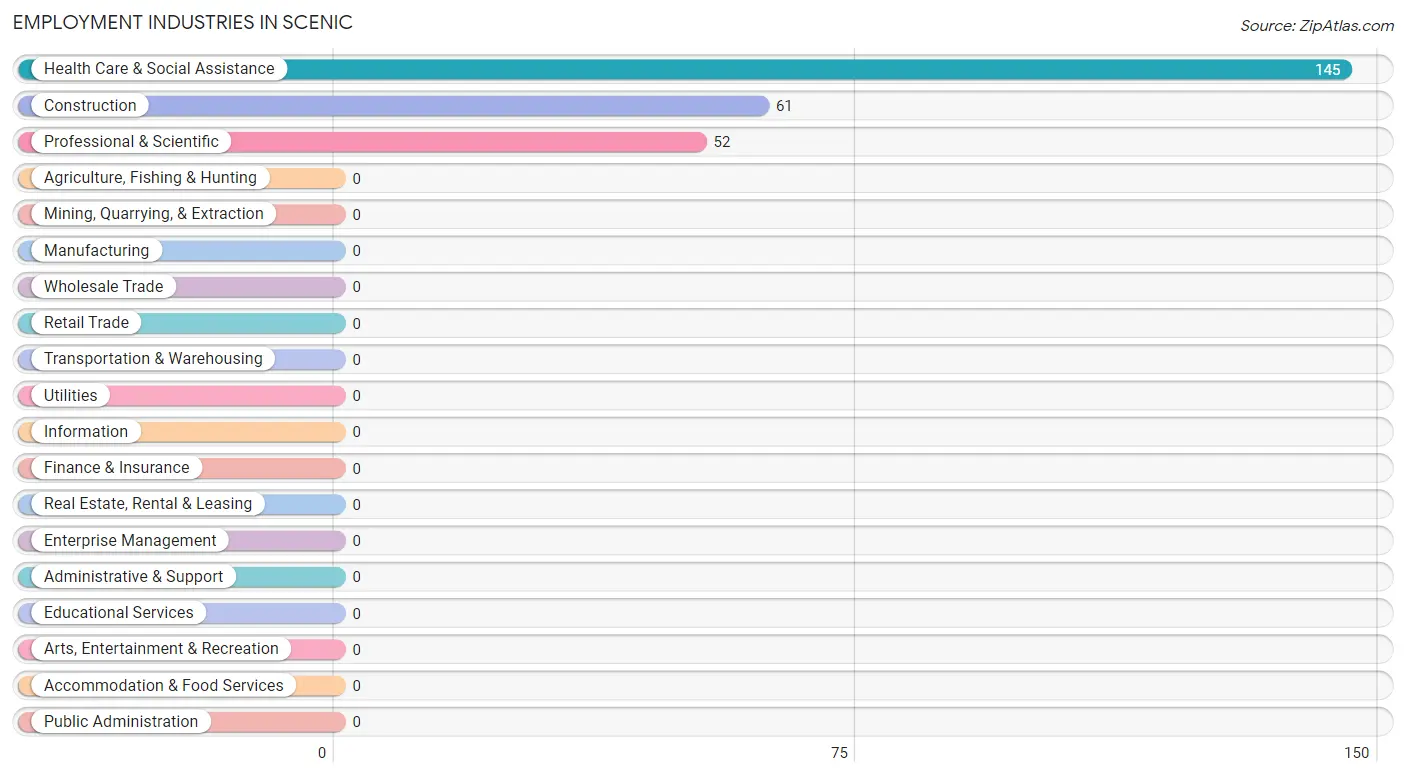
Employment Industries in Scenic
The major employment industries in Scenic include Health Care & Social Assistance (145 | 56.2%), Construction (61 | 23.6%), and Professional & Scientific (52 | 20.2%).
Employment Industries by Sex in Scenic
The Scenic industries that see more men than women are Construction (100.0%), and Health Care & Social Assistance (54.5%), whereas the industries that tend to have a higher number of women are Professional & Scientific (100.0%), and Health Care & Social Assistance (45.5%).
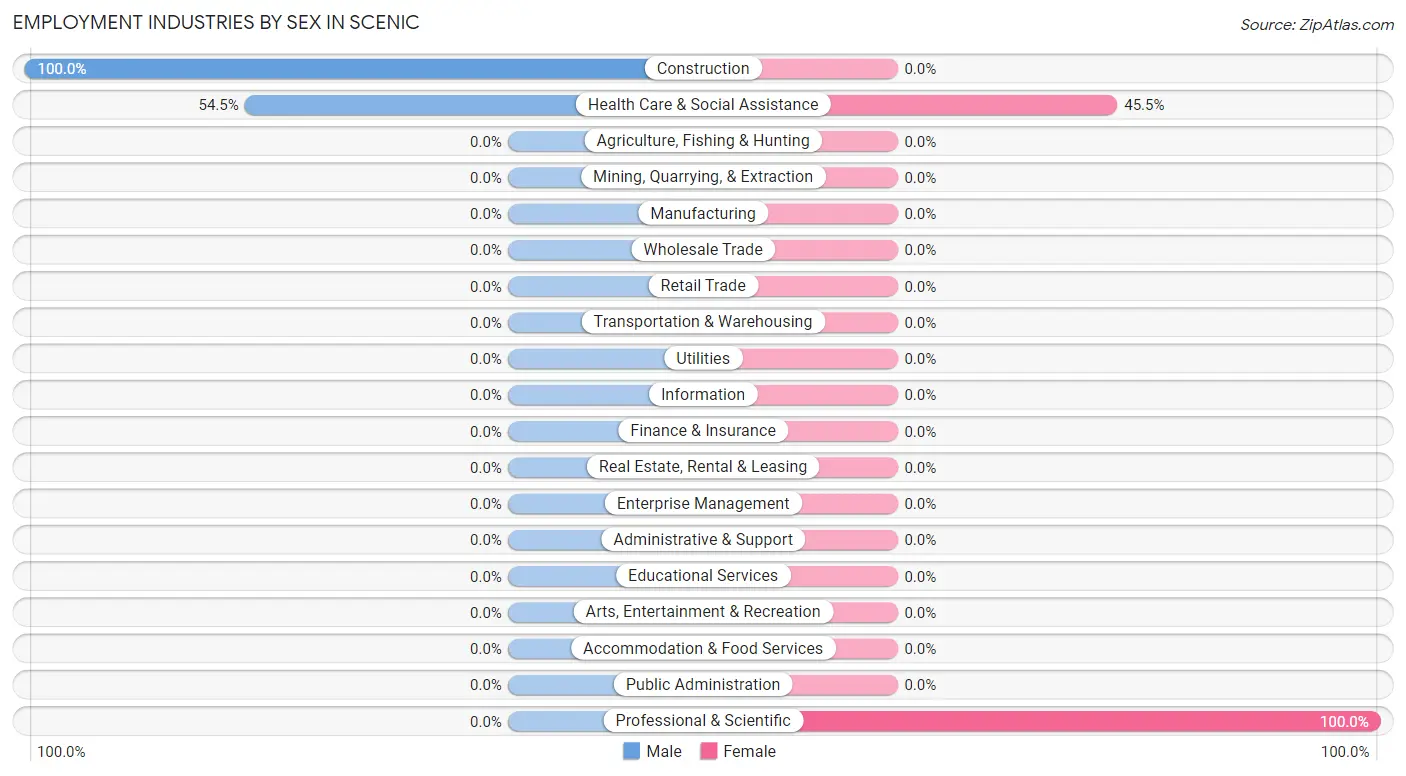
| Industry | Male | Female |
| Agriculture, Fishing & Hunting | 0 (0.0%) | 0 (0.0%) |
| Mining, Quarrying, & Extraction | 0 (0.0%) | 0 (0.0%) |
| Construction | 61 (100.0%) | 0 (0.0%) |
| Manufacturing | 0 (0.0%) | 0 (0.0%) |
| Wholesale Trade | 0 (0.0%) | 0 (0.0%) |
| Retail Trade | 0 (0.0%) | 0 (0.0%) |
| Transportation & Warehousing | 0 (0.0%) | 0 (0.0%) |
| Utilities | 0 (0.0%) | 0 (0.0%) |
| Information | 0 (0.0%) | 0 (0.0%) |
| Finance & Insurance | 0 (0.0%) | 0 (0.0%) |
| Real Estate, Rental & Leasing | 0 (0.0%) | 0 (0.0%) |
| Professional & Scientific | 0 (0.0%) | 52 (100.0%) |
| Enterprise Management | 0 (0.0%) | 0 (0.0%) |
| Administrative & Support | 0 (0.0%) | 0 (0.0%) |
| Educational Services | 0 (0.0%) | 0 (0.0%) |
| Health Care & Social Assistance | 79 (54.5%) | 66 (45.5%) |
| Arts, Entertainment & Recreation | 0 (0.0%) | 0 (0.0%) |
| Accommodation & Food Services | 0 (0.0%) | 0 (0.0%) |
| Public Administration | 0 (0.0%) | 0 (0.0%) |
| Total | 140 (54.3%) | 118 (45.7%) |
Education in Scenic
School Enrollment in Scenic
The most common levels of schooling among the 416 students in Scenic are elementary school (162 | 38.9%), middle school (123 | 29.6%), and college / undergraduate (79 | 19.0%).
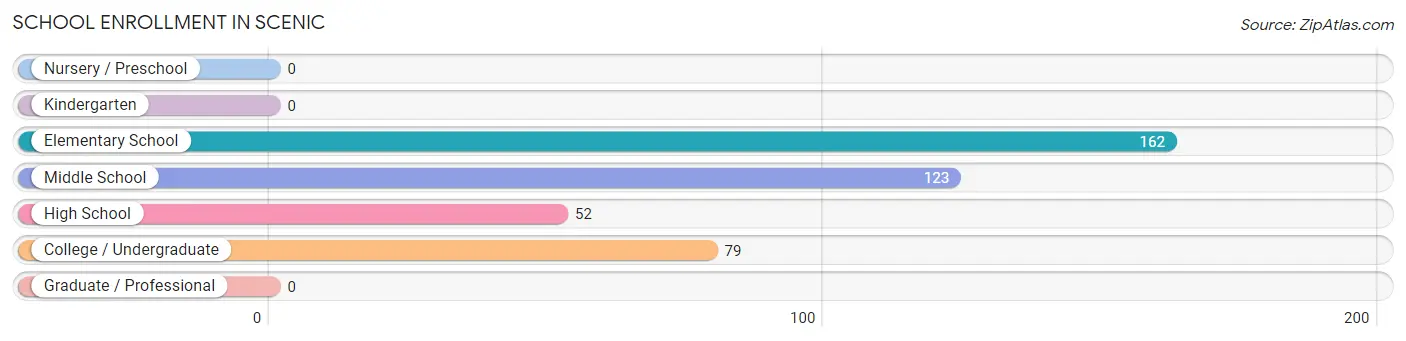
| School Level | # Students | % Students |
| Nursery / Preschool | 0 | 0.0% |
| Kindergarten | 0 | 0.0% |
| Elementary School | 162 | 38.9% |
| Middle School | 123 | 29.6% |
| High School | 52 | 12.5% |
| College / Undergraduate | 79 | 19.0% |
| Graduate / Professional | 0 | 0.0% |
| Total | 416 | 100.0% |
School Enrollment by Age by Funding Source in Scenic
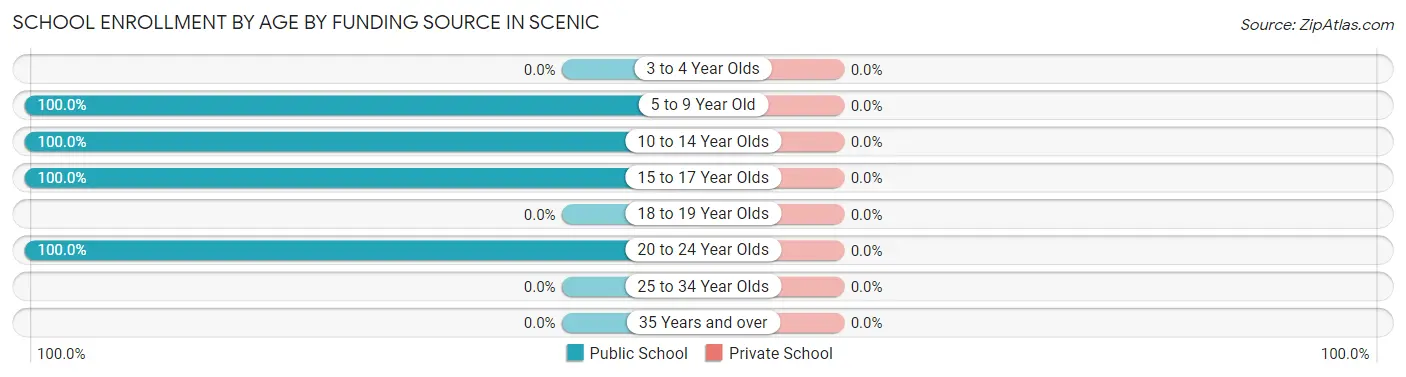
| Age Bracket | Public School | Private School |
| 3 to 4 Year Olds | 0 (0.0%) | 0 (0.0%) |
| 5 to 9 Year Old | 203 (100.0%) | 0 (0.0%) |
| 10 to 14 Year Olds | 82 (100.0%) | 0 (0.0%) |
| 15 to 17 Year Olds | 52 (100.0%) | 0 (0.0%) |
| 18 to 19 Year Olds | 0 (0.0%) | 0 (0.0%) |
| 20 to 24 Year Olds | 79 (100.0%) | 0 (0.0%) |
| 25 to 34 Year Olds | 0 (0.0%) | 0 (0.0%) |
| 35 Years and over | 0 (0.0%) | 0 (0.0%) |
| Total | 416 (100.0%) | 0 (0.0%) |
Educational Attainment by Field of Study in Scenic
Business (72 | 62.6%), and education (43 | 37.4%) are the most common fields of study among 115 individuals in Scenic who have obtained a bachelor's degree or higher.
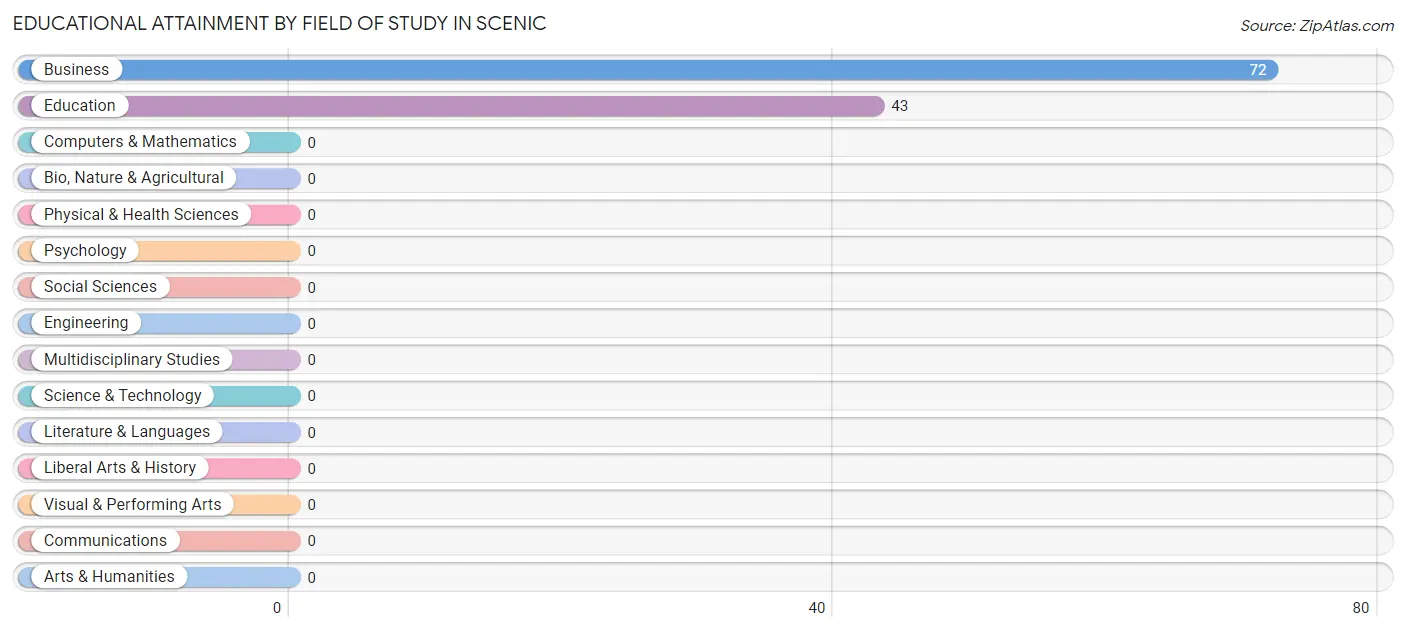
| Field of Study | # Graduates | % Graduates |
| Computers & Mathematics | 0 | 0.0% |
| Bio, Nature & Agricultural | 0 | 0.0% |
| Physical & Health Sciences | 0 | 0.0% |
| Psychology | 0 | 0.0% |
| Social Sciences | 0 | 0.0% |
| Engineering | 0 | 0.0% |
| Multidisciplinary Studies | 0 | 0.0% |
| Science & Technology | 0 | 0.0% |
| Business | 72 | 62.6% |
| Education | 43 | 37.4% |
| Literature & Languages | 0 | 0.0% |
| Liberal Arts & History | 0 | 0.0% |
| Visual & Performing Arts | 0 | 0.0% |
| Communications | 0 | 0.0% |
| Arts & Humanities | 0 | 0.0% |
| Total | 115 | 100.0% |
Transportation & Commute in Scenic
Vehicle Availability by Sex in Scenic
The most prevalent vehicle ownership categories in Scenic are males with 3 vehicles (79, accounting for 56.4%) and females with 3 vehicles (118, making up 66.9%).

| Vehicles Available | Male | Female |
| No Vehicle | 0 (0.0%) | 0 (0.0%) |
| 1 Vehicle | 0 (0.0%) | 0 (0.0%) |
| 2 Vehicles | 61 (43.6%) | 0 (0.0%) |
| 3 Vehicles | 79 (56.4%) | 118 (100.0%) |
| 4 Vehicles | 0 (0.0%) | 0 (0.0%) |
| 5 or more Vehicles | 0 (0.0%) | 0 (0.0%) |
| Total | 140 (100.0%) | 118 (100.0%) |
Commute Time in Scenic
The most frequently occuring commute durations in Scenic are 15 to 19 minutes (140 commuters, 54.3%), 45 to 59 minutes (66 commuters, 25.6%), and 20 to 24 minutes (52 commuters, 20.2%).
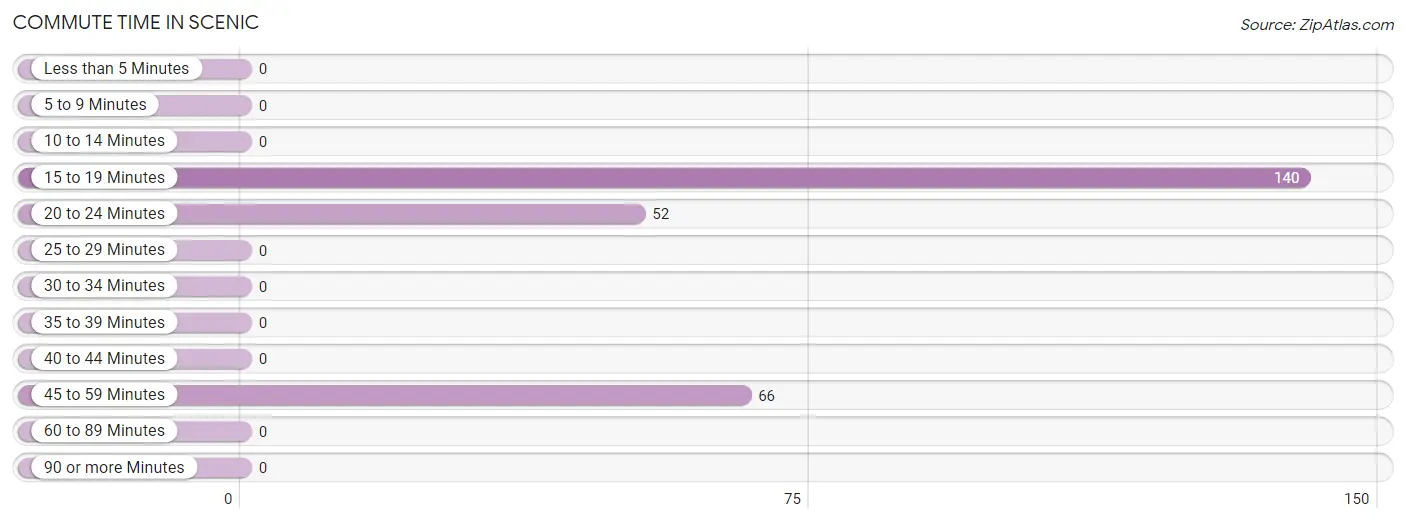
| Commute Time | # Commuters | % Commuters |
| Less than 5 Minutes | 0 | 0.0% |
| 5 to 9 Minutes | 0 | 0.0% |
| 10 to 14 Minutes | 0 | 0.0% |
| 15 to 19 Minutes | 140 | 54.3% |
| 20 to 24 Minutes | 52 | 20.2% |
| 25 to 29 Minutes | 0 | 0.0% |
| 30 to 34 Minutes | 0 | 0.0% |
| 35 to 39 Minutes | 0 | 0.0% |
| 40 to 44 Minutes | 0 | 0.0% |
| 45 to 59 Minutes | 66 | 25.6% |
| 60 to 89 Minutes | 0 | 0.0% |
| 90 or more Minutes | 0 | 0.0% |
Commute Time by Sex in Scenic
The most common commute times in Scenic are 15 to 19 minutes (140 commuters, 100.0%) for males and 45 to 59 minutes (66 commuters, 55.9%) for females.
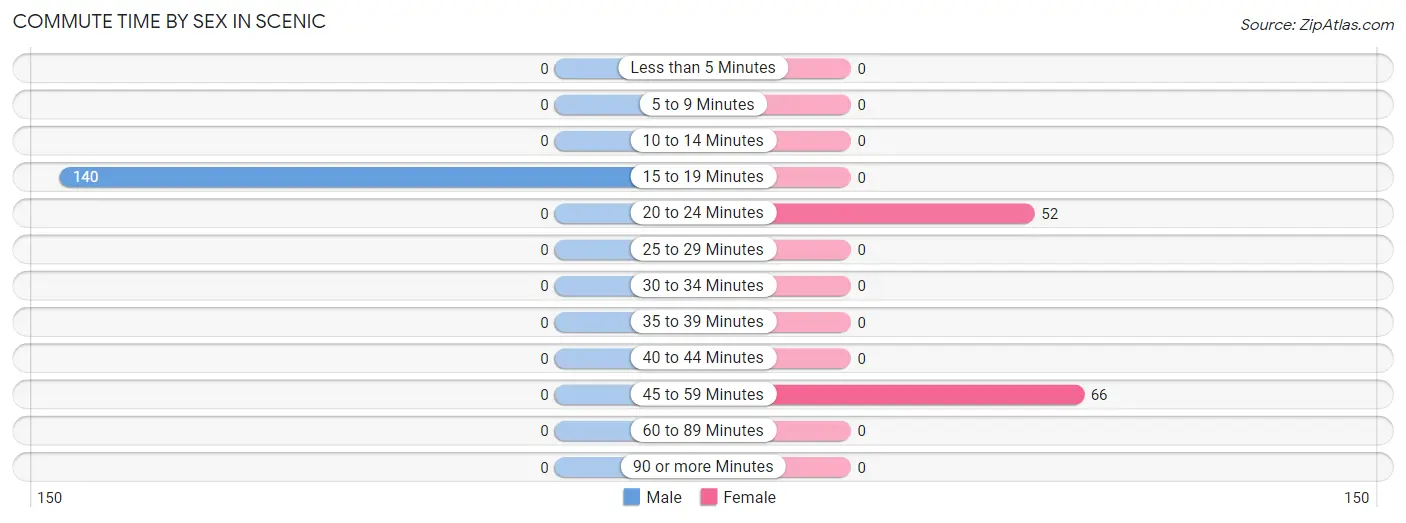
| Commute Time | Male | Female |
| Less than 5 Minutes | 0 (0.0%) | 0 (0.0%) |
| 5 to 9 Minutes | 0 (0.0%) | 0 (0.0%) |
| 10 to 14 Minutes | 0 (0.0%) | 0 (0.0%) |
| 15 to 19 Minutes | 140 (100.0%) | 0 (0.0%) |
| 20 to 24 Minutes | 0 (0.0%) | 52 (44.1%) |
| 25 to 29 Minutes | 0 (0.0%) | 0 (0.0%) |
| 30 to 34 Minutes | 0 (0.0%) | 0 (0.0%) |
| 35 to 39 Minutes | 0 (0.0%) | 0 (0.0%) |
| 40 to 44 Minutes | 0 (0.0%) | 0 (0.0%) |
| 45 to 59 Minutes | 0 (0.0%) | 66 (55.9%) |
| 60 to 89 Minutes | 0 (0.0%) | 0 (0.0%) |
| 90 or more Minutes | 0 (0.0%) | 0 (0.0%) |
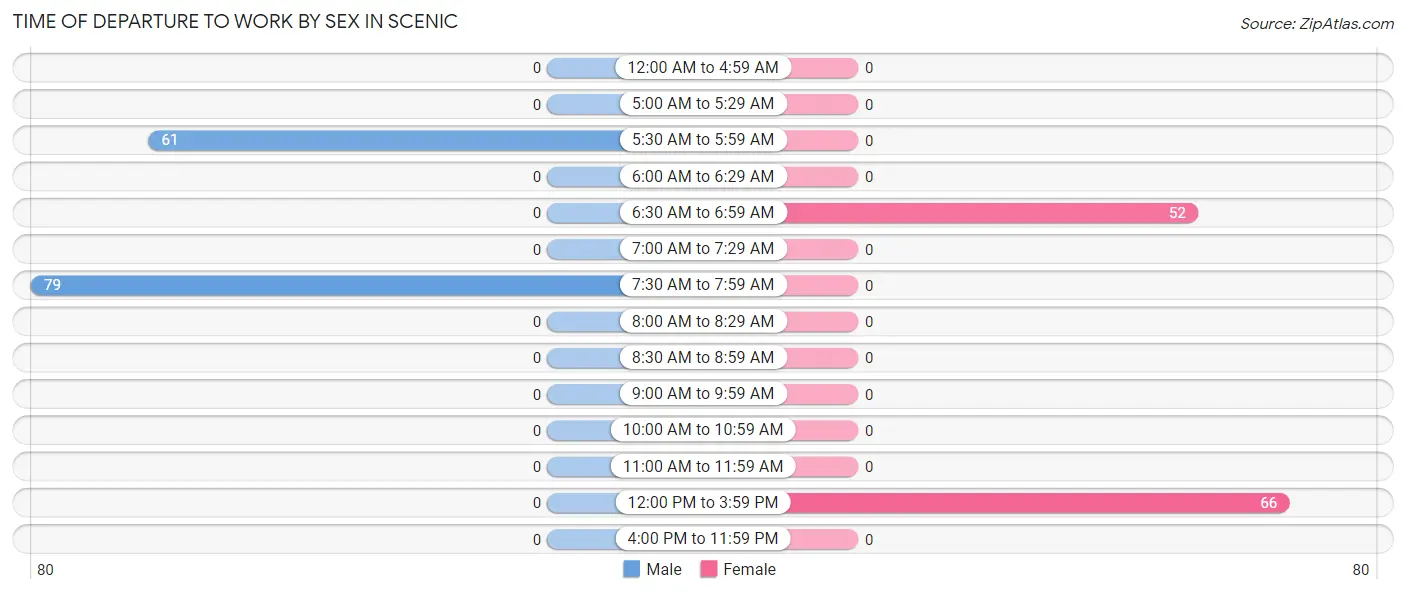
Time of Departure to Work by Sex in Scenic
The most frequent times of departure to work in Scenic are 7:30 AM to 7:59 AM (79, 56.4%) for males and 12:00 PM to 3:59 PM (66, 55.9%) for females.
| Time of Departure | Male | Female |
| 12:00 AM to 4:59 AM | 0 (0.0%) | 0 (0.0%) |
| 5:00 AM to 5:29 AM | 0 (0.0%) | 0 (0.0%) |
| 5:30 AM to 5:59 AM | 61 (43.6%) | 0 (0.0%) |
| 6:00 AM to 6:29 AM | 0 (0.0%) | 0 (0.0%) |
| 6:30 AM to 6:59 AM | 0 (0.0%) | 52 (44.1%) |
| 7:00 AM to 7:29 AM | 0 (0.0%) | 0 (0.0%) |
| 7:30 AM to 7:59 AM | 79 (56.4%) | 0 (0.0%) |
| 8:00 AM to 8:29 AM | 0 (0.0%) | 0 (0.0%) |
| 8:30 AM to 8:59 AM | 0 (0.0%) | 0 (0.0%) |
| 9:00 AM to 9:59 AM | 0 (0.0%) | 0 (0.0%) |
| 10:00 AM to 10:59 AM | 0 (0.0%) | 0 (0.0%) |
| 11:00 AM to 11:59 AM | 0 (0.0%) | 0 (0.0%) |
| 12:00 PM to 3:59 PM | 0 (0.0%) | 66 (55.9%) |
| 4:00 PM to 11:59 PM | 0 (0.0%) | 0 (0.0%) |
| Total | 140 (100.0%) | 118 (100.0%) |
Housing Occupancy in Scenic
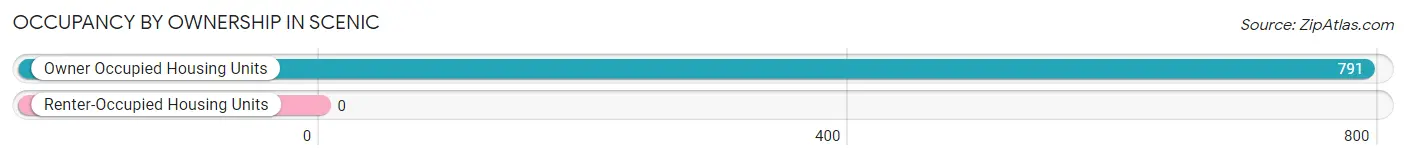
Occupancy by Ownership in Scenic
Of the total 791 dwellings in Scenic, owner-occupied units account for 791 (100.0%), while renter-occupied units make up 0 (0.0%).
| Occupancy | # Housing Units | % Housing Units |
| Owner Occupied Housing Units | 791 | 100.0% |
| Renter-Occupied Housing Units | 0 | 0.0% |
| Total Occupied Housing Units | 791 | 100.0% |
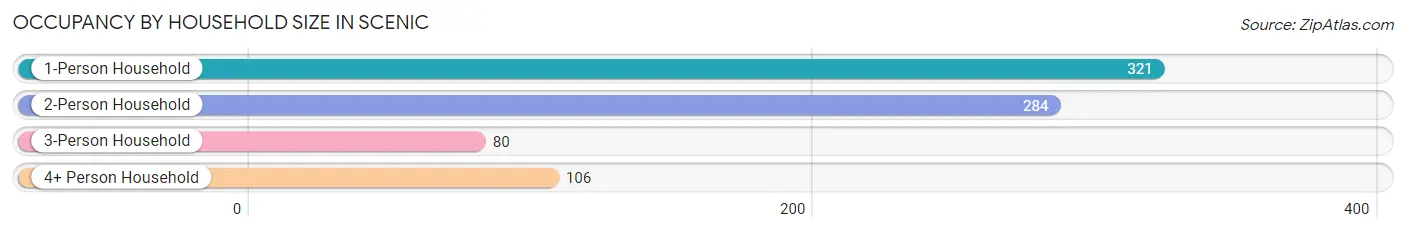
Occupancy by Household Size in Scenic
| Household Size | # Housing Units | % Housing Units |
| 1-Person Household | 321 | 40.6% |
| 2-Person Household | 284 | 35.9% |
| 3-Person Household | 80 | 10.1% |
| 4+ Person Household | 106 | 13.4% |
| Total Housing Units | 791 | 100.0% |
Occupancy by Ownership by Household Size in Scenic
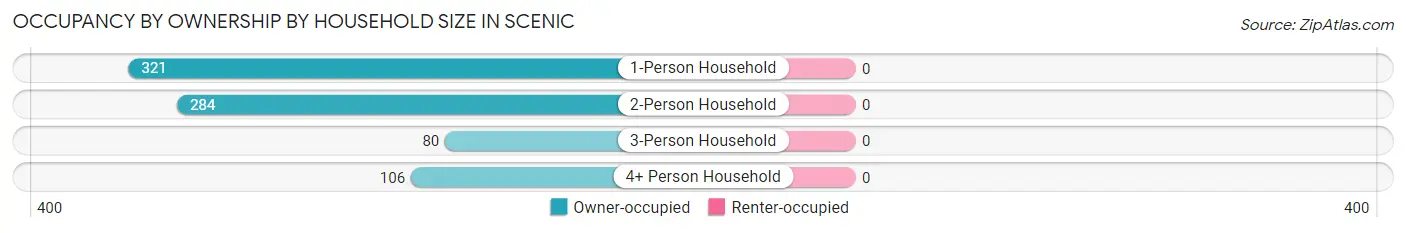
| Household Size | Owner-occupied | Renter-occupied |
| 1-Person Household | 321 (100.0%) | 0 (0.0%) |
| 2-Person Household | 284 (100.0%) | 0 (0.0%) |
| 3-Person Household | 80 (100.0%) | 0 (0.0%) |
| 4+ Person Household | 106 (100.0%) | 0 (0.0%) |
| Total Housing Units | 791 (100.0%) | 0 (0.0%) |
Occupancy by Educational Attainment in Scenic
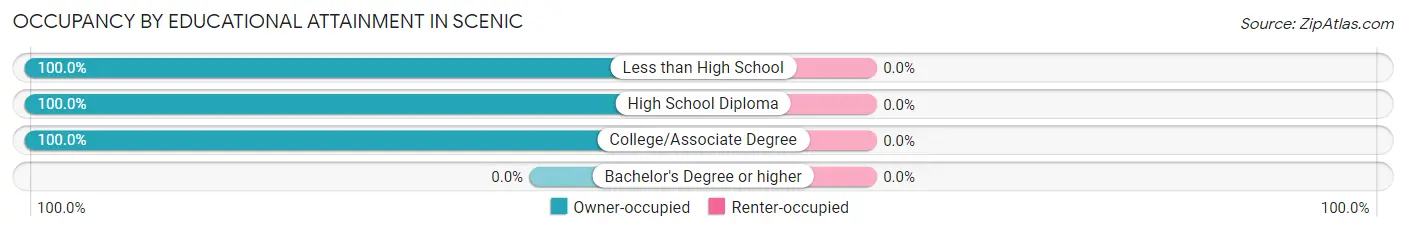
| Household Size | Owner-occupied | Renter-occupied |
| Less than High School | 251 (100.0%) | 0 (0.0%) |
| High School Diploma | 152 (100.0%) | 0 (0.0%) |
| College/Associate Degree | 388 (100.0%) | 0 (0.0%) |
| Bachelor's Degree or higher | 0 (0.0%) | 0 (0.0%) |
Occupancy by Age of Householder in Scenic
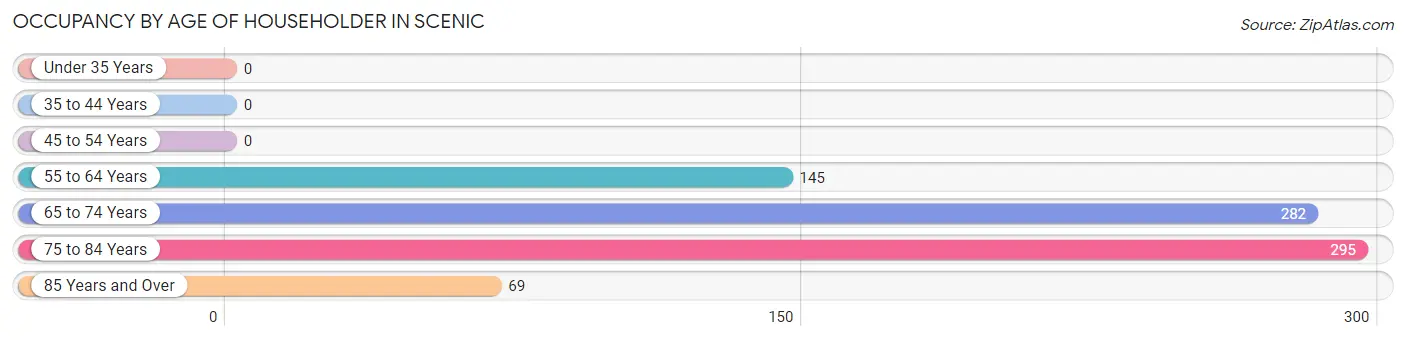
| Age Bracket | # Households | % Households |
| Under 35 Years | 0 | 0.0% |
| 35 to 44 Years | 0 | 0.0% |
| 45 to 54 Years | 0 | 0.0% |
| 55 to 64 Years | 145 | 18.3% |
| 65 to 74 Years | 282 | 35.6% |
| 75 to 84 Years | 295 | 37.3% |
| 85 Years and Over | 69 | 8.7% |
| Total | 791 | 100.0% |
Housing Finances in Scenic
Median Income by Occupancy in Scenic
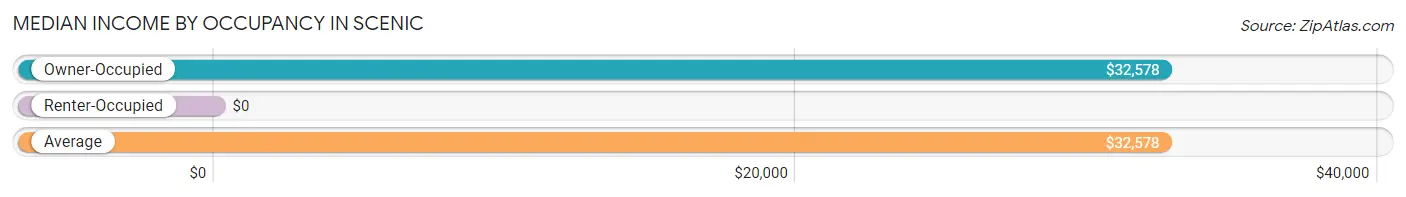
| Occupancy Type | # Households | Median Income |
| Owner-Occupied | 791 (100.0%) | $32,578 |
| Renter-Occupied | 0 (0.0%) | $0 |
| Average | 791 (100.0%) | $32,578 |
Occupancy by Householder Income Bracket in Scenic
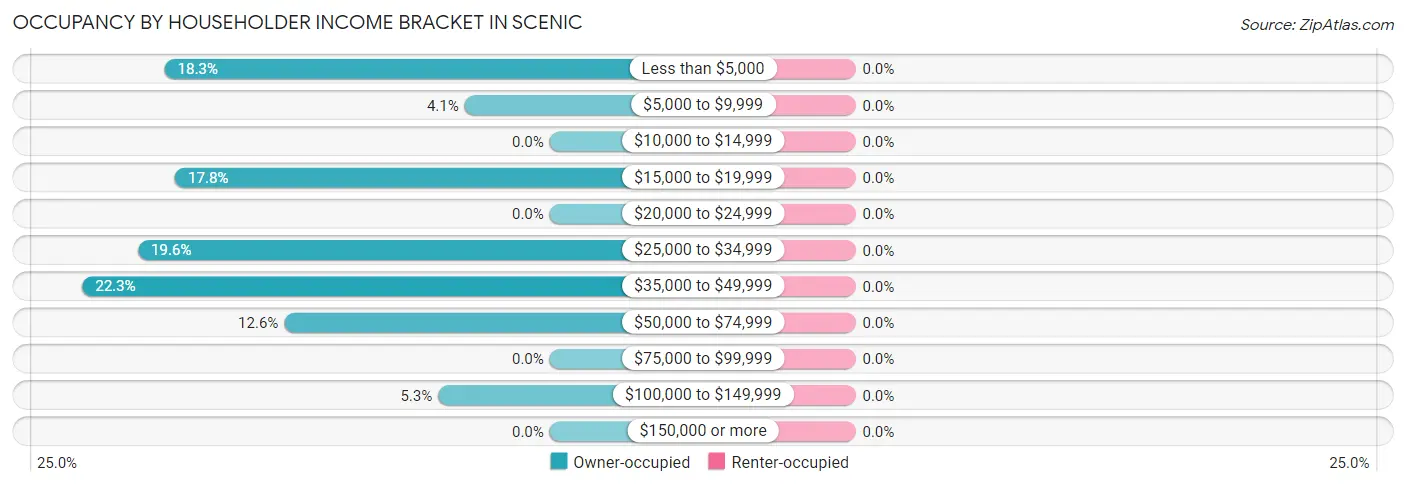
| Income Bracket | Owner-occupied | Renter-occupied |
| Less than $5,000 | 145 (18.3%) | 0 (0.0%) |
| $5,000 to $9,999 | 32 (4.1%) | 0 (0.0%) |
| $10,000 to $14,999 | 0 (0.0%) | 0 (0.0%) |
| $15,000 to $19,999 | 141 (17.8%) | 0 (0.0%) |
| $20,000 to $24,999 | 0 (0.0%) | 0 (0.0%) |
| $25,000 to $34,999 | 155 (19.6%) | 0 (0.0%) |
| $35,000 to $49,999 | 176 (22.3%) | 0 (0.0%) |
| $50,000 to $74,999 | 100 (12.6%) | 0 (0.0%) |
| $75,000 to $99,999 | 0 (0.0%) | 0 (0.0%) |
| $100,000 to $149,999 | 42 (5.3%) | 0 (0.0%) |
| $150,000 or more | 0 (0.0%) | 0 (0.0%) |
| Total | 791 (100.0%) | 0 (0.0%) |
Monthly Housing Cost Tiers in Scenic
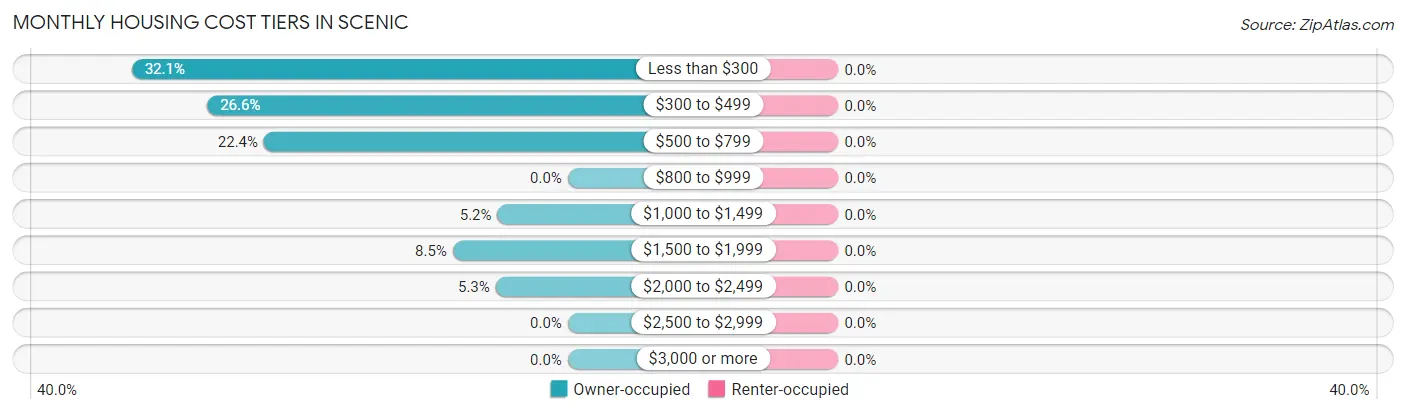
| Monthly Cost | Owner-occupied | Renter-occupied |
| Less than $300 | 254 (32.1%) | 0 (0.0%) |
| $300 to $499 | 210 (26.6%) | 0 (0.0%) |
| $500 to $799 | 177 (22.4%) | 0 (0.0%) |
| $800 to $999 | 0 (0.0%) | 0 (0.0%) |
| $1,000 to $1,499 | 41 (5.2%) | 0 (0.0%) |
| $1,500 to $1,999 | 67 (8.5%) | 0 (0.0%) |
| $2,000 to $2,499 | 42 (5.3%) | 0 (0.0%) |
| $2,500 to $2,999 | 0 (0.0%) | 0 (0.0%) |
| $3,000 or more | 0 (0.0%) | 0 (0.0%) |
| Total | 791 (100.0%) | 0 (0.0%) |
Physical Housing Characteristics in Scenic
Housing Structures in Scenic
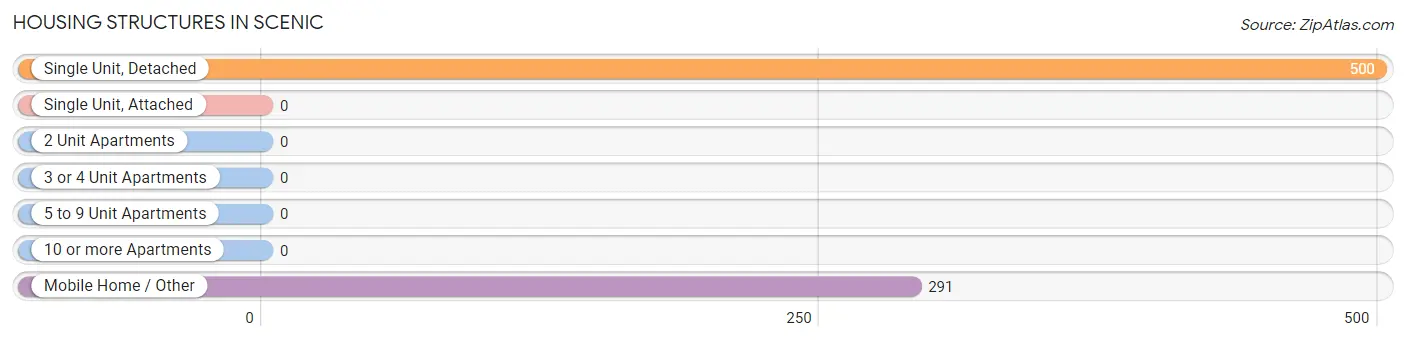
| Structure Type | # Housing Units | % Housing Units |
| Single Unit, Detached | 500 | 63.2% |
| Single Unit, Attached | 0 | 0.0% |
| 2 Unit Apartments | 0 | 0.0% |
| 3 or 4 Unit Apartments | 0 | 0.0% |
| 5 to 9 Unit Apartments | 0 | 0.0% |
| 10 or more Apartments | 0 | 0.0% |
| Mobile Home / Other | 291 | 36.8% |
| Total | 791 | 100.0% |
Housing Structures by Occupancy in Scenic
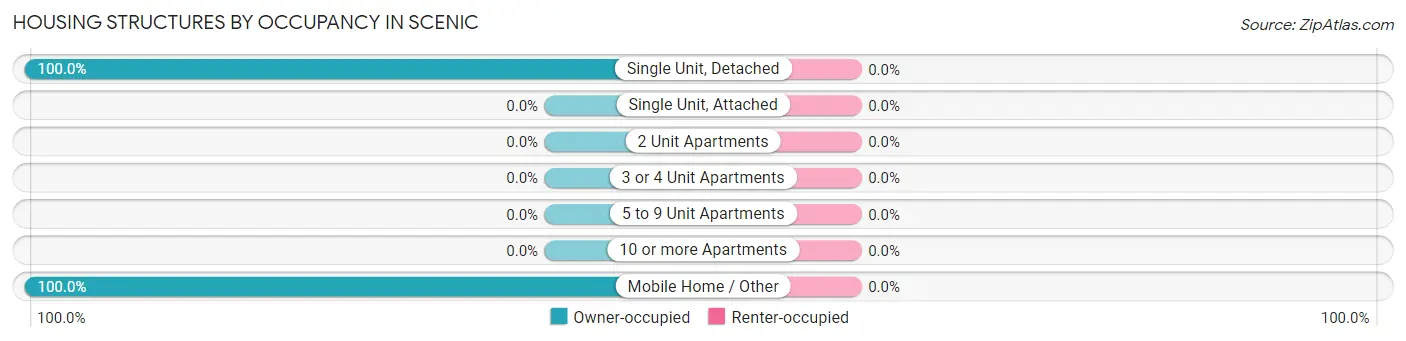
| Structure Type | Owner-occupied | Renter-occupied |
| Single Unit, Detached | 500 (100.0%) | 0 (0.0%) |
| Single Unit, Attached | 0 (0.0%) | 0 (0.0%) |
| 2 Unit Apartments | 0 (0.0%) | 0 (0.0%) |
| 3 or 4 Unit Apartments | 0 (0.0%) | 0 (0.0%) |
| 5 to 9 Unit Apartments | 0 (0.0%) | 0 (0.0%) |
| 10 or more Apartments | 0 (0.0%) | 0 (0.0%) |
| Mobile Home / Other | 291 (100.0%) | 0 (0.0%) |
| Total | 791 (100.0%) | 0 (0.0%) |
Housing Structures by Number of Rooms in Scenic
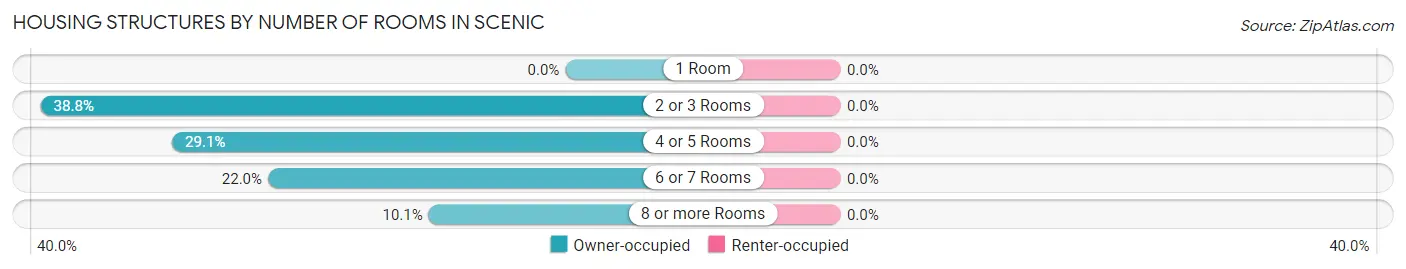
| Number of Rooms | Owner-occupied | Renter-occupied |
| 1 Room | 0 (0.0%) | 0 (0.0%) |
| 2 or 3 Rooms | 307 (38.8%) | 0 (0.0%) |
| 4 or 5 Rooms | 230 (29.1%) | 0 (0.0%) |
| 6 or 7 Rooms | 174 (22.0%) | 0 (0.0%) |
| 8 or more Rooms | 80 (10.1%) | 0 (0.0%) |
| Total | 791 (100.0%) | 0 (0.0%) |
Housing Structure by Heating Type in Scenic
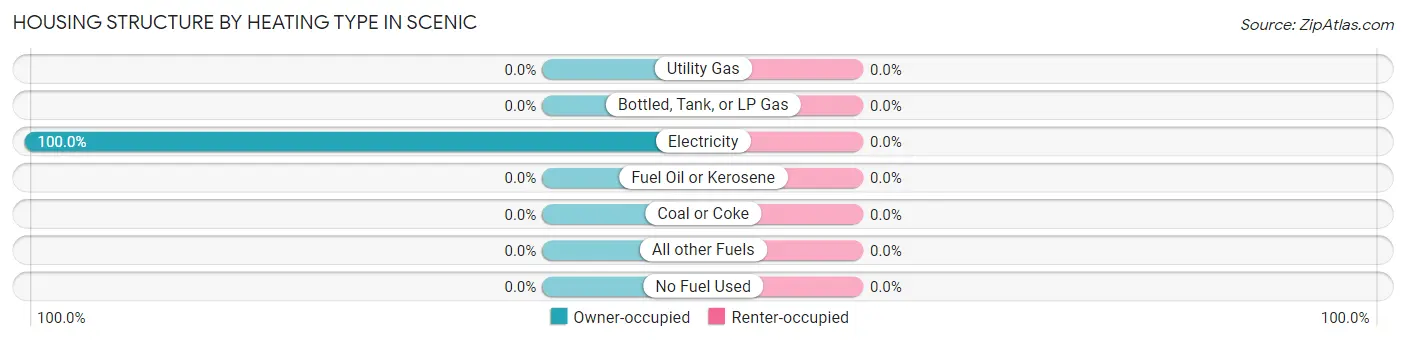
| Heating Type | Owner-occupied | Renter-occupied |
| Utility Gas | 0 (0.0%) | 0 (0.0%) |
| Bottled, Tank, or LP Gas | 0 (0.0%) | 0 (0.0%) |
| Electricity | 791 (100.0%) | 0 (0.0%) |
| Fuel Oil or Kerosene | 0 (0.0%) | 0 (0.0%) |
| Coal or Coke | 0 (0.0%) | 0 (0.0%) |
| All other Fuels | 0 (0.0%) | 0 (0.0%) |
| No Fuel Used | 0 (0.0%) | 0 (0.0%) |
| Total | 791 (100.0%) | 0 (0.0%) |
Household Vehicle Usage in Scenic
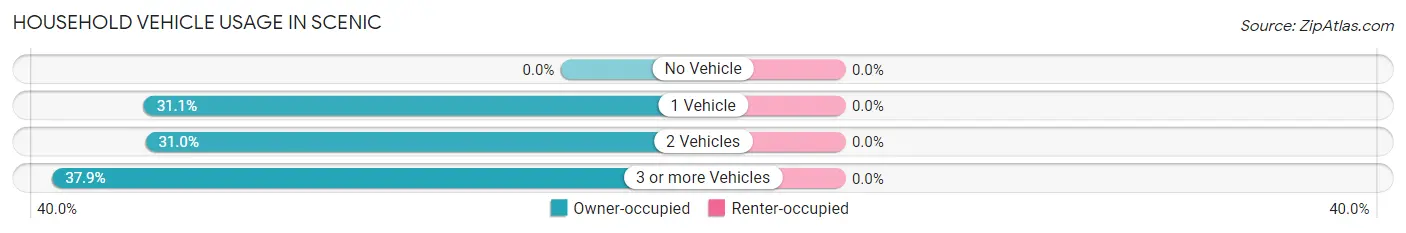
| Vehicles per Household | Owner-occupied | Renter-occupied |
| No Vehicle | 0 (0.0%) | 0 (0.0%) |
| 1 Vehicle | 246 (31.1%) | 0 (0.0%) |
| 2 Vehicles | 245 (31.0%) | 0 (0.0%) |
| 3 or more Vehicles | 300 (37.9%) | 0 (0.0%) |
| Total | 791 (100.0%) | 0 (0.0%) |
Real Estate & Mortgages in Scenic
Real Estate and Mortgage Overview in Scenic
| Characteristic | Without Mortgage | With Mortgage |
| Housing Units | 641 | 150 |
| Median Property Value | - | - |
| Median Household Income | $25,083 | $0 |
| Monthly Housing Costs | $324 | $0 |
| Real Estate Taxes | $373 | $0 |
Property Value by Mortgage Status in Scenic
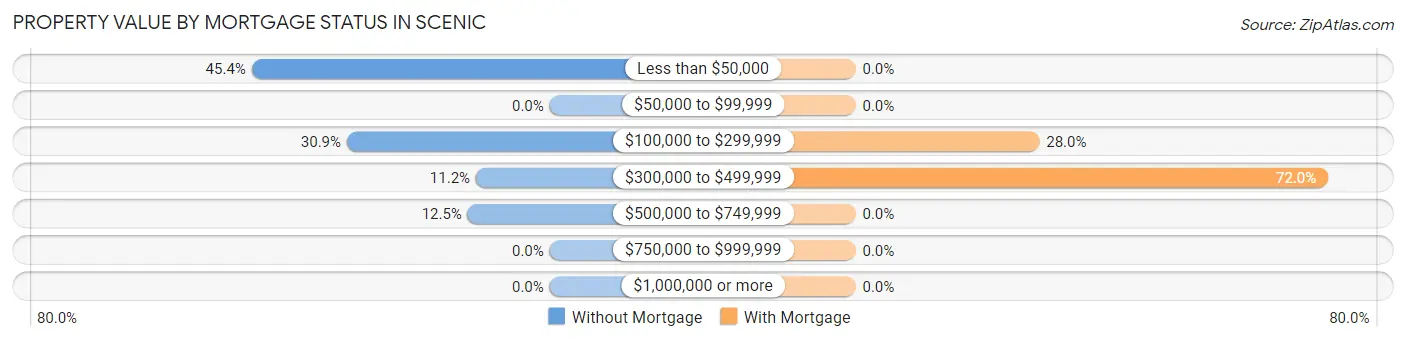
| Property Value | Without Mortgage | With Mortgage |
| Less than $50,000 | 291 (45.4%) | 0 (0.0%) |
| $50,000 to $99,999 | 0 (0.0%) | 0 (0.0%) |
| $100,000 to $299,999 | 198 (30.9%) | 42 (28.0%) |
| $300,000 to $499,999 | 72 (11.2%) | 108 (72.0%) |
| $500,000 to $749,999 | 80 (12.5%) | 0 (0.0%) |
| $750,000 to $999,999 | 0 (0.0%) | 0 (0.0%) |
| $1,000,000 or more | 0 (0.0%) | 0 (0.0%) |
| Total | 641 (100.0%) | 150 (100.0%) |
Household Income by Mortgage Status in Scenic
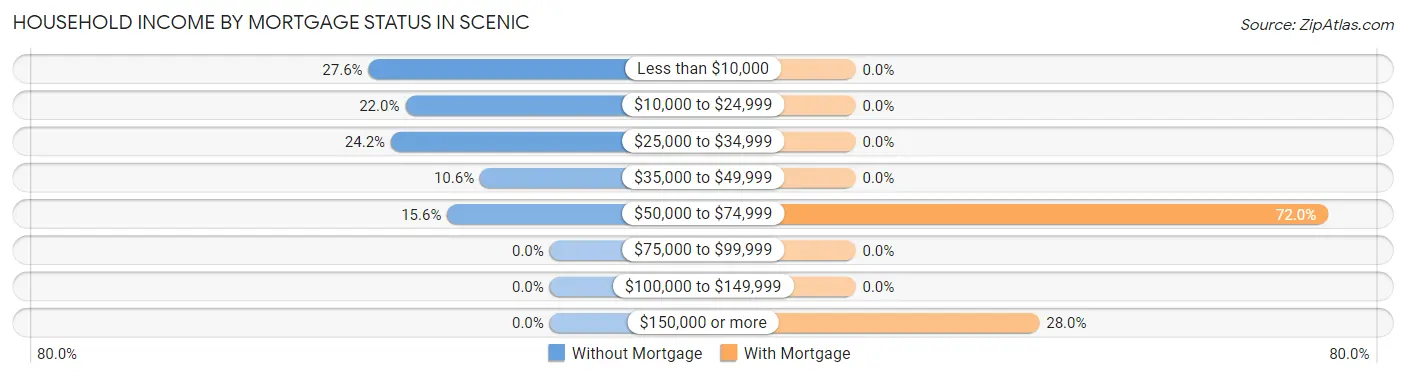
| Household Income | Without Mortgage | With Mortgage |
| Less than $10,000 | 177 (27.6%) | 0 (0.0%) |
| $10,000 to $24,999 | 141 (22.0%) | 0 (0.0%) |
| $25,000 to $34,999 | 155 (24.2%) | 0 (0.0%) |
| $35,000 to $49,999 | 68 (10.6%) | 0 (0.0%) |
| $50,000 to $74,999 | 100 (15.6%) | 108 (72.0%) |
| $75,000 to $99,999 | 0 (0.0%) | 0 (0.0%) |
| $100,000 to $149,999 | 0 (0.0%) | 0 (0.0%) |
| $150,000 or more | 0 (0.0%) | 42 (28.0%) |
| Total | 641 (100.0%) | 150 (100.0%) |
Property Value to Household Income Ratio in Scenic
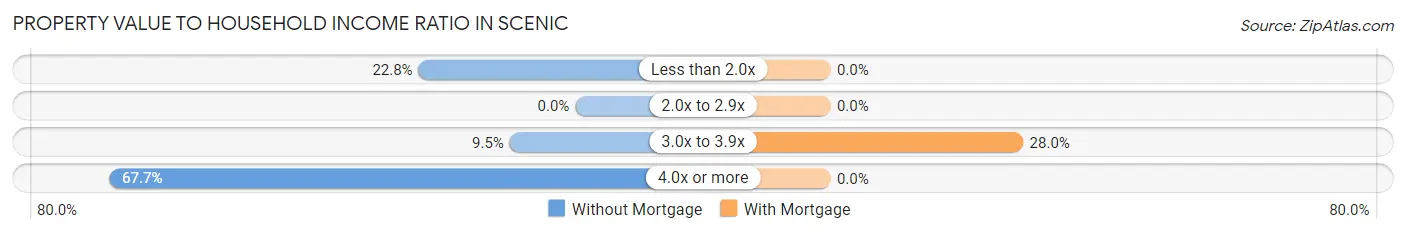
| Value-to-Income Ratio | Without Mortgage | With Mortgage |
| Less than 2.0x | 146 (22.8%) | 0 (0.0%) |
| 2.0x to 2.9x | 0 (0.0%) | 0 (0.0%) |
| 3.0x to 3.9x | 61 (9.5%) | 42 (28.0%) |
| 4.0x or more | 434 (67.7%) | 0 (0.0%) |
| Total | 641 (100.0%) | 150 (100.0%) |
Real Estate Taxes by Mortgage Status in Scenic
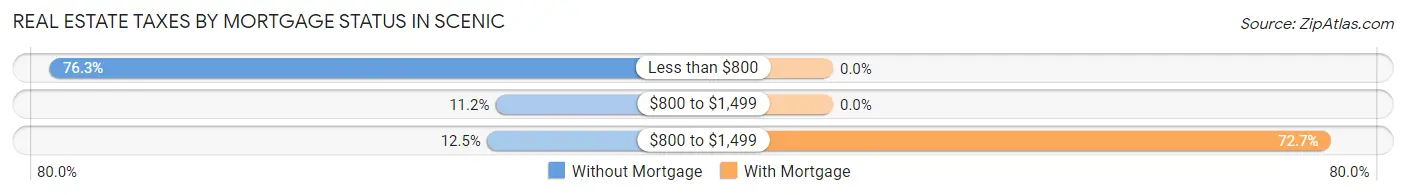
| Property Taxes | Without Mortgage | With Mortgage |
| Less than $800 | 489 (76.3%) | 0 (0.0%) |
| $800 to $1,499 | 72 (11.2%) | 0 (0.0%) |
| $800 to $1,499 | 80 (12.5%) | 109 (72.7%) |
| Total | 641 (100.0%) | 150 (100.0%) |
Health & Disability in Scenic
Health Insurance Coverage by Age in Scenic
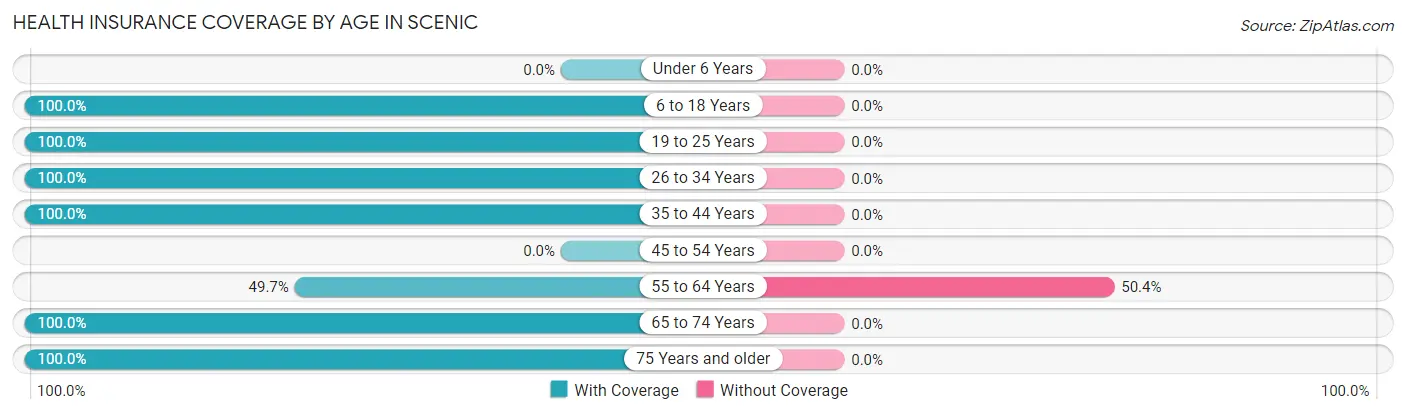
| Age Bracket | With Coverage | Without Coverage |
| Under 6 Years | 0 (0.0%) | 0 (0.0%) |
| 6 to 18 Years | 337 (100.0%) | 0 (0.0%) |
| 19 to 25 Years | 79 (100.0%) | 0 (0.0%) |
| 26 to 34 Years | 118 (100.0%) | 0 (0.0%) |
| 35 to 44 Years | 77 (100.0%) | 0 (0.0%) |
| 45 to 54 Years | 0 (0.0%) | 0 (0.0%) |
| 55 to 64 Years | 143 (49.6%) | 145 (50.3%) |
| 65 to 74 Years | 387 (100.0%) | 0 (0.0%) |
| 75 Years and older | 554 (100.0%) | 0 (0.0%) |
| Total | 1,695 (92.1%) | 145 (7.9%) |
Health Insurance Coverage by Citizenship Status in Scenic
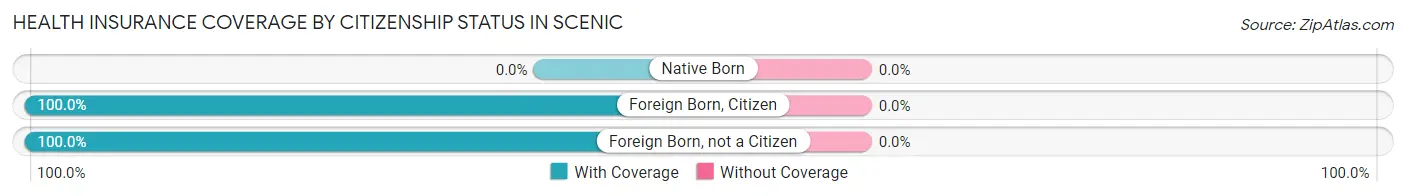
| Citizenship Status | With Coverage | Without Coverage |
| Native Born | 0 (0.0%) | 0 (0.0%) |
| Foreign Born, Citizen | 337 (100.0%) | 0 (0.0%) |
| Foreign Born, not a Citizen | 79 (100.0%) | 0 (0.0%) |
Health Insurance Coverage by Household Income in Scenic
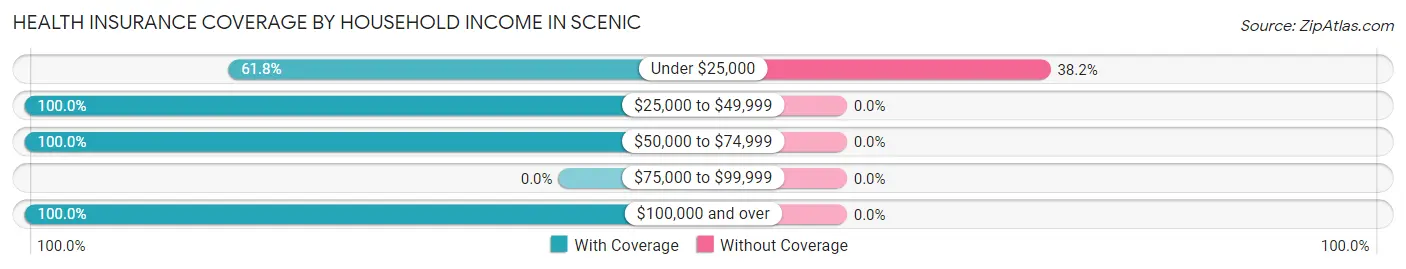
| Household Income | With Coverage | Without Coverage |
| Under $25,000 | 235 (61.8%) | 145 (38.2%) |
| $25,000 to $49,999 | 818 (100.0%) | 0 (0.0%) |
| $50,000 to $74,999 | 552 (100.0%) | 0 (0.0%) |
| $75,000 to $99,999 | 0 (0.0%) | 0 (0.0%) |
| $100,000 and over | 90 (100.0%) | 0 (0.0%) |
Public vs Private Health Insurance Coverage by Age in Scenic
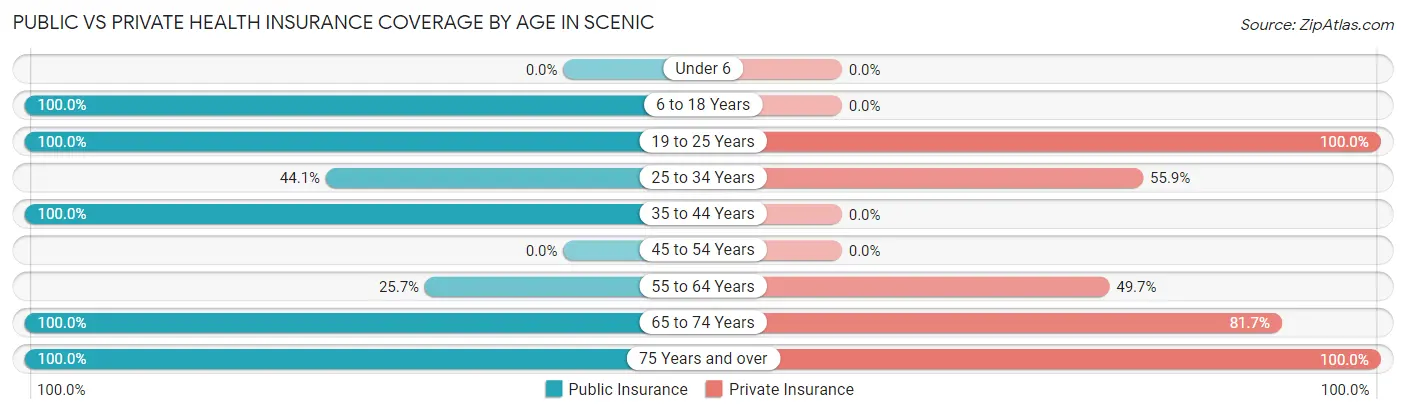
| Age Bracket | Public Insurance | Private Insurance |
| Under 6 | 0 (0.0%) | 0 (0.0%) |
| 6 to 18 Years | 337 (100.0%) | 0 (0.0%) |
| 19 to 25 Years | 79 (100.0%) | 79 (100.0%) |
| 25 to 34 Years | 52 (44.1%) | 66 (55.9%) |
| 35 to 44 Years | 77 (100.0%) | 0 (0.0%) |
| 45 to 54 Years | 0 (0.0%) | 0 (0.0%) |
| 55 to 64 Years | 74 (25.7%) | 143 (49.6%) |
| 65 to 74 Years | 387 (100.0%) | 316 (81.7%) |
| 75 Years and over | 554 (100.0%) | 554 (100.0%) |
| Total | 1,560 (84.8%) | 1,158 (62.9%) |
Disability Status by Sex by Age in Scenic
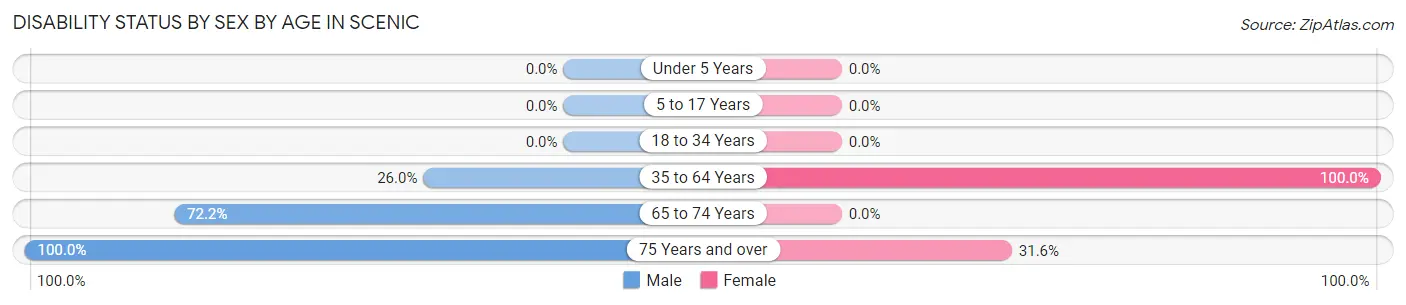
| Age Bracket | Male | Female |
| Under 5 Years | 0 (0.0%) | 0 (0.0%) |
| 5 to 17 Years | 0 (0.0%) | 0 (0.0%) |
| 18 to 34 Years | 0 (0.0%) | 0 (0.0%) |
| 35 to 64 Years | 77 (26.0%) | 69 (100.0%) |
| 65 to 74 Years | 190 (72.2%) | 0 (0.0%) |
| 75 Years and over | 120 (100.0%) | 137 (31.6%) |
Disability Class by Sex by Age in Scenic
Disability Class: Hearing Difficulty
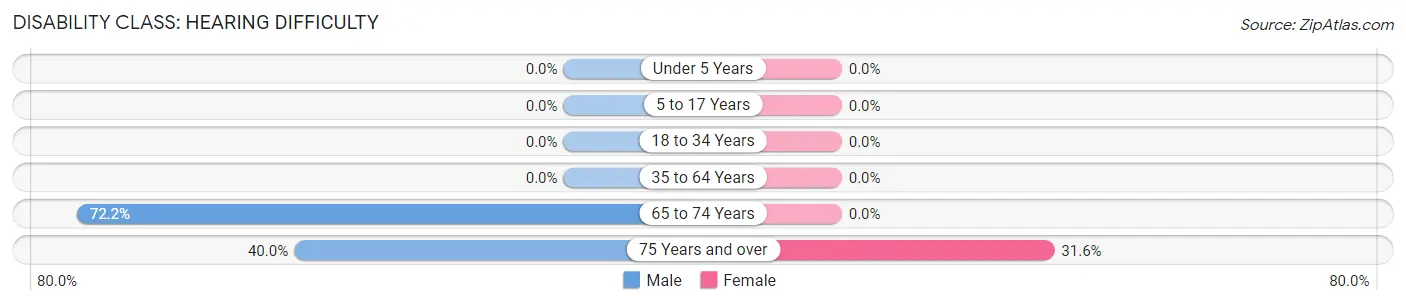
| Age Bracket | Male | Female |
| Under 5 Years | 0 (0.0%) | 0 (0.0%) |
| 5 to 17 Years | 0 (0.0%) | 0 (0.0%) |
| 18 to 34 Years | 0 (0.0%) | 0 (0.0%) |
| 35 to 64 Years | 0 (0.0%) | 0 (0.0%) |
| 65 to 74 Years | 190 (72.2%) | 0 (0.0%) |
| 75 Years and over | 48 (40.0%) | 137 (31.6%) |
Disability Class: Vision Difficulty
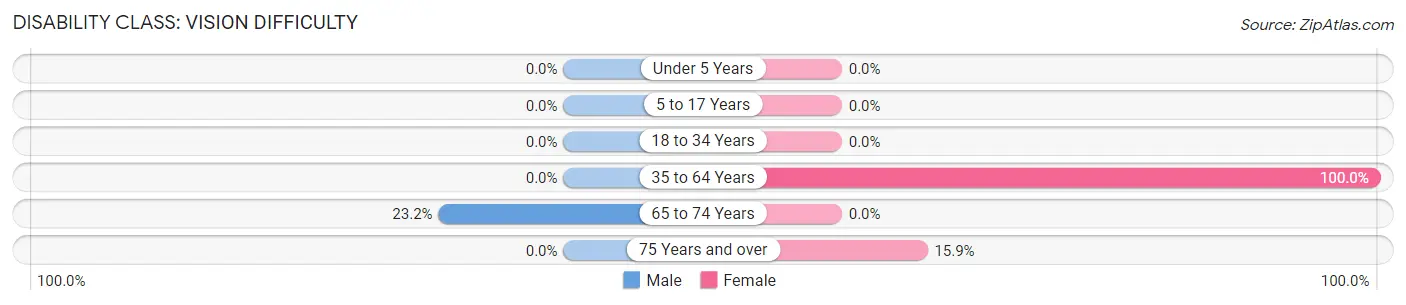
| Age Bracket | Male | Female |
| Under 5 Years | 0 (0.0%) | 0 (0.0%) |
| 5 to 17 Years | 0 (0.0%) | 0 (0.0%) |
| 18 to 34 Years | 0 (0.0%) | 0 (0.0%) |
| 35 to 64 Years | 0 (0.0%) | 69 (100.0%) |
| 65 to 74 Years | 61 (23.2%) | 0 (0.0%) |
| 75 Years and over | 0 (0.0%) | 69 (15.9%) |
Disability Class: Cognitive Difficulty
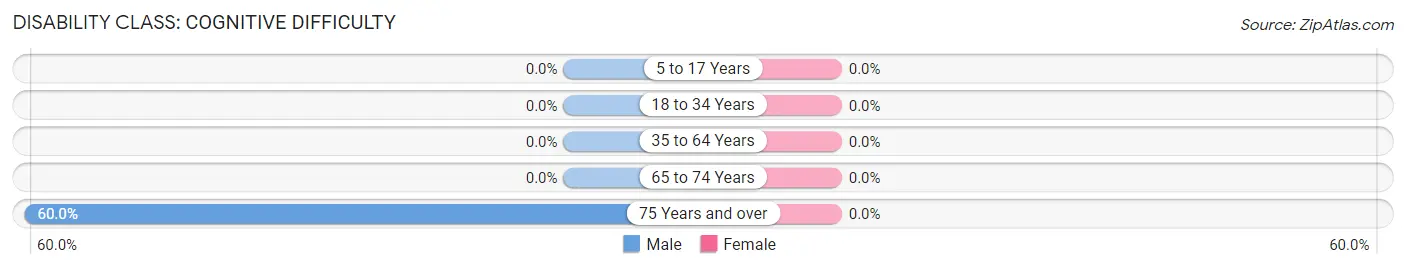
| Age Bracket | Male | Female |
| 5 to 17 Years | 0 (0.0%) | 0 (0.0%) |
| 18 to 34 Years | 0 (0.0%) | 0 (0.0%) |
| 35 to 64 Years | 0 (0.0%) | 0 (0.0%) |
| 65 to 74 Years | 0 (0.0%) | 0 (0.0%) |
| 75 Years and over | 72 (60.0%) | 0 (0.0%) |
Disability Class: Ambulatory Difficulty
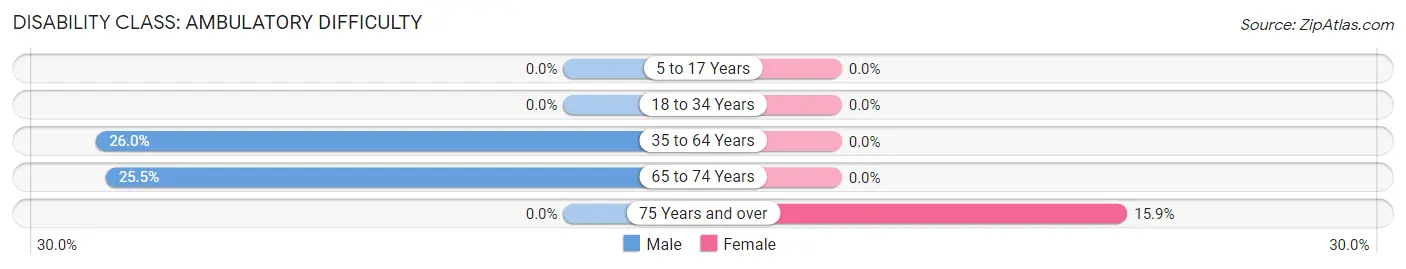
| Age Bracket | Male | Female |
| 5 to 17 Years | 0 (0.0%) | 0 (0.0%) |
| 18 to 34 Years | 0 (0.0%) | 0 (0.0%) |
| 35 to 64 Years | 77 (26.0%) | 0 (0.0%) |
| 65 to 74 Years | 67 (25.5%) | 0 (0.0%) |
| 75 Years and over | 0 (0.0%) | 69 (15.9%) |
Disability Class: Self-Care Difficulty
| Age Bracket | Male | Female |
| 5 to 17 Years | 0 (0.0%) | 0 (0.0%) |
| 18 to 34 Years | 0 (0.0%) | 0 (0.0%) |
| 35 to 64 Years | 0 (0.0%) | 0 (0.0%) |
| 65 to 74 Years | 0 (0.0%) | 0 (0.0%) |
| 75 Years and over | 0 (0.0%) | 0 (0.0%) |
Technology Access in Scenic
Computing Device Access in Scenic
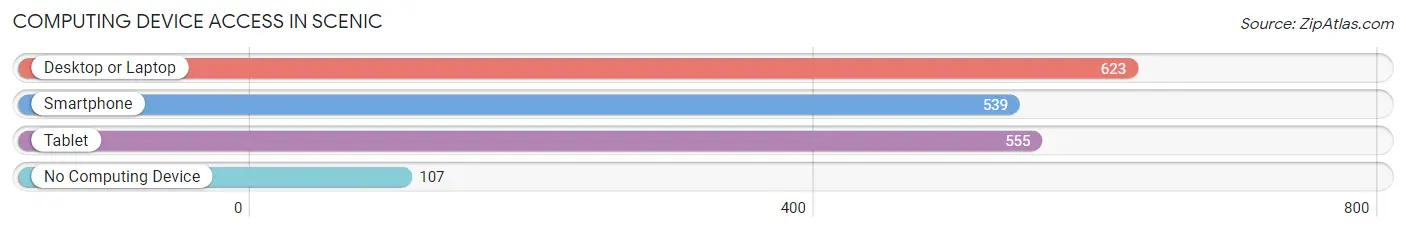
| Device Type | # Households | % Households |
| Desktop or Laptop | 623 | 78.8% |
| Smartphone | 539 | 68.1% |
| Tablet | 555 | 70.2% |
| No Computing Device | 107 | 13.5% |
| Total | 791 | 100.0% |
Internet Access in Scenic
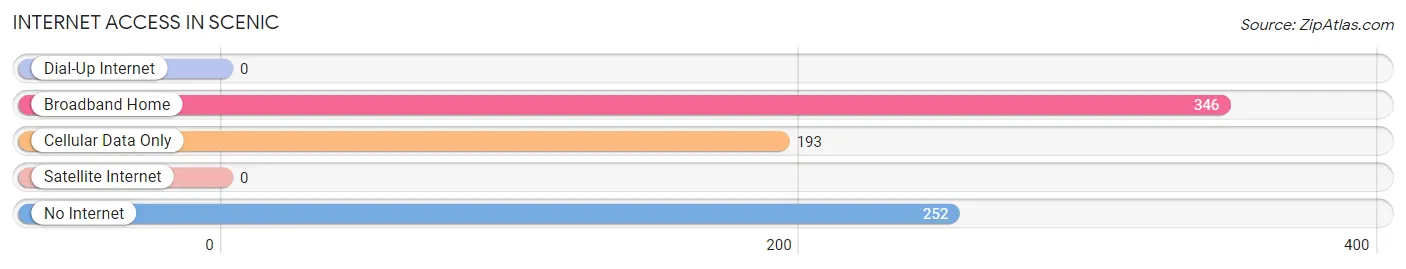
| Internet Type | # Households | % Households |
| Dial-Up Internet | 0 | 0.0% |
| Broadband Home | 346 | 43.7% |
| Cellular Data Only | 193 | 24.4% |
| Satellite Internet | 0 | 0.0% |
| No Internet | 252 | 31.9% |
| Total | 791 | 100.0% |
Scenic Summary
History
Scenic, Arizona is a small unincorporated community located in the western part of the state, about 25 miles east of Yuma. It is situated in the foothills of the Gila Mountains, and is surrounded by the Sonoran Desert. The area was first settled by the Hualapai Indians, who lived in the area for centuries before the arrival of the first Europeans.
The first Europeans to arrive in the area were Spanish explorers, who arrived in the late 1700s. They named the area “Scenic” due to its beautiful desert landscape. The area was later settled by American settlers in the late 1800s, who established a small farming community. The town was officially founded in 1891, and was named after the nearby Gila River.
In the early 1900s, the town began to grow and develop, and by the 1920s it had become a popular tourist destination. The town was known for its hot springs, which were believed to have healing properties. The town also had a number of hotels, restaurants, and other businesses.
In the 1950s, the town began to decline as the nearby Yuma area began to grow and develop. The town’s population decreased, and many of the businesses closed. In the late 1990s, the town began to experience a resurgence, as new businesses opened and the population began to increase.
Geography
Scenic, Arizona is located in the western part of the state, about 25 miles east of Yuma. It is situated in the foothills of the Gila Mountains, and is surrounded by the Sonoran Desert. The area is characterized by its hot, dry climate, with temperatures often reaching over 100 degrees Fahrenheit in the summer months.
The town is located on the banks of the Gila River, which provides a source of water for the area. The town is also located near the Imperial National Wildlife Refuge, which is home to a variety of wildlife, including bighorn sheep, coyotes, and bobcats.
Economy
The economy of Scenic, Arizona is largely based on tourism. The town is known for its hot springs, which are believed to have healing properties. The town also has a number of hotels, restaurants, and other businesses that cater to tourists.
In addition to tourism, the town also has a number of agricultural businesses. The area is known for its production of cotton, alfalfa, and other crops. The town also has a number of small manufacturing businesses, which produce a variety of products, including furniture and clothing.
Demographics
As of the 2010 census, the population of Scenic, Arizona was 1,845. The town has a diverse population, with a mix of Hispanic, Native American, and White residents. The median household income in the town is $35,000, and the median age is 37. The town has a high rate of poverty, with nearly 30% of the population living below the poverty line.
Common Questions
What is Per Capita Income in Scenic?
Per Capita income in Scenic is $14,190.
What is the Median Family Income in Scenic?
Median Family Income in Scenic is $45,347.
What is the Median Household income in Scenic?
Median Household Income in Scenic is $32,578.
What is Inequality or Gini Index in Scenic?
Inequality or Gini Index in Scenic is 0.41.
What is the Total Population of Scenic?
Total Population of Scenic is 1,840.
What is the Total Male Population of Scenic?
Total Male Population of Scenic is 879.
What is the Total Female Population of Scenic?
Total Female Population of Scenic is 961.
What is the Ratio of Males per 100 Females in Scenic?
There are 91.47 Males per 100 Females in Scenic.
What is the Ratio of Females per 100 Males in Scenic?
There are 109.33 Females per 100 Males in Scenic.
What is the Median Population Age in Scenic?
Median Population Age in Scenic is 65.2 Years.
What is the Average Family Size in Scenic
Average Family Size in Scenic is 3.2 People.
What is the Average Household Size in Scenic
Average Household Size in Scenic is 2.3 People.
How Large is the Labor Force in Scenic?
There are 333 People in the Labor Forcein in Scenic.
What is the Percentage of People in the Labor Force in Scenic?
21.4% of People are in the Labor Force in Scenic.
What is the Unemployment Rate in Scenic?
Unemployment Rate in Scenic is 22.3%.