Lake Wisconsin, WI Map & Demographics
Lake Wisconsin Map
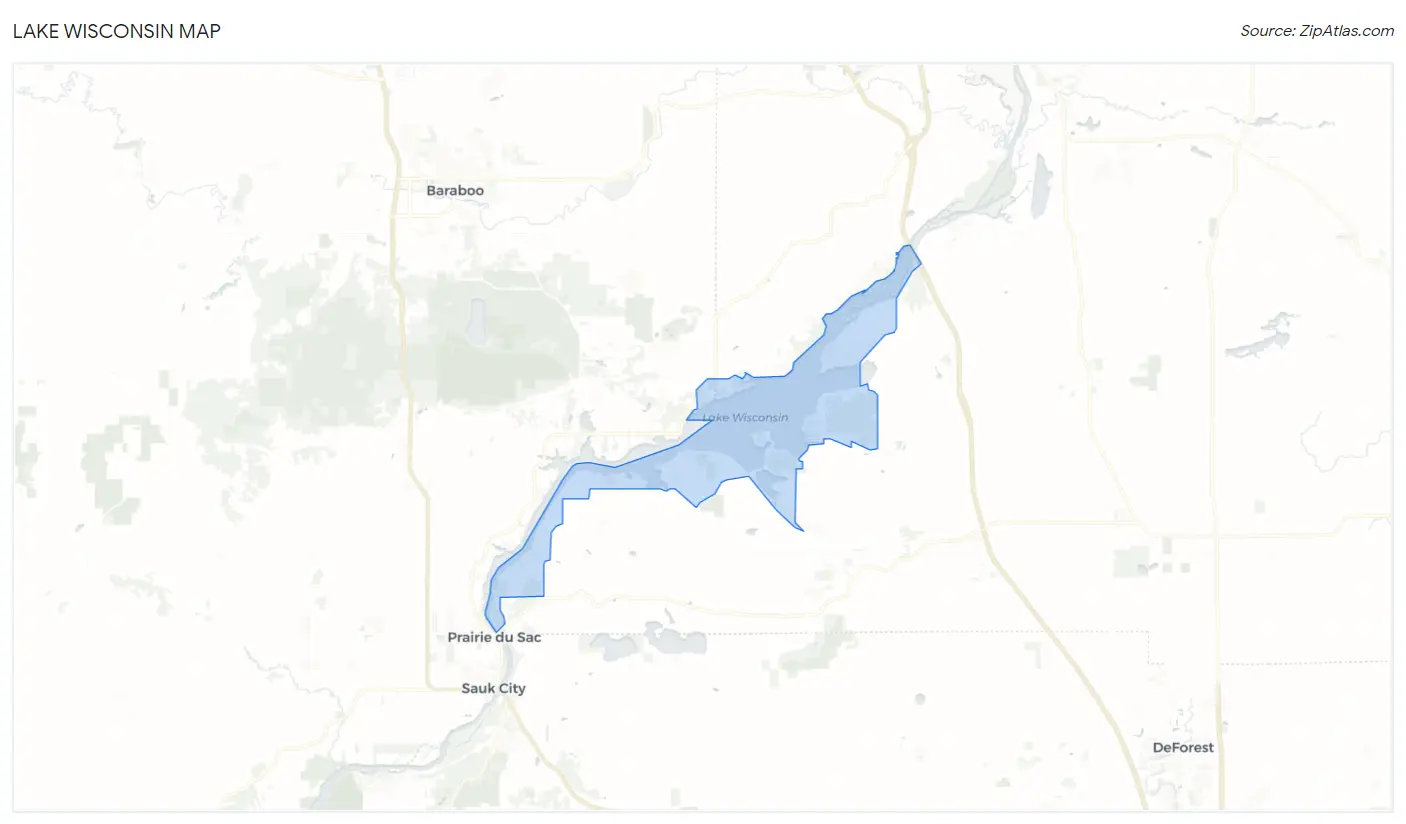
Lake Wisconsin Overview
$60,434
PER CAPITA INCOME
$136,932
AVG FAMILY INCOME
$114,241
AVG HOUSEHOLD INCOME
19.6%
WAGE / INCOME GAP [ % ]
80.4¢/ $1
WAGE / INCOME GAP [ $ ]
0.40
INEQUALITY / GINI INDEX
4,886
TOTAL POPULATION
2,585
MALE POPULATION
2,301
FEMALE POPULATION
112.34
MALES / 100 FEMALES
89.01
FEMALES / 100 MALES
51.7
MEDIAN AGE
2.6
AVG FAMILY SIZE
2.2
AVG HOUSEHOLD SIZE
2,438
LABOR FORCE [ PEOPLE ]
59.2%
PERCENT IN LABOR FORCE
1.9%
UNEMPLOYMENT RATE
Income in Lake Wisconsin
Income Overview in Lake Wisconsin
Per Capita Income in Lake Wisconsin is $60,434, while median incomes of families and households are $136,932 and $114,241 respectively.
| Characteristic | Number | Measure |
| Per Capita Income | 4,886 | $60,434 |
| Median Family Income | 1,584 | $136,932 |
| Mean Family Income | 1,584 | $157,155 |
| Median Household Income | 2,219 | $114,241 |
| Mean Household Income | 2,219 | $134,234 |
| Income Deficit | 1,584 | $0 |
| Wage / Income Gap (%) | 4,886 | 19.56% |
| Wage / Income Gap ($) | 4,886 | 80.44¢ per $1 |
| Gini / Inequality Index | 4,886 | 0.40 |
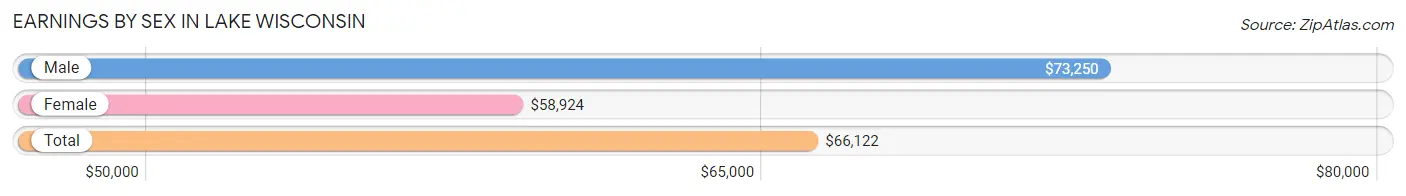
Earnings by Sex in Lake Wisconsin
Average Earnings in Lake Wisconsin are $66,122, $73,250 for men and $58,924 for women, a difference of 19.6%.
| Sex | Number | Average Earnings |
| Male | 1,390 (52.2%) | $73,250 |
| Female | 1,271 (47.8%) | $58,924 |
| Total | 2,661 (100.0%) | $66,122 |
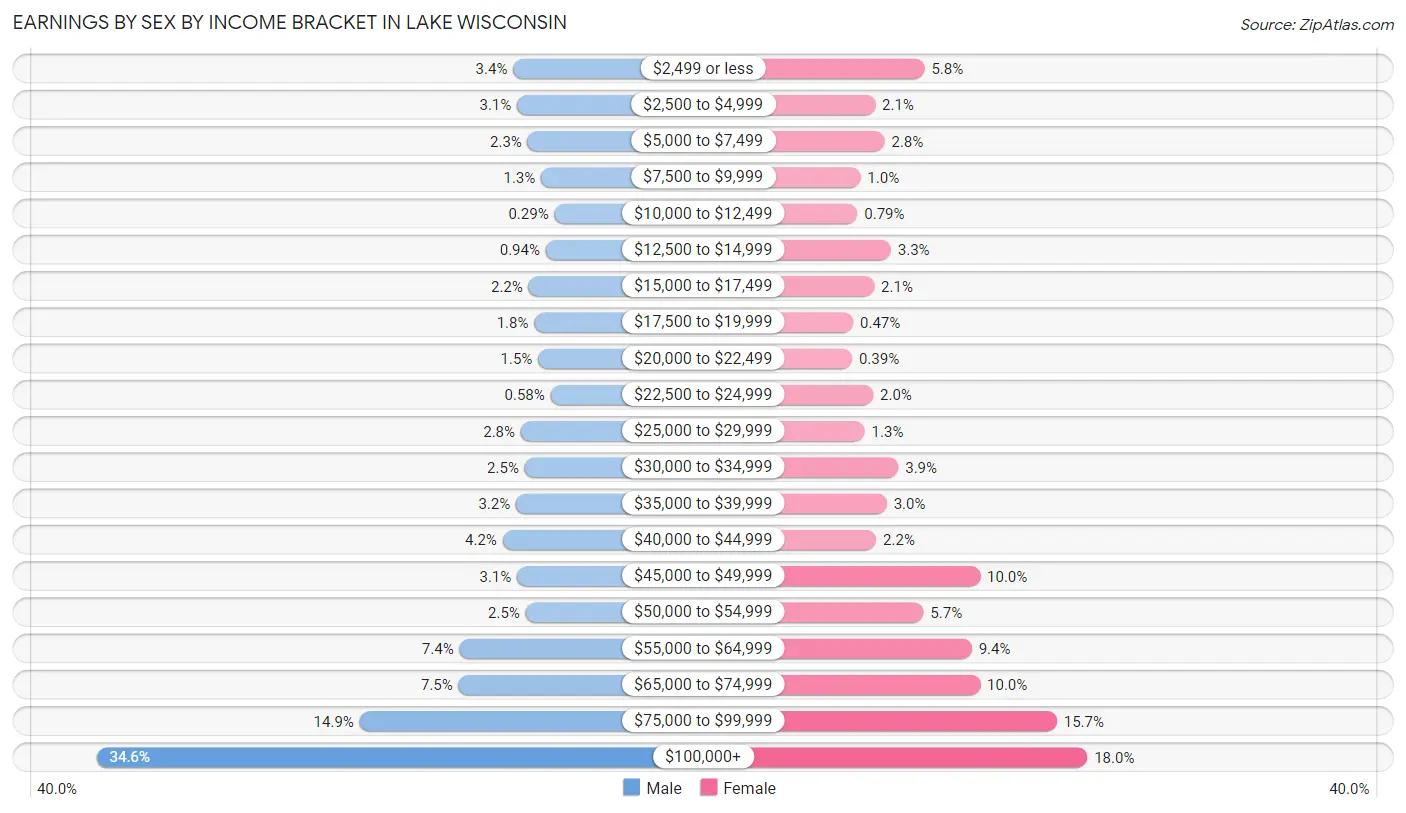
Earnings by Sex by Income Bracket in Lake Wisconsin
The most common earnings brackets in Lake Wisconsin are $100,000+ for men (481 | 34.6%) and $100,000+ for women (229 | 18.0%).
| Income | Male | Female |
| $2,499 or less | 47 (3.4%) | 74 (5.8%) |
| $2,500 to $4,999 | 43 (3.1%) | 27 (2.1%) |
| $5,000 to $7,499 | 32 (2.3%) | 36 (2.8%) |
| $7,500 to $9,999 | 18 (1.3%) | 13 (1.0%) |
| $10,000 to $12,499 | 4 (0.3%) | 10 (0.8%) |
| $12,500 to $14,999 | 13 (0.9%) | 42 (3.3%) |
| $15,000 to $17,499 | 31 (2.2%) | 26 (2.1%) |
| $17,500 to $19,999 | 25 (1.8%) | 6 (0.5%) |
| $20,000 to $22,499 | 21 (1.5%) | 5 (0.4%) |
| $22,500 to $24,999 | 8 (0.6%) | 25 (2.0%) |
| $25,000 to $29,999 | 39 (2.8%) | 17 (1.3%) |
| $30,000 to $34,999 | 35 (2.5%) | 49 (3.9%) |
| $35,000 to $39,999 | 44 (3.2%) | 38 (3.0%) |
| $40,000 to $44,999 | 58 (4.2%) | 28 (2.2%) |
| $45,000 to $49,999 | 43 (3.1%) | 127 (10.0%) |
| $50,000 to $54,999 | 34 (2.5%) | 73 (5.7%) |
| $55,000 to $64,999 | 103 (7.4%) | 119 (9.4%) |
| $65,000 to $74,999 | 104 (7.5%) | 127 (10.0%) |
| $75,000 to $99,999 | 207 (14.9%) | 200 (15.7%) |
| $100,000+ | 481 (34.6%) | 229 (18.0%) |
| Total | 1,390 (100.0%) | 1,271 (100.0%) |
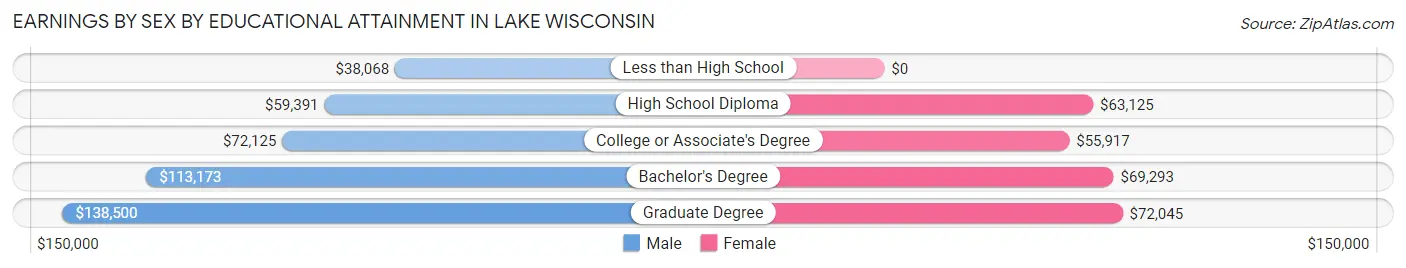
Earnings by Sex by Educational Attainment in Lake Wisconsin
Average earnings in Lake Wisconsin are $77,409 for men and $61,856 for women, a difference of 20.1%. Men with an educational attainment of graduate degree enjoy the highest average annual earnings of $138,500, while those with less than high school education earn the least with $38,068. Women with an educational attainment of graduate degree earn the most with the average annual earnings of $72,045, while those with college or associate's degree education have the smallest earnings of $55,917.
| Educational Attainment | Male Income | Female Income |
| Less than High School | $38,068 | $0 |
| High School Diploma | $59,391 | $63,125 |
| College or Associate's Degree | $72,125 | $55,917 |
| Bachelor's Degree | $113,173 | $69,293 |
| Graduate Degree | $138,500 | $72,045 |
| Total | $77,409 | $61,856 |
Family Income in Lake Wisconsin
Family Income Brackets in Lake Wisconsin
According to the Lake Wisconsin family income data, there are 428 families falling into the $100,000 to $149,999 income range, which is the most common income bracket and makes up 27.0% of all families.
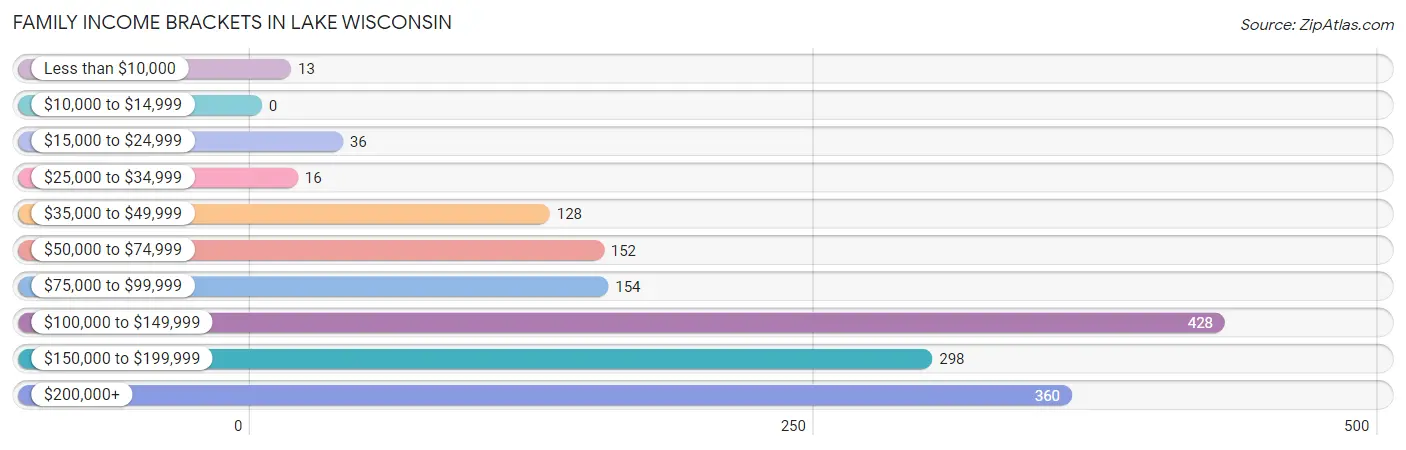
| Income Bracket | # Families | % Families |
| Less than $10,000 | 13 | 0.8% |
| $10,000 to $14,999 | 0 | 0.0% |
| $15,000 to $24,999 | 36 | 2.3% |
| $25,000 to $34,999 | 16 | 1.0% |
| $35,000 to $49,999 | 128 | 8.1% |
| $50,000 to $74,999 | 152 | 9.6% |
| $75,000 to $99,999 | 154 | 9.7% |
| $100,000 to $149,999 | 428 | 27.0% |
| $150,000 to $199,999 | 298 | 18.8% |
| $200,000+ | 360 | 22.7% |
Family Income by Famaliy Size in Lake Wisconsin
6-person families (32 | 2.0%) account for the highest median family income in Lake Wisconsin with $250,001 per family, while 2-person families (1,037 | 65.5%) have the highest median income of $54,742 per family member.
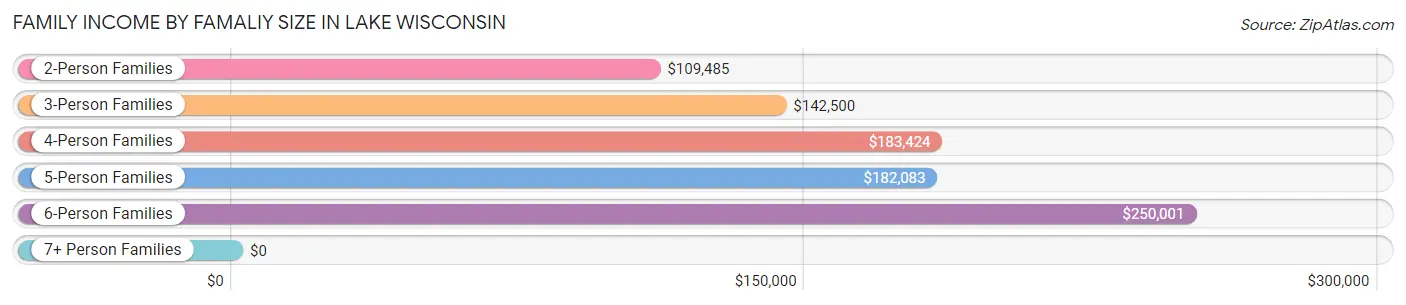
| Income Bracket | # Families | Median Income |
| 2-Person Families | 1,037 (65.5%) | $109,485 |
| 3-Person Families | 172 (10.9%) | $142,500 |
| 4-Person Families | 217 (13.7%) | $183,424 |
| 5-Person Families | 119 (7.5%) | $182,083 |
| 6-Person Families | 32 (2.0%) | $250,001 |
| 7+ Person Families | 7 (0.4%) | $0 |
| Total | 1,584 (100.0%) | $136,932 |
Family Income by Number of Earners in Lake Wisconsin
The median family income in Lake Wisconsin is $136,932, with families comprising 3+ earners (130) having the highest median family income of $248,500, while families with no earners (375) have the lowest median family income of $70,536, accounting for 8.2% and 23.7% of families, respectively.
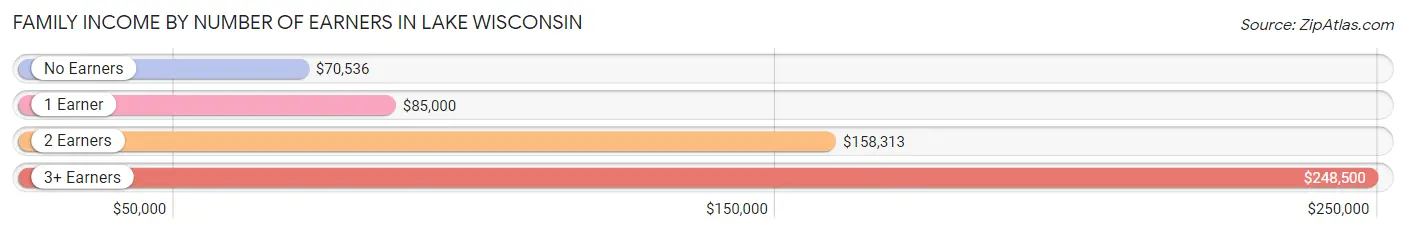
| Number of Earners | # Families | Median Income |
| No Earners | 375 (23.7%) | $70,536 |
| 1 Earner | 332 (21.0%) | $85,000 |
| 2 Earners | 747 (47.2%) | $158,313 |
| 3+ Earners | 130 (8.2%) | $248,500 |
| Total | 1,584 (100.0%) | $136,932 |
Household Income in Lake Wisconsin
Household Income Brackets in Lake Wisconsin
With 535 households falling in the category, the $100,000 to $149,999 income range is the most frequent in Lake Wisconsin, accounting for 24.1% of all households. In contrast, only 11 households (0.5%) fall into the $10,000 to $14,999 income bracket, making it the least populous group.
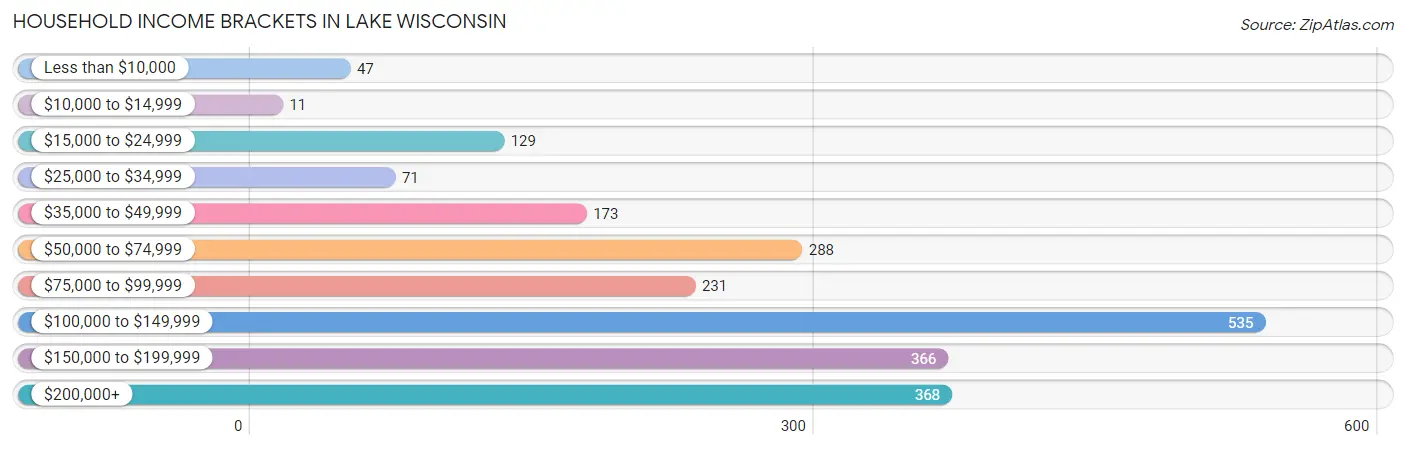
| Income Bracket | # Households | % Households |
| Less than $10,000 | 47 | 2.1% |
| $10,000 to $14,999 | 11 | 0.5% |
| $15,000 to $24,999 | 129 | 5.8% |
| $25,000 to $34,999 | 71 | 3.2% |
| $35,000 to $49,999 | 173 | 7.8% |
| $50,000 to $74,999 | 288 | 13.0% |
| $75,000 to $99,999 | 231 | 10.4% |
| $100,000 to $149,999 | 535 | 24.1% |
| $150,000 to $199,999 | 366 | 16.5% |
| $200,000+ | 368 | 16.6% |
Household Income by Householder Age in Lake Wisconsin
The median household income in Lake Wisconsin is $114,241, with the highest median household income of $142,386 found in the 25 to 44 years age bracket for the primary householder. A total of 425 households (19.2%) fall into this category.
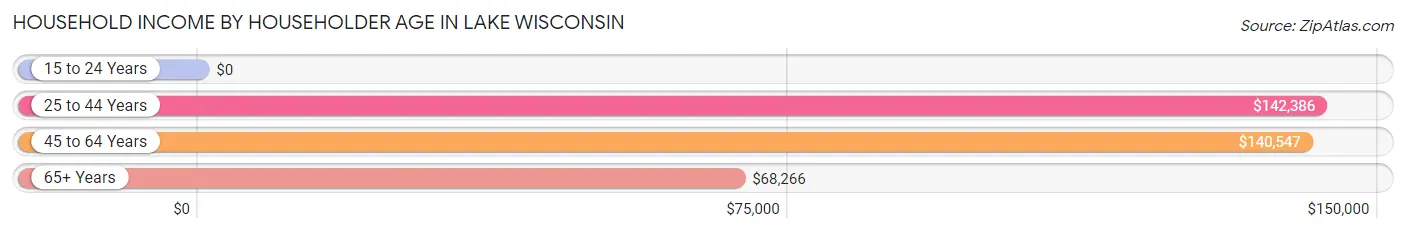
| Income Bracket | # Households | Median Income |
| 15 to 24 Years | 0 (0.0%) | $0 |
| 25 to 44 Years | 425 (19.2%) | $142,386 |
| 45 to 64 Years | 1,011 (45.6%) | $140,547 |
| 65+ Years | 783 (35.3%) | $68,266 |
| Total | 2,219 (100.0%) | $114,241 |
Poverty in Lake Wisconsin
Income Below Poverty by Sex and Age in Lake Wisconsin
With 2.5% poverty level for males and 3.9% for females among the residents of Lake Wisconsin, 18 to 24 year old males and 18 to 24 year old females are the most vulnerable to poverty, with 48 males (44.9%) and 15 females (26.3%) in their respective age groups living below the poverty level.
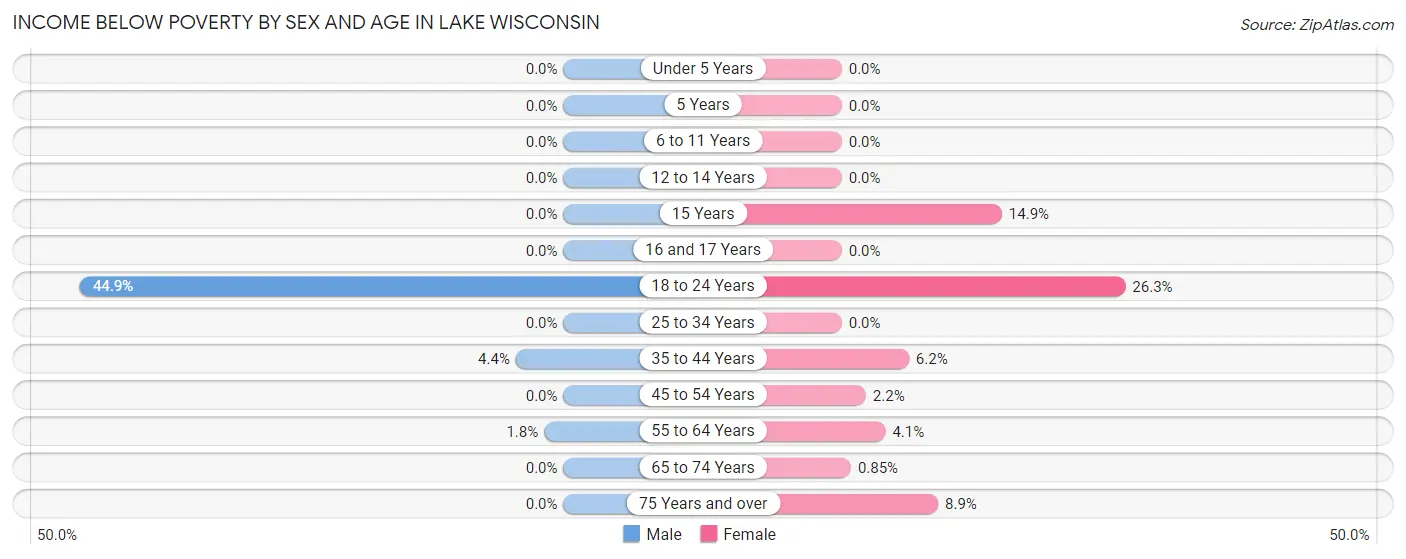
| Age Bracket | Male | Female |
| Under 5 Years | 0 (0.0%) | 0 (0.0%) |
| 5 Years | 0 (0.0%) | 0 (0.0%) |
| 6 to 11 Years | 0 (0.0%) | 0 (0.0%) |
| 12 to 14 Years | 0 (0.0%) | 0 (0.0%) |
| 15 Years | 0 (0.0%) | 11 (14.9%) |
| 16 and 17 Years | 0 (0.0%) | 0 (0.0%) |
| 18 to 24 Years | 48 (44.9%) | 15 (26.3%) |
| 25 to 34 Years | 0 (0.0%) | 0 (0.0%) |
| 35 to 44 Years | 8 (4.4%) | 16 (6.2%) |
| 45 to 54 Years | 0 (0.0%) | 9 (2.2%) |
| 55 to 64 Years | 9 (1.8%) | 19 (4.1%) |
| 65 to 74 Years | 0 (0.0%) | 3 (0.9%) |
| 75 Years and over | 0 (0.0%) | 16 (8.9%) |
| Total | 65 (2.5%) | 89 (3.9%) |
Income Above Poverty by Sex and Age in Lake Wisconsin
According to the poverty statistics in Lake Wisconsin, males aged under 5 years and females aged under 5 years are the age groups that are most secure financially, with 100.0% of males and 100.0% of females in these age groups living above the poverty line.
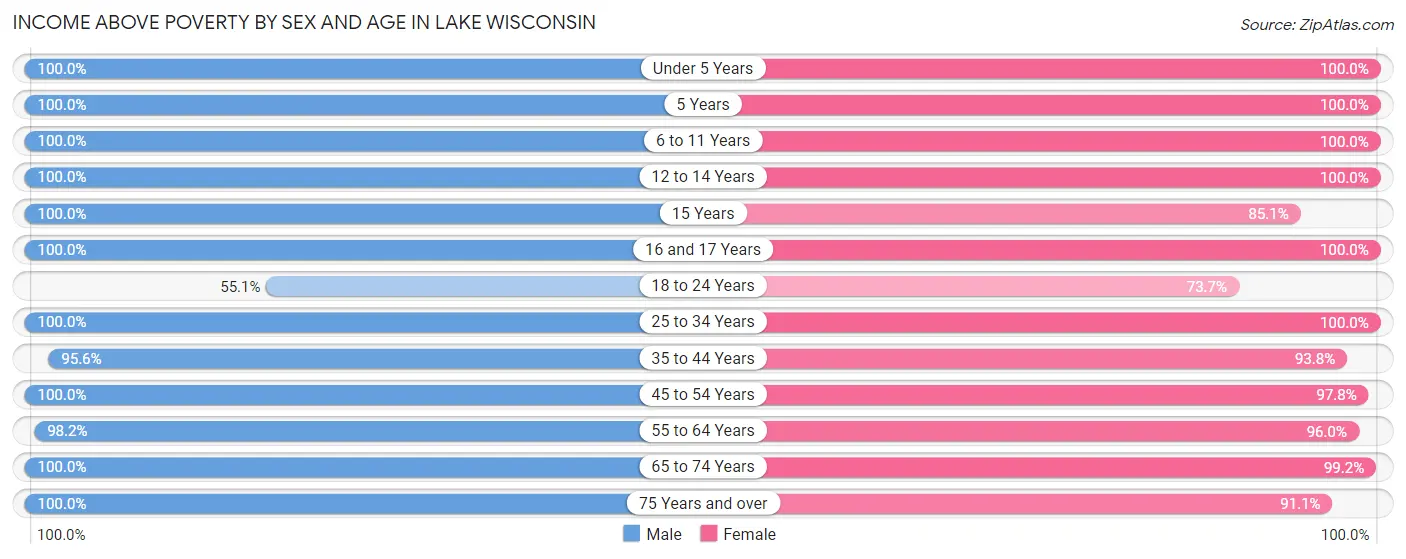
| Age Bracket | Male | Female |
| Under 5 Years | 109 (100.0%) | 103 (100.0%) |
| 5 Years | 16 (100.0%) | 41 (100.0%) |
| 6 to 11 Years | 200 (100.0%) | 78 (100.0%) |
| 12 to 14 Years | 94 (100.0%) | 44 (100.0%) |
| 15 Years | 8 (100.0%) | 63 (85.1%) |
| 16 and 17 Years | 126 (100.0%) | 42 (100.0%) |
| 18 to 24 Years | 59 (55.1%) | 42 (73.7%) |
| 25 to 34 Years | 224 (100.0%) | 201 (100.0%) |
| 35 to 44 Years | 173 (95.6%) | 241 (93.8%) |
| 45 to 54 Years | 434 (100.0%) | 392 (97.8%) |
| 55 to 64 Years | 493 (98.2%) | 450 (96.0%) |
| 65 to 74 Years | 389 (100.0%) | 352 (99.2%) |
| 75 Years and over | 195 (100.0%) | 163 (91.1%) |
| Total | 2,520 (97.5%) | 2,212 (96.1%) |
Income Below Poverty Among Married-Couple Families in Lake Wisconsin
The poverty statistics for married-couple families in Lake Wisconsin show that 0.6% or 9 of the total 1,434 families live below the poverty line. Families with no children have the highest poverty rate of 0.9%, comprising of 9 families. On the other hand, families with 1 or 2 children have the lowest poverty rate of 0.0%, which includes 0 families.
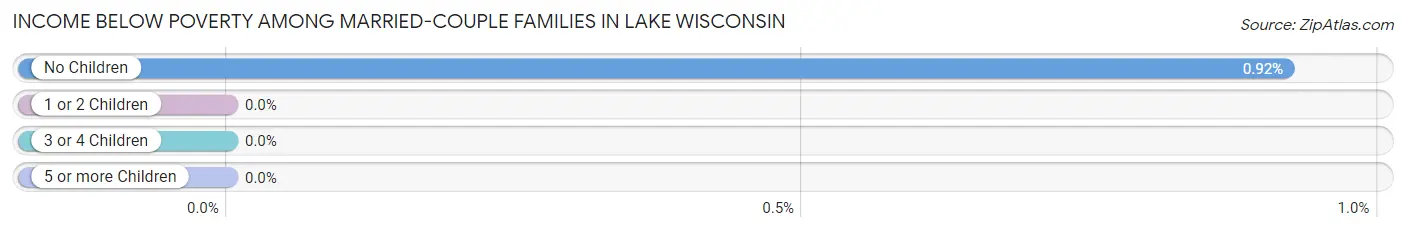
| Children | Above Poverty | Below Poverty |
| No Children | 970 (99.1%) | 9 (0.9%) |
| 1 or 2 Children | 312 (100.0%) | 0 (0.0%) |
| 3 or 4 Children | 136 (100.0%) | 0 (0.0%) |
| 5 or more Children | 7 (100.0%) | 0 (0.0%) |
| Total | 1,425 (99.4%) | 9 (0.6%) |
Income Below Poverty Among Single-Parent Households in Lake Wisconsin
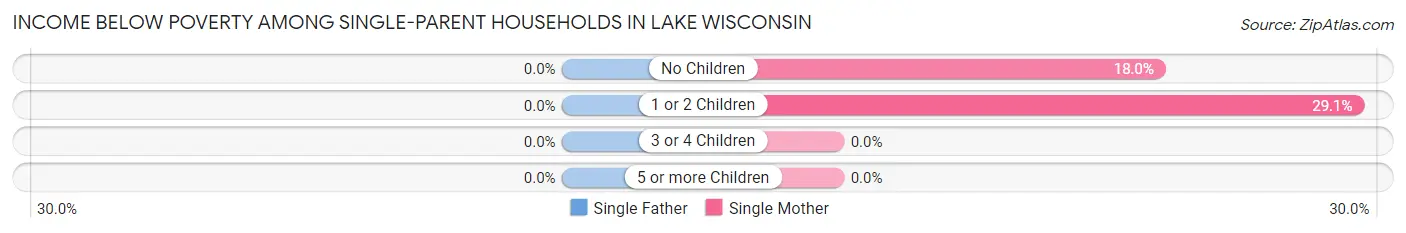
| Children | Single Father | Single Mother |
| No Children | 0 (0.0%) | 9 (18.0%) |
| 1 or 2 Children | 0 (0.0%) | 16 (29.1%) |
| 3 or 4 Children | 0 (0.0%) | 0 (0.0%) |
| 5 or more Children | 0 (0.0%) | 0 (0.0%) |
| Total | 0 (0.0%) | 25 (23.8%) |
Income Below Poverty Among Married-Couple vs Single-Parent Households in Lake Wisconsin
The poverty data for Lake Wisconsin shows that 9 of the married-couple family households (0.6%) and 25 of the single-parent households (16.7%) are living below the poverty level. Within the married-couple family households, those with no children have the highest poverty rate, with 9 households (0.9%) falling below the poverty line. Among the single-parent households, those with 1 or 2 children have the highest poverty rate, with 16 household (18.0%) living below poverty.
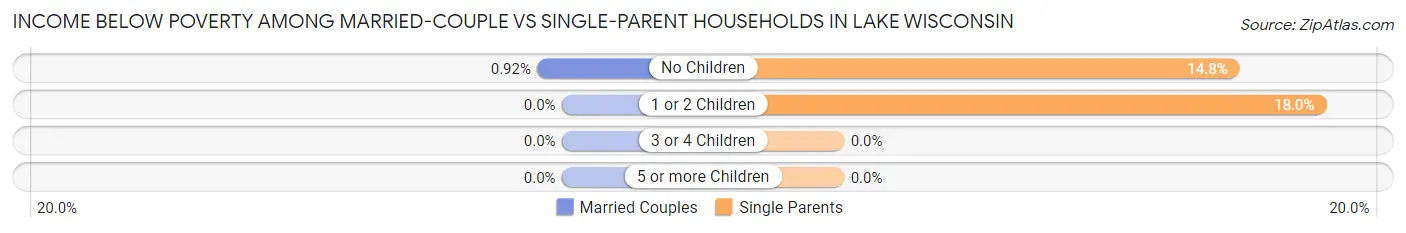
| Children | Married-Couple Families | Single-Parent Households |
| No Children | 9 (0.9%) | 9 (14.7%) |
| 1 or 2 Children | 0 (0.0%) | 16 (18.0%) |
| 3 or 4 Children | 0 (0.0%) | 0 (0.0%) |
| 5 or more Children | 0 (0.0%) | 0 (0.0%) |
| Total | 9 (0.6%) | 25 (16.7%) |
Race in Lake Wisconsin
The most populous races in Lake Wisconsin are White / Caucasian (4,553 | 93.2%), Hispanic or Latino (217 | 4.4%), and Two or more Races (101 | 2.1%).
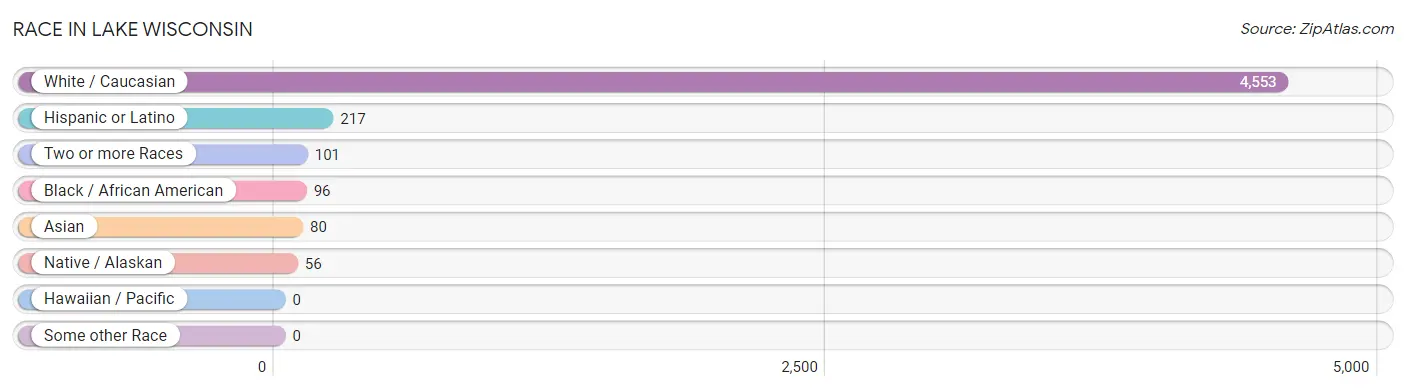
| Race | # Population | % Population |
| Asian | 80 | 1.6% |
| Black / African American | 96 | 2.0% |
| Hawaiian / Pacific | 0 | 0.0% |
| Hispanic or Latino | 217 | 4.4% |
| Native / Alaskan | 56 | 1.1% |
| White / Caucasian | 4,553 | 93.2% |
| Two or more Races | 101 | 2.1% |
| Some other Race | 0 | 0.0% |
| Total | 4,886 | 100.0% |
Ancestry in Lake Wisconsin
The most populous ancestries reported in Lake Wisconsin are German (2,130 | 43.6%), Irish (632 | 12.9%), Norwegian (531 | 10.9%), English (514 | 10.5%), and Polish (463 | 9.5%), together accounting for 87.4% of all Lake Wisconsin residents.
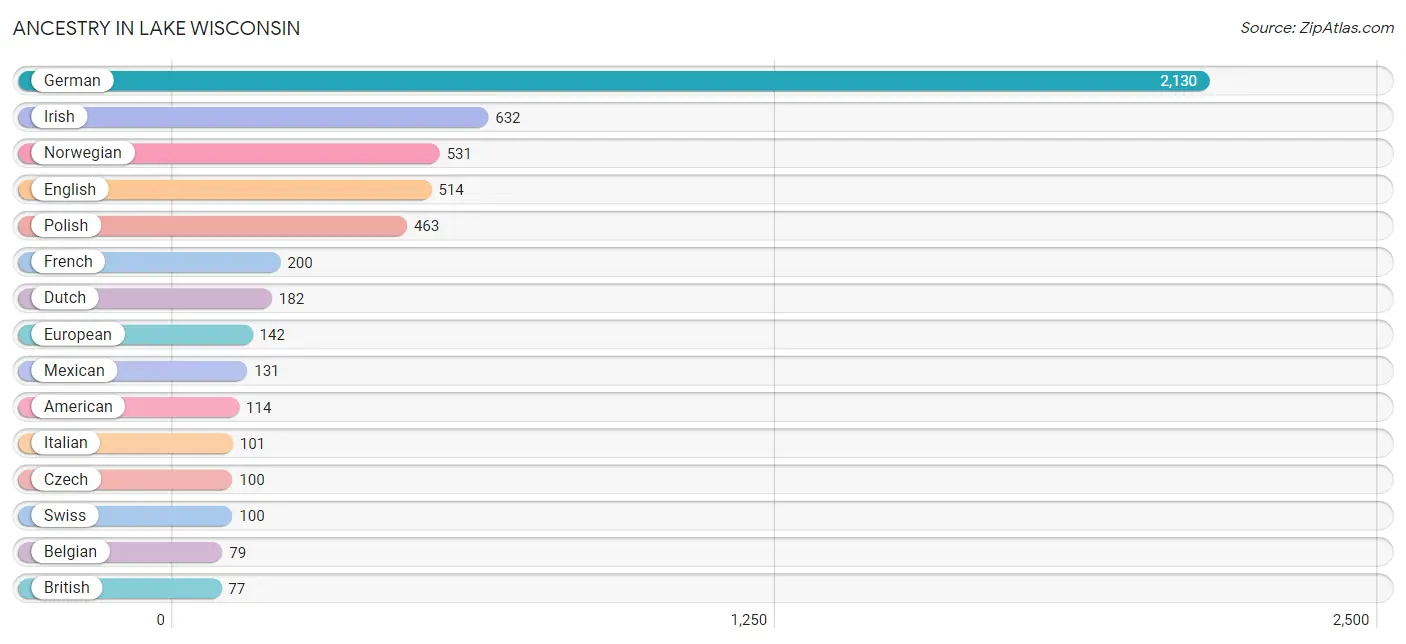
| Ancestry | # Population | % Population |
| Albanian | 9 | 0.2% |
| American | 114 | 2.3% |
| Austrian | 26 | 0.5% |
| Belgian | 79 | 1.6% |
| Bhutanese | 6 | 0.1% |
| British | 77 | 1.6% |
| Burmese | 18 | 0.4% |
| Canadian | 9 | 0.2% |
| Central American | 73 | 1.5% |
| Chippewa | 35 | 0.7% |
| Croatian | 13 | 0.3% |
| Czech | 100 | 2.1% |
| Czechoslovakian | 10 | 0.2% |
| Danish | 15 | 0.3% |
| Dutch | 182 | 3.7% |
| Eastern European | 7 | 0.1% |
| English | 514 | 10.5% |
| European | 142 | 2.9% |
| French | 200 | 4.1% |
| French Canadian | 22 | 0.4% |
| German | 2,130 | 43.6% |
| Guatemalan | 61 | 1.3% |
| Honduran | 12 | 0.3% |
| Hungarian | 10 | 0.2% |
| Indian (Asian) | 7 | 0.1% |
| Irish | 632 | 12.9% |
| Italian | 101 | 2.1% |
| Korean | 49 | 1.0% |
| Luxembourger | 10 | 0.2% |
| Mexican | 131 | 2.7% |
| Mexican American Indian | 31 | 0.6% |
| Norwegian | 531 | 10.9% |
| Polish | 463 | 9.5% |
| Puerto Rican | 6 | 0.1% |
| Russian | 4 | 0.1% |
| Scandinavian | 5 | 0.1% |
| Scotch-Irish | 10 | 0.2% |
| Scottish | 38 | 0.8% |
| Slovak | 4 | 0.1% |
| Swedish | 73 | 1.5% |
| Swiss | 100 | 2.1% |
| Ukrainian | 9 | 0.2% |
| Welsh | 11 | 0.2% | View All 43 Rows |
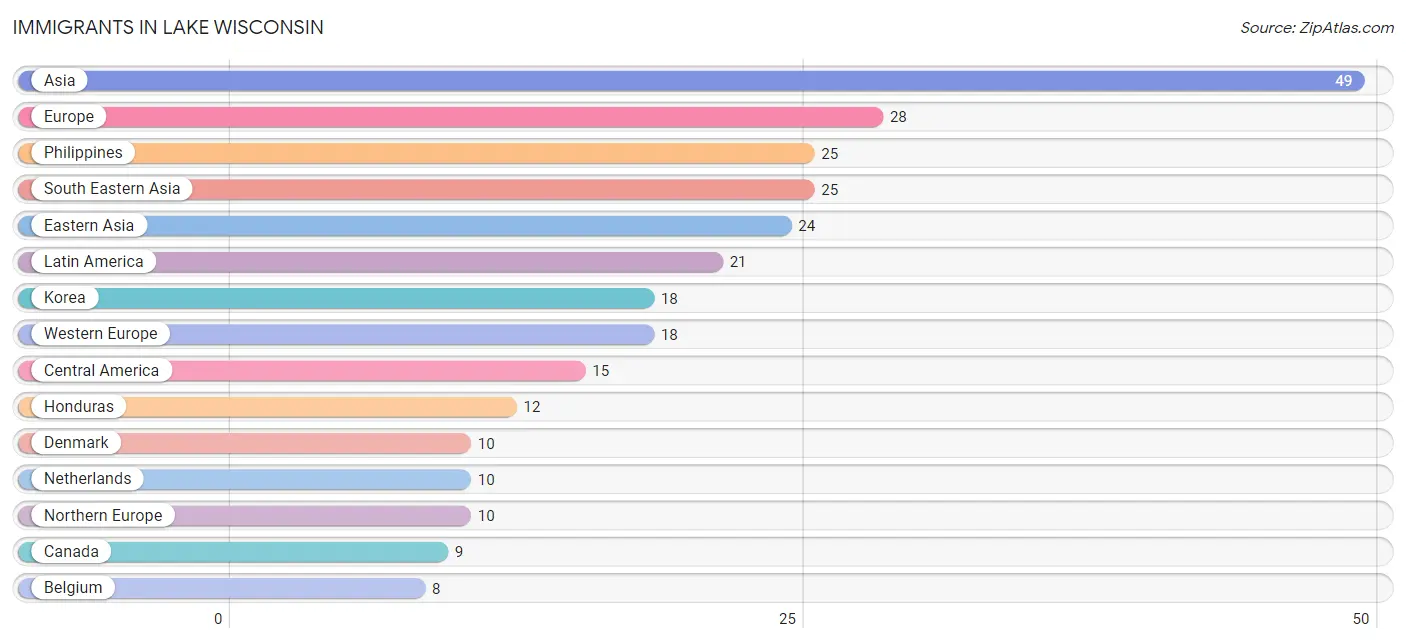
Immigrants in Lake Wisconsin
The most numerous immigrant groups reported in Lake Wisconsin came from Asia (49 | 1.0%), Europe (28 | 0.6%), Philippines (25 | 0.5%), South Eastern Asia (25 | 0.5%), and Eastern Asia (24 | 0.5%), together accounting for 3.1% of all Lake Wisconsin residents.
| Immigration Origin | # Population | % Population |
| Asia | 49 | 1.0% |
| Belgium | 8 | 0.2% |
| Canada | 9 | 0.2% |
| Central America | 15 | 0.3% |
| Denmark | 10 | 0.2% |
| Eastern Asia | 24 | 0.5% |
| Ecuador | 6 | 0.1% |
| Europe | 28 | 0.6% |
| Honduras | 12 | 0.3% |
| Japan | 6 | 0.1% |
| Korea | 18 | 0.4% |
| Latin America | 21 | 0.4% |
| Mexico | 3 | 0.1% |
| Netherlands | 10 | 0.2% |
| Northern Europe | 10 | 0.2% |
| Philippines | 25 | 0.5% |
| South America | 6 | 0.1% |
| South Eastern Asia | 25 | 0.5% |
| Western Europe | 18 | 0.4% | View All 19 Rows |
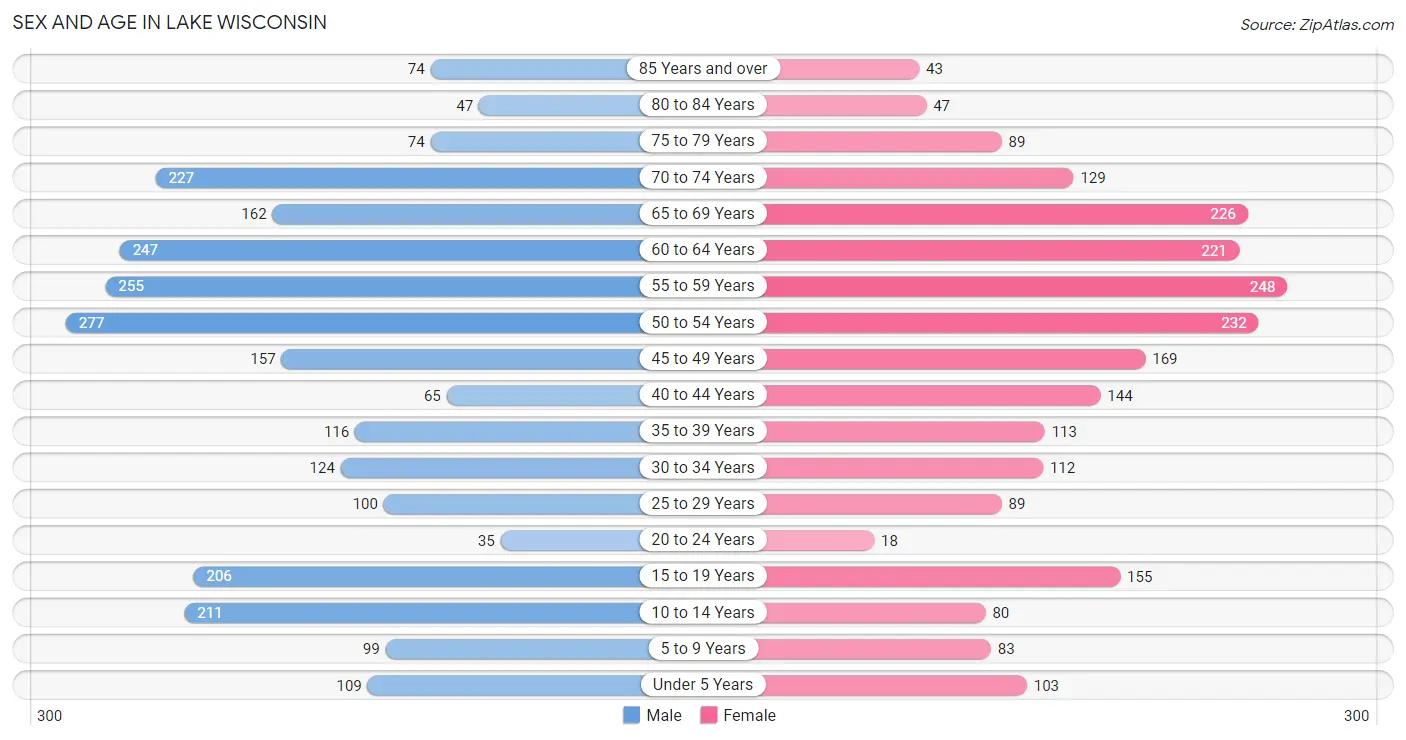
Sex and Age in Lake Wisconsin
Sex and Age in Lake Wisconsin
The most populous age groups in Lake Wisconsin are 50 to 54 Years (277 | 10.7%) for men and 55 to 59 Years (248 | 10.8%) for women.
| Age Bracket | Male | Female |
| Under 5 Years | 109 (4.2%) | 103 (4.5%) |
| 5 to 9 Years | 99 (3.8%) | 83 (3.6%) |
| 10 to 14 Years | 211 (8.2%) | 80 (3.5%) |
| 15 to 19 Years | 206 (8.0%) | 155 (6.7%) |
| 20 to 24 Years | 35 (1.3%) | 18 (0.8%) |
| 25 to 29 Years | 100 (3.9%) | 89 (3.9%) |
| 30 to 34 Years | 124 (4.8%) | 112 (4.9%) |
| 35 to 39 Years | 116 (4.5%) | 113 (4.9%) |
| 40 to 44 Years | 65 (2.5%) | 144 (6.3%) |
| 45 to 49 Years | 157 (6.1%) | 169 (7.3%) |
| 50 to 54 Years | 277 (10.7%) | 232 (10.1%) |
| 55 to 59 Years | 255 (9.9%) | 248 (10.8%) |
| 60 to 64 Years | 247 (9.6%) | 221 (9.6%) |
| 65 to 69 Years | 162 (6.3%) | 226 (9.8%) |
| 70 to 74 Years | 227 (8.8%) | 129 (5.6%) |
| 75 to 79 Years | 74 (2.9%) | 89 (3.9%) |
| 80 to 84 Years | 47 (1.8%) | 47 (2.0%) |
| 85 Years and over | 74 (2.9%) | 43 (1.9%) |
| Total | 2,585 (100.0%) | 2,301 (100.0%) |
Families and Households in Lake Wisconsin
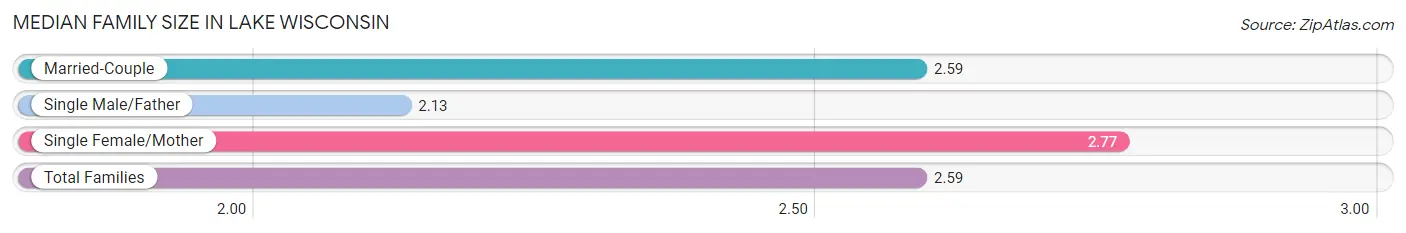
Median Family Size in Lake Wisconsin
The median family size in Lake Wisconsin is 2.59 persons per family, with single female/mother families (105 | 6.6%) accounting for the largest median family size of 2.77 persons per family. On the other hand, single male/father families (45 | 2.8%) represent the smallest median family size with 2.13 persons per family.
| Family Type | # Families | Family Size |
| Married-Couple | 1,434 (90.5%) | 2.59 |
| Single Male/Father | 45 (2.8%) | 2.13 |
| Single Female/Mother | 105 (6.6%) | 2.77 |
| Total Families | 1,584 (100.0%) | 2.59 |
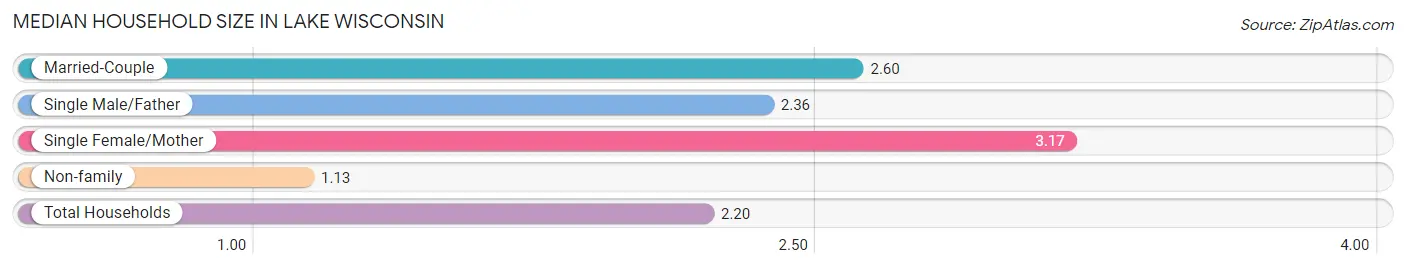
Median Household Size in Lake Wisconsin
The median household size in Lake Wisconsin is 2.20 persons per household, with single female/mother households (105 | 4.7%) accounting for the largest median household size of 3.17 persons per household. non-family households (635 | 28.6%) represent the smallest median household size with 1.13 persons per household.
| Household Type | # Households | Household Size |
| Married-Couple | 1,434 (64.6%) | 2.60 |
| Single Male/Father | 45 (2.0%) | 2.36 |
| Single Female/Mother | 105 (4.7%) | 3.17 |
| Non-family | 635 (28.6%) | 1.13 |
| Total Households | 2,219 (100.0%) | 2.20 |
Household Size by Marriage Status in Lake Wisconsin
Out of a total of 2,219 households in Lake Wisconsin, 1,584 (71.4%) are family households, while 635 (28.6%) are nonfamily households. The most numerous type of family households are 2-person households, comprising 991, and the most common type of nonfamily households are 1-person households, comprising 563.
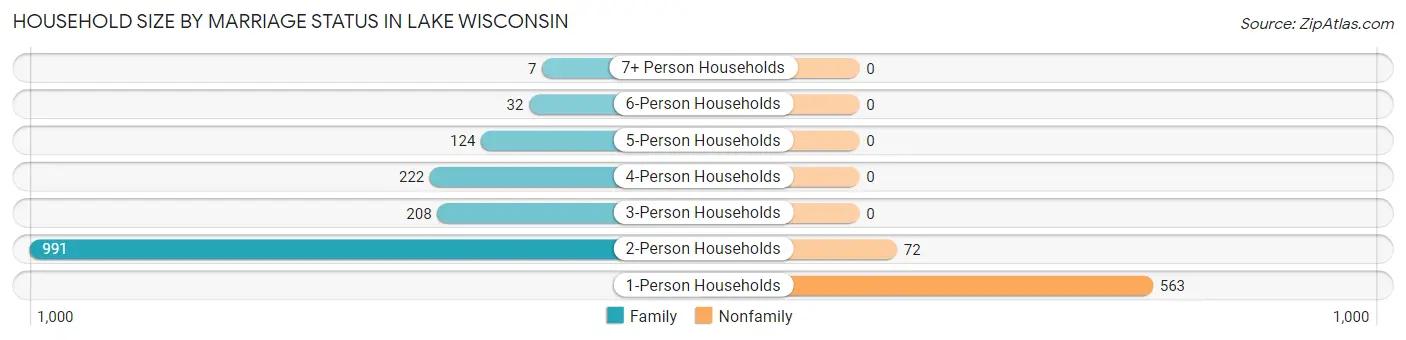
| Household Size | Family Households | Nonfamily Households |
| 1-Person Households | - | 563 (25.4%) |
| 2-Person Households | 991 (44.7%) | 72 (3.2%) |
| 3-Person Households | 208 (9.4%) | 0 (0.0%) |
| 4-Person Households | 222 (10.0%) | 0 (0.0%) |
| 5-Person Households | 124 (5.6%) | 0 (0.0%) |
| 6-Person Households | 32 (1.4%) | 0 (0.0%) |
| 7+ Person Households | 7 (0.3%) | 0 (0.0%) |
| Total | 1,584 (71.4%) | 635 (28.6%) |
Female Fertility in Lake Wisconsin
Fertility by Age in Lake Wisconsin
Average fertility rate in Lake Wisconsin is 27.0 births per 1,000 women. Women in the age bracket of 20 to 34 years have the highest fertility rate with 37.0 births per 1,000 women. Women in the age bracket of 35 to 50 years acount for 65.2% of all women with births.
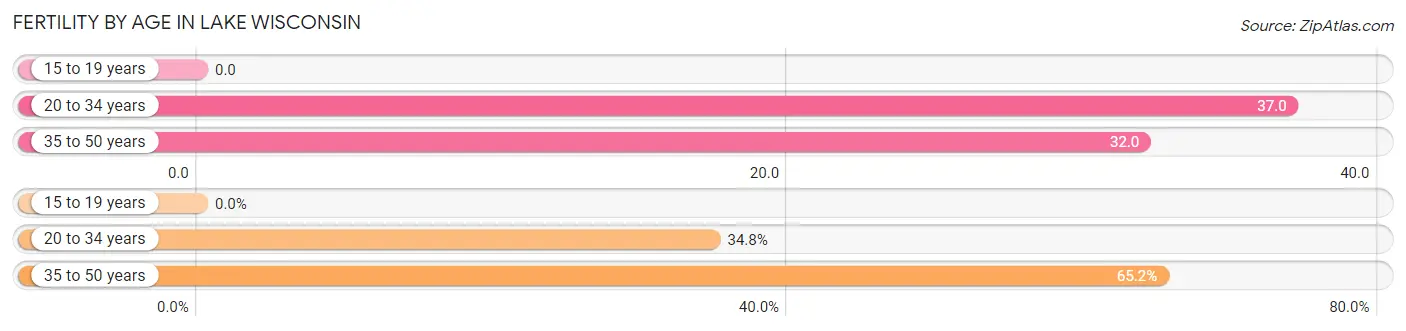
| Age Bracket | Women with Births | Births / 1,000 Women |
| 15 to 19 years | 0 (0.0%) | 0.0 |
| 20 to 34 years | 8 (34.8%) | 37.0 |
| 35 to 50 years | 15 (65.2%) | 32.0 |
| Total | 23 (100.0%) | 27.0 |
Fertility by Age by Marriage Status in Lake Wisconsin
87.0% of women with births (23) in Lake Wisconsin are married. The highest percentage of unmarried women with births falls into 20 to 34 years age bracket with 37.5% of them unmarried at the time of birth, while the lowest percentage of unmarried women with births belong to 35 to 50 years age bracket with 0.0% of them unmarried.
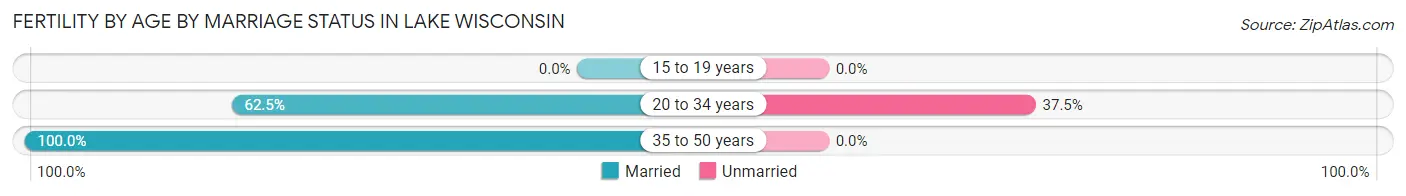
| Age Bracket | Married | Unmarried |
| 15 to 19 years | 0 (0.0%) | 0 (0.0%) |
| 20 to 34 years | 5 (62.5%) | 3 (37.5%) |
| 35 to 50 years | 15 (100.0%) | 0 (0.0%) |
| Total | 20 (87.0%) | 3 (13.0%) |
Fertility by Education in Lake Wisconsin
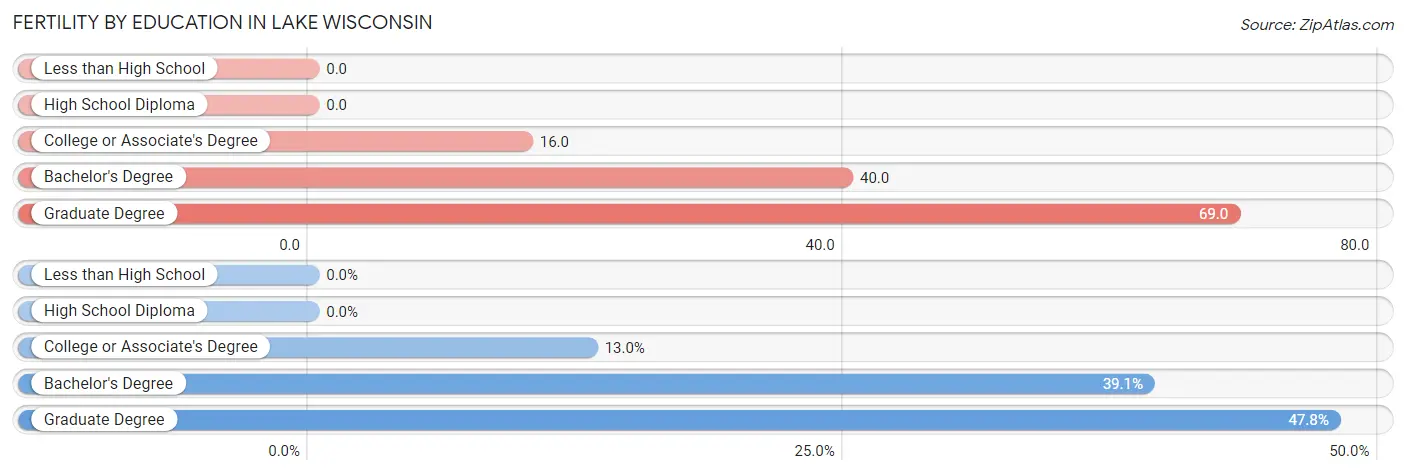
| Educational Attainment | Women with Births | Births / 1,000 Women |
| Less than High School | 0 (0.0%) | 0.0 |
| High School Diploma | 0 (0.0%) | 0.0 |
| College or Associate's Degree | 3 (13.0%) | 16.0 |
| Bachelor's Degree | 9 (39.1%) | 40.0 |
| Graduate Degree | 11 (47.8%) | 69.0 |
| Total | 23 (100.0%) | 27.0 |
Fertility by Education by Marriage Status in Lake Wisconsin
13.0% of women with births in Lake Wisconsin are unmarried. Women with the educational attainment of bachelor's degree are most likely to be married with 100.0% of them married at childbirth, while women with the educational attainment of college or associate's degree are least likely to be married with 100.0% of them unmarried at childbirth.
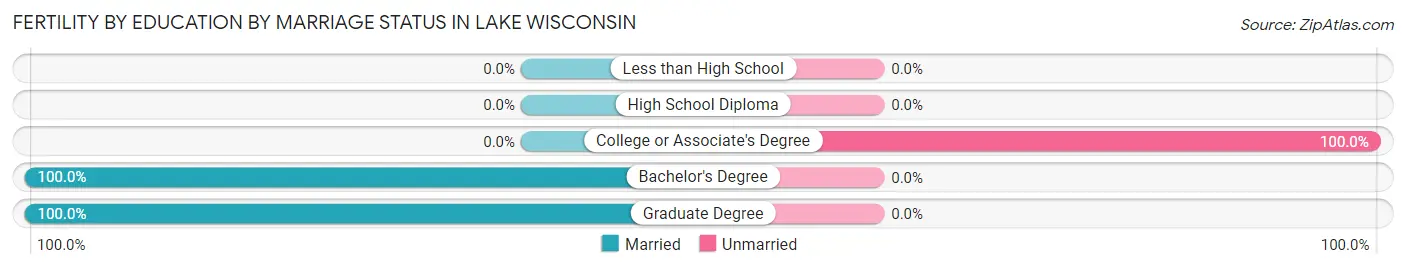
| Educational Attainment | Married | Unmarried |
| Less than High School | 0 (0.0%) | 0 (0.0%) |
| High School Diploma | 0 (0.0%) | 0 (0.0%) |
| College or Associate's Degree | 0 (0.0%) | 3 (100.0%) |
| Bachelor's Degree | 9 (100.0%) | 0 (0.0%) |
| Graduate Degree | 11 (100.0%) | 0 (0.0%) |
| Total | 20 (87.0%) | 3 (13.0%) |
Employment Characteristics in Lake Wisconsin
Employment by Class of Employer in Lake Wisconsin
Among the 2,361 employed individuals in Lake Wisconsin, private company employees (1,538 | 65.1%), self-employed (incorporated) (185 | 7.8%), and state government employees (169 | 7.2%) make up the most common classes of employment.
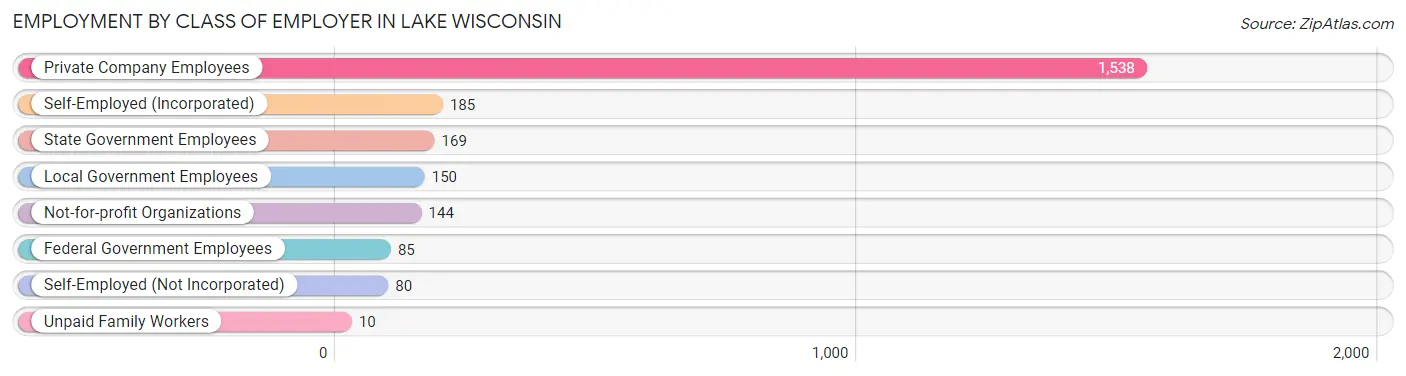
| Employer Class | # Employees | % Employees |
| Private Company Employees | 1,538 | 65.1% |
| Self-Employed (Incorporated) | 185 | 7.8% |
| Self-Employed (Not Incorporated) | 80 | 3.4% |
| Not-for-profit Organizations | 144 | 6.1% |
| Local Government Employees | 150 | 6.4% |
| State Government Employees | 169 | 7.2% |
| Federal Government Employees | 85 | 3.6% |
| Unpaid Family Workers | 10 | 0.4% |
| Total | 2,361 | 100.0% |
Employment Status by Age in Lake Wisconsin
According to the labor force statistics for Lake Wisconsin, out of the total population over 16 years of age (4,119), 59.2% or 2,438 individuals are in the labor force, with 1.9% or 46 of them unemployed. The age group with the highest labor force participation rate is 30 to 34 years, with 92.4% or 218 individuals in the labor force. Within the labor force, the 30 to 34 years age range has the highest percentage of unemployed individuals, with 13.6% or 30 of them being unemployed.
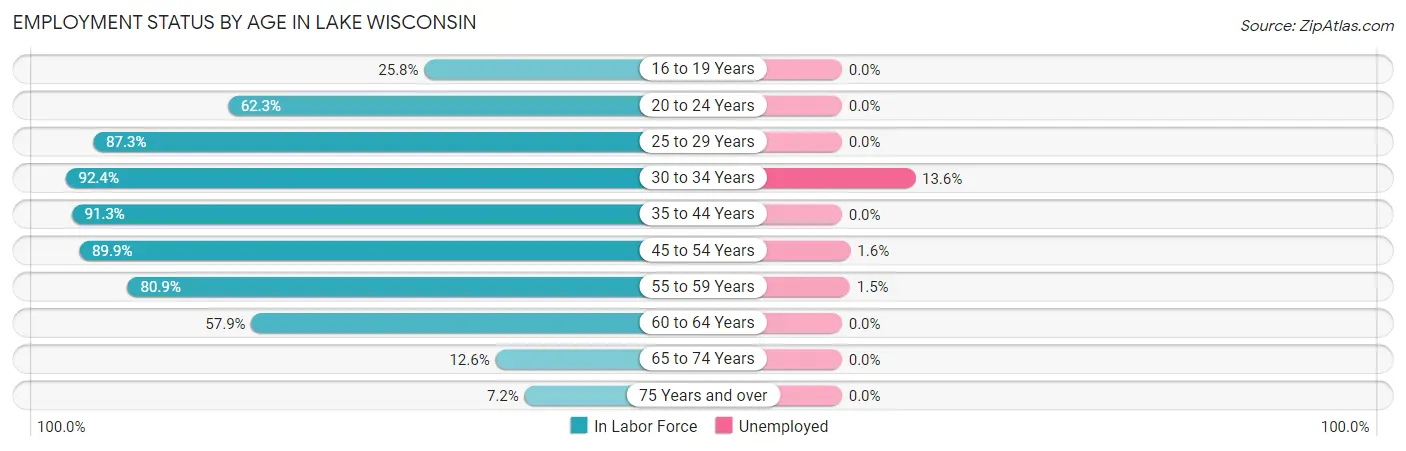
| Age Bracket | In Labor Force | Unemployed |
| 16 to 19 Years | 72 (25.8%) | 0 (0.0%) |
| 20 to 24 Years | 33 (62.3%) | 0 (0.0%) |
| 25 to 29 Years | 165 (87.3%) | 0 (0.0%) |
| 30 to 34 Years | 218 (92.4%) | 30 (13.6%) |
| 35 to 44 Years | 400 (91.3%) | 0 (0.0%) |
| 45 to 54 Years | 751 (89.9%) | 12 (1.6%) |
| 55 to 59 Years | 407 (80.9%) | 6 (1.5%) |
| 60 to 64 Years | 271 (57.9%) | 0 (0.0%) |
| 65 to 74 Years | 94 (12.6%) | 0 (0.0%) |
| 75 Years and over | 27 (7.2%) | 0 (0.0%) |
| Total | 2,438 (59.2%) | 46 (1.9%) |
Employment Status by Educational Attainment in Lake Wisconsin
According to labor force statistics for Lake Wisconsin, 82.9% of individuals (2,213) out of the total population between 25 and 64 years of age (2,669) are in the labor force, with 2.1% or 46 of them being unemployed. The group with the highest labor force participation rate are those with the educational attainment of college / associate degree, with 89.2% or 786 individuals in the labor force. Within the labor force, individuals with high school diploma education have the highest percentage of unemployment, with 7.6% or 37 of them being unemployed.
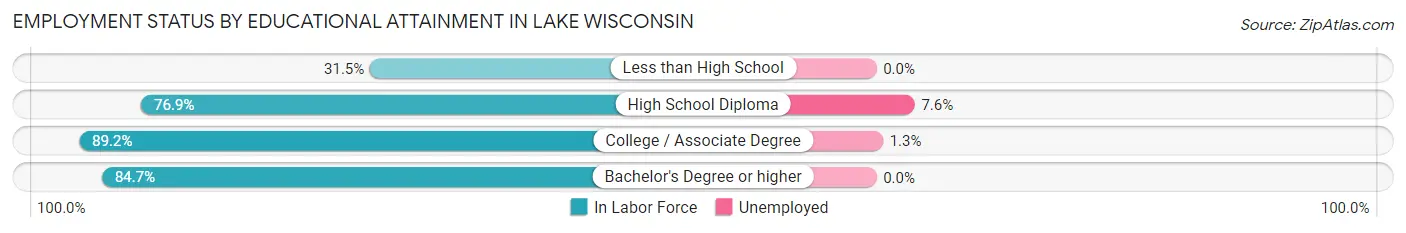
| Educational Attainment | In Labor Force | Unemployed |
| Less than High School | 23 (31.5%) | 0 (0.0%) |
| High School Diploma | 490 (76.9%) | 48 (7.6%) |
| College / Associate Degree | 786 (89.2%) | 11 (1.3%) |
| Bachelor's Degree or higher | 913 (84.7%) | 0 (0.0%) |
| Total | 2,213 (82.9%) | 56 (2.1%) |
Employment Occupations by Sex in Lake Wisconsin
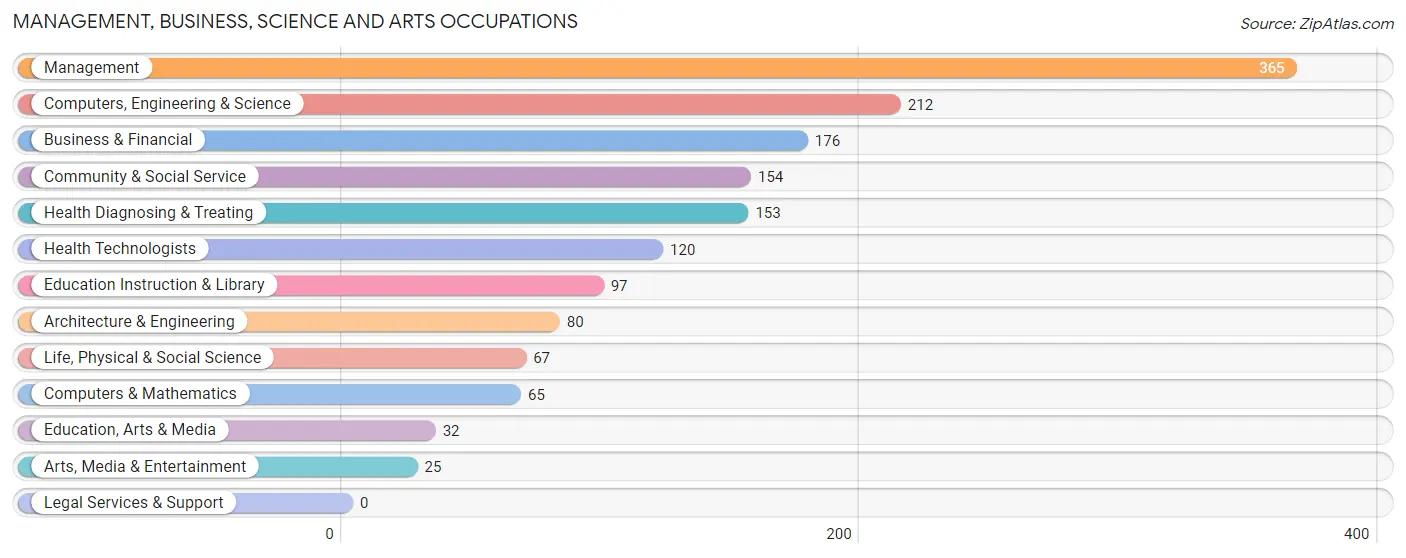
Management, Business, Science and Arts Occupations
The most common Management, Business, Science and Arts occupations in Lake Wisconsin are Management (365 | 15.3%), Computers, Engineering & Science (212 | 8.9%), Business & Financial (176 | 7.4%), Community & Social Service (154 | 6.5%), and Health Diagnosing & Treating (153 | 6.4%).
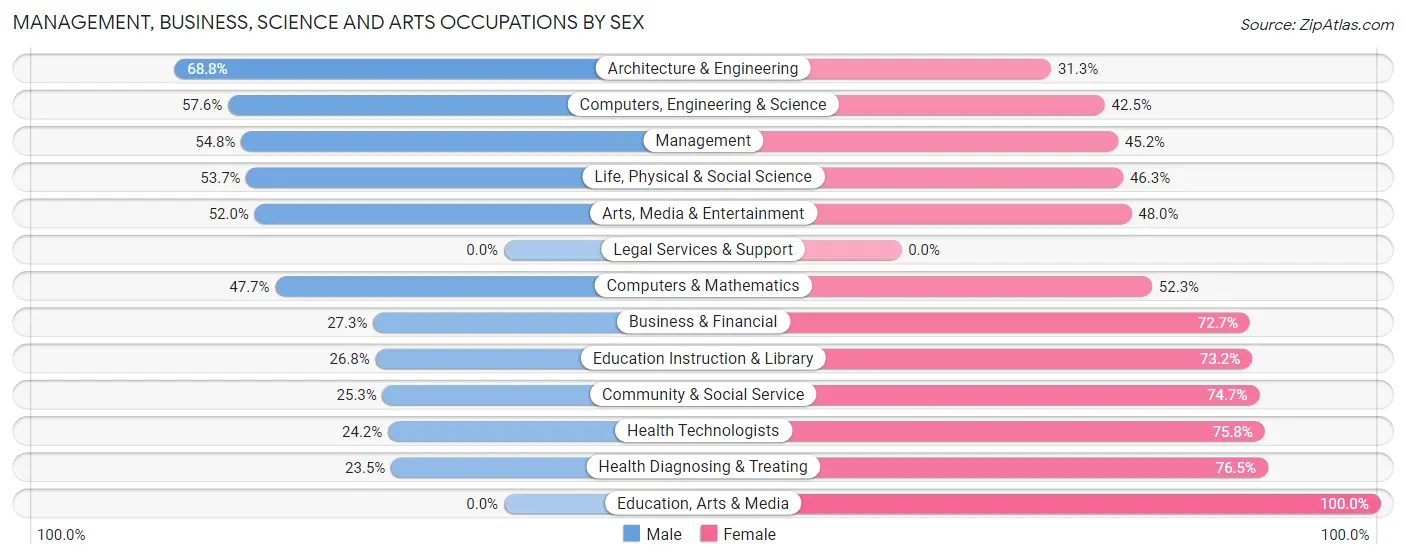
Management, Business, Science and Arts Occupations by Sex
Within the Management, Business, Science and Arts occupations in Lake Wisconsin, the most male-oriented occupations are Architecture & Engineering (68.8%), Computers, Engineering & Science (57.6%), and Management (54.8%), while the most female-oriented occupations are Education, Arts & Media (100.0%), Health Diagnosing & Treating (76.5%), and Health Technologists (75.8%).
| Occupation | Male | Female |
| Management | 200 (54.8%) | 165 (45.2%) |
| Business & Financial | 48 (27.3%) | 128 (72.7%) |
| Computers, Engineering & Science | 122 (57.6%) | 90 (42.4%) |
| Computers & Mathematics | 31 (47.7%) | 34 (52.3%) |
| Architecture & Engineering | 55 (68.8%) | 25 (31.2%) |
| Life, Physical & Social Science | 36 (53.7%) | 31 (46.3%) |
| Community & Social Service | 39 (25.3%) | 115 (74.7%) |
| Education, Arts & Media | 0 (0.0%) | 32 (100.0%) |
| Legal Services & Support | 0 (0.0%) | 0 (0.0%) |
| Education Instruction & Library | 26 (26.8%) | 71 (73.2%) |
| Arts, Media & Entertainment | 13 (52.0%) | 12 (48.0%) |
| Health Diagnosing & Treating | 36 (23.5%) | 117 (76.5%) |
| Health Technologists | 29 (24.2%) | 91 (75.8%) |
| Total (Category) | 445 (42.0%) | 615 (58.0%) |
| Total (Overall) | 1,195 (50.2%) | 1,184 (49.8%) |
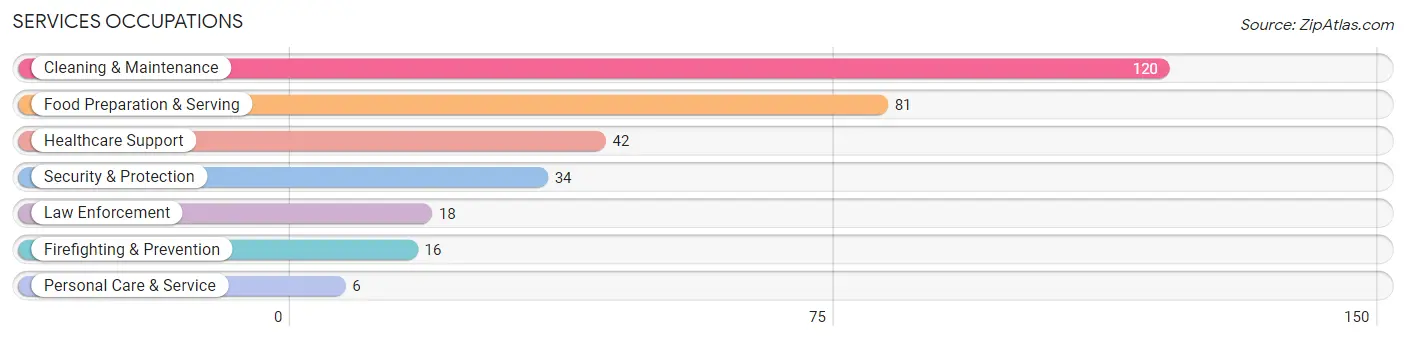
Services Occupations
The most common Services occupations in Lake Wisconsin are Cleaning & Maintenance (120 | 5.0%), Food Preparation & Serving (81 | 3.4%), Healthcare Support (42 | 1.8%), Security & Protection (34 | 1.4%), and Law Enforcement (18 | 0.8%).
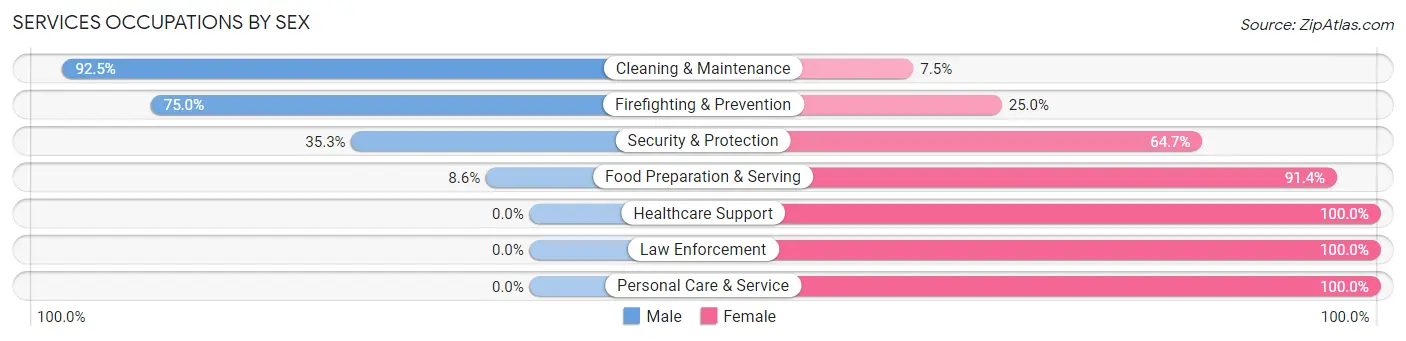
Services Occupations by Sex
Within the Services occupations in Lake Wisconsin, the most male-oriented occupations are Cleaning & Maintenance (92.5%), Firefighting & Prevention (75.0%), and Security & Protection (35.3%), while the most female-oriented occupations are Healthcare Support (100.0%), Law Enforcement (100.0%), and Personal Care & Service (100.0%).
| Occupation | Male | Female |
| Healthcare Support | 0 (0.0%) | 42 (100.0%) |
| Security & Protection | 12 (35.3%) | 22 (64.7%) |
| Firefighting & Prevention | 12 (75.0%) | 4 (25.0%) |
| Law Enforcement | 0 (0.0%) | 18 (100.0%) |
| Food Preparation & Serving | 7 (8.6%) | 74 (91.4%) |
| Cleaning & Maintenance | 111 (92.5%) | 9 (7.5%) |
| Personal Care & Service | 0 (0.0%) | 6 (100.0%) |
| Total (Category) | 130 (45.9%) | 153 (54.1%) |
| Total (Overall) | 1,195 (50.2%) | 1,184 (49.8%) |
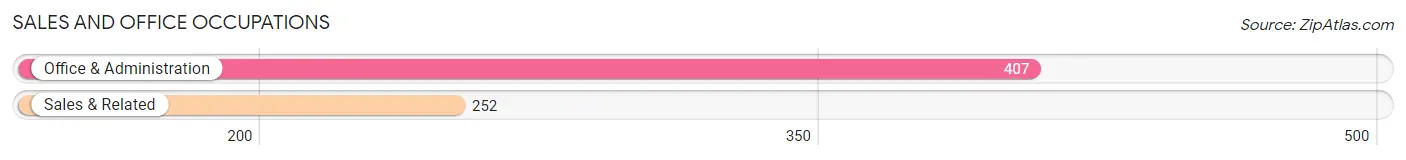
Sales and Office Occupations
The most common Sales and Office occupations in Lake Wisconsin are Office & Administration (407 | 17.1%), and Sales & Related (252 | 10.6%).
Sales and Office Occupations by Sex
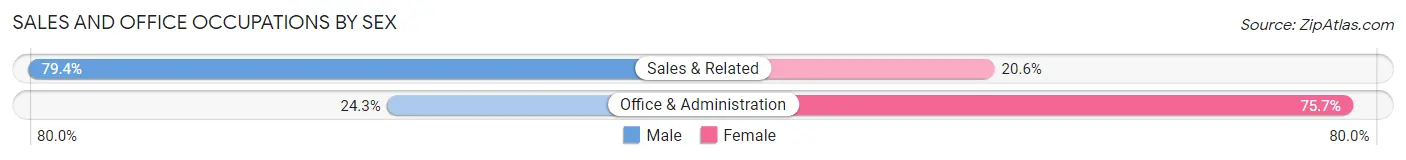
| Occupation | Male | Female |
| Sales & Related | 200 (79.4%) | 52 (20.6%) |
| Office & Administration | 99 (24.3%) | 308 (75.7%) |
| Total (Category) | 299 (45.4%) | 360 (54.6%) |
| Total (Overall) | 1,195 (50.2%) | 1,184 (49.8%) |
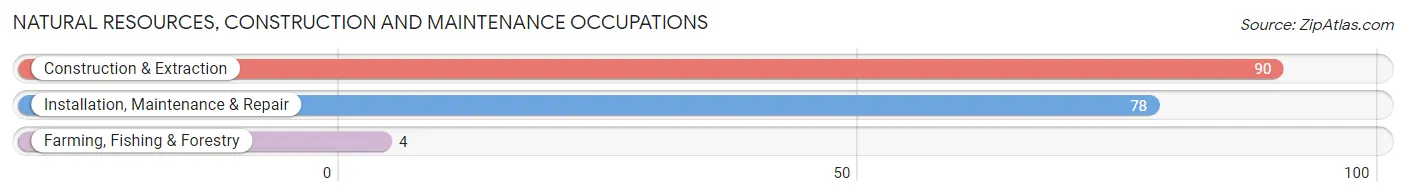
Natural Resources, Construction and Maintenance Occupations
The most common Natural Resources, Construction and Maintenance occupations in Lake Wisconsin are Construction & Extraction (90 | 3.8%), Installation, Maintenance & Repair (78 | 3.3%), and Farming, Fishing & Forestry (4 | 0.2%).
Natural Resources, Construction and Maintenance Occupations by Sex
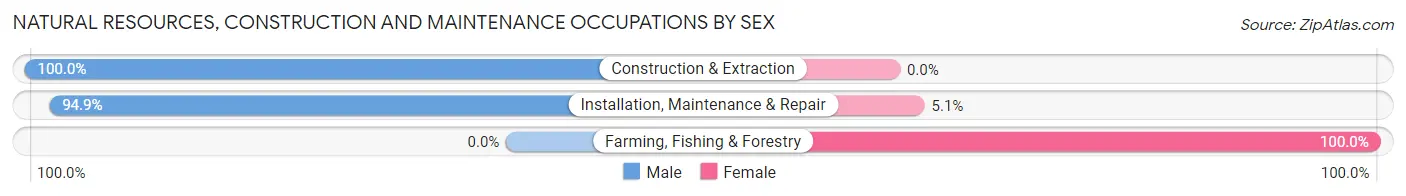
| Occupation | Male | Female |
| Farming, Fishing & Forestry | 0 (0.0%) | 4 (100.0%) |
| Construction & Extraction | 90 (100.0%) | 0 (0.0%) |
| Installation, Maintenance & Repair | 74 (94.9%) | 4 (5.1%) |
| Total (Category) | 164 (95.4%) | 8 (4.6%) |
| Total (Overall) | 1,195 (50.2%) | 1,184 (49.8%) |
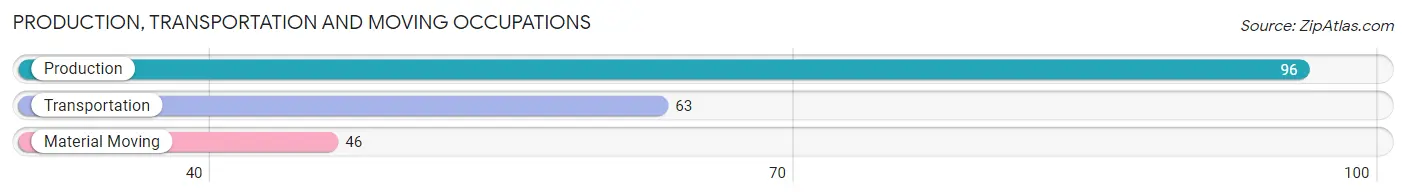
Production, Transportation and Moving Occupations
The most common Production, Transportation and Moving occupations in Lake Wisconsin are Production (96 | 4.0%), Transportation (63 | 2.6%), and Material Moving (46 | 1.9%).
Production, Transportation and Moving Occupations by Sex
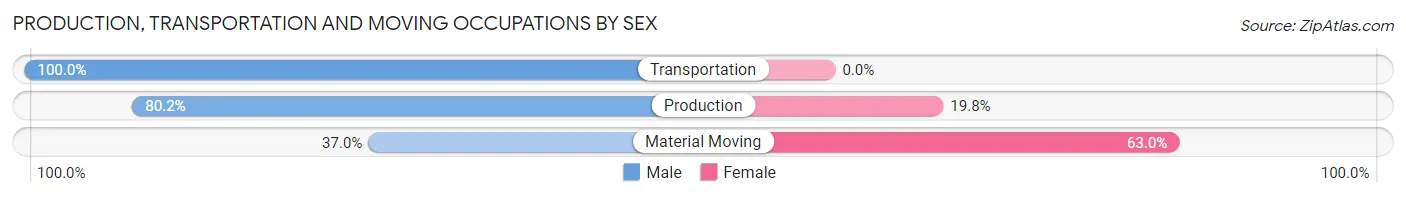
| Occupation | Male | Female |
| Production | 77 (80.2%) | 19 (19.8%) |
| Transportation | 63 (100.0%) | 0 (0.0%) |
| Material Moving | 17 (37.0%) | 29 (63.0%) |
| Total (Category) | 157 (76.6%) | 48 (23.4%) |
| Total (Overall) | 1,195 (50.2%) | 1,184 (49.8%) |
Employment Industries by Sex in Lake Wisconsin
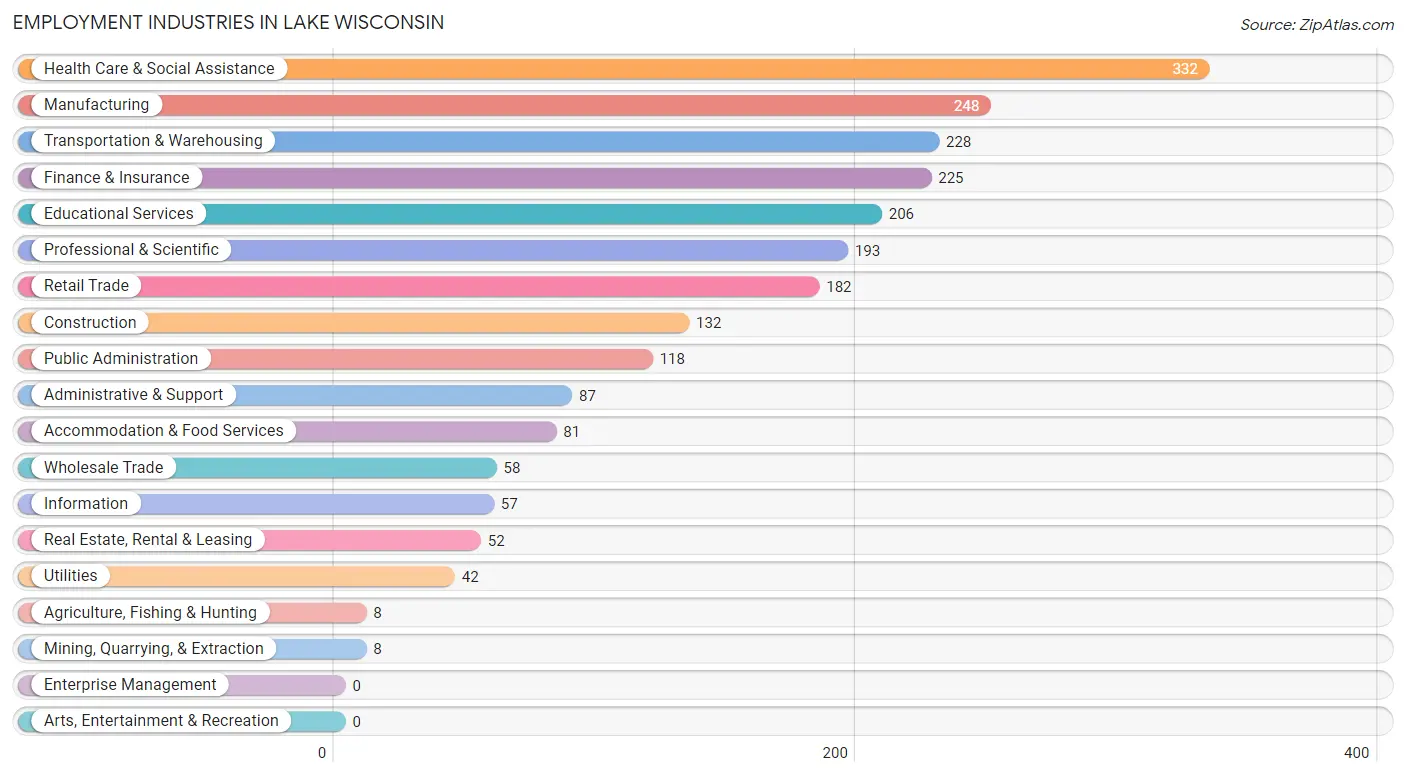
Employment Industries in Lake Wisconsin
The major employment industries in Lake Wisconsin include Health Care & Social Assistance (332 | 14.0%), Manufacturing (248 | 10.4%), Transportation & Warehousing (228 | 9.6%), Finance & Insurance (225 | 9.5%), and Educational Services (206 | 8.7%).
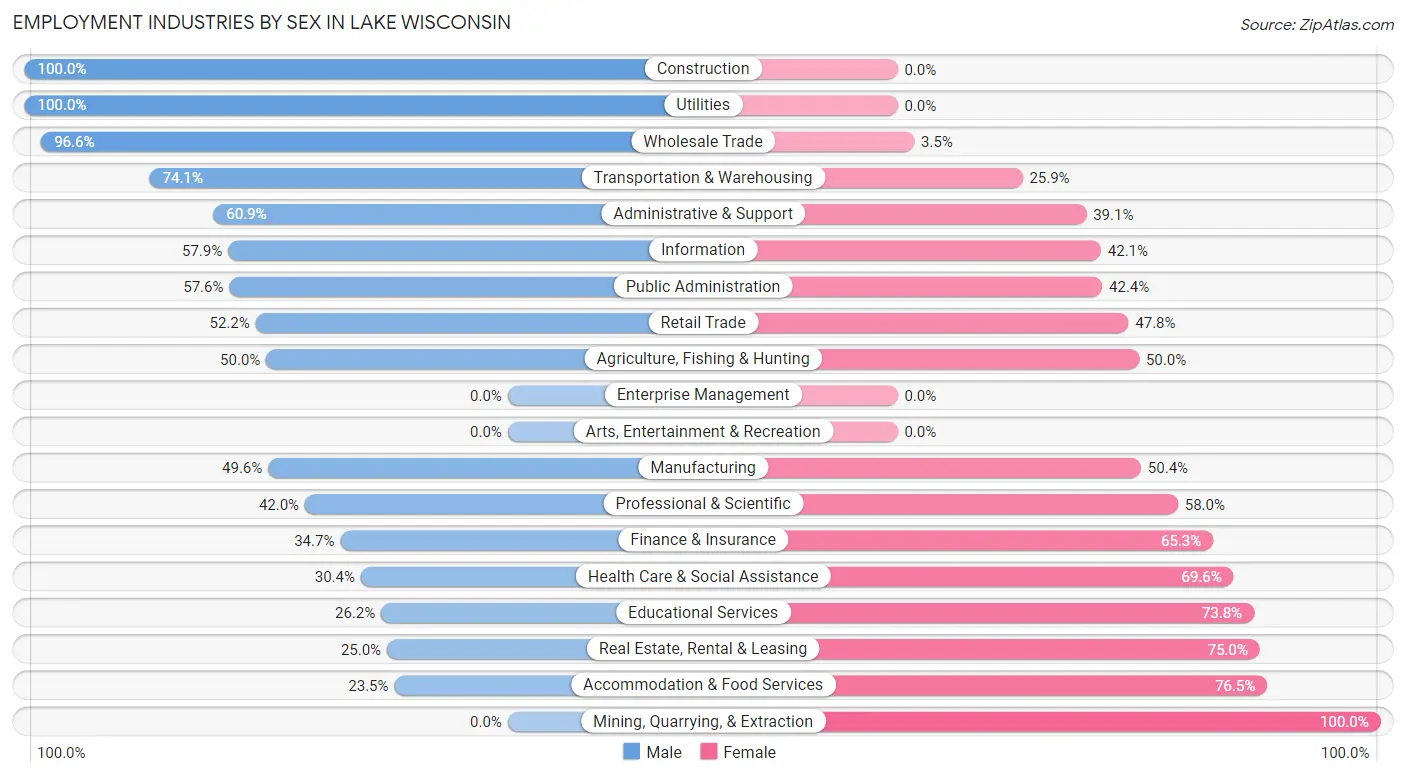
Employment Industries by Sex in Lake Wisconsin
The Lake Wisconsin industries that see more men than women are Construction (100.0%), Utilities (100.0%), and Wholesale Trade (96.6%), whereas the industries that tend to have a higher number of women are Mining, Quarrying, & Extraction (100.0%), Accommodation & Food Services (76.5%), and Real Estate, Rental & Leasing (75.0%).
| Industry | Male | Female |
| Agriculture, Fishing & Hunting | 4 (50.0%) | 4 (50.0%) |
| Mining, Quarrying, & Extraction | 0 (0.0%) | 8 (100.0%) |
| Construction | 132 (100.0%) | 0 (0.0%) |
| Manufacturing | 123 (49.6%) | 125 (50.4%) |
| Wholesale Trade | 56 (96.6%) | 2 (3.5%) |
| Retail Trade | 95 (52.2%) | 87 (47.8%) |
| Transportation & Warehousing | 169 (74.1%) | 59 (25.9%) |
| Utilities | 42 (100.0%) | 0 (0.0%) |
| Information | 33 (57.9%) | 24 (42.1%) |
| Finance & Insurance | 78 (34.7%) | 147 (65.3%) |
| Real Estate, Rental & Leasing | 13 (25.0%) | 39 (75.0%) |
| Professional & Scientific | 81 (42.0%) | 112 (58.0%) |
| Enterprise Management | 0 (0.0%) | 0 (0.0%) |
| Administrative & Support | 53 (60.9%) | 34 (39.1%) |
| Educational Services | 54 (26.2%) | 152 (73.8%) |
| Health Care & Social Assistance | 101 (30.4%) | 231 (69.6%) |
| Arts, Entertainment & Recreation | 0 (0.0%) | 0 (0.0%) |
| Accommodation & Food Services | 19 (23.5%) | 62 (76.5%) |
| Public Administration | 68 (57.6%) | 50 (42.4%) |
| Total | 1,195 (50.2%) | 1,184 (49.8%) |
Education in Lake Wisconsin
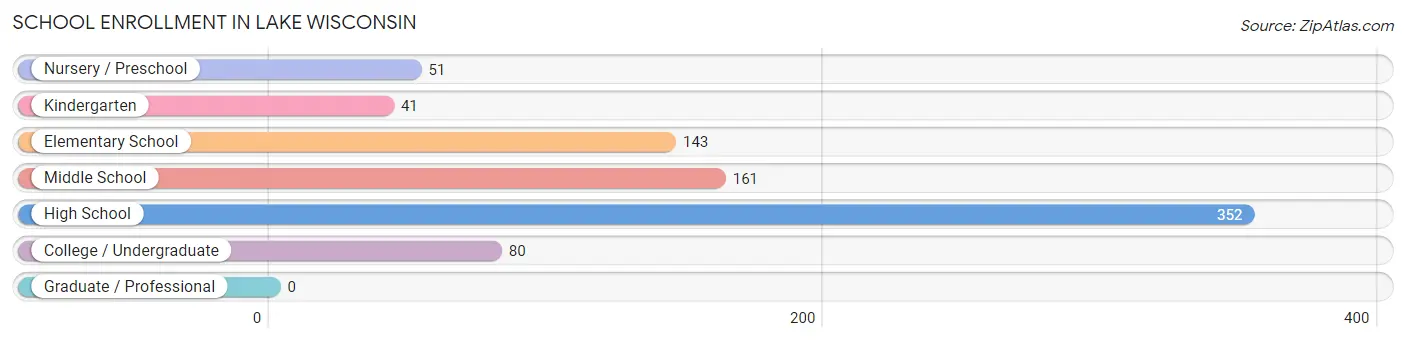
School Enrollment in Lake Wisconsin
The most common levels of schooling among the 828 students in Lake Wisconsin are high school (352 | 42.5%), middle school (161 | 19.4%), and elementary school (143 | 17.3%).
| School Level | # Students | % Students |
| Nursery / Preschool | 51 | 6.2% |
| Kindergarten | 41 | 5.0% |
| Elementary School | 143 | 17.3% |
| Middle School | 161 | 19.4% |
| High School | 352 | 42.5% |
| College / Undergraduate | 80 | 9.7% |
| Graduate / Professional | 0 | 0.0% |
| Total | 828 | 100.0% |
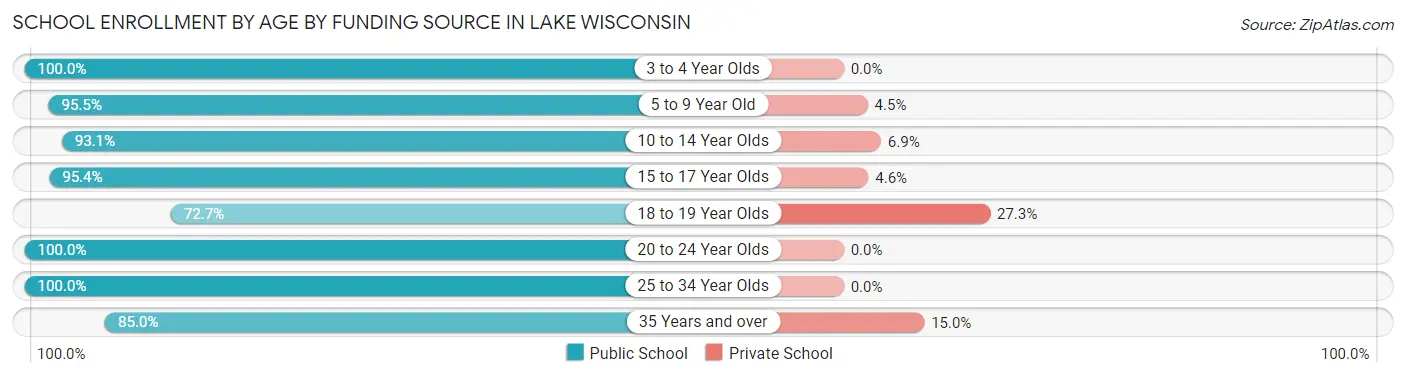
School Enrollment by Age by Funding Source in Lake Wisconsin
Out of a total of 828 students who are enrolled in schools in Lake Wisconsin, 60 (7.2%) attend a private institution, while the remaining 768 (92.8%) are enrolled in public schools. The age group of 18 to 19 year olds has the highest likelihood of being enrolled in private schools, with 18 (27.3% in the age bracket) enrolled. Conversely, the age group of 3 to 4 year olds has the lowest likelihood of being enrolled in a private school, with 3 (100.0% in the age bracket) attending a public institution.
| Age Bracket | Public School | Private School |
| 3 to 4 Year Olds | 3 (100.0%) | 0 (0.0%) |
| 5 to 9 Year Old | 171 (95.5%) | 8 (4.5%) |
| 10 to 14 Year Olds | 268 (93.1%) | 20 (6.9%) |
| 15 to 17 Year Olds | 228 (95.4%) | 11 (4.6%) |
| 18 to 19 Year Olds | 48 (72.7%) | 18 (27.3%) |
| 20 to 24 Year Olds | 26 (100.0%) | 0 (0.0%) |
| 25 to 34 Year Olds | 7 (100.0%) | 0 (0.0%) |
| 35 Years and over | 17 (85.0%) | 3 (15.0%) |
| Total | 768 (92.8%) | 60 (7.2%) |
Educational Attainment by Field of Study in Lake Wisconsin
Business (301 | 18.6%), science & technology (268 | 16.6%), bio, nature & agricultural (200 | 12.4%), education (173 | 10.7%), and psychology (157 | 9.7%) are the most common fields of study among 1,616 individuals in Lake Wisconsin who have obtained a bachelor's degree or higher.
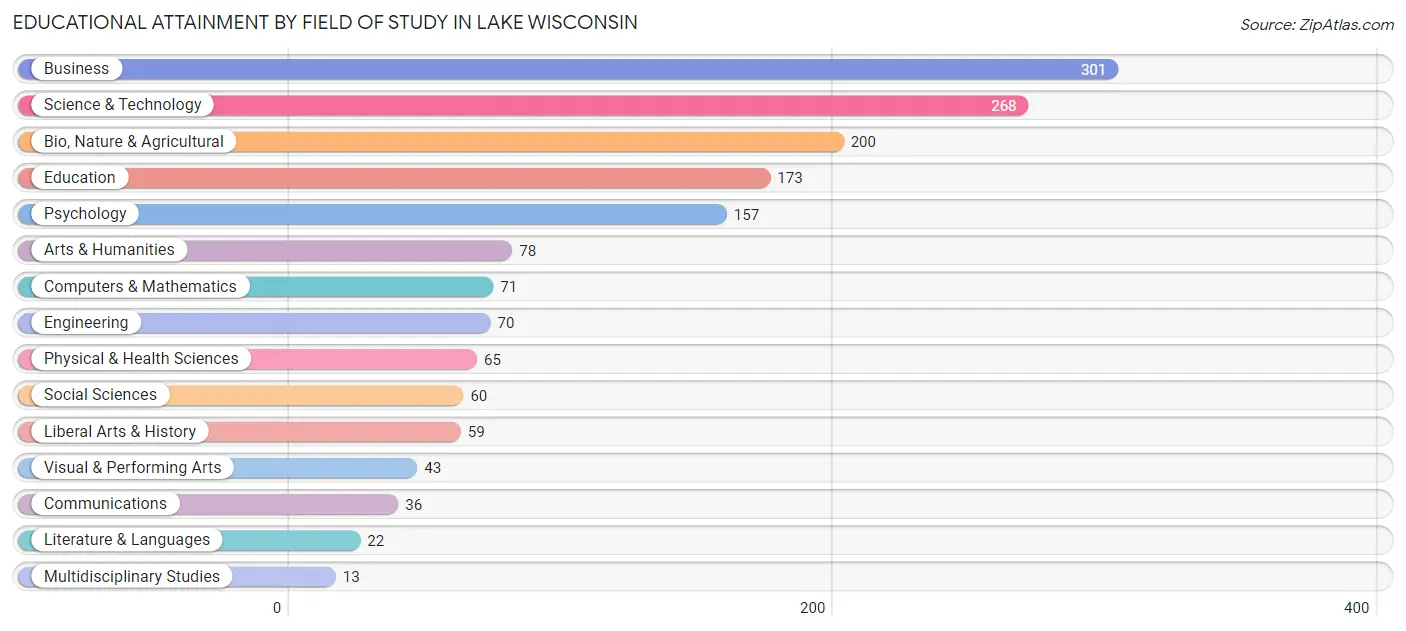
| Field of Study | # Graduates | % Graduates |
| Computers & Mathematics | 71 | 4.4% |
| Bio, Nature & Agricultural | 200 | 12.4% |
| Physical & Health Sciences | 65 | 4.0% |
| Psychology | 157 | 9.7% |
| Social Sciences | 60 | 3.7% |
| Engineering | 70 | 4.3% |
| Multidisciplinary Studies | 13 | 0.8% |
| Science & Technology | 268 | 16.6% |
| Business | 301 | 18.6% |
| Education | 173 | 10.7% |
| Literature & Languages | 22 | 1.4% |
| Liberal Arts & History | 59 | 3.6% |
| Visual & Performing Arts | 43 | 2.7% |
| Communications | 36 | 2.2% |
| Arts & Humanities | 78 | 4.8% |
| Total | 1,616 | 100.0% |
Transportation & Commute in Lake Wisconsin
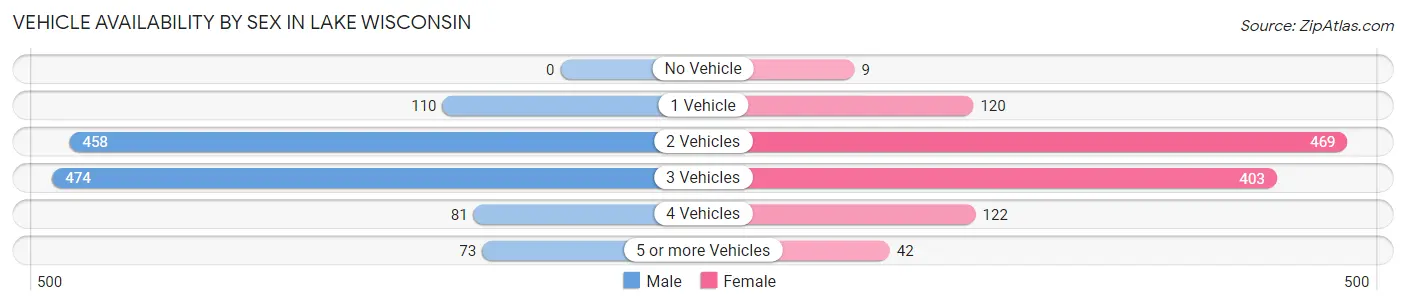
Vehicle Availability by Sex in Lake Wisconsin
The most prevalent vehicle ownership categories in Lake Wisconsin are males with 3 vehicles (474, accounting for 39.6%) and females with 3 vehicles (403, making up 40.7%).
| Vehicles Available | Male | Female |
| No Vehicle | 0 (0.0%) | 9 (0.8%) |
| 1 Vehicle | 110 (9.2%) | 120 (10.3%) |
| 2 Vehicles | 458 (38.3%) | 469 (40.3%) |
| 3 Vehicles | 474 (39.6%) | 403 (34.6%) |
| 4 Vehicles | 81 (6.8%) | 122 (10.5%) |
| 5 or more Vehicles | 73 (6.1%) | 42 (3.6%) |
| Total | 1,196 (100.0%) | 1,165 (100.0%) |
Commute Time in Lake Wisconsin
The most frequently occuring commute durations in Lake Wisconsin are 30 to 34 minutes (431 commuters, 22.1%), 45 to 59 minutes (256 commuters, 13.1%), and 35 to 39 minutes (230 commuters, 11.8%).
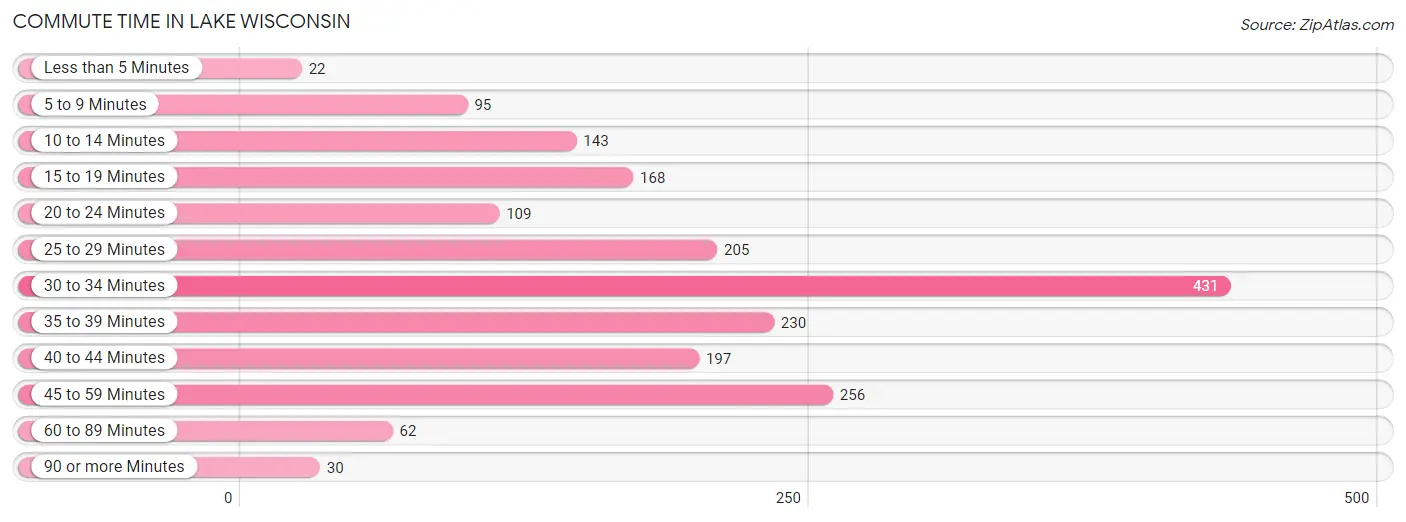
| Commute Time | # Commuters | % Commuters |
| Less than 5 Minutes | 22 | 1.1% |
| 5 to 9 Minutes | 95 | 4.9% |
| 10 to 14 Minutes | 143 | 7.3% |
| 15 to 19 Minutes | 168 | 8.6% |
| 20 to 24 Minutes | 109 | 5.6% |
| 25 to 29 Minutes | 205 | 10.5% |
| 30 to 34 Minutes | 431 | 22.1% |
| 35 to 39 Minutes | 230 | 11.8% |
| 40 to 44 Minutes | 197 | 10.1% |
| 45 to 59 Minutes | 256 | 13.1% |
| 60 to 89 Minutes | 62 | 3.2% |
| 90 or more Minutes | 30 | 1.5% |
Commute Time by Sex in Lake Wisconsin
The most common commute times in Lake Wisconsin are 30 to 34 minutes (245 commuters, 22.4%) for males and 30 to 34 minutes (186 commuters, 21.7%) for females.
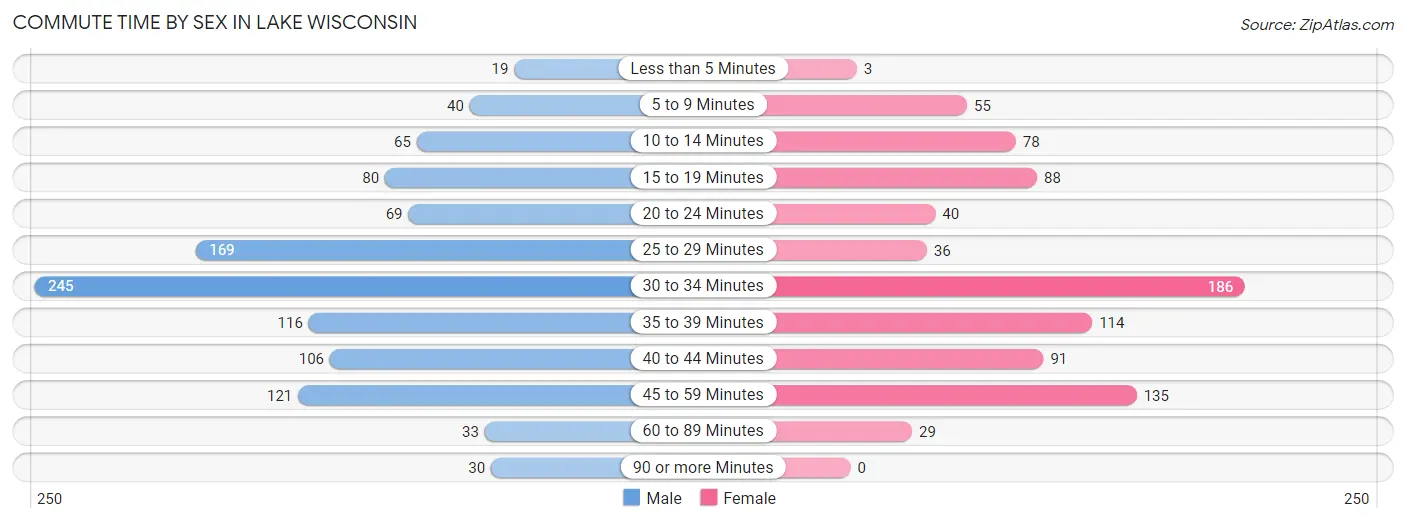
| Commute Time | Male | Female |
| Less than 5 Minutes | 19 (1.7%) | 3 (0.4%) |
| 5 to 9 Minutes | 40 (3.7%) | 55 (6.4%) |
| 10 to 14 Minutes | 65 (5.9%) | 78 (9.1%) |
| 15 to 19 Minutes | 80 (7.3%) | 88 (10.3%) |
| 20 to 24 Minutes | 69 (6.3%) | 40 (4.7%) |
| 25 to 29 Minutes | 169 (15.5%) | 36 (4.2%) |
| 30 to 34 Minutes | 245 (22.4%) | 186 (21.7%) |
| 35 to 39 Minutes | 116 (10.6%) | 114 (13.3%) |
| 40 to 44 Minutes | 106 (9.7%) | 91 (10.6%) |
| 45 to 59 Minutes | 121 (11.1%) | 135 (15.8%) |
| 60 to 89 Minutes | 33 (3.0%) | 29 (3.4%) |
| 90 or more Minutes | 30 (2.7%) | 0 (0.0%) |
Time of Departure to Work by Sex in Lake Wisconsin
The most frequent times of departure to work in Lake Wisconsin are 6:30 AM to 6:59 AM (221, 20.2%) for males and 7:00 AM to 7:29 AM (242, 28.3%) for females.
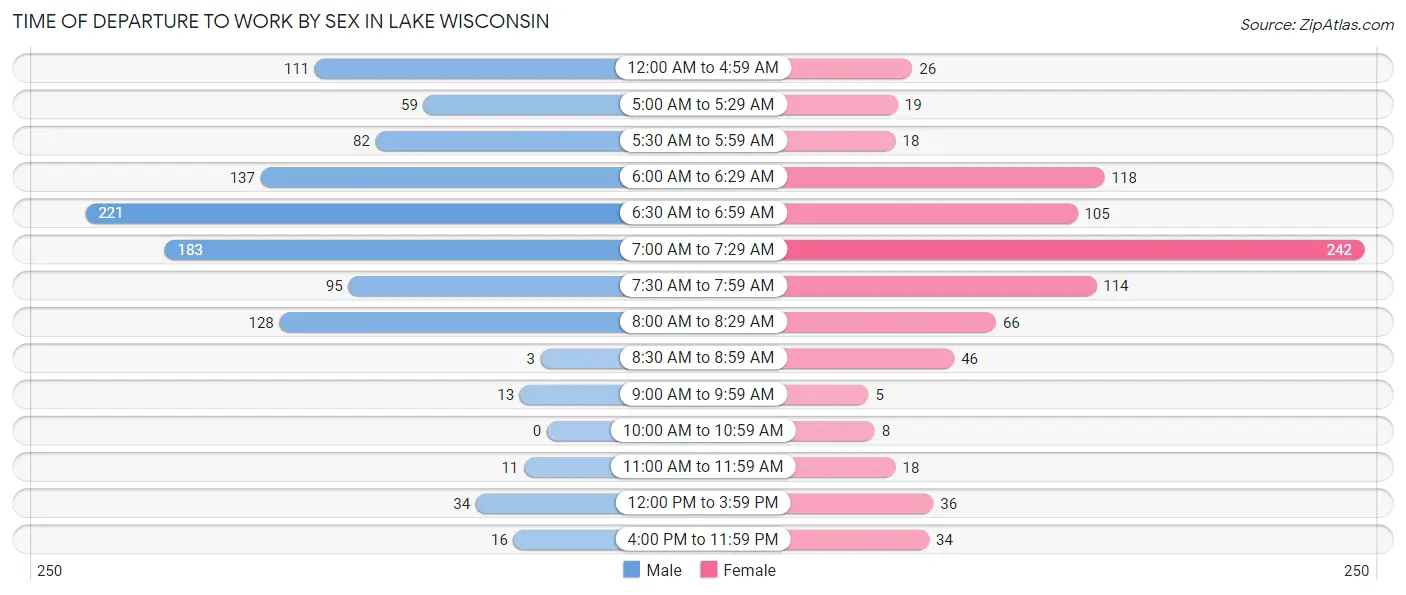
| Time of Departure | Male | Female |
| 12:00 AM to 4:59 AM | 111 (10.2%) | 26 (3.0%) |
| 5:00 AM to 5:29 AM | 59 (5.4%) | 19 (2.2%) |
| 5:30 AM to 5:59 AM | 82 (7.5%) | 18 (2.1%) |
| 6:00 AM to 6:29 AM | 137 (12.5%) | 118 (13.8%) |
| 6:30 AM to 6:59 AM | 221 (20.2%) | 105 (12.3%) |
| 7:00 AM to 7:29 AM | 183 (16.7%) | 242 (28.3%) |
| 7:30 AM to 7:59 AM | 95 (8.7%) | 114 (13.3%) |
| 8:00 AM to 8:29 AM | 128 (11.7%) | 66 (7.7%) |
| 8:30 AM to 8:59 AM | 3 (0.3%) | 46 (5.4%) |
| 9:00 AM to 9:59 AM | 13 (1.2%) | 5 (0.6%) |
| 10:00 AM to 10:59 AM | 0 (0.0%) | 8 (0.9%) |
| 11:00 AM to 11:59 AM | 11 (1.0%) | 18 (2.1%) |
| 12:00 PM to 3:59 PM | 34 (3.1%) | 36 (4.2%) |
| 4:00 PM to 11:59 PM | 16 (1.5%) | 34 (4.0%) |
| Total | 1,093 (100.0%) | 855 (100.0%) |
Housing Occupancy in Lake Wisconsin
Occupancy by Ownership in Lake Wisconsin
Of the total 2,219 dwellings in Lake Wisconsin, owner-occupied units account for 2,055 (92.6%), while renter-occupied units make up 164 (7.4%).
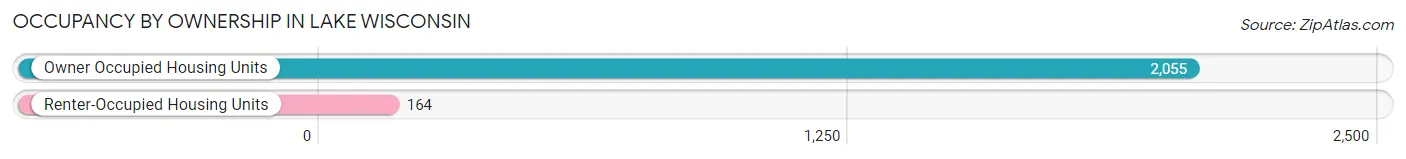
| Occupancy | # Housing Units | % Housing Units |
| Owner Occupied Housing Units | 2,055 | 92.6% |
| Renter-Occupied Housing Units | 164 | 7.4% |
| Total Occupied Housing Units | 2,219 | 100.0% |
Occupancy by Household Size in Lake Wisconsin
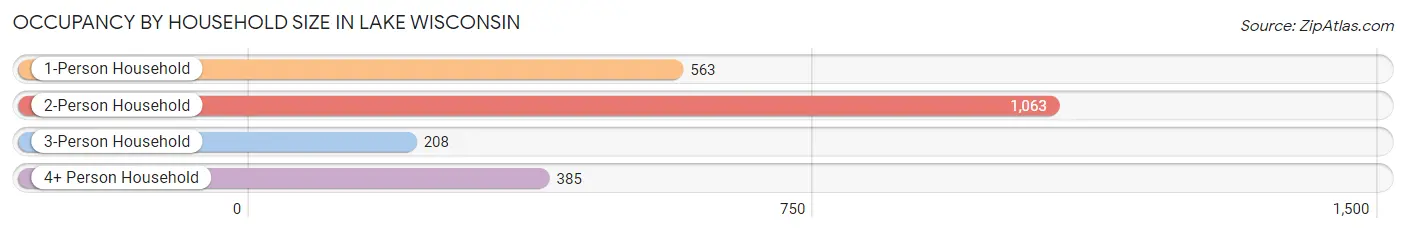
| Household Size | # Housing Units | % Housing Units |
| 1-Person Household | 563 | 25.4% |
| 2-Person Household | 1,063 | 47.9% |
| 3-Person Household | 208 | 9.4% |
| 4+ Person Household | 385 | 17.3% |
| Total Housing Units | 2,219 | 100.0% |
Occupancy by Ownership by Household Size in Lake Wisconsin
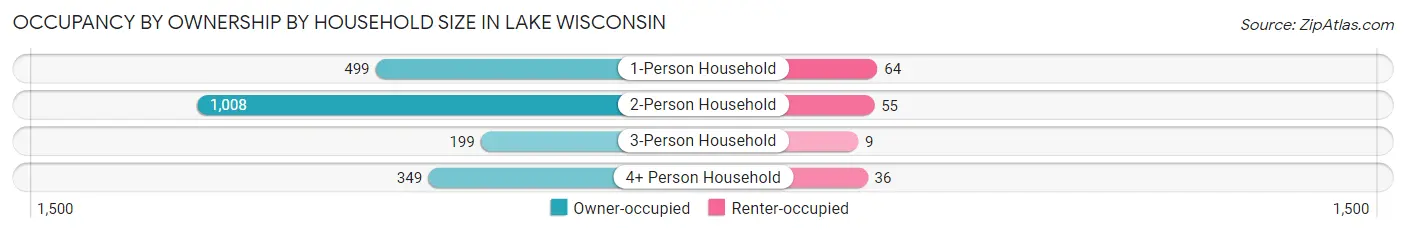
| Household Size | Owner-occupied | Renter-occupied |
| 1-Person Household | 499 (88.6%) | 64 (11.4%) |
| 2-Person Household | 1,008 (94.8%) | 55 (5.2%) |
| 3-Person Household | 199 (95.7%) | 9 (4.3%) |
| 4+ Person Household | 349 (90.6%) | 36 (9.3%) |
| Total Housing Units | 2,055 (92.6%) | 164 (7.4%) |
Occupancy by Educational Attainment in Lake Wisconsin
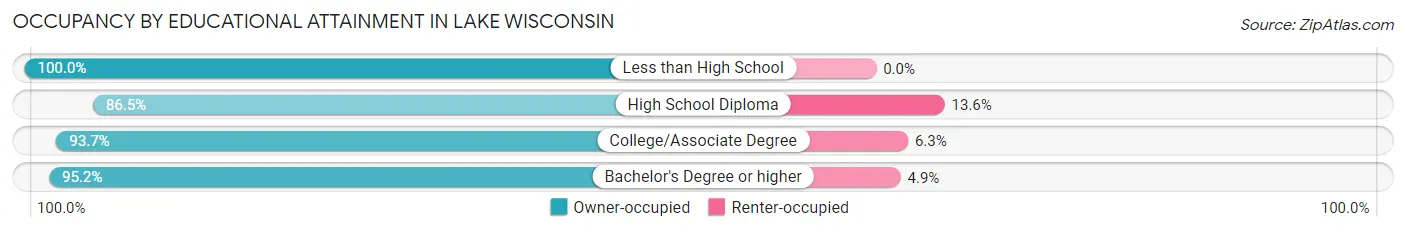
| Household Size | Owner-occupied | Renter-occupied |
| Less than High School | 32 (100.0%) | 0 (0.0%) |
| High School Diploma | 472 (86.5%) | 74 (13.6%) |
| College/Associate Degree | 668 (93.7%) | 45 (6.3%) |
| Bachelor's Degree or higher | 883 (95.2%) | 45 (4.9%) |
Occupancy by Age of Householder in Lake Wisconsin
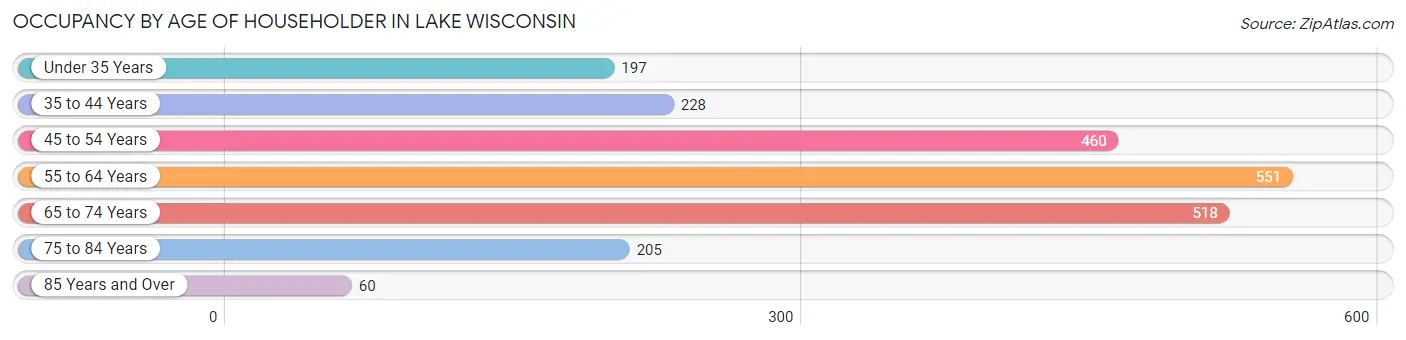
| Age Bracket | # Households | % Households |
| Under 35 Years | 197 | 8.9% |
| 35 to 44 Years | 228 | 10.3% |
| 45 to 54 Years | 460 | 20.7% |
| 55 to 64 Years | 551 | 24.8% |
| 65 to 74 Years | 518 | 23.3% |
| 75 to 84 Years | 205 | 9.2% |
| 85 Years and Over | 60 | 2.7% |
| Total | 2,219 | 100.0% |
Housing Finances in Lake Wisconsin
Median Income by Occupancy in Lake Wisconsin
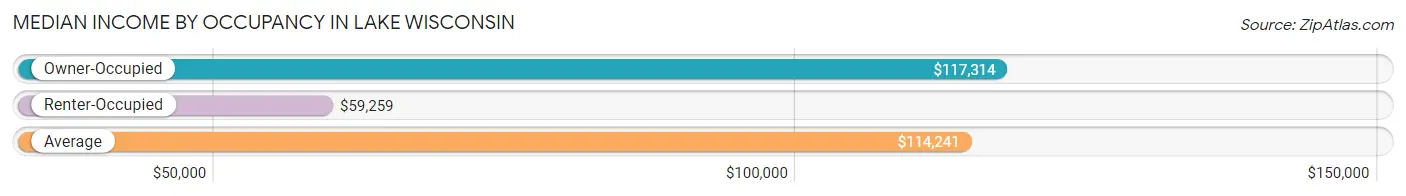
| Occupancy Type | # Households | Median Income |
| Owner-Occupied | 2,055 (92.6%) | $117,314 |
| Renter-Occupied | 164 (7.4%) | $59,259 |
| Average | 2,219 (100.0%) | $114,241 |
Occupancy by Householder Income Bracket in Lake Wisconsin
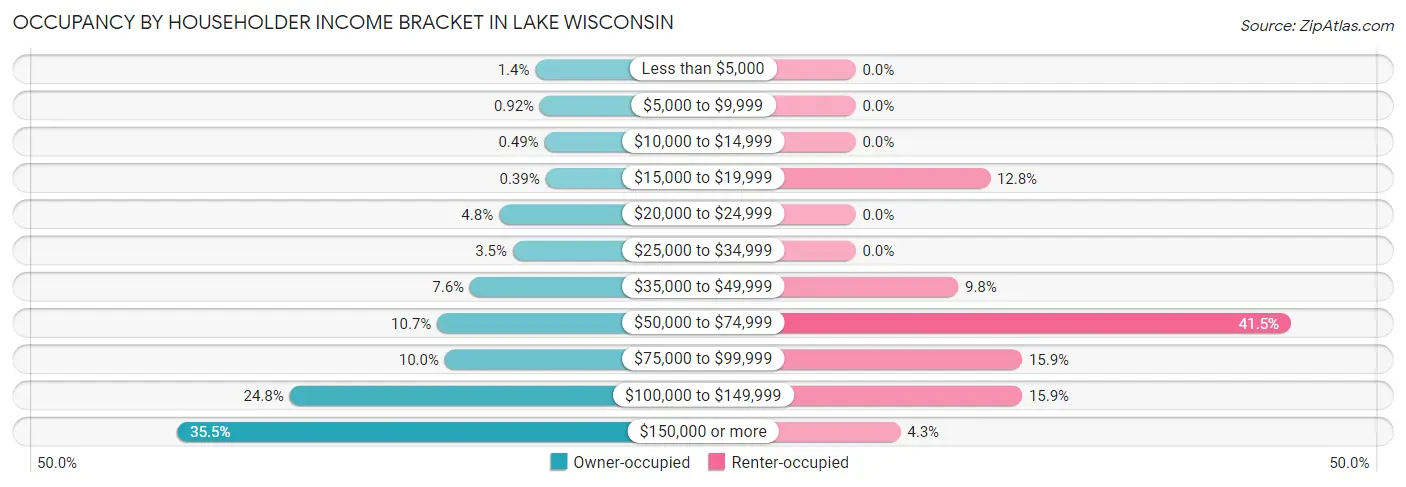
| Income Bracket | Owner-occupied | Renter-occupied |
| Less than $5,000 | 28 (1.4%) | 0 (0.0%) |
| $5,000 to $9,999 | 19 (0.9%) | 0 (0.0%) |
| $10,000 to $14,999 | 10 (0.5%) | 0 (0.0%) |
| $15,000 to $19,999 | 8 (0.4%) | 21 (12.8%) |
| $20,000 to $24,999 | 99 (4.8%) | 0 (0.0%) |
| $25,000 to $34,999 | 72 (3.5%) | 0 (0.0%) |
| $35,000 to $49,999 | 156 (7.6%) | 16 (9.8%) |
| $50,000 to $74,999 | 220 (10.7%) | 68 (41.5%) |
| $75,000 to $99,999 | 205 (10.0%) | 26 (15.9%) |
| $100,000 to $149,999 | 509 (24.8%) | 26 (15.9%) |
| $150,000 or more | 729 (35.5%) | 7 (4.3%) |
| Total | 2,055 (100.0%) | 164 (100.0%) |
Monthly Housing Cost Tiers in Lake Wisconsin
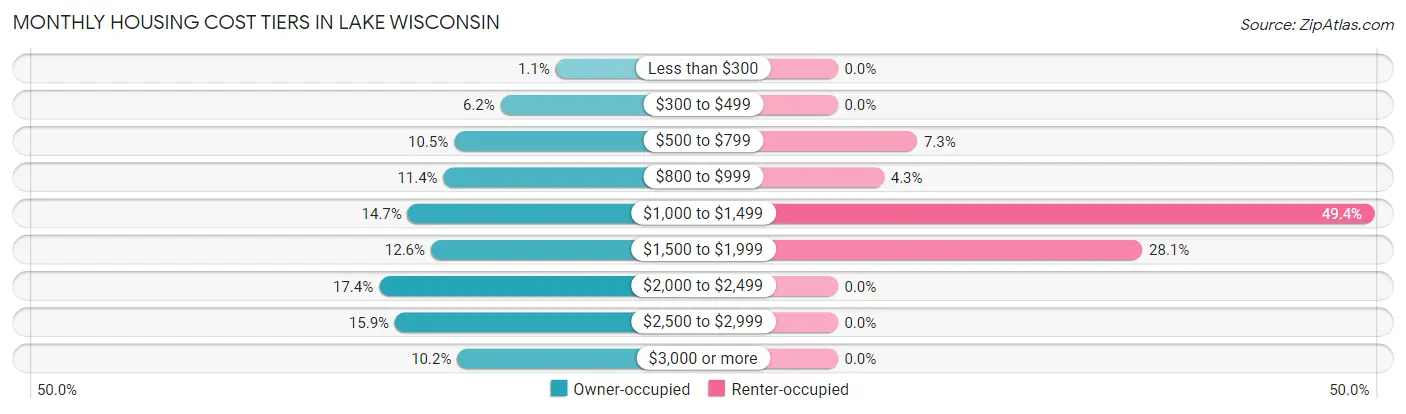
| Monthly Cost | Owner-occupied | Renter-occupied |
| Less than $300 | 23 (1.1%) | 0 (0.0%) |
| $300 to $499 | 127 (6.2%) | 0 (0.0%) |
| $500 to $799 | 215 (10.5%) | 12 (7.3%) |
| $800 to $999 | 235 (11.4%) | 7 (4.3%) |
| $1,000 to $1,499 | 303 (14.7%) | 81 (49.4%) |
| $1,500 to $1,999 | 259 (12.6%) | 46 (28.1%) |
| $2,000 to $2,499 | 357 (17.4%) | 0 (0.0%) |
| $2,500 to $2,999 | 327 (15.9%) | 0 (0.0%) |
| $3,000 or more | 209 (10.2%) | 0 (0.0%) |
| Total | 2,055 (100.0%) | 164 (100.0%) |
Physical Housing Characteristics in Lake Wisconsin
Housing Structures in Lake Wisconsin
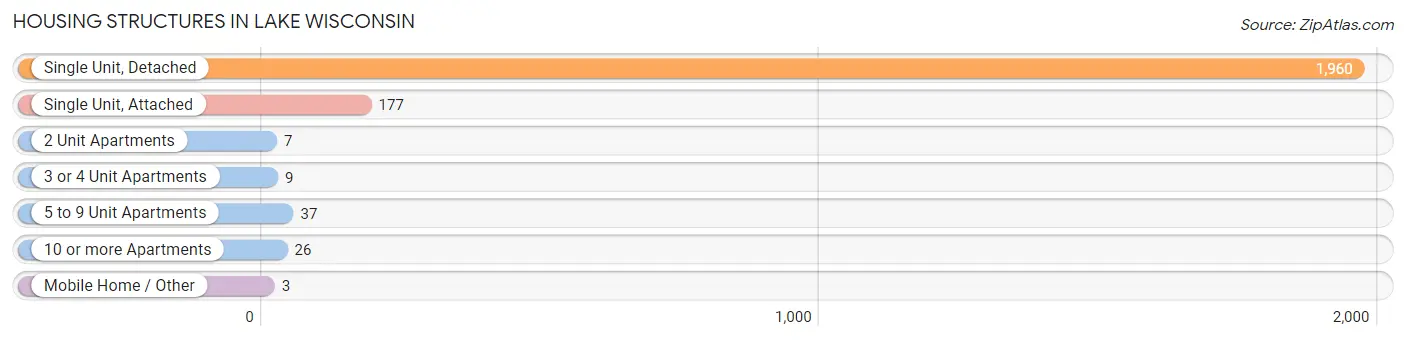
| Structure Type | # Housing Units | % Housing Units |
| Single Unit, Detached | 1,960 | 88.3% |
| Single Unit, Attached | 177 | 8.0% |
| 2 Unit Apartments | 7 | 0.3% |
| 3 or 4 Unit Apartments | 9 | 0.4% |
| 5 to 9 Unit Apartments | 37 | 1.7% |
| 10 or more Apartments | 26 | 1.2% |
| Mobile Home / Other | 3 | 0.1% |
| Total | 2,219 | 100.0% |
Housing Structures by Occupancy in Lake Wisconsin
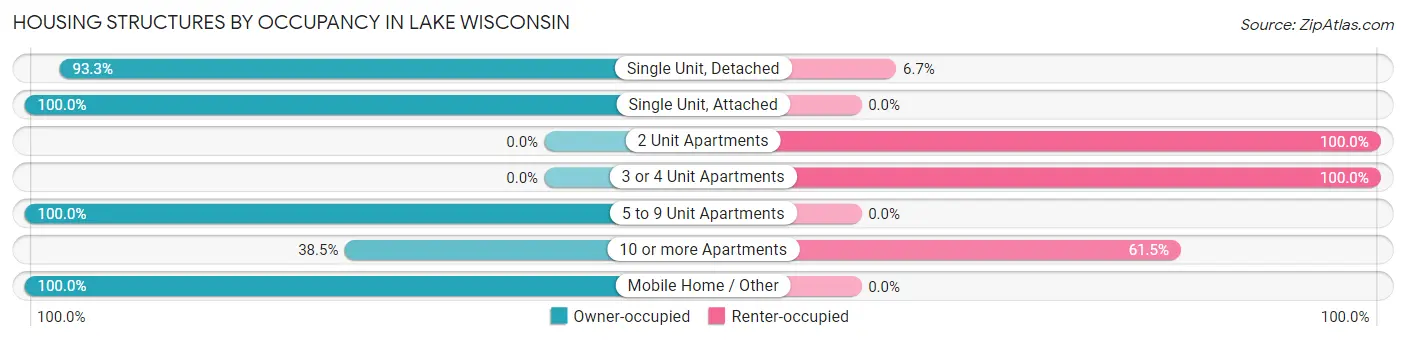
| Structure Type | Owner-occupied | Renter-occupied |
| Single Unit, Detached | 1,828 (93.3%) | 132 (6.7%) |
| Single Unit, Attached | 177 (100.0%) | 0 (0.0%) |
| 2 Unit Apartments | 0 (0.0%) | 7 (100.0%) |
| 3 or 4 Unit Apartments | 0 (0.0%) | 9 (100.0%) |
| 5 to 9 Unit Apartments | 37 (100.0%) | 0 (0.0%) |
| 10 or more Apartments | 10 (38.5%) | 16 (61.5%) |
| Mobile Home / Other | 3 (100.0%) | 0 (0.0%) |
| Total | 2,055 (92.6%) | 164 (7.4%) |
Housing Structures by Number of Rooms in Lake Wisconsin
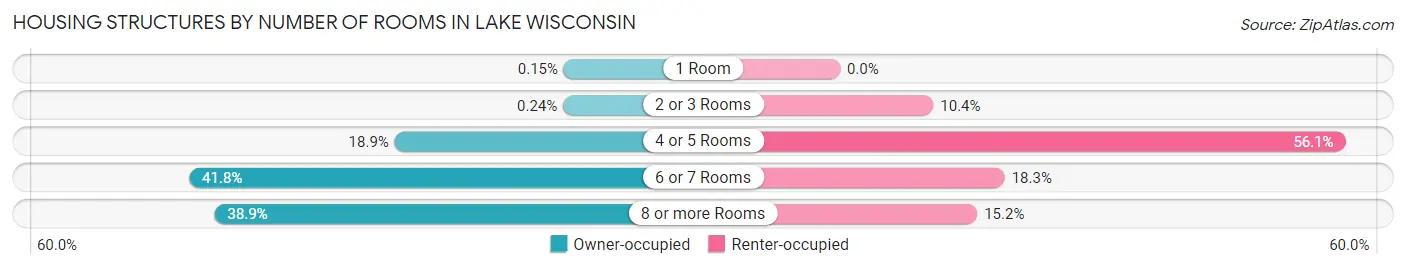
| Number of Rooms | Owner-occupied | Renter-occupied |
| 1 Room | 3 (0.2%) | 0 (0.0%) |
| 2 or 3 Rooms | 5 (0.2%) | 17 (10.4%) |
| 4 or 5 Rooms | 389 (18.9%) | 92 (56.1%) |
| 6 or 7 Rooms | 858 (41.7%) | 30 (18.3%) |
| 8 or more Rooms | 800 (38.9%) | 25 (15.2%) |
| Total | 2,055 (100.0%) | 164 (100.0%) |
Housing Structure by Heating Type in Lake Wisconsin
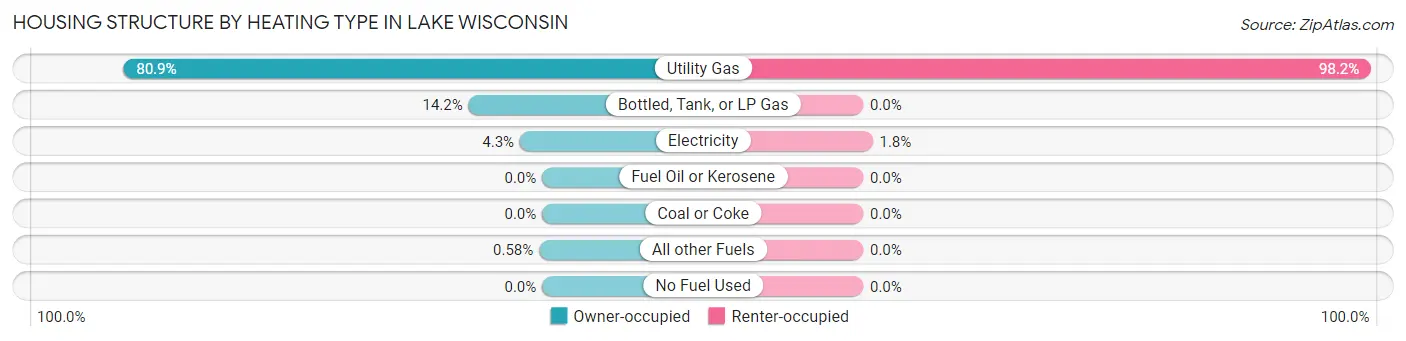
| Heating Type | Owner-occupied | Renter-occupied |
| Utility Gas | 1,663 (80.9%) | 161 (98.2%) |
| Bottled, Tank, or LP Gas | 292 (14.2%) | 0 (0.0%) |
| Electricity | 88 (4.3%) | 3 (1.8%) |
| Fuel Oil or Kerosene | 0 (0.0%) | 0 (0.0%) |
| Coal or Coke | 0 (0.0%) | 0 (0.0%) |
| All other Fuels | 12 (0.6%) | 0 (0.0%) |
| No Fuel Used | 0 (0.0%) | 0 (0.0%) |
| Total | 2,055 (100.0%) | 164 (100.0%) |
Household Vehicle Usage in Lake Wisconsin
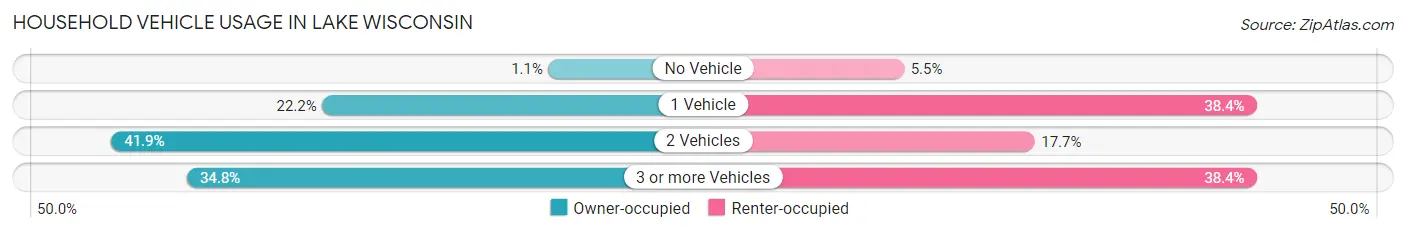
| Vehicles per Household | Owner-occupied | Renter-occupied |
| No Vehicle | 22 (1.1%) | 9 (5.5%) |
| 1 Vehicle | 456 (22.2%) | 63 (38.4%) |
| 2 Vehicles | 861 (41.9%) | 29 (17.7%) |
| 3 or more Vehicles | 716 (34.8%) | 63 (38.4%) |
| Total | 2,055 (100.0%) | 164 (100.0%) |
Real Estate & Mortgages in Lake Wisconsin
Real Estate and Mortgage Overview in Lake Wisconsin
| Characteristic | Without Mortgage | With Mortgage |
| Housing Units | 713 | 1,342 |
| Median Property Value | $365,200 | $424,100 |
| Median Household Income | $69,350 | $603 |
| Monthly Housing Costs | $800 | $209 |
| Real Estate Taxes | $5,349 | $0 |
Property Value by Mortgage Status in Lake Wisconsin
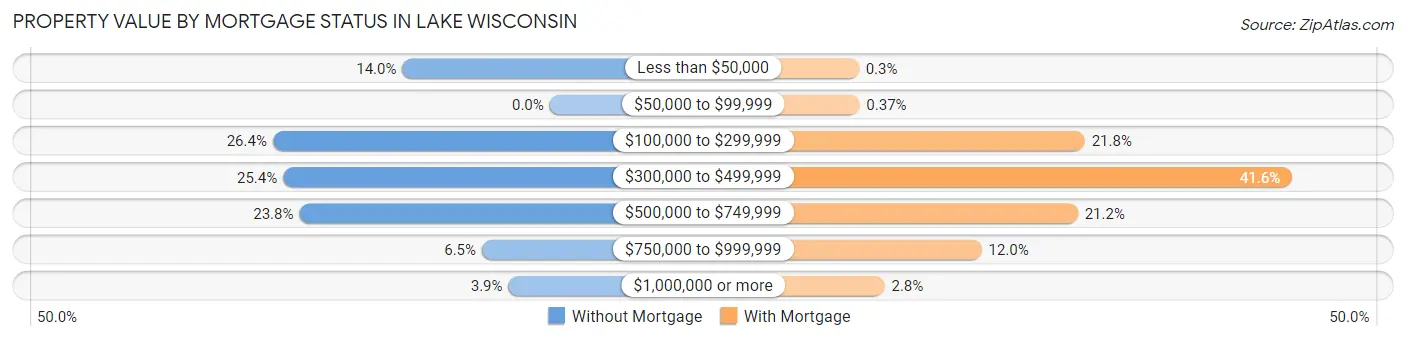
| Property Value | Without Mortgage | With Mortgage |
| Less than $50,000 | 100 (14.0%) | 4 (0.3%) |
| $50,000 to $99,999 | 0 (0.0%) | 5 (0.4%) |
| $100,000 to $299,999 | 188 (26.4%) | 293 (21.8%) |
| $300,000 to $499,999 | 181 (25.4%) | 558 (41.6%) |
| $500,000 to $749,999 | 170 (23.8%) | 284 (21.2%) |
| $750,000 to $999,999 | 46 (6.5%) | 161 (12.0%) |
| $1,000,000 or more | 28 (3.9%) | 37 (2.8%) |
| Total | 713 (100.0%) | 1,342 (100.0%) |
Household Income by Mortgage Status in Lake Wisconsin
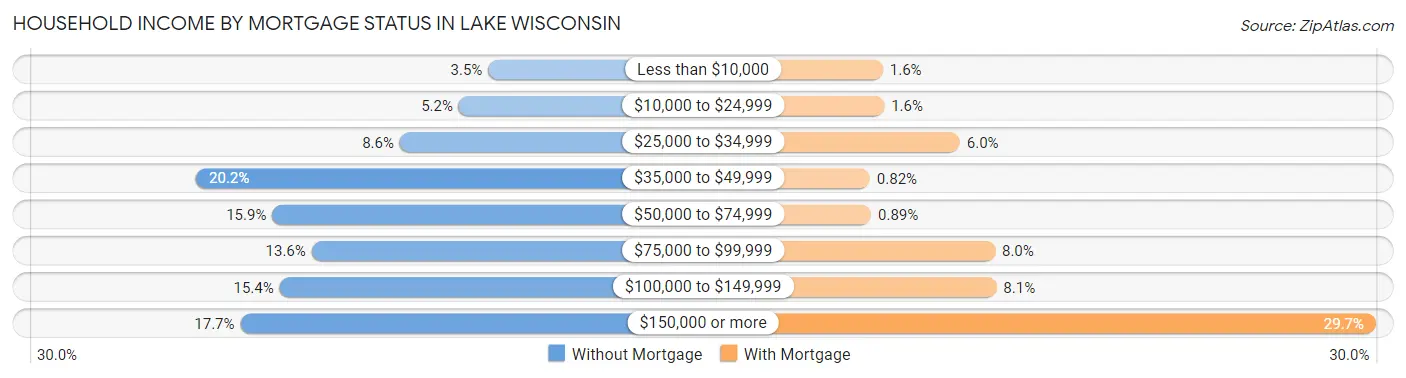
| Household Income | Without Mortgage | With Mortgage |
| Less than $10,000 | 25 (3.5%) | 21 (1.6%) |
| $10,000 to $24,999 | 37 (5.2%) | 22 (1.6%) |
| $25,000 to $34,999 | 61 (8.6%) | 80 (6.0%) |
| $35,000 to $49,999 | 144 (20.2%) | 11 (0.8%) |
| $50,000 to $74,999 | 113 (15.9%) | 12 (0.9%) |
| $75,000 to $99,999 | 97 (13.6%) | 107 (8.0%) |
| $100,000 to $149,999 | 110 (15.4%) | 108 (8.1%) |
| $150,000 or more | 126 (17.7%) | 399 (29.7%) |
| Total | 713 (100.0%) | 1,342 (100.0%) |
Property Value to Household Income Ratio in Lake Wisconsin
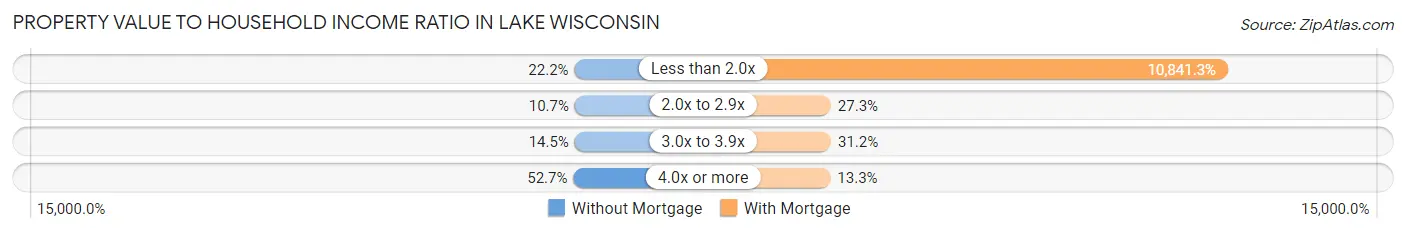
| Value-to-Income Ratio | Without Mortgage | With Mortgage |
| Less than 2.0x | 158 (22.2%) | 145,490 (10,841.3%) |
| 2.0x to 2.9x | 76 (10.7%) | 366 (27.3%) |
| 3.0x to 3.9x | 103 (14.4%) | 419 (31.2%) |
| 4.0x or more | 376 (52.7%) | 179 (13.3%) |
| Total | 713 (100.0%) | 1,342 (100.0%) |
Real Estate Taxes by Mortgage Status in Lake Wisconsin
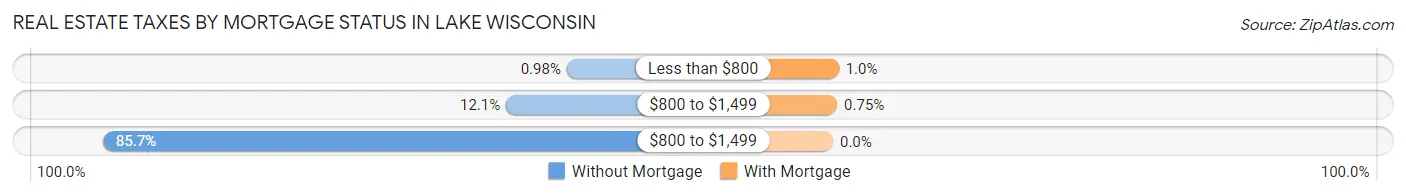
| Property Taxes | Without Mortgage | With Mortgage |
| Less than $800 | 7 (1.0%) | 14 (1.0%) |
| $800 to $1,499 | 86 (12.1%) | 10 (0.7%) |
| $800 to $1,499 | 611 (85.7%) | 0 (0.0%) |
| Total | 713 (100.0%) | 1,342 (100.0%) |
Health & Disability in Lake Wisconsin
Health Insurance Coverage by Age in Lake Wisconsin
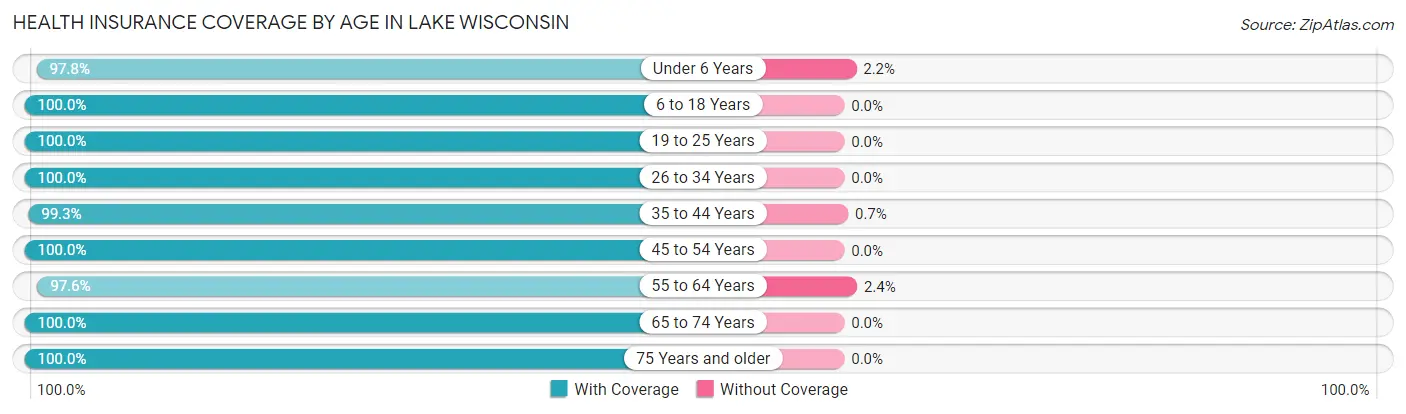
| Age Bracket | With Coverage | Without Coverage |
| Under 6 Years | 263 (97.8%) | 6 (2.2%) |
| 6 to 18 Years | 777 (100.0%) | 0 (0.0%) |
| 19 to 25 Years | 108 (100.0%) | 0 (0.0%) |
| 26 to 34 Years | 365 (100.0%) | 0 (0.0%) |
| 35 to 44 Years | 428 (99.3%) | 3 (0.7%) |
| 45 to 54 Years | 835 (100.0%) | 0 (0.0%) |
| 55 to 64 Years | 948 (97.6%) | 23 (2.4%) |
| 65 to 74 Years | 744 (100.0%) | 0 (0.0%) |
| 75 Years and older | 374 (100.0%) | 0 (0.0%) |
| Total | 4,842 (99.3%) | 32 (0.7%) |
Health Insurance Coverage by Citizenship Status in Lake Wisconsin
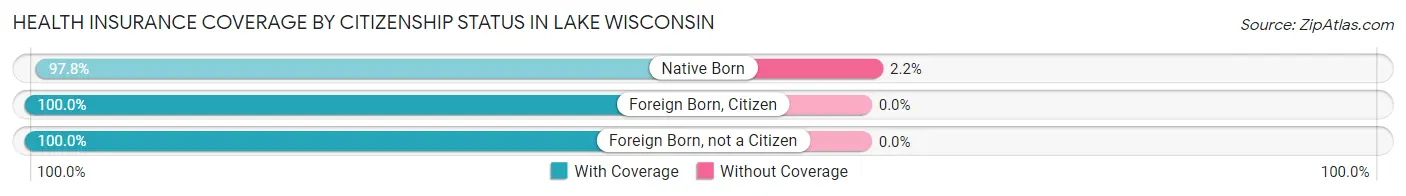
| Citizenship Status | With Coverage | Without Coverage |
| Native Born | 263 (97.8%) | 6 (2.2%) |
| Foreign Born, Citizen | 777 (100.0%) | 0 (0.0%) |
| Foreign Born, not a Citizen | 108 (100.0%) | 0 (0.0%) |
Health Insurance Coverage by Household Income in Lake Wisconsin
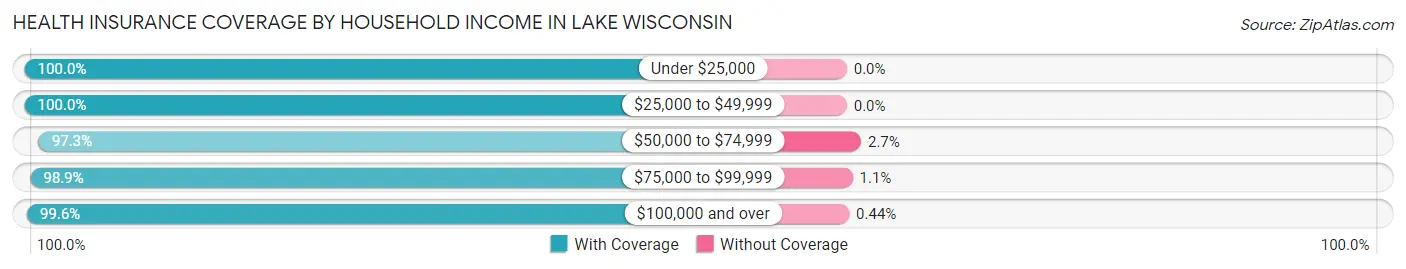
| Household Income | With Coverage | Without Coverage |
| Under $25,000 | 284 (100.0%) | 0 (0.0%) |
| $25,000 to $49,999 | 307 (100.0%) | 0 (0.0%) |
| $50,000 to $74,999 | 473 (97.3%) | 13 (2.7%) |
| $75,000 to $99,999 | 366 (98.9%) | 4 (1.1%) |
| $100,000 and over | 3,412 (99.6%) | 15 (0.4%) |
Public vs Private Health Insurance Coverage by Age in Lake Wisconsin
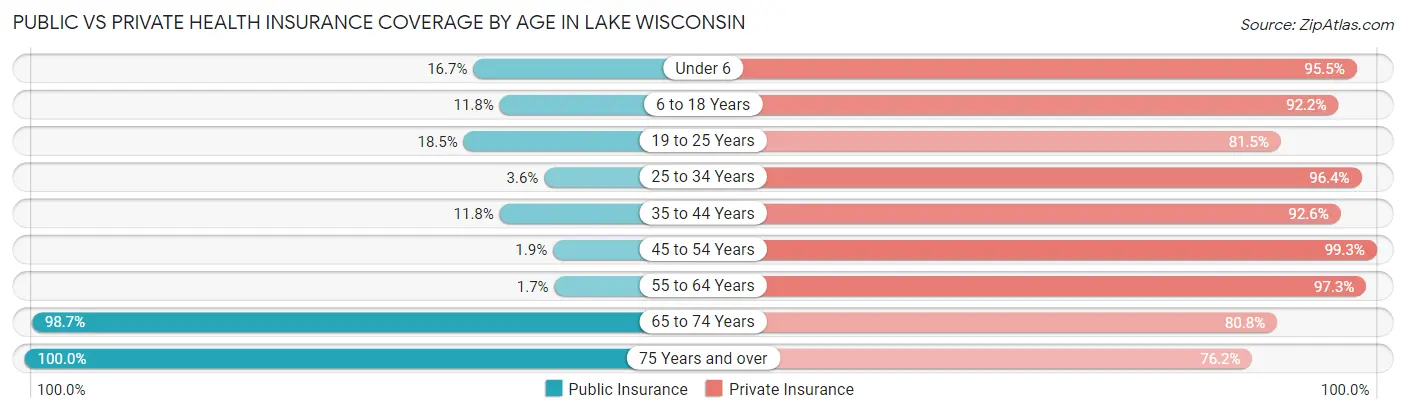
| Age Bracket | Public Insurance | Private Insurance |
| Under 6 | 45 (16.7%) | 257 (95.5%) |
| 6 to 18 Years | 92 (11.8%) | 716 (92.1%) |
| 19 to 25 Years | 20 (18.5%) | 88 (81.5%) |
| 25 to 34 Years | 13 (3.6%) | 352 (96.4%) |
| 35 to 44 Years | 51 (11.8%) | 399 (92.6%) |
| 45 to 54 Years | 16 (1.9%) | 829 (99.3%) |
| 55 to 64 Years | 16 (1.7%) | 945 (97.3%) |
| 65 to 74 Years | 734 (98.7%) | 601 (80.8%) |
| 75 Years and over | 374 (100.0%) | 285 (76.2%) |
| Total | 1,361 (27.9%) | 4,472 (91.7%) |
Disability Status by Sex by Age in Lake Wisconsin
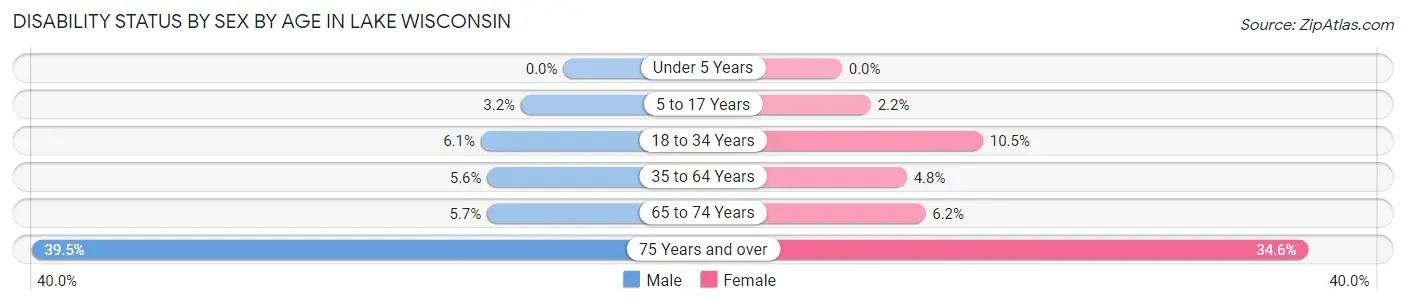
| Age Bracket | Male | Female |
| Under 5 Years | 0 (0.0%) | 0 (0.0%) |
| 5 to 17 Years | 14 (3.2%) | 6 (2.1%) |
| 18 to 34 Years | 20 (6.1%) | 27 (10.5%) |
| 35 to 64 Years | 63 (5.6%) | 54 (4.8%) |
| 65 to 74 Years | 22 (5.7%) | 22 (6.2%) |
| 75 Years and over | 77 (39.5%) | 62 (34.6%) |
Disability Class by Sex by Age in Lake Wisconsin
Disability Class: Hearing Difficulty
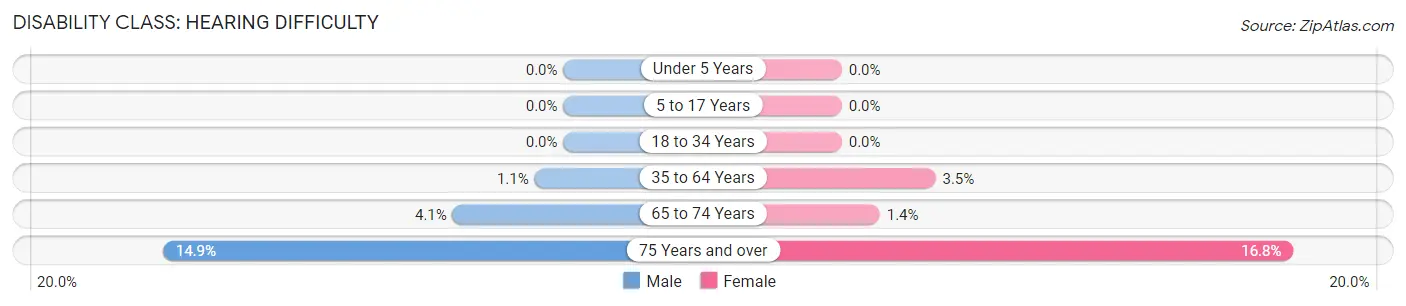
| Age Bracket | Male | Female |
| Under 5 Years | 0 (0.0%) | 0 (0.0%) |
| 5 to 17 Years | 0 (0.0%) | 0 (0.0%) |
| 18 to 34 Years | 0 (0.0%) | 0 (0.0%) |
| 35 to 64 Years | 12 (1.1%) | 39 (3.5%) |
| 65 to 74 Years | 16 (4.1%) | 5 (1.4%) |
| 75 Years and over | 29 (14.9%) | 30 (16.8%) |
Disability Class: Vision Difficulty
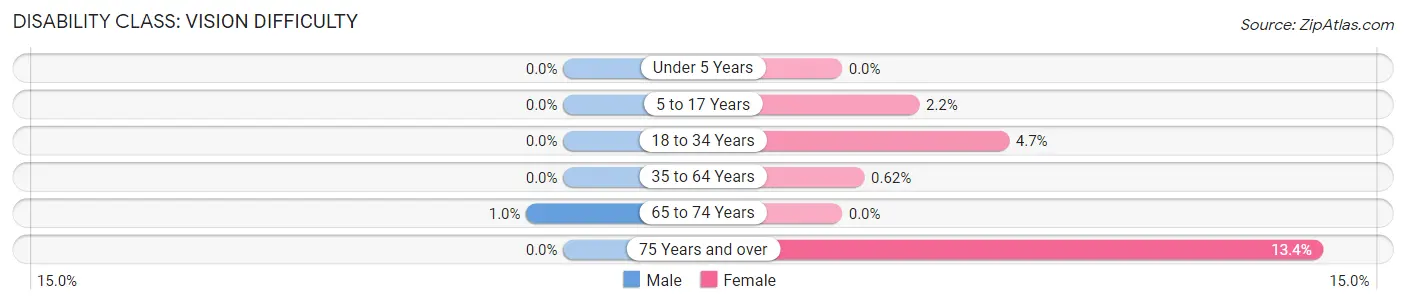
| Age Bracket | Male | Female |
| Under 5 Years | 0 (0.0%) | 0 (0.0%) |
| 5 to 17 Years | 0 (0.0%) | 6 (2.1%) |
| 18 to 34 Years | 0 (0.0%) | 12 (4.6%) |
| 35 to 64 Years | 0 (0.0%) | 7 (0.6%) |
| 65 to 74 Years | 4 (1.0%) | 0 (0.0%) |
| 75 Years and over | 0 (0.0%) | 24 (13.4%) |
Disability Class: Cognitive Difficulty
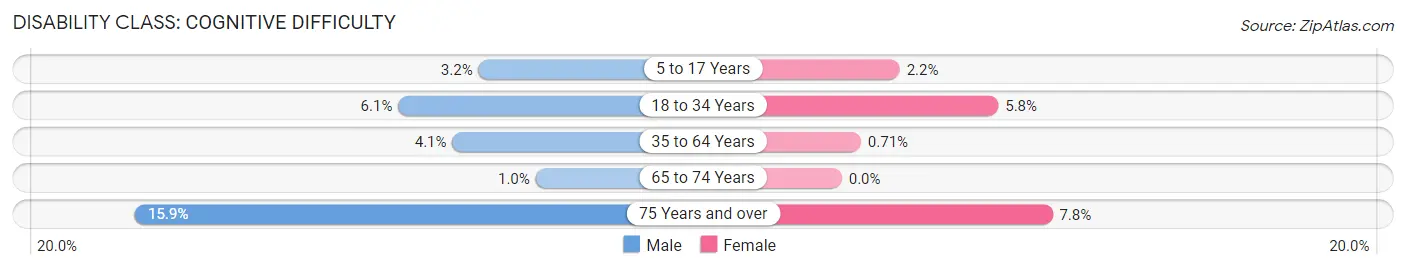
| Age Bracket | Male | Female |
| 5 to 17 Years | 14 (3.2%) | 6 (2.1%) |
| 18 to 34 Years | 20 (6.1%) | 15 (5.8%) |
| 35 to 64 Years | 46 (4.1%) | 8 (0.7%) |
| 65 to 74 Years | 4 (1.0%) | 0 (0.0%) |
| 75 Years and over | 31 (15.9%) | 14 (7.8%) |
Disability Class: Ambulatory Difficulty
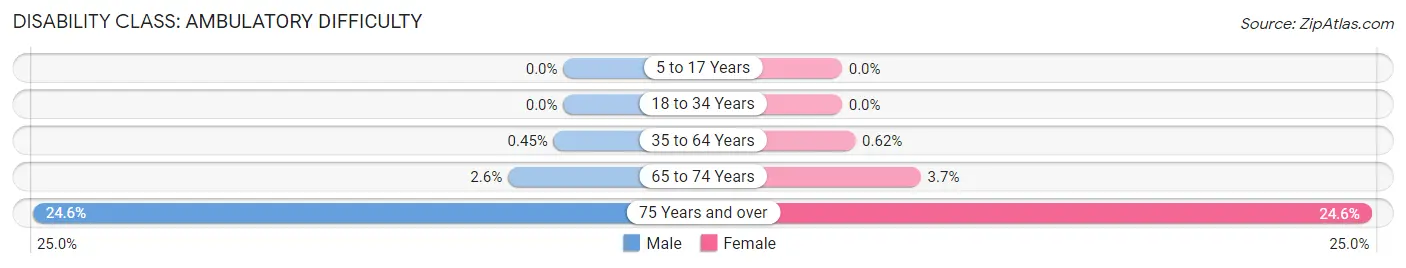
| Age Bracket | Male | Female |
| 5 to 17 Years | 0 (0.0%) | 0 (0.0%) |
| 18 to 34 Years | 0 (0.0%) | 0 (0.0%) |
| 35 to 64 Years | 5 (0.4%) | 7 (0.6%) |
| 65 to 74 Years | 10 (2.6%) | 13 (3.7%) |
| 75 Years and over | 48 (24.6%) | 44 (24.6%) |
Disability Class: Self-Care Difficulty
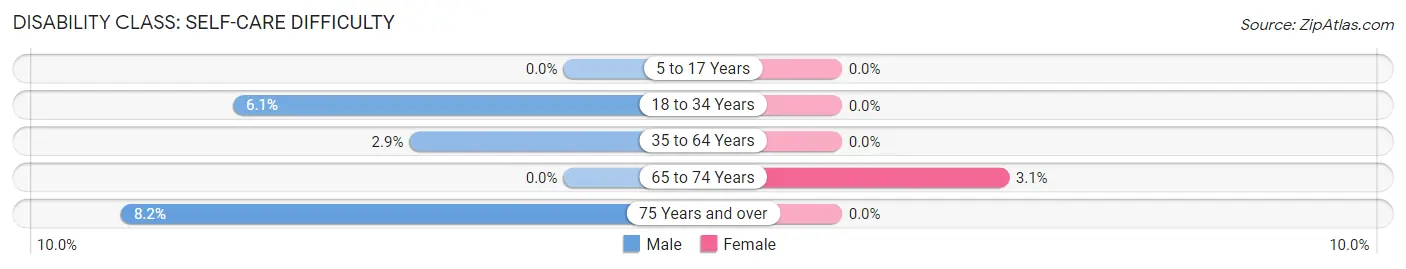
| Age Bracket | Male | Female |
| 5 to 17 Years | 0 (0.0%) | 0 (0.0%) |
| 18 to 34 Years | 20 (6.1%) | 0 (0.0%) |
| 35 to 64 Years | 32 (2.9%) | 0 (0.0%) |
| 65 to 74 Years | 0 (0.0%) | 11 (3.1%) |
| 75 Years and over | 16 (8.2%) | 0 (0.0%) |
Technology Access in Lake Wisconsin
Computing Device Access in Lake Wisconsin
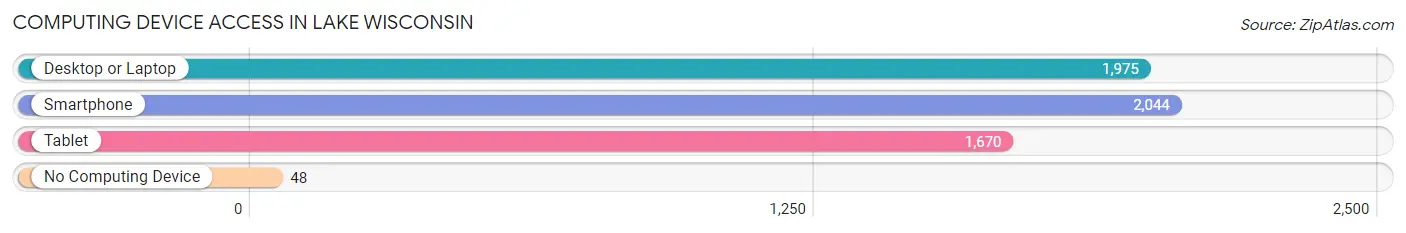
| Device Type | # Households | % Households |
| Desktop or Laptop | 1,975 | 89.0% |
| Smartphone | 2,044 | 92.1% |
| Tablet | 1,670 | 75.3% |
| No Computing Device | 48 | 2.2% |
| Total | 2,219 | 100.0% |
Internet Access in Lake Wisconsin
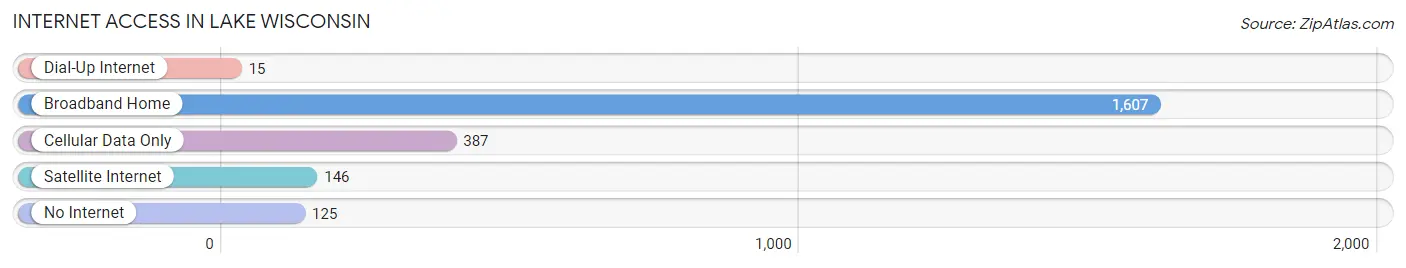
| Internet Type | # Households | % Households |
| Dial-Up Internet | 15 | 0.7% |
| Broadband Home | 1,607 | 72.4% |
| Cellular Data Only | 387 | 17.4% |
| Satellite Internet | 146 | 6.6% |
| No Internet | 125 | 5.6% |
| Total | 2,219 | 100.0% |
Lake Wisconsin Summary
Wisconsin is a state located in the Midwestern United States. It is bordered by Minnesota to the west, Iowa to the southwest, Illinois to the south, Lake Michigan to the east, and Lake Superior to the northeast. Wisconsin is the 23rd largest state in the United States, with an area of 65,498 square miles. It is the 20th most populous state, with a population of 5.8 million people.
Geography
Wisconsin is located in the north-central United States, in the Great Lakes region. It is bordered by Minnesota to the west, Iowa to the southwest, Illinois to the south, Lake Michigan to the east, and Lake Superior to the northeast. The state has a total area of 65,498 square miles, making it the 23rd largest state in the country. Wisconsin is divided into 72 counties and contains 19,000 lakes. The state is home to the Apostle Islands National Lakeshore, the Chequamegon-Nicolet National Forest, and the Kettle Moraine State Forest.
The geography of Wisconsin is varied, with rolling hills, forests, and lakes. The state is divided into two distinct regions: the Northern Highland and the Central Plain. The Northern Highland is a region of rugged hills and deep valleys, while the Central Plain is a region of flat, rolling terrain. The highest point in the state is Timms Hill, located in Price County, at an elevation of 1,951 feet. The lowest point is Lake Michigan, at an elevation of 577 feet.
Climate
Wisconsin has a humid continental climate, with cold winters and warm summers. The average temperature in the state ranges from a low of -2°F in January to a high of 85°F in July. The average annual precipitation in the state is 33 inches, with the most precipitation occurring in the summer months.
Demographics
As of the 2020 census, the population of Wisconsin was 5,822,434, making it the 20th most populous state in the country. The population is spread out across the state, with the largest cities being Milwaukee, Madison, Green Bay, Kenosha, Racine, and Appleton. The racial makeup of the state is 85.3% White, 6.7% Black or African American, 2.7% Asian, 0.7% Native American, and 4.6% from other races. The median household income in the state is $60,879, and the median age is 38.7 years.
Economy
Wisconsin has a diverse economy, with a mix of manufacturing, agriculture, and services. The state is home to several major companies, including Harley-Davidson, Johnson Controls, and Kohl’s. The state’s largest industries are manufacturing, agriculture, and tourism. Manufacturing is the largest sector of the state’s economy, accounting for nearly 20% of the state’s GDP. The state is also a major producer of dairy products, cranberries, and ginseng. Tourism is also a major industry in the state, with visitors spending over $20 billion annually.
History
Wisconsin was first inhabited by Native American tribes, including the Menominee, Ojibwe, Potawatomi, and Ho-Chunk. The first Europeans to explore the area were French fur traders, who arrived in the 17th century. The area was part of the French colony of New France until 1763, when it was ceded to Great Britain. In 1783, the area was ceded to the United States as part of the Treaty of Paris. The area was part of the Northwest Territory until 1818, when it became part of the Michigan Territory. In 1836, the Wisconsin Territory was created, and in 1848, it became the 30th state in the Union.
Wisconsin has a long history of political and social activism. In the 19th century, the state was a major center of the abolitionist movement. In the 20th century, the state was a major center of the labor movement, and it was the first state to ratify the 19th Amendment, which granted women the right to vote. Wisconsin has also been a leader in environmental protection, with the state passing the first comprehensive environmental protection law in the United States in 1971.
Common Questions
What is Per Capita Income in Lake Wisconsin?
Per Capita income in Lake Wisconsin is $60,434.
What is the Median Family Income in Lake Wisconsin?
Median Family Income in Lake Wisconsin is $136,932.
What is the Median Household income in Lake Wisconsin?
Median Household Income in Lake Wisconsin is $114,241.
What is Income or Wage Gap in Lake Wisconsin?
Income or Wage Gap in Lake Wisconsin is 19.6%.
Women in Lake Wisconsin earn 80.4 cents for every dollar earned by a man.
What is Inequality or Gini Index in Lake Wisconsin?
Inequality or Gini Index in Lake Wisconsin is 0.40.
What is the Total Population of Lake Wisconsin?
Total Population of Lake Wisconsin is 4,886.
What is the Total Male Population of Lake Wisconsin?
Total Male Population of Lake Wisconsin is 2,585.
What is the Total Female Population of Lake Wisconsin?
Total Female Population of Lake Wisconsin is 2,301.
What is the Ratio of Males per 100 Females in Lake Wisconsin?
There are 112.34 Males per 100 Females in Lake Wisconsin.
What is the Ratio of Females per 100 Males in Lake Wisconsin?
There are 89.01 Females per 100 Males in Lake Wisconsin.
What is the Median Population Age in Lake Wisconsin?
Median Population Age in Lake Wisconsin is 51.7 Years.
What is the Average Family Size in Lake Wisconsin
Average Family Size in Lake Wisconsin is 2.6 People.
What is the Average Household Size in Lake Wisconsin
Average Household Size in Lake Wisconsin is 2.2 People.
How Large is the Labor Force in Lake Wisconsin?
There are 2,438 People in the Labor Forcein in Lake Wisconsin.
What is the Percentage of People in the Labor Force in Lake Wisconsin?
59.2% of People are in the Labor Force in Lake Wisconsin.
What is the Unemployment Rate in Lake Wisconsin?
Unemployment Rate in Lake Wisconsin is 1.9%.