Clintonville, WI Map & Demographics
Clintonville Map
Clintonville Overview
$33,646
PER CAPITA INCOME
$71,339
AVG FAMILY INCOME
$58,377
AVG HOUSEHOLD INCOME
39.8%
WAGE / INCOME GAP [ % ]
60.2¢/ $1
WAGE / INCOME GAP [ $ ]
0.38
INEQUALITY / GINI INDEX
4,549
TOTAL POPULATION
2,265
MALE POPULATION
2,284
FEMALE POPULATION
99.17
MALES / 100 FEMALES
100.84
FEMALES / 100 MALES
38.8
MEDIAN AGE
2.7
AVG FAMILY SIZE
2.1
AVG HOUSEHOLD SIZE
2,489
LABOR FORCE [ PEOPLE ]
63.3%
PERCENT IN LABOR FORCE
3.3%
UNEMPLOYMENT RATE
Clintonville Zip Codes
Clintonville Area Codes
Income in Clintonville
Income Overview in Clintonville
Per Capita Income in Clintonville is $33,646, while median incomes of families and households are $71,339 and $58,377 respectively.
| Characteristic | Number | Measure |
| Per Capita Income | 4,549 | $33,646 |
| Median Family Income | 1,229 | $71,339 |
| Mean Family Income | 1,229 | $84,317 |
| Median Household Income | 2,100 | $58,377 |
| Mean Household Income | 2,100 | $67,944 |
| Income Deficit | 1,229 | $0 |
| Wage / Income Gap (%) | 4,549 | 39.84% |
| Wage / Income Gap ($) | 4,549 | 60.16¢ per $1 |
| Gini / Inequality Index | 4,549 | 0.38 |
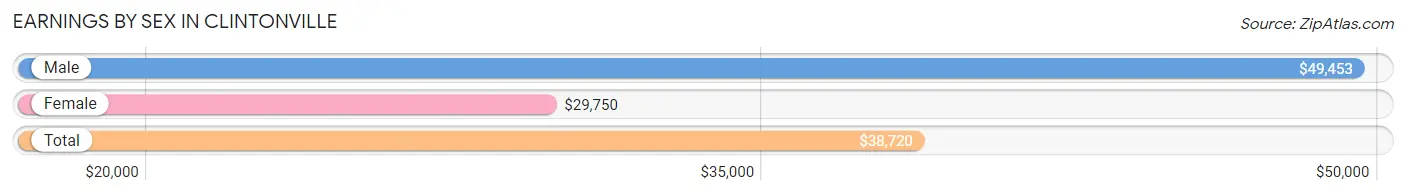
Earnings by Sex in Clintonville
Average Earnings in Clintonville are $38,720, $49,453 for men and $29,750 for women, a difference of 39.8%.
| Sex | Number | Average Earnings |
| Male | 1,574 (57.2%) | $49,453 |
| Female | 1,179 (42.8%) | $29,750 |
| Total | 2,753 (100.0%) | $38,720 |
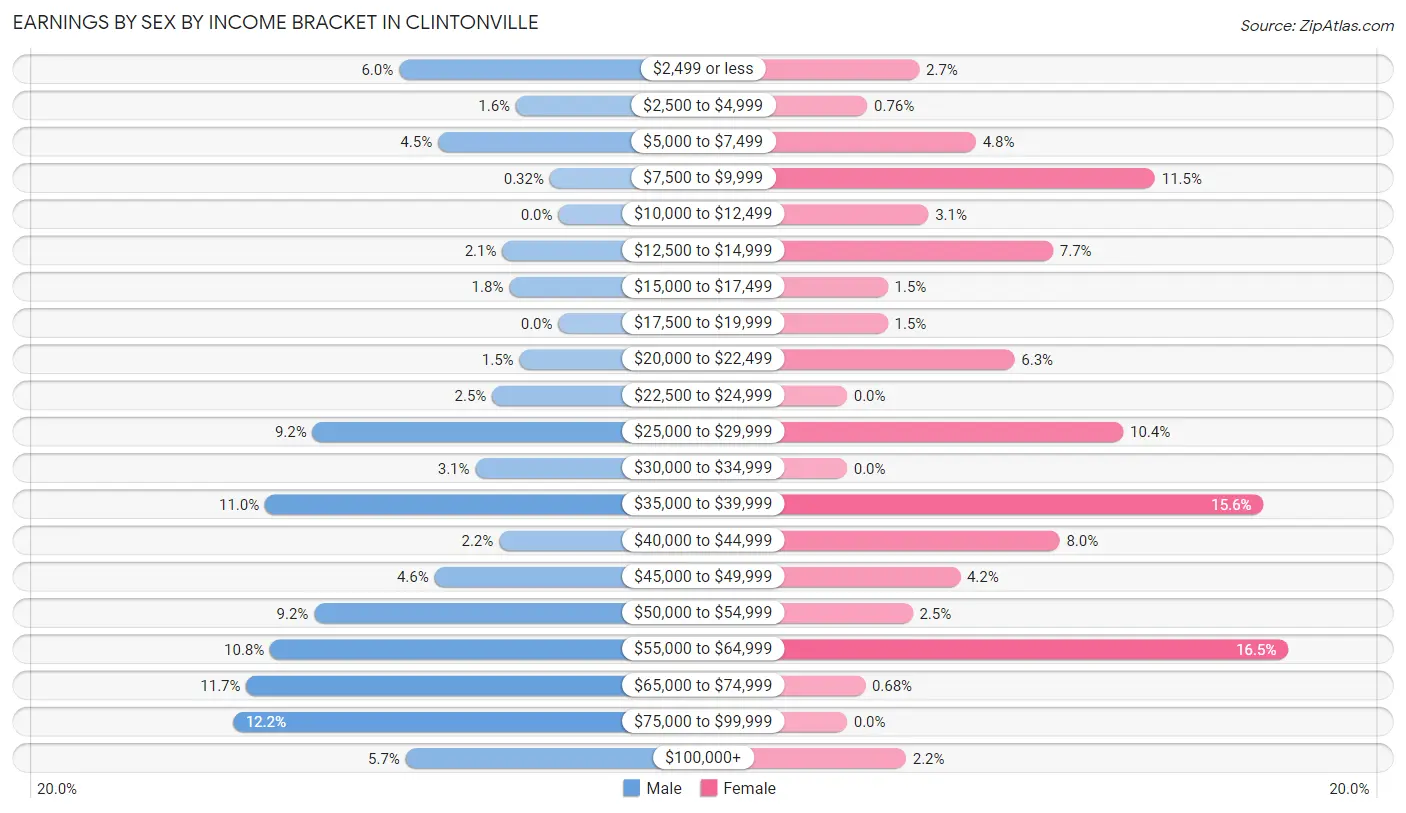
Earnings by Sex by Income Bracket in Clintonville
The most common earnings brackets in Clintonville are $75,000 to $99,999 for men (192 | 12.2%) and $55,000 to $64,999 for women (195 | 16.5%).
| Income | Male | Female |
| $2,499 or less | 94 (6.0%) | 32 (2.7%) |
| $2,500 to $4,999 | 25 (1.6%) | 9 (0.8%) |
| $5,000 to $7,499 | 71 (4.5%) | 57 (4.8%) |
| $7,500 to $9,999 | 5 (0.3%) | 136 (11.5%) |
| $10,000 to $12,499 | 0 (0.0%) | 36 (3.0%) |
| $12,500 to $14,999 | 33 (2.1%) | 91 (7.7%) |
| $15,000 to $17,499 | 29 (1.8%) | 18 (1.5%) |
| $17,500 to $19,999 | 0 (0.0%) | 18 (1.5%) |
| $20,000 to $22,499 | 23 (1.5%) | 74 (6.3%) |
| $22,500 to $24,999 | 39 (2.5%) | 0 (0.0%) |
| $25,000 to $29,999 | 145 (9.2%) | 122 (10.3%) |
| $30,000 to $34,999 | 49 (3.1%) | 0 (0.0%) |
| $35,000 to $39,999 | 173 (11.0%) | 184 (15.6%) |
| $40,000 to $44,999 | 35 (2.2%) | 94 (8.0%) |
| $45,000 to $49,999 | 73 (4.6%) | 50 (4.2%) |
| $50,000 to $54,999 | 144 (9.1%) | 29 (2.5%) |
| $55,000 to $64,999 | 170 (10.8%) | 195 (16.5%) |
| $65,000 to $74,999 | 184 (11.7%) | 8 (0.7%) |
| $75,000 to $99,999 | 192 (12.2%) | 0 (0.0%) |
| $100,000+ | 90 (5.7%) | 26 (2.2%) |
| Total | 1,574 (100.0%) | 1,179 (100.0%) |
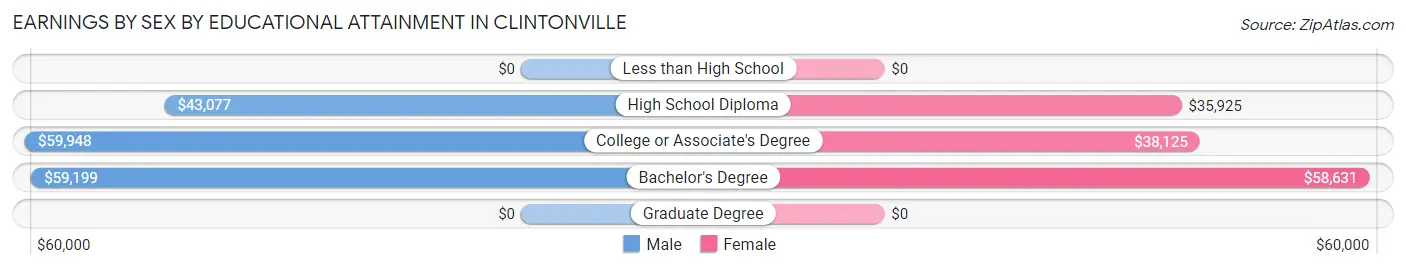
Earnings by Sex by Educational Attainment in Clintonville
Average earnings in Clintonville are $53,513 for men and $37,692 for women, a difference of 29.6%. Men with an educational attainment of college or associate's degree enjoy the highest average annual earnings of $59,948, while those with high school diploma education earn the least with $43,077. Women with an educational attainment of bachelor's degree earn the most with the average annual earnings of $58,631, while those with high school diploma education have the smallest earnings of $35,925.
| Educational Attainment | Male Income | Female Income |
| Less than High School | - | - |
| High School Diploma | $43,077 | $35,925 |
| College or Associate's Degree | $59,948 | $38,125 |
| Bachelor's Degree | $59,199 | $58,631 |
| Graduate Degree | - | - |
| Total | $53,513 | $37,692 |
Family Income in Clintonville
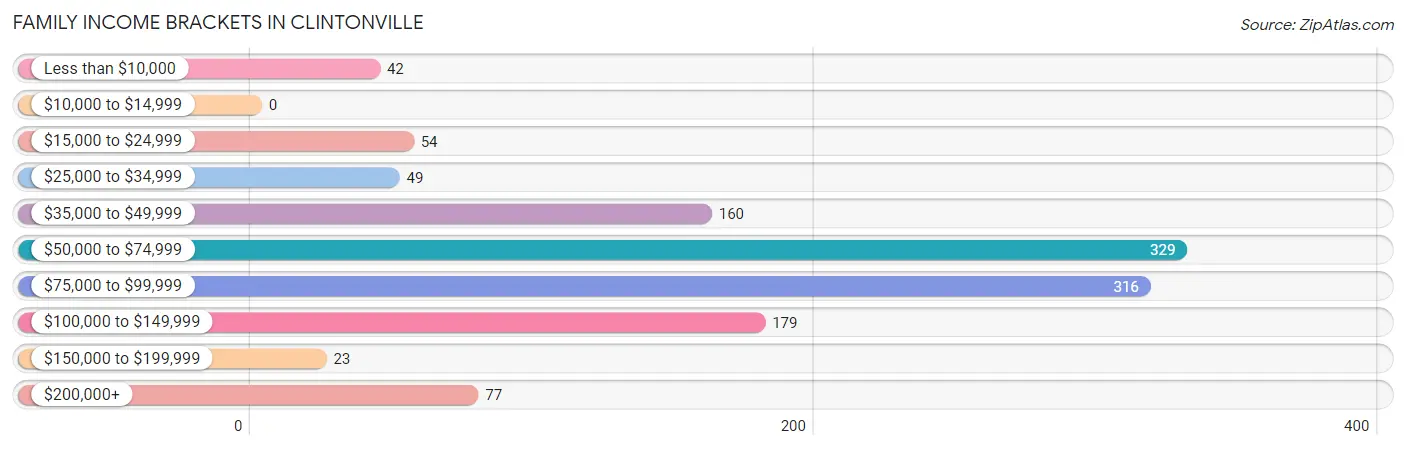
Family Income Brackets in Clintonville
According to the Clintonville family income data, there are 329 families falling into the $50,000 to $74,999 income range, which is the most common income bracket and makes up 26.8% of all families.
| Income Bracket | # Families | % Families |
| Less than $10,000 | 42 | 3.4% |
| $10,000 to $14,999 | 0 | 0.0% |
| $15,000 to $24,999 | 54 | 4.4% |
| $25,000 to $34,999 | 49 | 4.0% |
| $35,000 to $49,999 | 160 | 13.0% |
| $50,000 to $74,999 | 329 | 26.8% |
| $75,000 to $99,999 | 316 | 25.7% |
| $100,000 to $149,999 | 179 | 14.6% |
| $150,000 to $199,999 | 23 | 1.9% |
| $200,000+ | 77 | 6.3% |
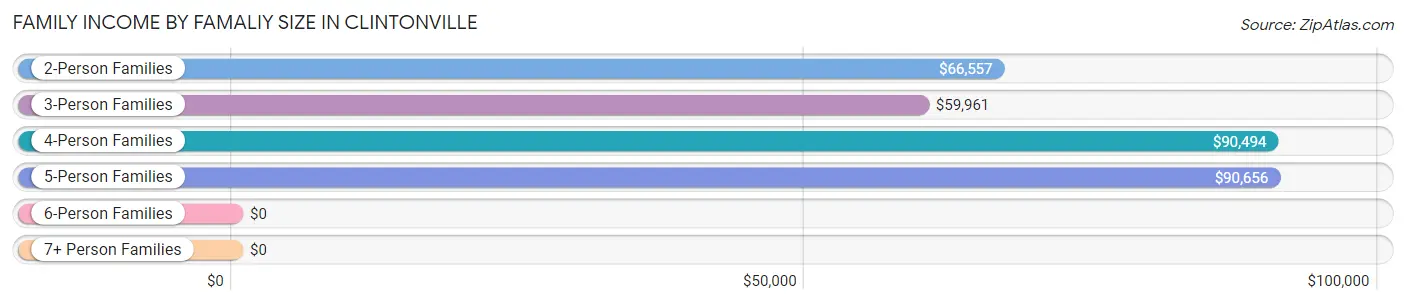
Family Income by Famaliy Size in Clintonville
5-person families (97 | 7.9%) account for the highest median family income in Clintonville with $90,656 per family, while 2-person families (684 | 55.7%) have the highest median income of $33,278 per family member.
| Income Bracket | # Families | Median Income |
| 2-Person Families | 684 (55.7%) | $66,557 |
| 3-Person Families | 324 (26.4%) | $59,961 |
| 4-Person Families | 101 (8.2%) | $90,494 |
| 5-Person Families | 97 (7.9%) | $90,656 |
| 6-Person Families | 23 (1.9%) | $0 |
| 7+ Person Families | 0 (0.0%) | $0 |
| Total | 1,229 (100.0%) | $71,339 |
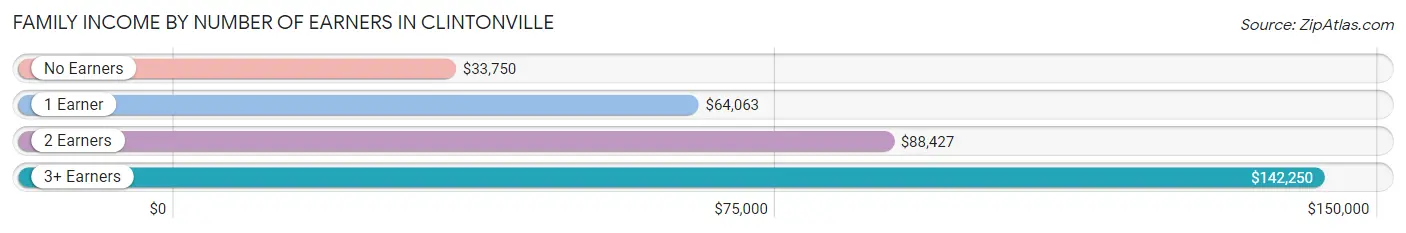
Family Income by Number of Earners in Clintonville
The median family income in Clintonville is $71,339, with families comprising 3+ earners (132) having the highest median family income of $142,250, while families with no earners (167) have the lowest median family income of $33,750, accounting for 10.7% and 13.6% of families, respectively.
| Number of Earners | # Families | Median Income |
| No Earners | 167 (13.6%) | $33,750 |
| 1 Earner | 400 (32.6%) | $64,063 |
| 2 Earners | 530 (43.1%) | $88,427 |
| 3+ Earners | 132 (10.7%) | $142,250 |
| Total | 1,229 (100.0%) | $71,339 |
Household Income in Clintonville
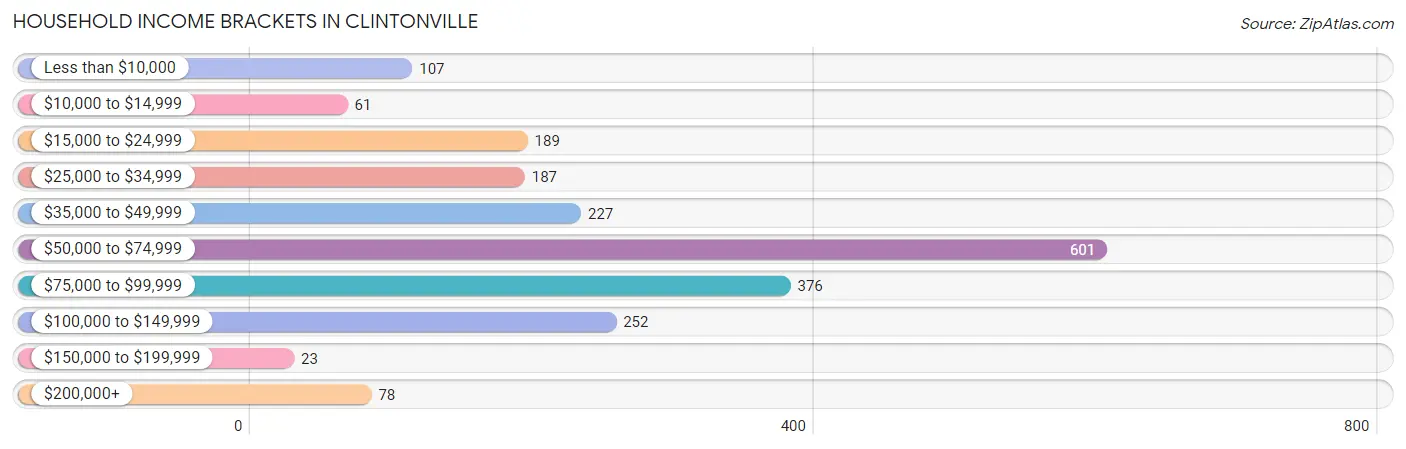
Household Income Brackets in Clintonville
With 601 households falling in the category, the $50,000 to $74,999 income range is the most frequent in Clintonville, accounting for 28.6% of all households. In contrast, only 23 households (1.1%) fall into the $150,000 to $199,999 income bracket, making it the least populous group.
| Income Bracket | # Households | % Households |
| Less than $10,000 | 107 | 5.1% |
| $10,000 to $14,999 | 61 | 2.9% |
| $15,000 to $24,999 | 189 | 9.0% |
| $25,000 to $34,999 | 187 | 8.9% |
| $35,000 to $49,999 | 227 | 10.8% |
| $50,000 to $74,999 | 601 | 28.6% |
| $75,000 to $99,999 | 376 | 17.9% |
| $100,000 to $149,999 | 252 | 12.0% |
| $150,000 to $199,999 | 23 | 1.1% |
| $200,000+ | 78 | 3.7% |
Household Income by Householder Age in Clintonville
The median household income in Clintonville is $58,377, with the highest median household income of $83,045 found in the 45 to 64 years age bracket for the primary householder. A total of 648 households (30.9%) fall into this category. Meanwhile, the 15 to 24 years age bracket for the primary householder has the lowest median household income of $0, with 200 households (9.5%) in this group.
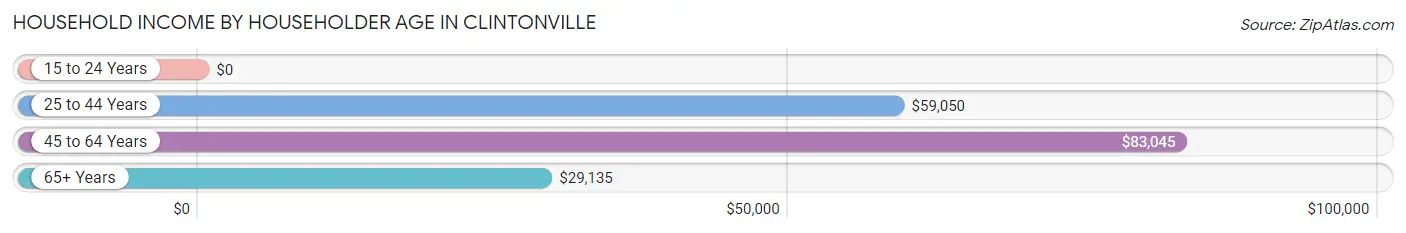
| Income Bracket | # Households | Median Income |
| 15 to 24 Years | 200 (9.5%) | $0 |
| 25 to 44 Years | 713 (34.0%) | $59,050 |
| 45 to 64 Years | 648 (30.9%) | $83,045 |
| 65+ Years | 539 (25.7%) | $29,135 |
| Total | 2,100 (100.0%) | $58,377 |
Poverty in Clintonville
Income Below Poverty by Sex and Age in Clintonville
With 7.1% poverty level for males and 10.1% for females among the residents of Clintonville, 65 to 74 year old males and 16 and 17 year old females are the most vulnerable to poverty, with 38 males (21.7%) and 22 females (71.0%) in their respective age groups living below the poverty level.
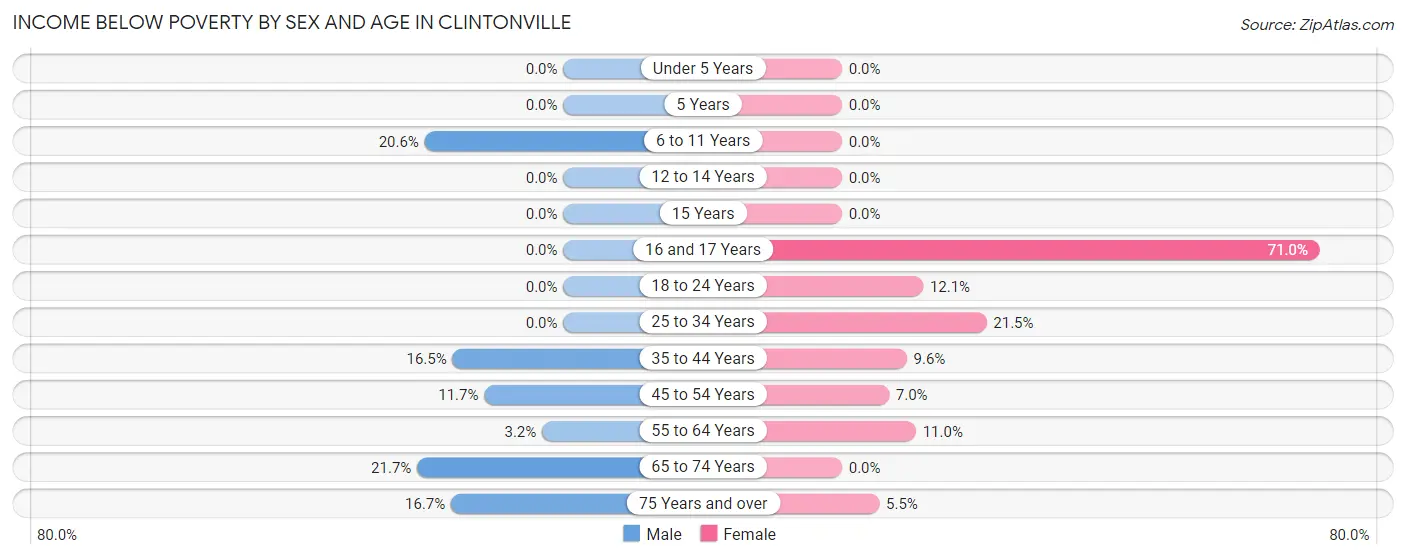
| Age Bracket | Male | Female |
| Under 5 Years | 0 (0.0%) | 0 (0.0%) |
| 5 Years | 0 (0.0%) | 0 (0.0%) |
| 6 to 11 Years | 21 (20.6%) | 0 (0.0%) |
| 12 to 14 Years | 0 (0.0%) | 0 (0.0%) |
| 15 Years | 0 (0.0%) | 0 (0.0%) |
| 16 and 17 Years | 0 (0.0%) | 22 (71.0%) |
| 18 to 24 Years | 0 (0.0%) | 40 (12.0%) |
| 25 to 34 Years | 0 (0.0%) | 79 (21.5%) |
| 35 to 44 Years | 38 (16.5%) | 25 (9.6%) |
| 45 to 54 Years | 31 (11.7%) | 19 (7.0%) |
| 55 to 64 Years | 14 (3.2%) | 27 (11.0%) |
| 65 to 74 Years | 38 (21.7%) | 0 (0.0%) |
| 75 Years and over | 16 (16.7%) | 17 (5.5%) |
| Total | 158 (7.1%) | 229 (10.1%) |
Income Above Poverty by Sex and Age in Clintonville
According to the poverty statistics in Clintonville, males aged under 5 years and females aged under 5 years are the age groups that are most secure financially, with 100.0% of males and 100.0% of females in these age groups living above the poverty line.
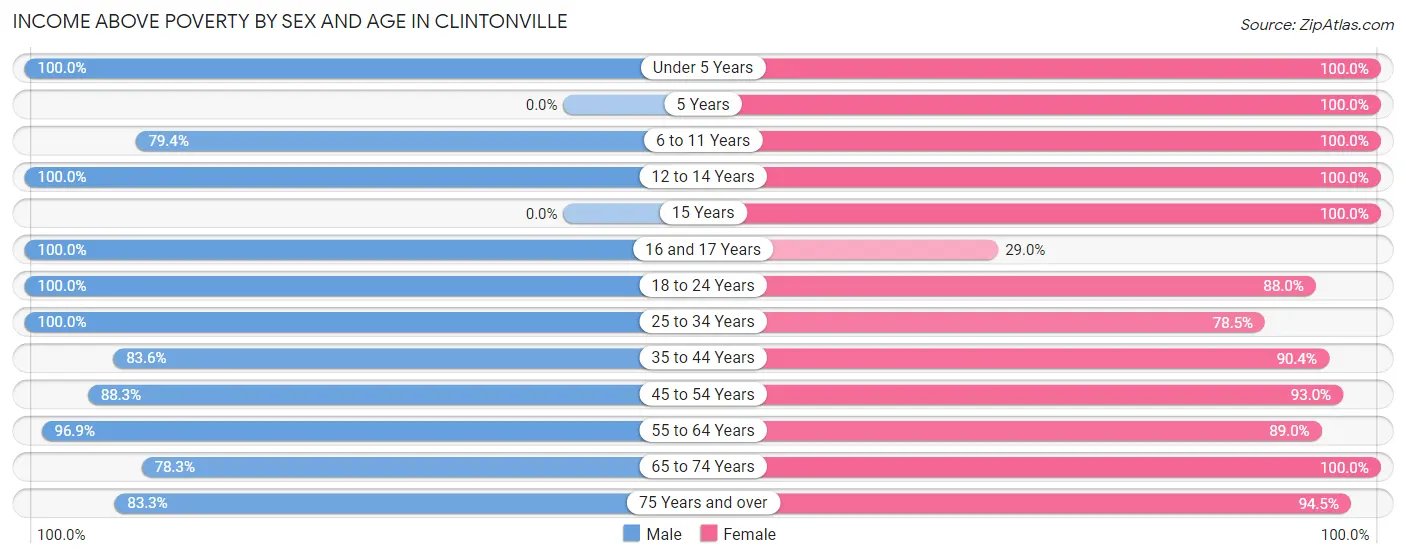
| Age Bracket | Male | Female |
| Under 5 Years | 188 (100.0%) | 70 (100.0%) |
| 5 Years | 0 (0.0%) | 68 (100.0%) |
| 6 to 11 Years | 81 (79.4%) | 61 (100.0%) |
| 12 to 14 Years | 26 (100.0%) | 48 (100.0%) |
| 15 Years | 0 (0.0%) | 54 (100.0%) |
| 16 and 17 Years | 92 (100.0%) | 9 (29.0%) |
| 18 to 24 Years | 118 (100.0%) | 292 (87.9%) |
| 25 to 34 Years | 499 (100.0%) | 289 (78.5%) |
| 35 to 44 Years | 193 (83.6%) | 235 (90.4%) |
| 45 to 54 Years | 233 (88.3%) | 253 (93.0%) |
| 55 to 64 Years | 430 (96.9%) | 219 (89.0%) |
| 65 to 74 Years | 137 (78.3%) | 158 (100.0%) |
| 75 Years and over | 80 (83.3%) | 290 (94.5%) |
| Total | 2,077 (92.9%) | 2,046 (89.9%) |
Income Below Poverty Among Married-Couple Families in Clintonville
The poverty statistics for married-couple families in Clintonville show that 3.0% or 25 of the total 846 families live below the poverty line. Families with 1 or 2 children have the highest poverty rate of 12.4%, comprising of 25 families. On the other hand, families with no children have the lowest poverty rate of 0.0%, which includes 0 families.
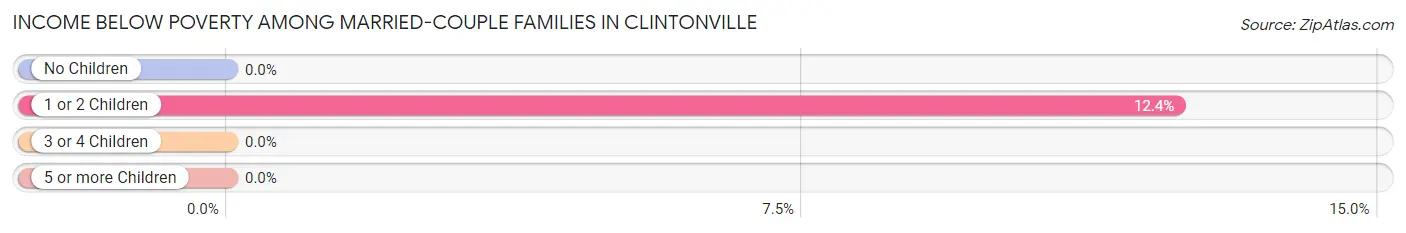
| Children | Above Poverty | Below Poverty |
| No Children | 566 (100.0%) | 0 (0.0%) |
| 1 or 2 Children | 177 (87.6%) | 25 (12.4%) |
| 3 or 4 Children | 78 (100.0%) | 0 (0.0%) |
| 5 or more Children | 0 (0.0%) | 0 (0.0%) |
| Total | 821 (97.0%) | 25 (3.0%) |
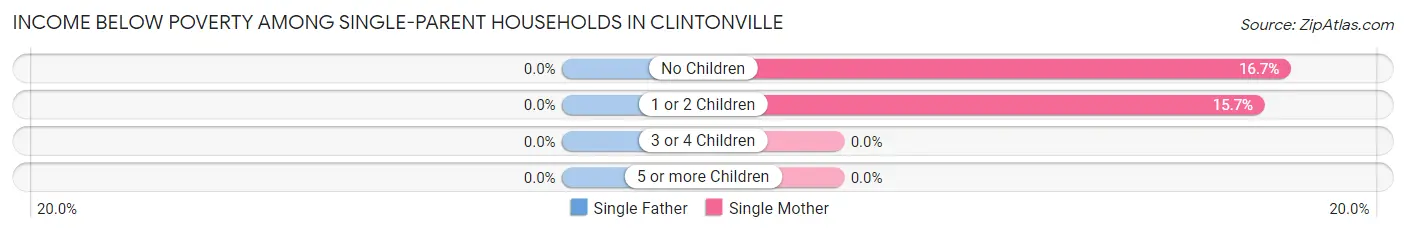
Income Below Poverty Among Single-Parent Households in Clintonville
| Children | Single Father | Single Mother |
| No Children | 0 (0.0%) | 18 (16.7%) |
| 1 or 2 Children | 0 (0.0%) | 24 (15.7%) |
| 3 or 4 Children | 0 (0.0%) | 0 (0.0%) |
| 5 or more Children | 0 (0.0%) | 0 (0.0%) |
| Total | 0 (0.0%) | 42 (16.1%) |
Income Below Poverty Among Married-Couple vs Single-Parent Households in Clintonville
The poverty data for Clintonville shows that 25 of the married-couple family households (3.0%) and 42 of the single-parent households (11.0%) are living below the poverty level. Within the married-couple family households, those with 1 or 2 children have the highest poverty rate, with 25 households (12.4%) falling below the poverty line. Among the single-parent households, those with no children have the highest poverty rate, with 18 household (12.4%) living below poverty.
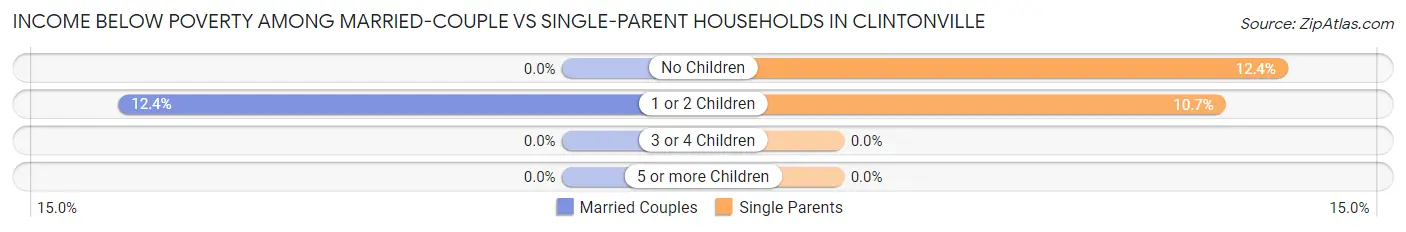
| Children | Married-Couple Families | Single-Parent Households |
| No Children | 0 (0.0%) | 18 (12.4%) |
| 1 or 2 Children | 25 (12.4%) | 24 (10.7%) |
| 3 or 4 Children | 0 (0.0%) | 0 (0.0%) |
| 5 or more Children | 0 (0.0%) | 0 (0.0%) |
| Total | 25 (3.0%) | 42 (11.0%) |
Race in Clintonville
The most populous races in Clintonville are White / Caucasian (4,213 | 92.6%), Hispanic or Latino (200 | 4.4%), and Some other Race (144 | 3.2%).
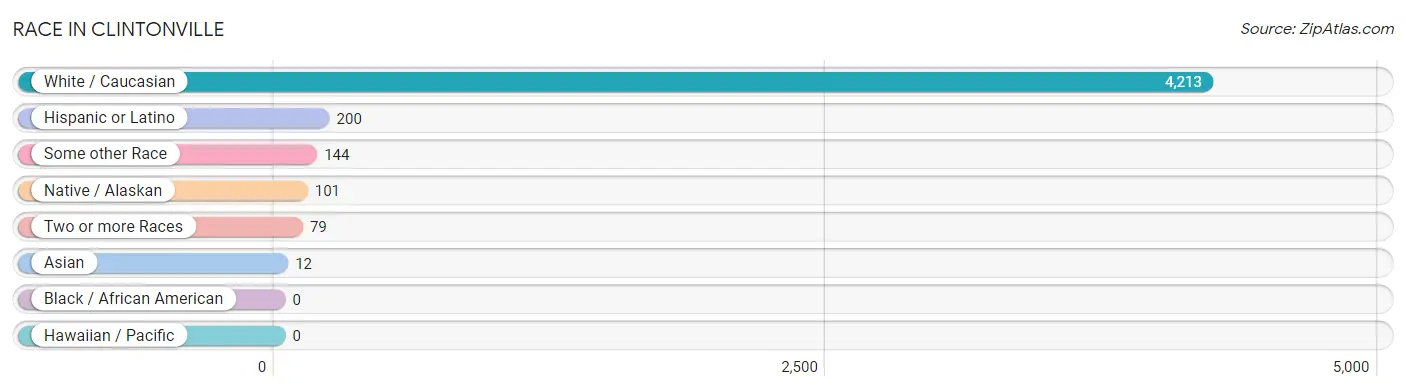
| Race | # Population | % Population |
| Asian | 12 | 0.3% |
| Black / African American | 0 | 0.0% |
| Hawaiian / Pacific | 0 | 0.0% |
| Hispanic or Latino | 200 | 4.4% |
| Native / Alaskan | 101 | 2.2% |
| White / Caucasian | 4,213 | 92.6% |
| Two or more Races | 79 | 1.7% |
| Some other Race | 144 | 3.2% |
| Total | 4,549 | 100.0% |
Ancestry in Clintonville
The most populous ancestries reported in Clintonville are German (2,161 | 47.5%), Irish (419 | 9.2%), Italian (266 | 5.9%), American (238 | 5.2%), and English (222 | 4.9%), together accounting for 72.7% of all Clintonville residents.
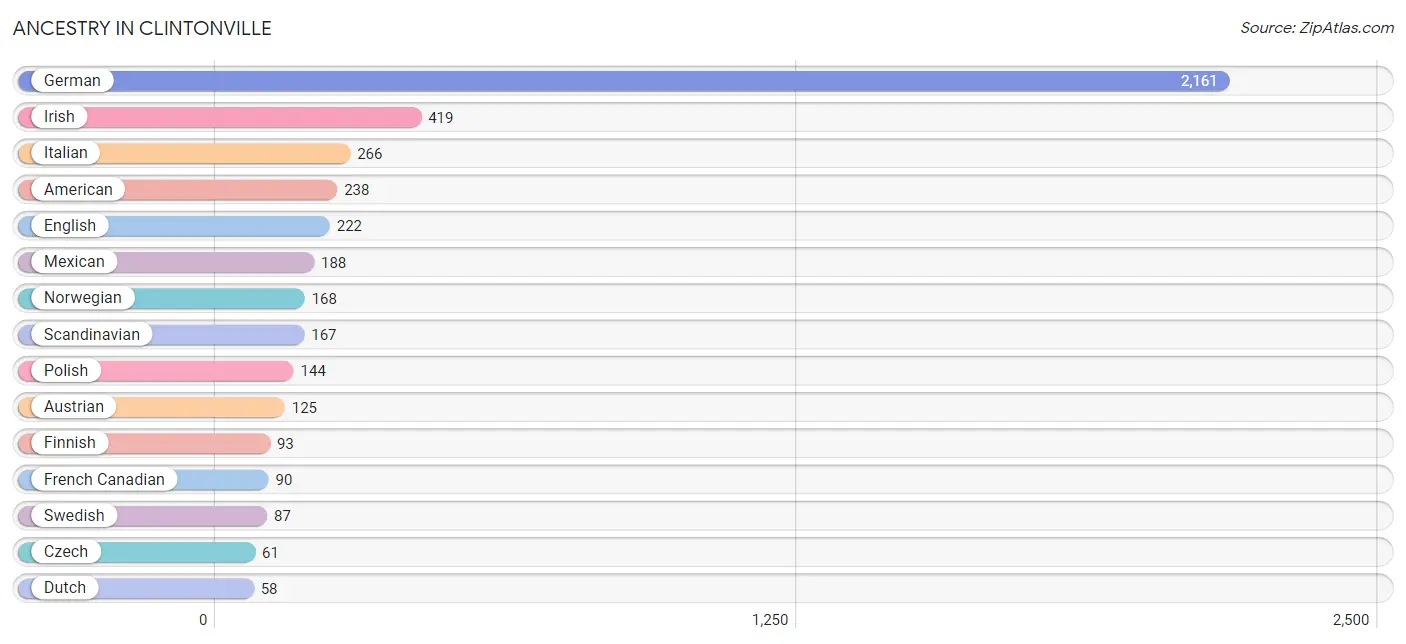
| Ancestry | # Population | % Population |
| American | 238 | 5.2% |
| Armenian | 24 | 0.5% |
| Austrian | 125 | 2.8% |
| Belgian | 20 | 0.4% |
| British | 25 | 0.5% |
| Canadian | 15 | 0.3% |
| Czech | 61 | 1.3% |
| Danish | 24 | 0.5% |
| Dutch | 58 | 1.3% |
| Eastern European | 29 | 0.6% |
| English | 222 | 4.9% |
| European | 51 | 1.1% |
| Finnish | 93 | 2.0% |
| French | 49 | 1.1% |
| French Canadian | 90 | 2.0% |
| German | 2,161 | 47.5% |
| Irish | 419 | 9.2% |
| Iroquois | 56 | 1.2% |
| Italian | 266 | 5.9% |
| Korean | 12 | 0.3% |
| Lithuanian | 36 | 0.8% |
| Luxembourger | 18 | 0.4% |
| Malaysian | 24 | 0.5% |
| Menominee | 31 | 0.7% |
| Mexican | 188 | 4.1% |
| Norwegian | 168 | 3.7% |
| Polish | 144 | 3.2% |
| Russian | 54 | 1.2% |
| Scandinavian | 167 | 3.7% |
| Scottish | 26 | 0.6% |
| Spaniard | 12 | 0.3% |
| Swedish | 87 | 1.9% |
| Swiss | 50 | 1.1% | View All 33 Rows |
Immigrants in Clintonville
The most numerous immigrant groups reported in Clintonville came from Central America (90 | 2.0%), Latin America (90 | 2.0%), Mexico (90 | 2.0%), Europe (19 | 0.4%), and Italy (19 | 0.4%), together accounting for 6.8% of all Clintonville residents.
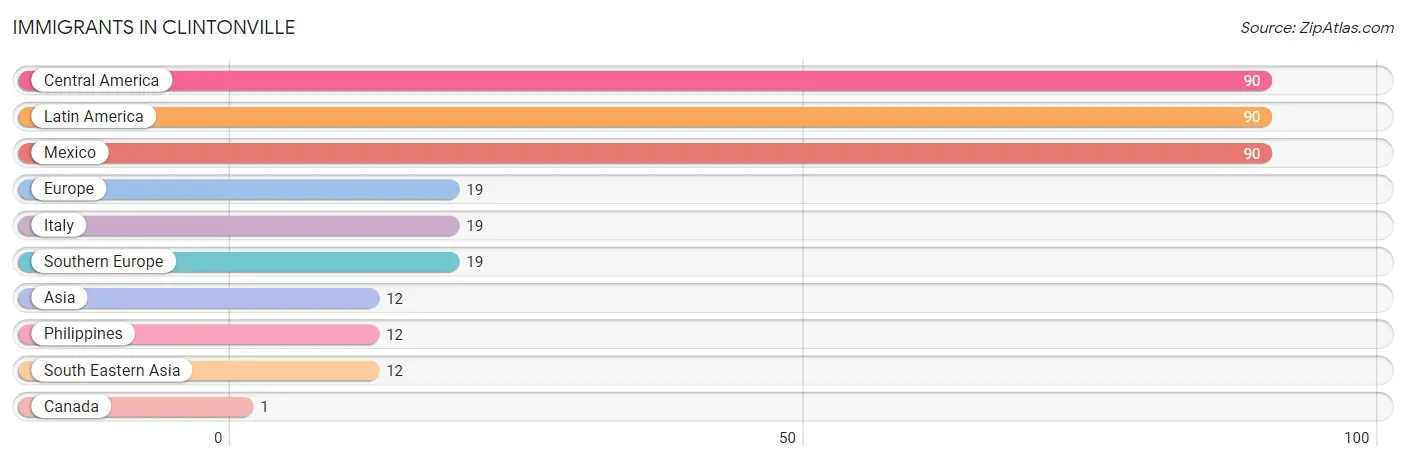
| Immigration Origin | # Population | % Population |
| Asia | 12 | 0.3% |
| Canada | 1 | 0.0% |
| Central America | 90 | 2.0% |
| Europe | 19 | 0.4% |
| Italy | 19 | 0.4% |
| Latin America | 90 | 2.0% |
| Mexico | 90 | 2.0% |
| Philippines | 12 | 0.3% |
| South Eastern Asia | 12 | 0.3% |
| Southern Europe | 19 | 0.4% | View All 10 Rows |
Sex and Age in Clintonville
Sex and Age in Clintonville
The most populous age groups in Clintonville are 25 to 29 Years (345 | 15.2%) for men and 25 to 29 Years (250 | 11.0%) for women.
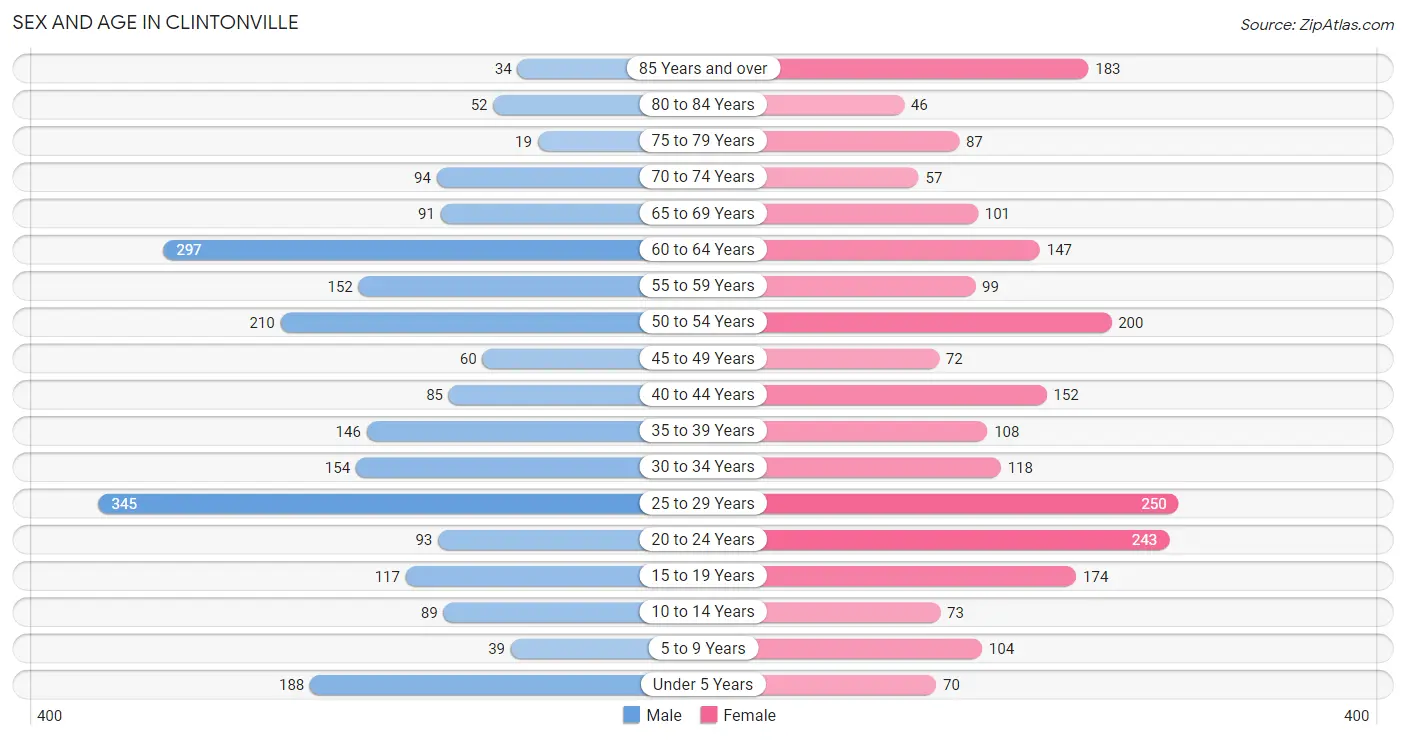
| Age Bracket | Male | Female |
| Under 5 Years | 188 (8.3%) | 70 (3.1%) |
| 5 to 9 Years | 39 (1.7%) | 104 (4.5%) |
| 10 to 14 Years | 89 (3.9%) | 73 (3.2%) |
| 15 to 19 Years | 117 (5.2%) | 174 (7.6%) |
| 20 to 24 Years | 93 (4.1%) | 243 (10.6%) |
| 25 to 29 Years | 345 (15.2%) | 250 (11.0%) |
| 30 to 34 Years | 154 (6.8%) | 118 (5.2%) |
| 35 to 39 Years | 146 (6.5%) | 108 (4.7%) |
| 40 to 44 Years | 85 (3.7%) | 152 (6.7%) |
| 45 to 49 Years | 60 (2.6%) | 72 (3.2%) |
| 50 to 54 Years | 210 (9.3%) | 200 (8.8%) |
| 55 to 59 Years | 152 (6.7%) | 99 (4.3%) |
| 60 to 64 Years | 297 (13.1%) | 147 (6.4%) |
| 65 to 69 Years | 91 (4.0%) | 101 (4.4%) |
| 70 to 74 Years | 94 (4.2%) | 57 (2.5%) |
| 75 to 79 Years | 19 (0.8%) | 87 (3.8%) |
| 80 to 84 Years | 52 (2.3%) | 46 (2.0%) |
| 85 Years and over | 34 (1.5%) | 183 (8.0%) |
| Total | 2,265 (100.0%) | 2,284 (100.0%) |
Families and Households in Clintonville
Median Family Size in Clintonville
The median family size in Clintonville is 2.69 persons per family, with married-couple families (846 | 68.8%) accounting for the largest median family size of 2.8 persons per family. On the other hand, single male/father families (122 | 9.9%) represent the smallest median family size with 2.43 persons per family.
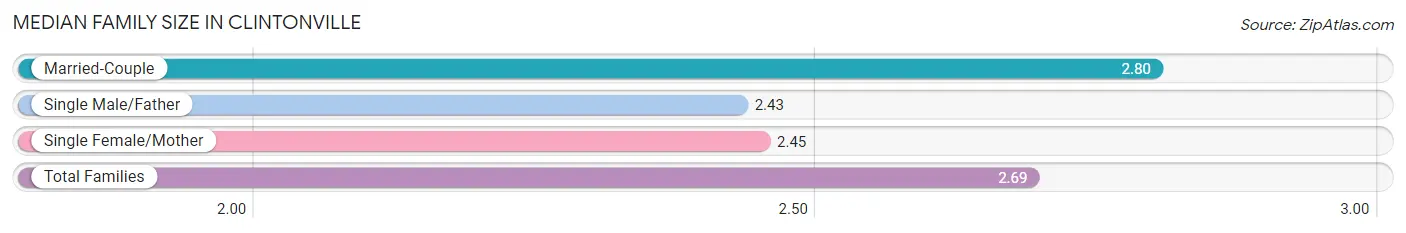
| Family Type | # Families | Family Size |
| Married-Couple | 846 (68.8%) | 2.80 |
| Single Male/Father | 122 (9.9%) | 2.43 |
| Single Female/Mother | 261 (21.2%) | 2.45 |
| Total Families | 1,229 (100.0%) | 2.69 |
Median Household Size in Clintonville
The median household size in Clintonville is 2.13 persons per household, with single male/father households (122 | 5.8%) accounting for the largest median household size of 2.97 persons per household. non-family households (871 | 41.5%) represent the smallest median household size with 1.11 persons per household.
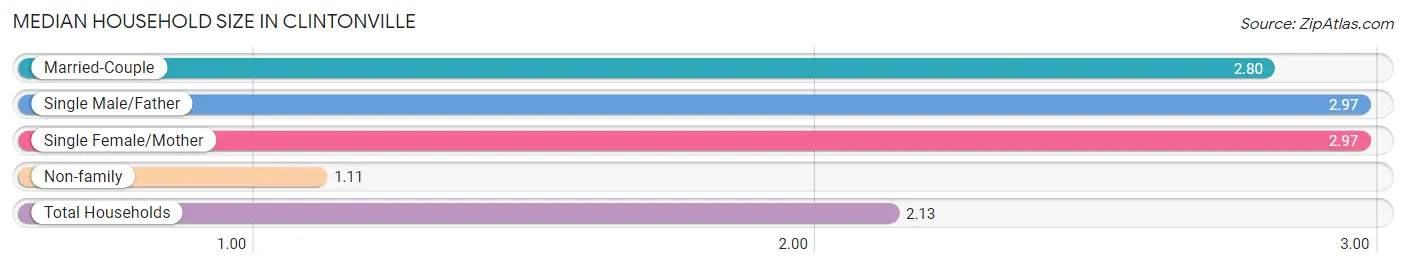
| Household Type | # Households | Household Size |
| Married-Couple | 846 (40.3%) | 2.80 |
| Single Male/Father | 122 (5.8%) | 2.97 |
| Single Female/Mother | 261 (12.4%) | 2.97 |
| Non-family | 871 (41.5%) | 1.11 |
| Total Households | 2,100 (100.0%) | 2.13 |
Household Size by Marriage Status in Clintonville
Out of a total of 2,100 households in Clintonville, 1,229 (58.5%) are family households, while 871 (41.5%) are nonfamily households. The most numerous type of family households are 2-person households, comprising 593, and the most common type of nonfamily households are 1-person households, comprising 743.
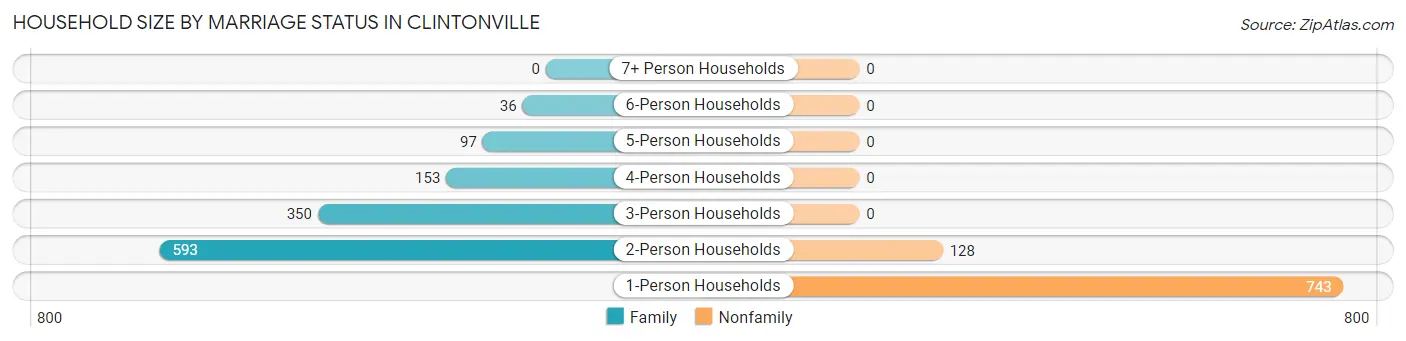
| Household Size | Family Households | Nonfamily Households |
| 1-Person Households | - | 743 (35.4%) |
| 2-Person Households | 593 (28.2%) | 128 (6.1%) |
| 3-Person Households | 350 (16.7%) | 0 (0.0%) |
| 4-Person Households | 153 (7.3%) | 0 (0.0%) |
| 5-Person Households | 97 (4.6%) | 0 (0.0%) |
| 6-Person Households | 36 (1.7%) | 0 (0.0%) |
| 7+ Person Households | 0 (0.0%) | 0 (0.0%) |
| Total | 1,229 (58.5%) | 871 (41.5%) |
Female Fertility in Clintonville
Fertility by Age in Clintonville
Average fertility rate in Clintonville is 54.0 births per 1,000 women. Women in the age bracket of 20 to 34 years have the highest fertility rate with 106.0 births per 1,000 women. Women in the age bracket of 20 to 34 years acount for 100.0% of all women with births.
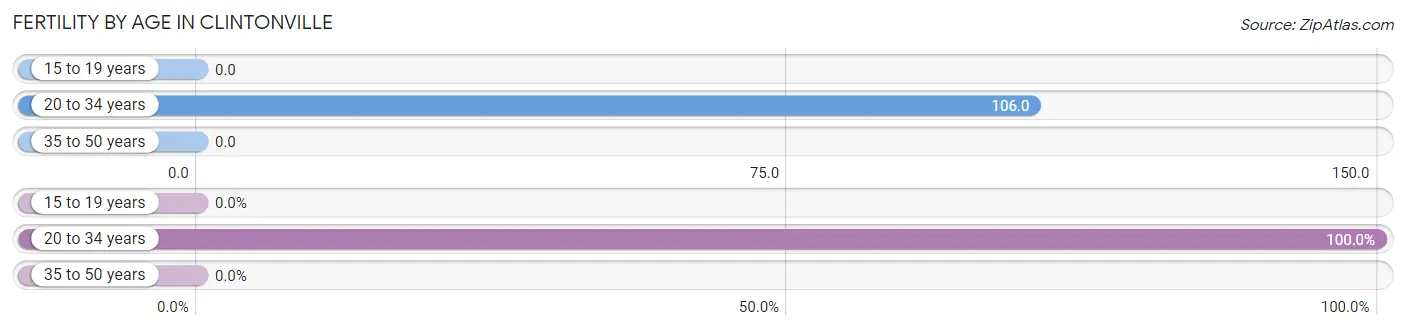
| Age Bracket | Women with Births | Births / 1,000 Women |
| 15 to 19 years | 0 (0.0%) | 0.0 |
| 20 to 34 years | 65 (100.0%) | 106.0 |
| 35 to 50 years | 0 (0.0%) | 0.0 |
| Total | 65 (100.0%) | 54.0 |
Fertility by Age by Marriage Status in Clintonville
44.6% of women with births (65) in Clintonville are married. The highest percentage of unmarried women with births falls into 20 to 34 years age bracket with 55.4% of them unmarried at the time of birth, while the lowest percentage of unmarried women with births belong to 20 to 34 years age bracket with 55.4% of them unmarried.
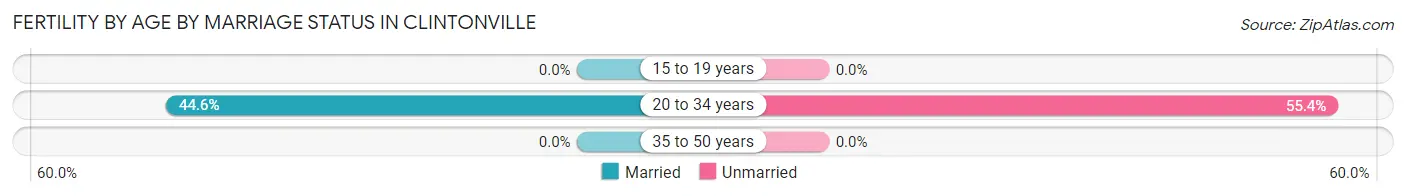
| Age Bracket | Married | Unmarried |
| 15 to 19 years | 0 (0.0%) | 0 (0.0%) |
| 20 to 34 years | 29 (44.6%) | 36 (55.4%) |
| 35 to 50 years | 0 (0.0%) | 0 (0.0%) |
| Total | 29 (44.6%) | 36 (55.4%) |
Fertility by Education in Clintonville
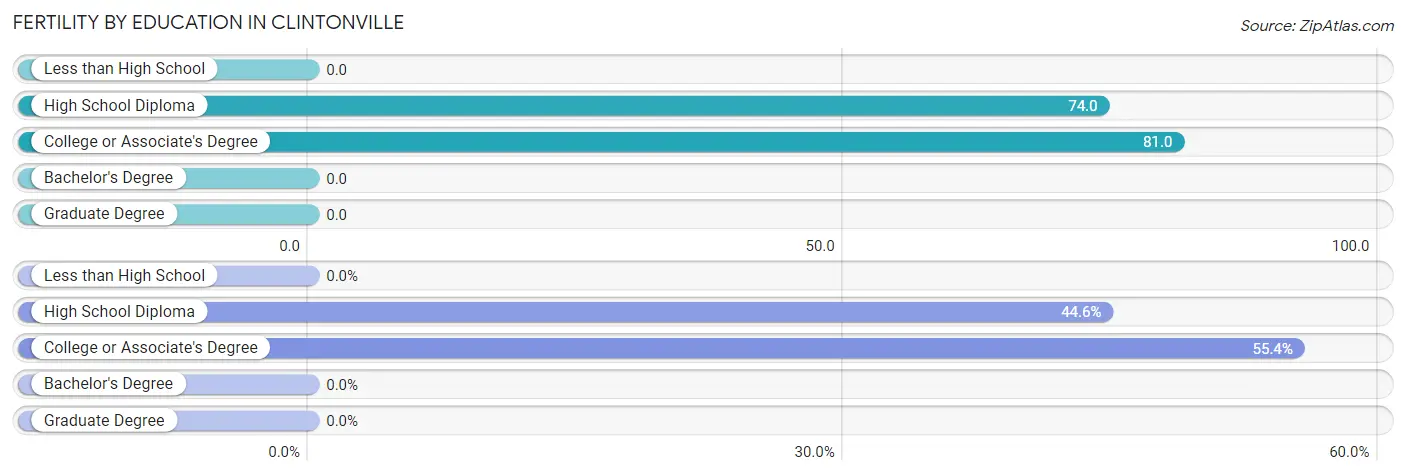
| Educational Attainment | Women with Births | Births / 1,000 Women |
| Less than High School | 0 (0.0%) | 0.0 |
| High School Diploma | 29 (44.6%) | 74.0 |
| College or Associate's Degree | 36 (55.4%) | 81.0 |
| Bachelor's Degree | 0 (0.0%) | 0.0 |
| Graduate Degree | 0 (0.0%) | 0.0 |
| Total | 65 (100.0%) | 54.0 |
Fertility by Education by Marriage Status in Clintonville
55.4% of women with births in Clintonville are unmarried. Women with the educational attainment of high school diploma are most likely to be married with 100.0% of them married at childbirth, while women with the educational attainment of college or associate's degree are least likely to be married with 100.0% of them unmarried at childbirth.
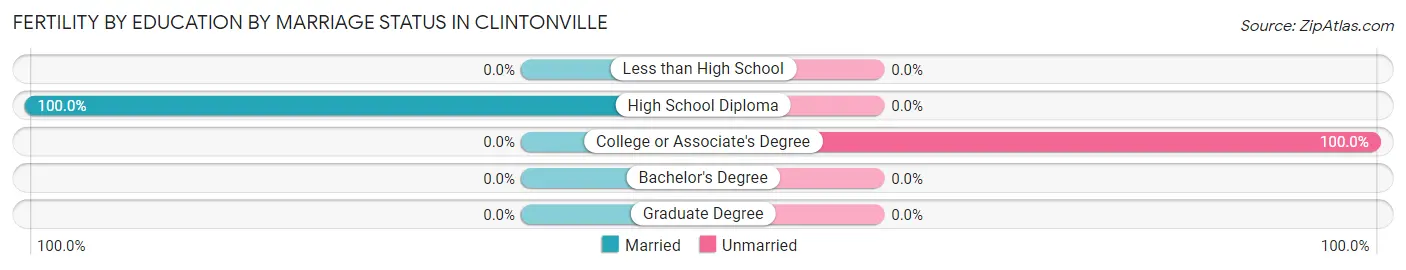
| Educational Attainment | Married | Unmarried |
| Less than High School | 0 (0.0%) | 0 (0.0%) |
| High School Diploma | 29 (100.0%) | 0 (0.0%) |
| College or Associate's Degree | 0 (0.0%) | 36 (100.0%) |
| Bachelor's Degree | 0 (0.0%) | 0 (0.0%) |
| Graduate Degree | 0 (0.0%) | 0 (0.0%) |
| Total | 29 (44.6%) | 36 (55.4%) |
Employment Characteristics in Clintonville
Employment by Class of Employer in Clintonville
Among the 2,369 employed individuals in Clintonville, private company employees (1,929 | 81.4%), not-for-profit organizations (190 | 8.0%), and local government employees (87 | 3.7%) make up the most common classes of employment.
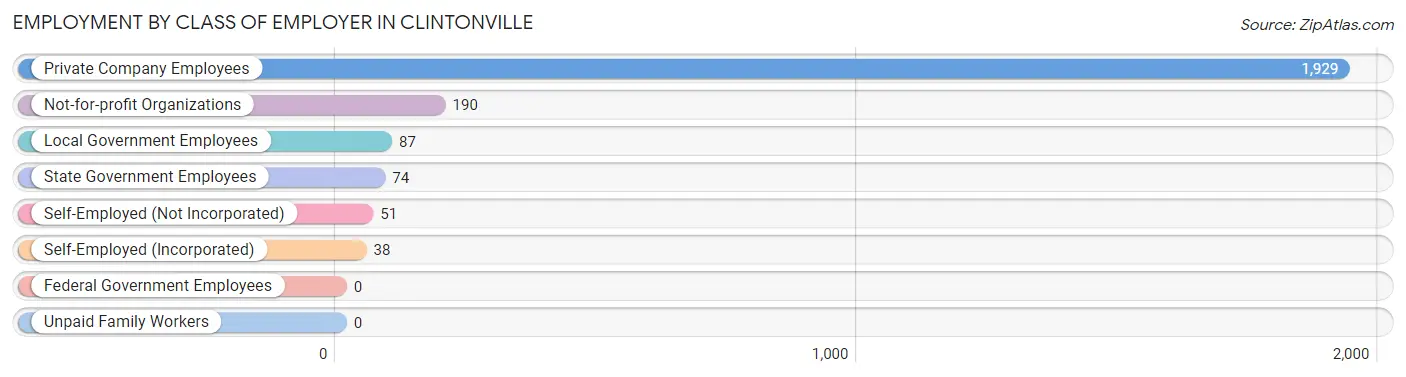
| Employer Class | # Employees | % Employees |
| Private Company Employees | 1,929 | 81.4% |
| Self-Employed (Incorporated) | 38 | 1.6% |
| Self-Employed (Not Incorporated) | 51 | 2.1% |
| Not-for-profit Organizations | 190 | 8.0% |
| Local Government Employees | 87 | 3.7% |
| State Government Employees | 74 | 3.1% |
| Federal Government Employees | 0 | 0.0% |
| Unpaid Family Workers | 0 | 0.0% |
| Total | 2,369 | 100.0% |
Employment Status by Age in Clintonville
According to the labor force statistics for Clintonville, out of the total population over 16 years of age (3,932), 63.3% or 2,489 individuals are in the labor force, with 3.3% or 82 of them unemployed. The age group with the highest labor force participation rate is 30 to 34 years, with 100.0% or 272 individuals in the labor force. Within the labor force, the 20 to 24 years age range has the highest percentage of unemployed individuals, with 10.2% or 25 of them being unemployed.
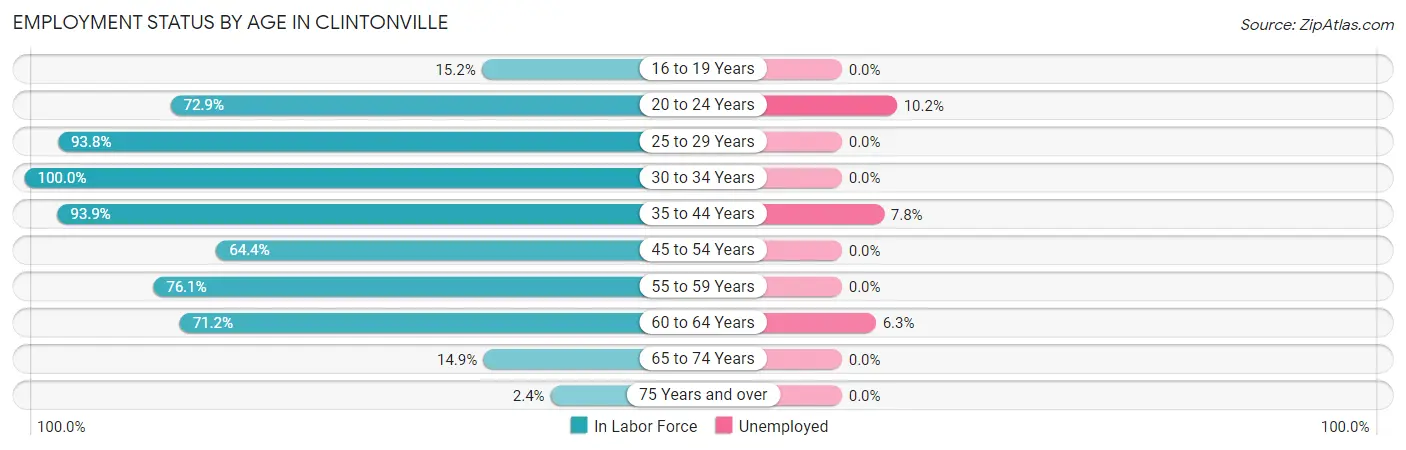
| Age Bracket | In Labor Force | Unemployed |
| 16 to 19 Years | 36 (15.2%) | 0 (0.0%) |
| 20 to 24 Years | 245 (72.9%) | 25 (10.2%) |
| 25 to 29 Years | 558 (93.8%) | 0 (0.0%) |
| 30 to 34 Years | 272 (100.0%) | 0 (0.0%) |
| 35 to 44 Years | 461 (93.9%) | 36 (7.8%) |
| 45 to 54 Years | 349 (64.4%) | 0 (0.0%) |
| 55 to 59 Years | 191 (76.1%) | 0 (0.0%) |
| 60 to 64 Years | 316 (71.2%) | 20 (6.3%) |
| 65 to 74 Years | 51 (14.9%) | 0 (0.0%) |
| 75 Years and over | 10 (2.4%) | 0 (0.0%) |
| Total | 2,489 (63.3%) | 82 (3.3%) |
Employment Status by Educational Attainment in Clintonville
According to labor force statistics for Clintonville, 82.7% of individuals (2,146) out of the total population between 25 and 64 years of age (2,595) are in the labor force, with 2.6% or 56 of them being unemployed. The group with the highest labor force participation rate are those with the educational attainment of bachelor's degree or higher, with 88.2% or 525 individuals in the labor force. Within the labor force, individuals with high school diploma education have the highest percentage of unemployment, with 5.0% or 36 of them being unemployed.
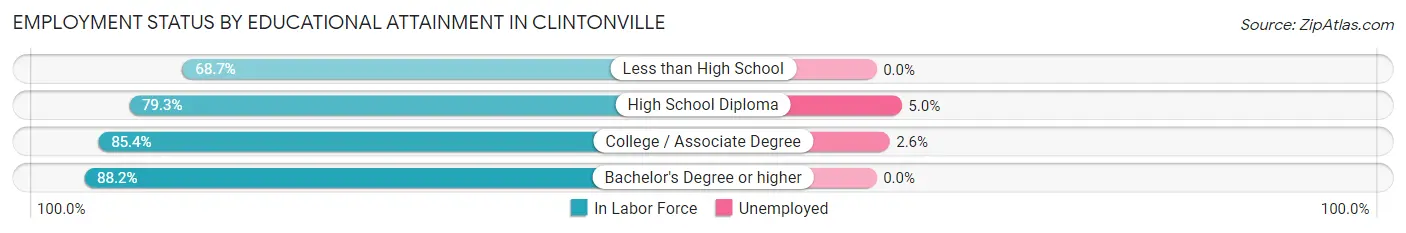
| Educational Attainment | In Labor Force | Unemployed |
| Less than High School | 125 (68.7%) | 0 (0.0%) |
| High School Diploma | 722 (79.3%) | 46 (5.0%) |
| College / Associate Degree | 775 (85.4%) | 24 (2.6%) |
| Bachelor's Degree or higher | 525 (88.2%) | 0 (0.0%) |
| Total | 2,146 (82.7%) | 67 (2.6%) |
Employment Occupations by Sex in Clintonville
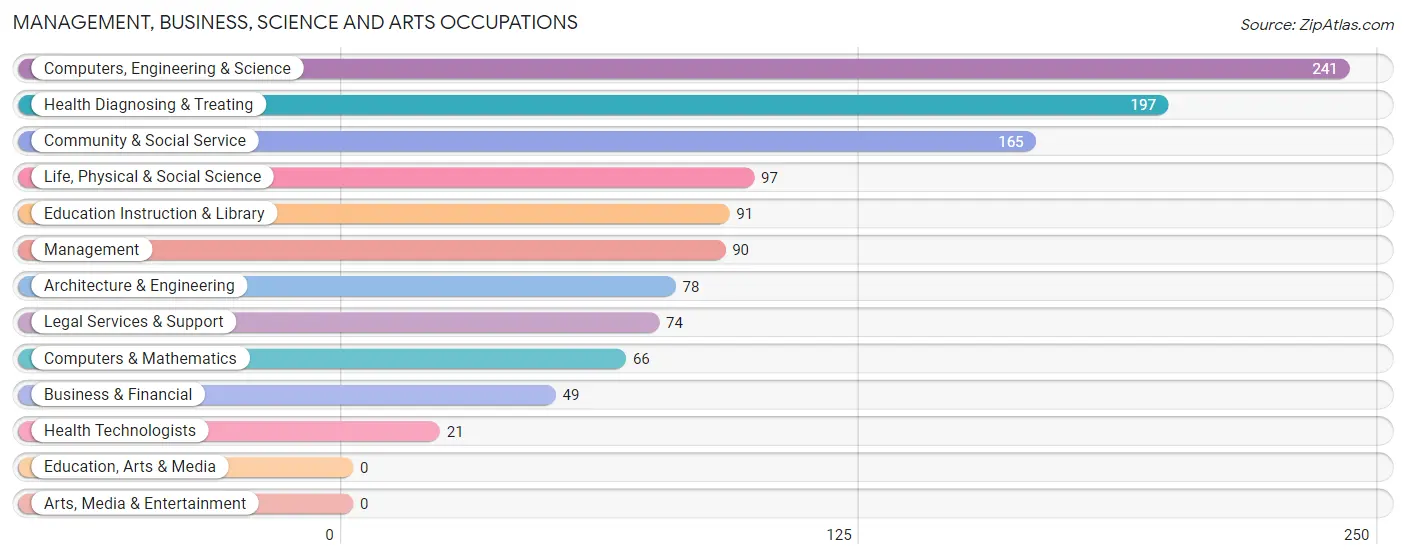
Management, Business, Science and Arts Occupations
The most common Management, Business, Science and Arts occupations in Clintonville are Computers, Engineering & Science (241 | 10.0%), Health Diagnosing & Treating (197 | 8.2%), Community & Social Service (165 | 6.9%), Life, Physical & Social Science (97 | 4.0%), and Education Instruction & Library (91 | 3.8%).
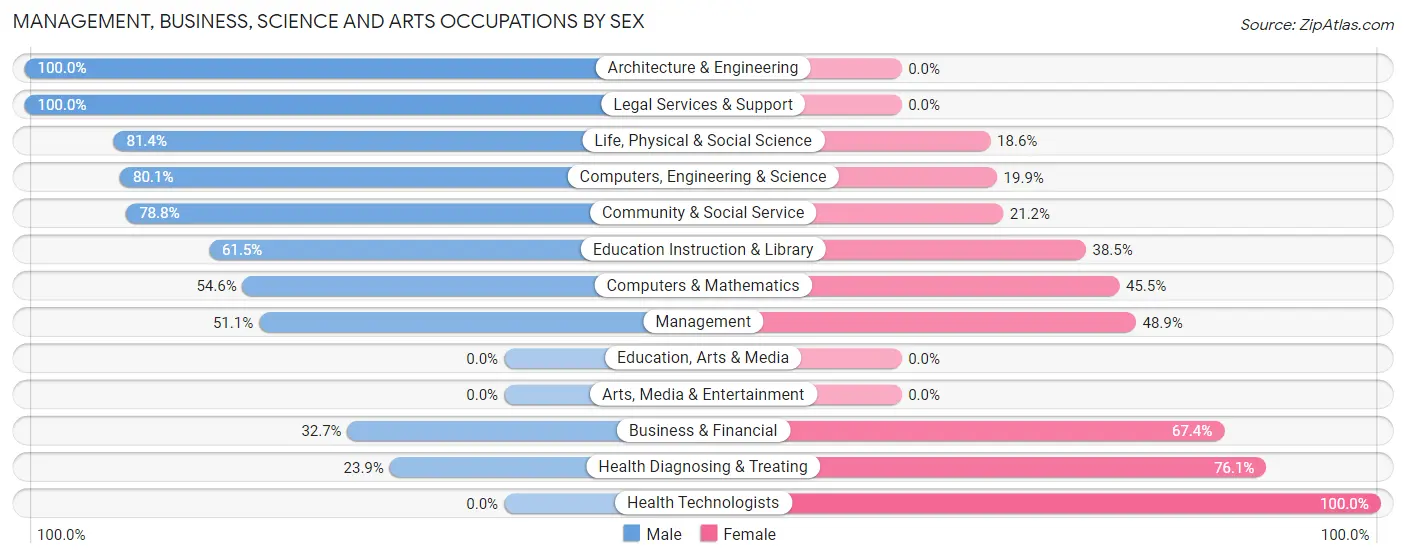
Management, Business, Science and Arts Occupations by Sex
Within the Management, Business, Science and Arts occupations in Clintonville, the most male-oriented occupations are Architecture & Engineering (100.0%), Legal Services & Support (100.0%), and Life, Physical & Social Science (81.4%), while the most female-oriented occupations are Health Technologists (100.0%), Health Diagnosing & Treating (76.1%), and Business & Financial (67.3%).
| Occupation | Male | Female |
| Management | 46 (51.1%) | 44 (48.9%) |
| Business & Financial | 16 (32.7%) | 33 (67.3%) |
| Computers, Engineering & Science | 193 (80.1%) | 48 (19.9%) |
| Computers & Mathematics | 36 (54.5%) | 30 (45.5%) |
| Architecture & Engineering | 78 (100.0%) | 0 (0.0%) |
| Life, Physical & Social Science | 79 (81.4%) | 18 (18.6%) |
| Community & Social Service | 130 (78.8%) | 35 (21.2%) |
| Education, Arts & Media | 0 (0.0%) | 0 (0.0%) |
| Legal Services & Support | 74 (100.0%) | 0 (0.0%) |
| Education Instruction & Library | 56 (61.5%) | 35 (38.5%) |
| Arts, Media & Entertainment | 0 (0.0%) | 0 (0.0%) |
| Health Diagnosing & Treating | 47 (23.9%) | 150 (76.1%) |
| Health Technologists | 0 (0.0%) | 21 (100.0%) |
| Total (Category) | 432 (58.2%) | 310 (41.8%) |
| Total (Overall) | 1,405 (58.4%) | 1,003 (41.6%) |
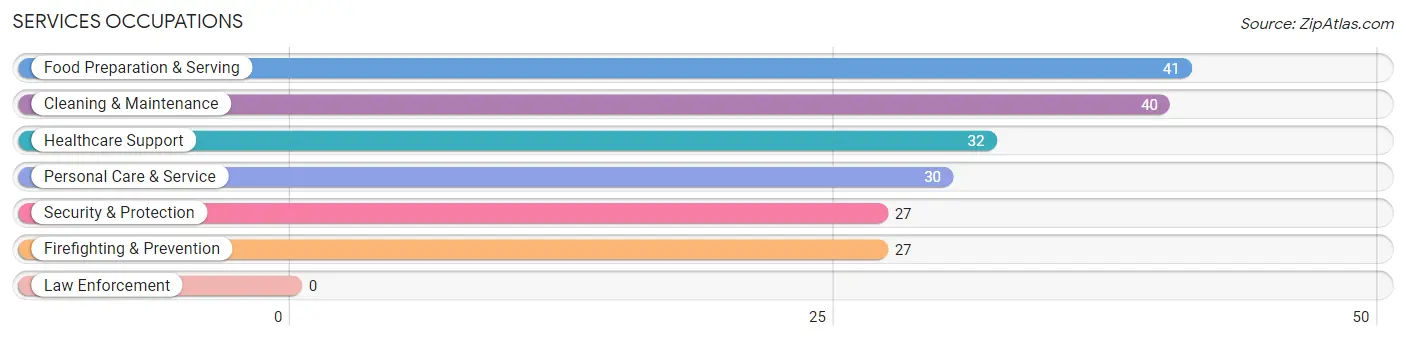
Services Occupations
The most common Services occupations in Clintonville are Food Preparation & Serving (41 | 1.7%), Cleaning & Maintenance (40 | 1.7%), Healthcare Support (32 | 1.3%), Personal Care & Service (30 | 1.3%), and Security & Protection (27 | 1.1%).
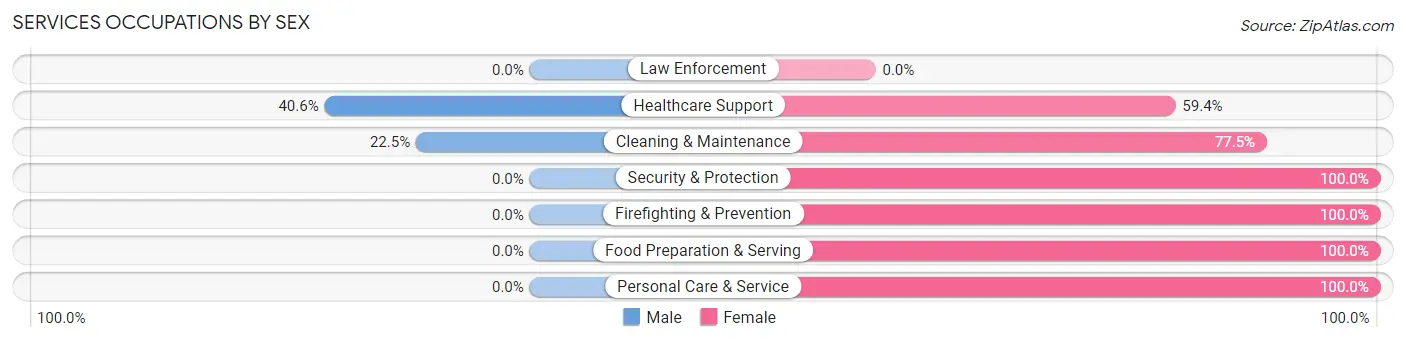
Services Occupations by Sex
Within the Services occupations in Clintonville, the most male-oriented occupations are Healthcare Support (40.6%), and Cleaning & Maintenance (22.5%), while the most female-oriented occupations are Security & Protection (100.0%), Firefighting & Prevention (100.0%), and Food Preparation & Serving (100.0%).
| Occupation | Male | Female |
| Healthcare Support | 13 (40.6%) | 19 (59.4%) |
| Security & Protection | 0 (0.0%) | 27 (100.0%) |
| Firefighting & Prevention | 0 (0.0%) | 27 (100.0%) |
| Law Enforcement | 0 (0.0%) | 0 (0.0%) |
| Food Preparation & Serving | 0 (0.0%) | 41 (100.0%) |
| Cleaning & Maintenance | 9 (22.5%) | 31 (77.5%) |
| Personal Care & Service | 0 (0.0%) | 30 (100.0%) |
| Total (Category) | 22 (12.9%) | 148 (87.1%) |
| Total (Overall) | 1,405 (58.4%) | 1,003 (41.6%) |
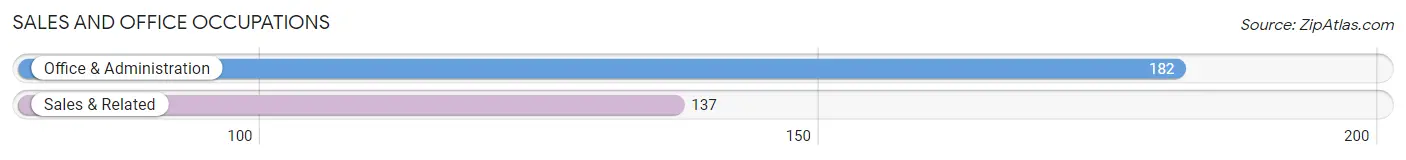
Sales and Office Occupations
The most common Sales and Office occupations in Clintonville are Office & Administration (182 | 7.6%), and Sales & Related (137 | 5.7%).
Sales and Office Occupations by Sex
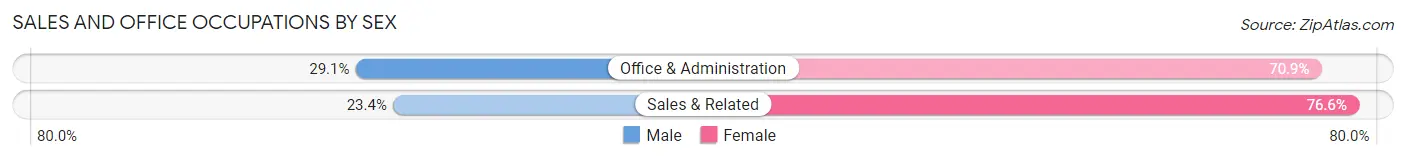
| Occupation | Male | Female |
| Sales & Related | 32 (23.4%) | 105 (76.6%) |
| Office & Administration | 53 (29.1%) | 129 (70.9%) |
| Total (Category) | 85 (26.7%) | 234 (73.4%) |
| Total (Overall) | 1,405 (58.4%) | 1,003 (41.6%) |
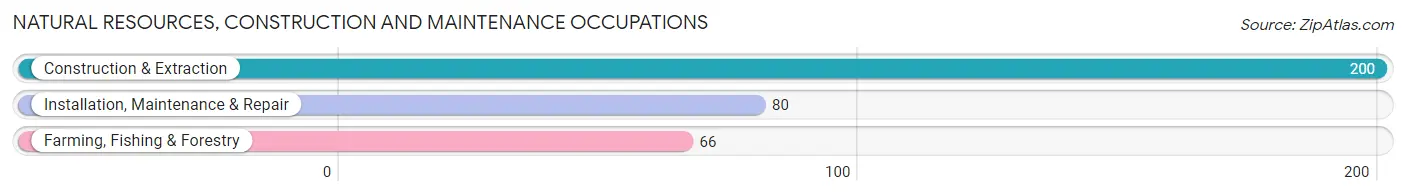
Natural Resources, Construction and Maintenance Occupations
The most common Natural Resources, Construction and Maintenance occupations in Clintonville are Construction & Extraction (200 | 8.3%), Installation, Maintenance & Repair (80 | 3.3%), and Farming, Fishing & Forestry (66 | 2.7%).
Natural Resources, Construction and Maintenance Occupations by Sex
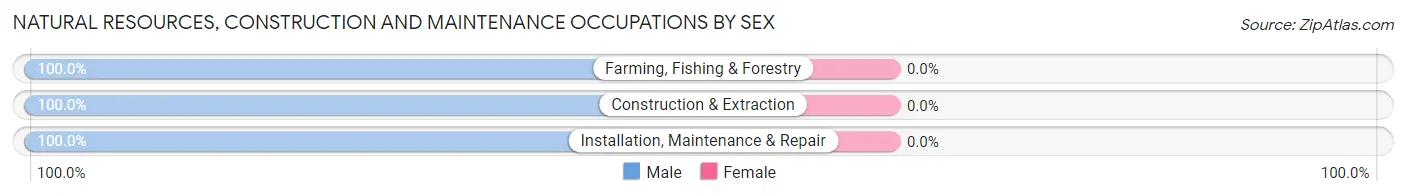
| Occupation | Male | Female |
| Farming, Fishing & Forestry | 66 (100.0%) | 0 (0.0%) |
| Construction & Extraction | 200 (100.0%) | 0 (0.0%) |
| Installation, Maintenance & Repair | 80 (100.0%) | 0 (0.0%) |
| Total (Category) | 346 (100.0%) | 0 (0.0%) |
| Total (Overall) | 1,405 (58.4%) | 1,003 (41.6%) |
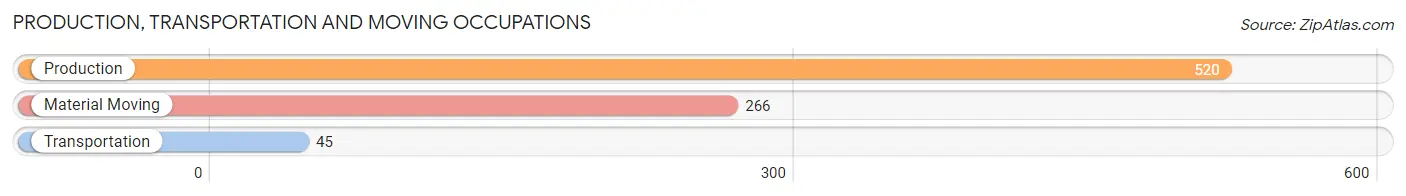
Production, Transportation and Moving Occupations
The most common Production, Transportation and Moving occupations in Clintonville are Production (520 | 21.6%), Material Moving (266 | 11.1%), and Transportation (45 | 1.9%).
Production, Transportation and Moving Occupations by Sex
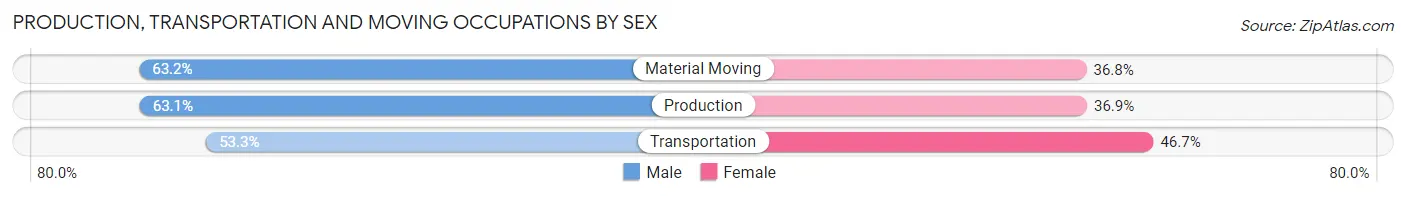
| Occupation | Male | Female |
| Production | 328 (63.1%) | 192 (36.9%) |
| Transportation | 24 (53.3%) | 21 (46.7%) |
| Material Moving | 168 (63.2%) | 98 (36.8%) |
| Total (Category) | 520 (62.6%) | 311 (37.4%) |
| Total (Overall) | 1,405 (58.4%) | 1,003 (41.6%) |
Employment Industries by Sex in Clintonville
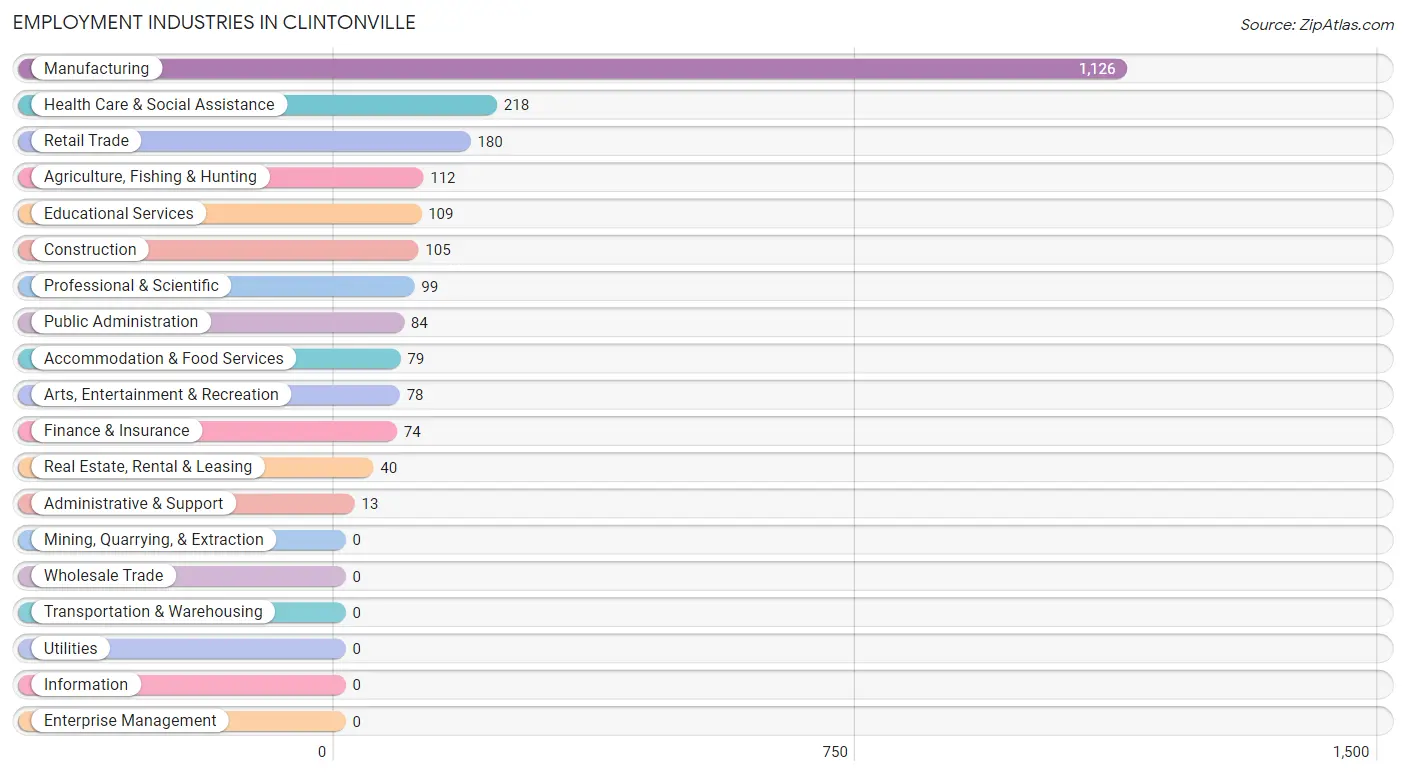
Employment Industries in Clintonville
The major employment industries in Clintonville include Manufacturing (1,126 | 46.8%), Health Care & Social Assistance (218 | 9.0%), Retail Trade (180 | 7.5%), Agriculture, Fishing & Hunting (112 | 4.6%), and Educational Services (109 | 4.5%).
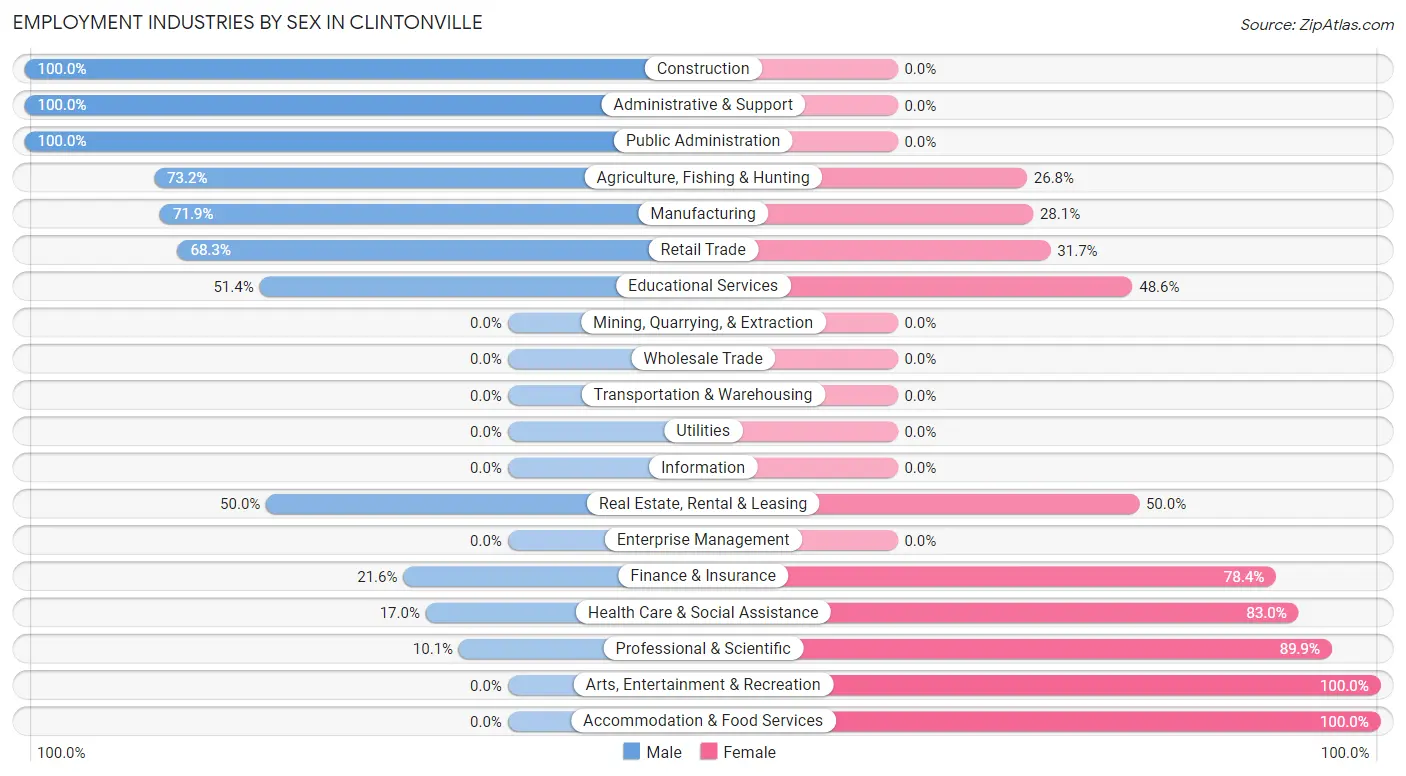
Employment Industries by Sex in Clintonville
The Clintonville industries that see more men than women are Construction (100.0%), Administrative & Support (100.0%), and Public Administration (100.0%), whereas the industries that tend to have a higher number of women are Arts, Entertainment & Recreation (100.0%), Accommodation & Food Services (100.0%), and Professional & Scientific (89.9%).
| Industry | Male | Female |
| Agriculture, Fishing & Hunting | 82 (73.2%) | 30 (26.8%) |
| Mining, Quarrying, & Extraction | 0 (0.0%) | 0 (0.0%) |
| Construction | 105 (100.0%) | 0 (0.0%) |
| Manufacturing | 810 (71.9%) | 316 (28.1%) |
| Wholesale Trade | 0 (0.0%) | 0 (0.0%) |
| Retail Trade | 123 (68.3%) | 57 (31.7%) |
| Transportation & Warehousing | 0 (0.0%) | 0 (0.0%) |
| Utilities | 0 (0.0%) | 0 (0.0%) |
| Information | 0 (0.0%) | 0 (0.0%) |
| Finance & Insurance | 16 (21.6%) | 58 (78.4%) |
| Real Estate, Rental & Leasing | 20 (50.0%) | 20 (50.0%) |
| Professional & Scientific | 10 (10.1%) | 89 (89.9%) |
| Enterprise Management | 0 (0.0%) | 0 (0.0%) |
| Administrative & Support | 13 (100.0%) | 0 (0.0%) |
| Educational Services | 56 (51.4%) | 53 (48.6%) |
| Health Care & Social Assistance | 37 (17.0%) | 181 (83.0%) |
| Arts, Entertainment & Recreation | 0 (0.0%) | 78 (100.0%) |
| Accommodation & Food Services | 0 (0.0%) | 79 (100.0%) |
| Public Administration | 84 (100.0%) | 0 (0.0%) |
| Total | 1,405 (58.4%) | 1,003 (41.6%) |
Education in Clintonville
School Enrollment in Clintonville
The most common levels of schooling among the 739 students in Clintonville are high school (239 | 32.3%), college / undergraduate (195 | 26.4%), and middle school (120 | 16.2%).
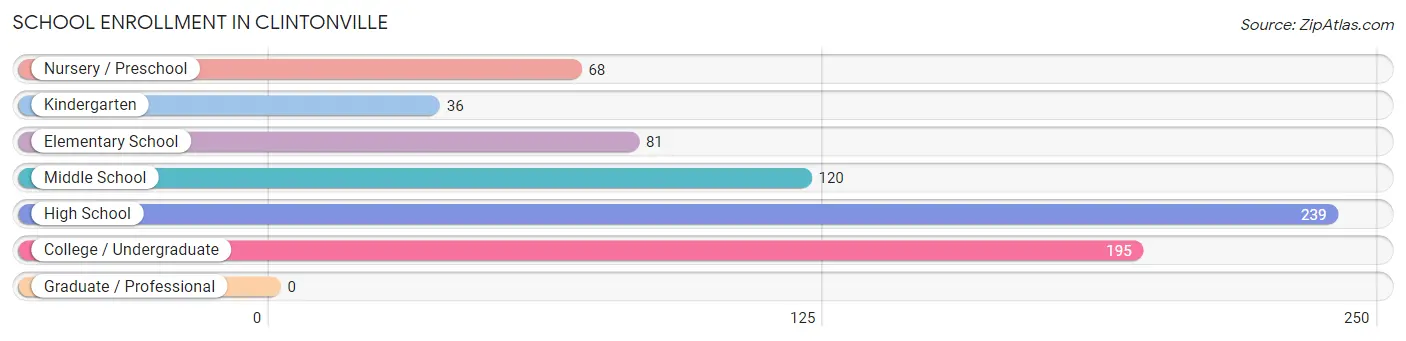
| School Level | # Students | % Students |
| Nursery / Preschool | 68 | 9.2% |
| Kindergarten | 36 | 4.9% |
| Elementary School | 81 | 11.0% |
| Middle School | 120 | 16.2% |
| High School | 239 | 32.3% |
| College / Undergraduate | 195 | 26.4% |
| Graduate / Professional | 0 | 0.0% |
| Total | 739 | 100.0% |
School Enrollment by Age by Funding Source in Clintonville
Out of a total of 739 students who are enrolled in schools in Clintonville, 43 (5.8%) attend a private institution, while the remaining 696 (94.2%) are enrolled in public schools. The age group of 20 to 24 year olds has the highest likelihood of being enrolled in private schools, with 19 (16.0% in the age bracket) enrolled. Conversely, the age group of 5 to 9 year old has the lowest likelihood of being enrolled in a private school, with 143 (100.0% in the age bracket) attending a public institution.
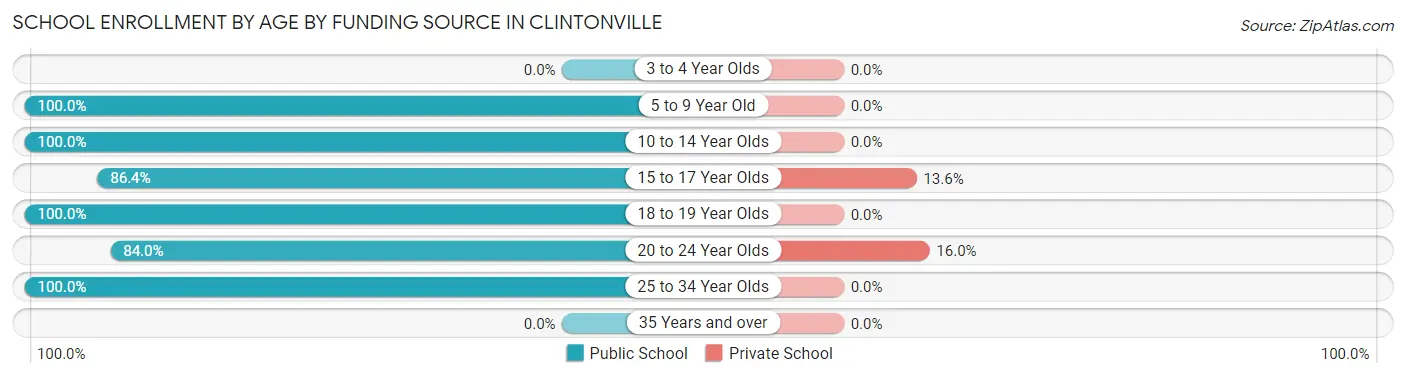
| Age Bracket | Public School | Private School |
| 3 to 4 Year Olds | 0 (0.0%) | 0 (0.0%) |
| 5 to 9 Year Old | 143 (100.0%) | 0 (0.0%) |
| 10 to 14 Year Olds | 162 (100.0%) | 0 (0.0%) |
| 15 to 17 Year Olds | 153 (86.4%) | 24 (13.6%) |
| 18 to 19 Year Olds | 114 (100.0%) | 0 (0.0%) |
| 20 to 24 Year Olds | 100 (84.0%) | 19 (16.0%) |
| 25 to 34 Year Olds | 24 (100.0%) | 0 (0.0%) |
| 35 Years and over | 0 (0.0%) | 0 (0.0%) |
| Total | 696 (94.2%) | 43 (5.8%) |
Educational Attainment by Field of Study in Clintonville
Education (172 | 19.7%), arts & humanities (148 | 17.0%), engineering (129 | 14.8%), business (98 | 11.2%), and bio, nature & agricultural (96 | 11.0%) are the most common fields of study among 873 individuals in Clintonville who have obtained a bachelor's degree or higher.
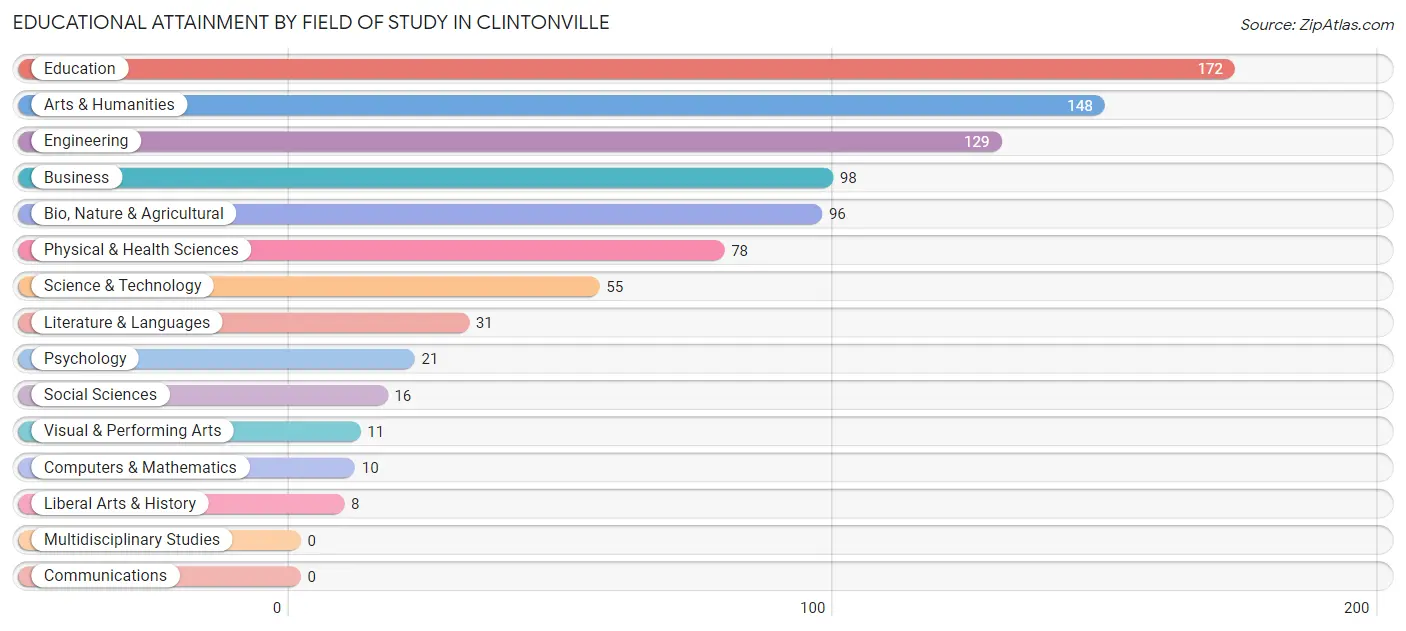
| Field of Study | # Graduates | % Graduates |
| Computers & Mathematics | 10 | 1.1% |
| Bio, Nature & Agricultural | 96 | 11.0% |
| Physical & Health Sciences | 78 | 8.9% |
| Psychology | 21 | 2.4% |
| Social Sciences | 16 | 1.8% |
| Engineering | 129 | 14.8% |
| Multidisciplinary Studies | 0 | 0.0% |
| Science & Technology | 55 | 6.3% |
| Business | 98 | 11.2% |
| Education | 172 | 19.7% |
| Literature & Languages | 31 | 3.5% |
| Liberal Arts & History | 8 | 0.9% |
| Visual & Performing Arts | 11 | 1.3% |
| Communications | 0 | 0.0% |
| Arts & Humanities | 148 | 17.0% |
| Total | 873 | 100.0% |
Transportation & Commute in Clintonville
Vehicle Availability by Sex in Clintonville
The most prevalent vehicle ownership categories in Clintonville are males with 2 vehicles (664, accounting for 47.8%) and females with 2 vehicles (587, making up 68.2%).
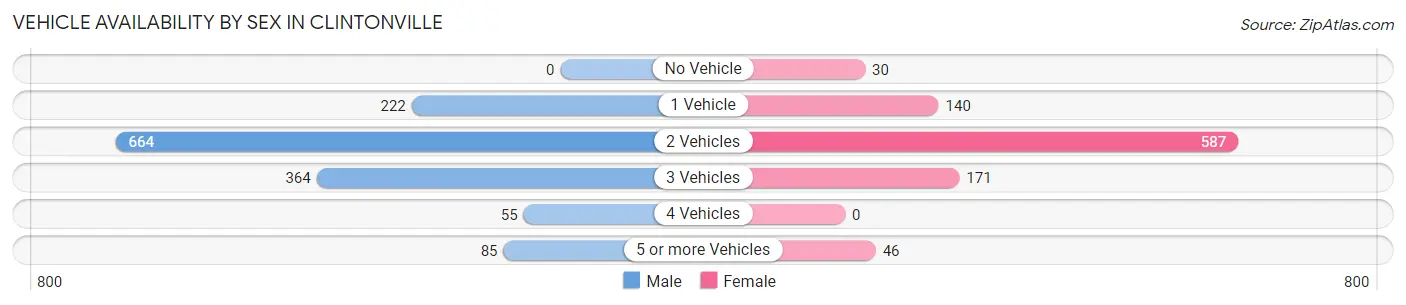
| Vehicles Available | Male | Female |
| No Vehicle | 0 (0.0%) | 30 (3.1%) |
| 1 Vehicle | 222 (16.0%) | 140 (14.4%) |
| 2 Vehicles | 664 (47.8%) | 587 (60.3%) |
| 3 Vehicles | 364 (26.2%) | 171 (17.6%) |
| 4 Vehicles | 55 (4.0%) | 0 (0.0%) |
| 5 or more Vehicles | 85 (6.1%) | 46 (4.7%) |
| Total | 1,390 (100.0%) | 974 (100.0%) |
Commute Time in Clintonville
The most frequently occuring commute durations in Clintonville are 5 to 9 minutes (500 commuters, 22.1%), 10 to 14 minutes (391 commuters, 17.3%), and 45 to 59 minutes (311 commuters, 13.8%).
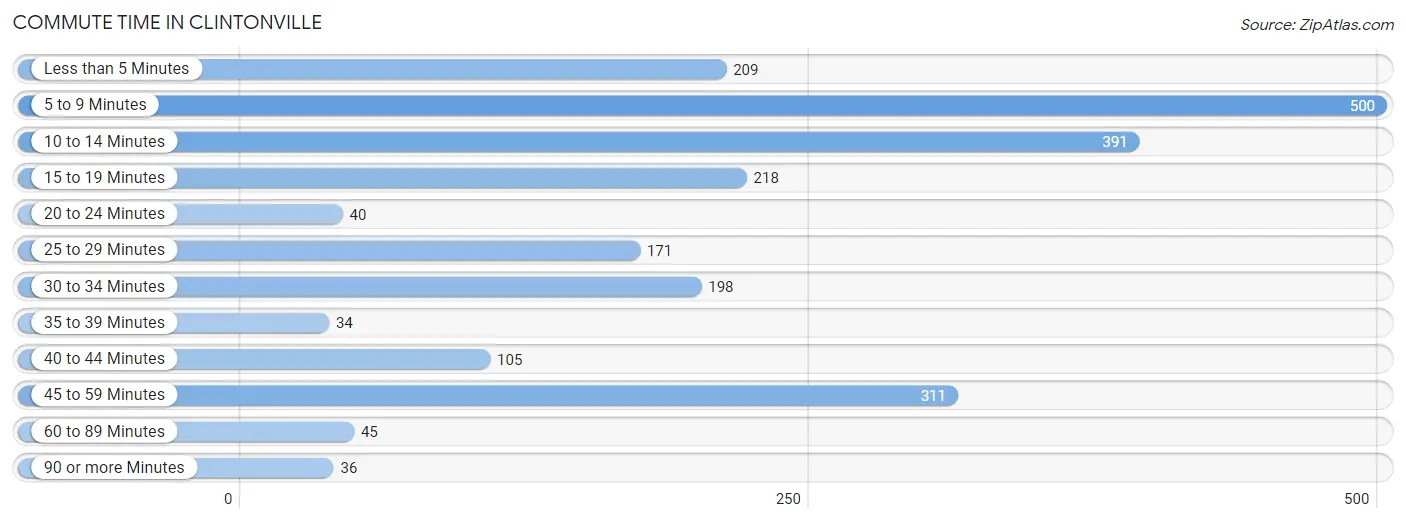
| Commute Time | # Commuters | % Commuters |
| Less than 5 Minutes | 209 | 9.3% |
| 5 to 9 Minutes | 500 | 22.1% |
| 10 to 14 Minutes | 391 | 17.3% |
| 15 to 19 Minutes | 218 | 9.7% |
| 20 to 24 Minutes | 40 | 1.8% |
| 25 to 29 Minutes | 171 | 7.6% |
| 30 to 34 Minutes | 198 | 8.8% |
| 35 to 39 Minutes | 34 | 1.5% |
| 40 to 44 Minutes | 105 | 4.6% |
| 45 to 59 Minutes | 311 | 13.8% |
| 60 to 89 Minutes | 45 | 2.0% |
| 90 or more Minutes | 36 | 1.6% |
Commute Time by Sex in Clintonville
The most common commute times in Clintonville are 5 to 9 minutes (269 commuters, 19.5%) for males and 5 to 9 minutes (231 commuters, 26.3%) for females.
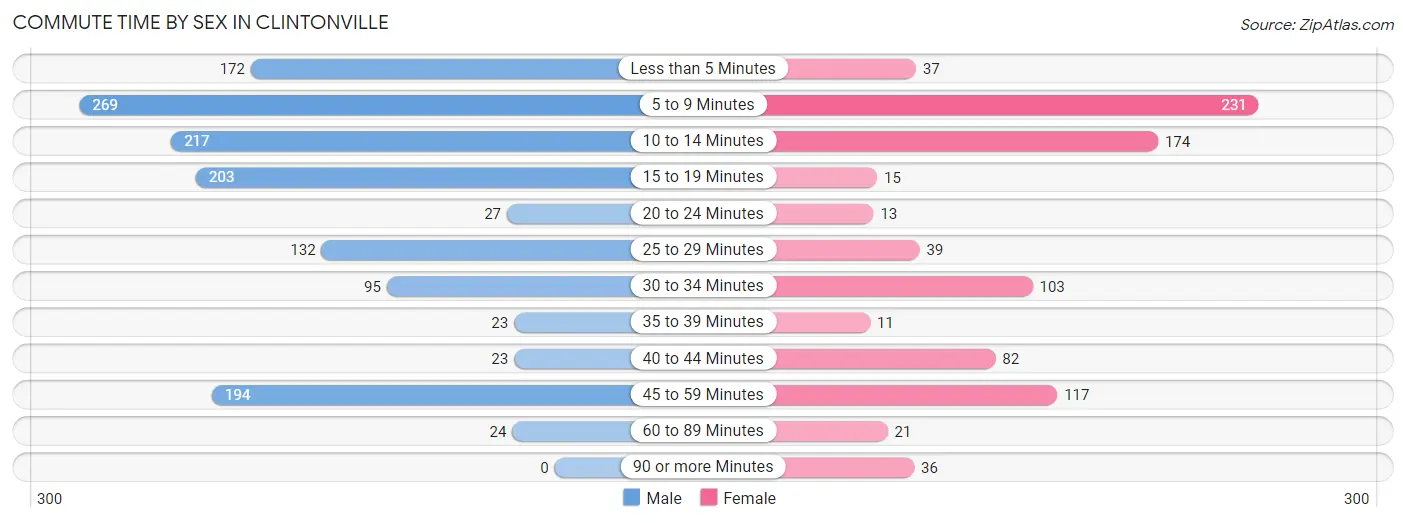
| Commute Time | Male | Female |
| Less than 5 Minutes | 172 (12.5%) | 37 (4.2%) |
| 5 to 9 Minutes | 269 (19.5%) | 231 (26.3%) |
| 10 to 14 Minutes | 217 (15.7%) | 174 (19.8%) |
| 15 to 19 Minutes | 203 (14.7%) | 15 (1.7%) |
| 20 to 24 Minutes | 27 (2.0%) | 13 (1.5%) |
| 25 to 29 Minutes | 132 (9.6%) | 39 (4.4%) |
| 30 to 34 Minutes | 95 (6.9%) | 103 (11.7%) |
| 35 to 39 Minutes | 23 (1.7%) | 11 (1.3%) |
| 40 to 44 Minutes | 23 (1.7%) | 82 (9.3%) |
| 45 to 59 Minutes | 194 (14.1%) | 117 (13.3%) |
| 60 to 89 Minutes | 24 (1.7%) | 21 (2.4%) |
| 90 or more Minutes | 0 (0.0%) | 36 (4.1%) |
Time of Departure to Work by Sex in Clintonville
The most frequent times of departure to work in Clintonville are 12:00 AM to 4:59 AM (327, 23.7%) for males and 5:30 AM to 5:59 AM (155, 17.6%) for females.
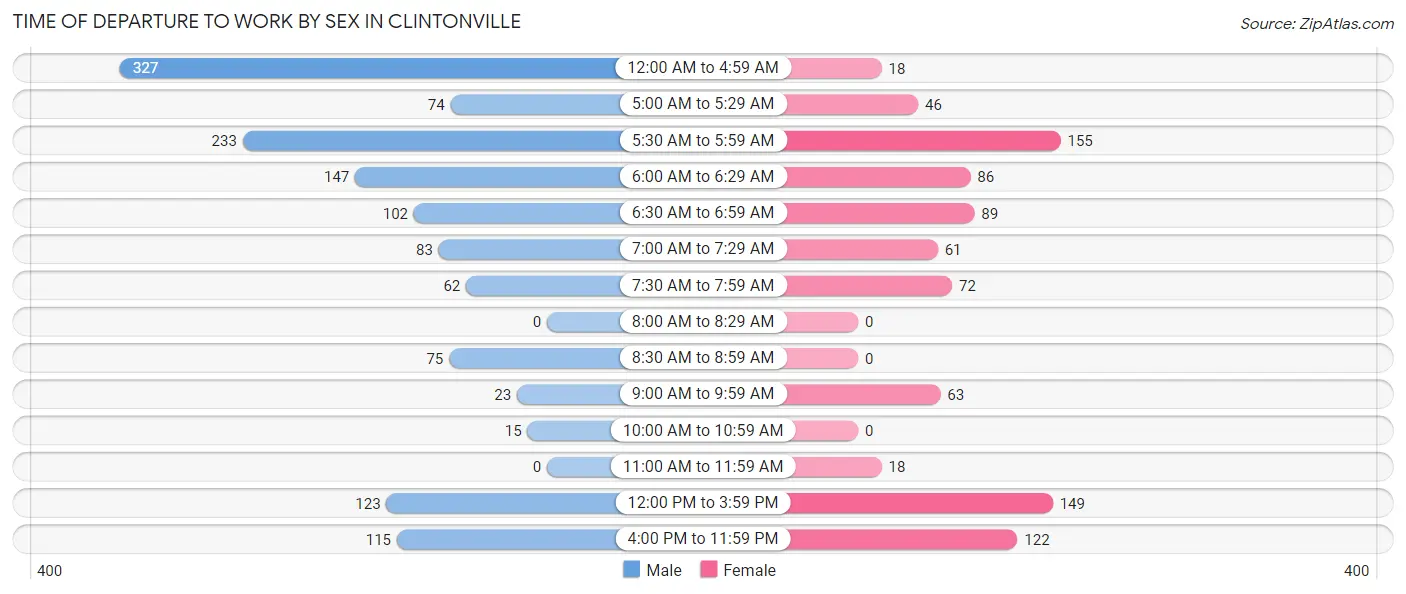
| Time of Departure | Male | Female |
| 12:00 AM to 4:59 AM | 327 (23.7%) | 18 (2.1%) |
| 5:00 AM to 5:29 AM | 74 (5.4%) | 46 (5.2%) |
| 5:30 AM to 5:59 AM | 233 (16.9%) | 155 (17.6%) |
| 6:00 AM to 6:29 AM | 147 (10.7%) | 86 (9.8%) |
| 6:30 AM to 6:59 AM | 102 (7.4%) | 89 (10.1%) |
| 7:00 AM to 7:29 AM | 83 (6.0%) | 61 (6.9%) |
| 7:30 AM to 7:59 AM | 62 (4.5%) | 72 (8.2%) |
| 8:00 AM to 8:29 AM | 0 (0.0%) | 0 (0.0%) |
| 8:30 AM to 8:59 AM | 75 (5.4%) | 0 (0.0%) |
| 9:00 AM to 9:59 AM | 23 (1.7%) | 63 (7.2%) |
| 10:00 AM to 10:59 AM | 15 (1.1%) | 0 (0.0%) |
| 11:00 AM to 11:59 AM | 0 (0.0%) | 18 (2.1%) |
| 12:00 PM to 3:59 PM | 123 (8.9%) | 149 (17.0%) |
| 4:00 PM to 11:59 PM | 115 (8.3%) | 122 (13.9%) |
| Total | 1,379 (100.0%) | 879 (100.0%) |
Housing Occupancy in Clintonville
Occupancy by Ownership in Clintonville
Of the total 2,100 dwellings in Clintonville, owner-occupied units account for 1,399 (66.6%), while renter-occupied units make up 701 (33.4%).
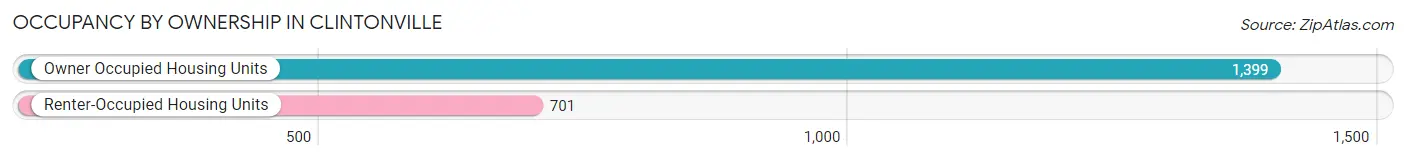
| Occupancy | # Housing Units | % Housing Units |
| Owner Occupied Housing Units | 1,399 | 66.6% |
| Renter-Occupied Housing Units | 701 | 33.4% |
| Total Occupied Housing Units | 2,100 | 100.0% |
Occupancy by Household Size in Clintonville
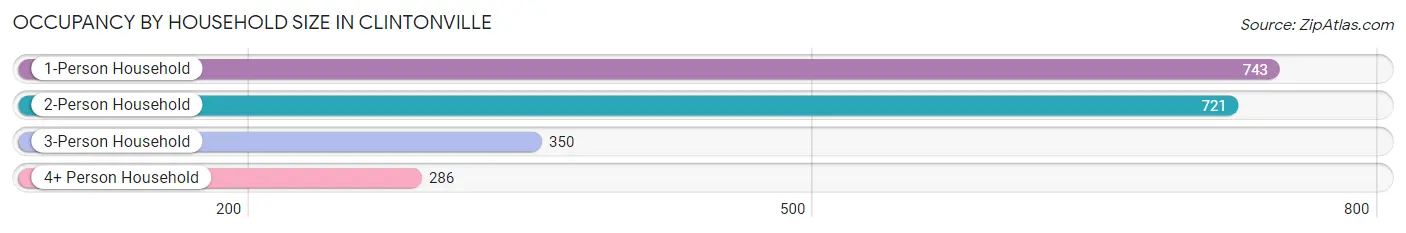
| Household Size | # Housing Units | % Housing Units |
| 1-Person Household | 743 | 35.4% |
| 2-Person Household | 721 | 34.3% |
| 3-Person Household | 350 | 16.7% |
| 4+ Person Household | 286 | 13.6% |
| Total Housing Units | 2,100 | 100.0% |
Occupancy by Ownership by Household Size in Clintonville
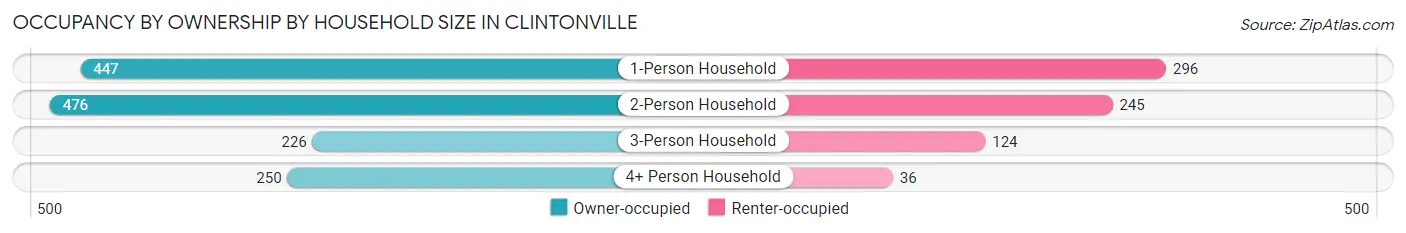
| Household Size | Owner-occupied | Renter-occupied |
| 1-Person Household | 447 (60.2%) | 296 (39.8%) |
| 2-Person Household | 476 (66.0%) | 245 (34.0%) |
| 3-Person Household | 226 (64.6%) | 124 (35.4%) |
| 4+ Person Household | 250 (87.4%) | 36 (12.6%) |
| Total Housing Units | 1,399 (66.6%) | 701 (33.4%) |
Occupancy by Educational Attainment in Clintonville
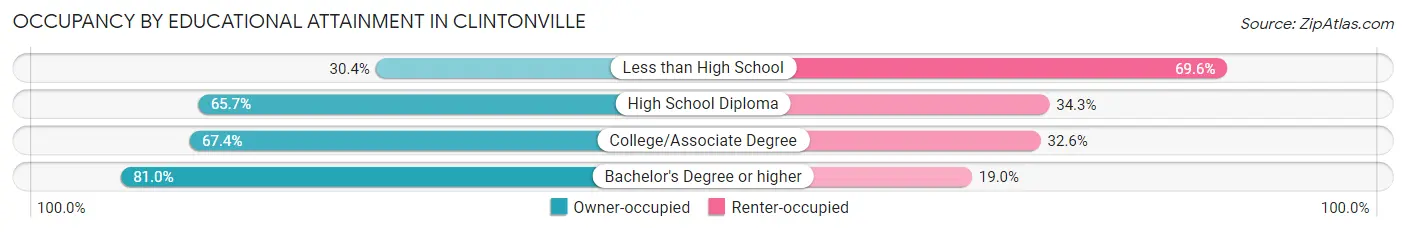
| Household Size | Owner-occupied | Renter-occupied |
| Less than High School | 69 (30.4%) | 158 (69.6%) |
| High School Diploma | 459 (65.7%) | 240 (34.3%) |
| College/Associate Degree | 397 (67.4%) | 192 (32.6%) |
| Bachelor's Degree or higher | 474 (81.0%) | 111 (19.0%) |
Occupancy by Age of Householder in Clintonville
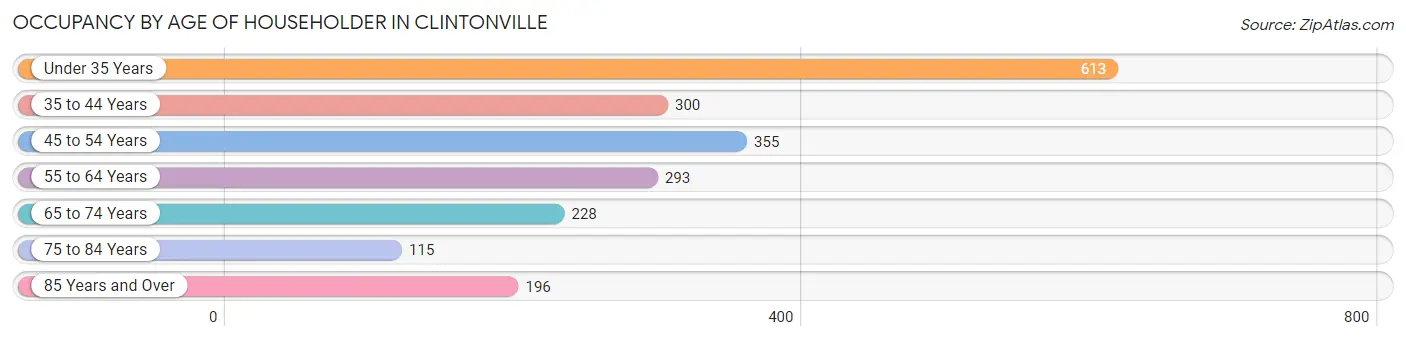
| Age Bracket | # Households | % Households |
| Under 35 Years | 613 | 29.2% |
| 35 to 44 Years | 300 | 14.3% |
| 45 to 54 Years | 355 | 16.9% |
| 55 to 64 Years | 293 | 14.0% |
| 65 to 74 Years | 228 | 10.9% |
| 75 to 84 Years | 115 | 5.5% |
| 85 Years and Over | 196 | 9.3% |
| Total | 2,100 | 100.0% |
Housing Finances in Clintonville
Median Income by Occupancy in Clintonville
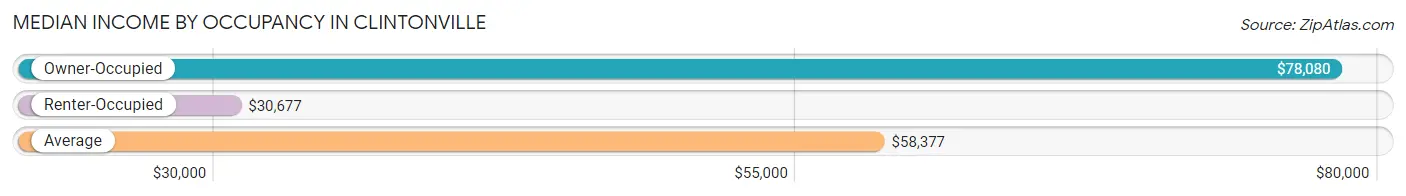
| Occupancy Type | # Households | Median Income |
| Owner-Occupied | 1,399 (66.6%) | $78,080 |
| Renter-Occupied | 701 (33.4%) | $30,677 |
| Average | 2,100 (100.0%) | $58,377 |
Occupancy by Householder Income Bracket in Clintonville
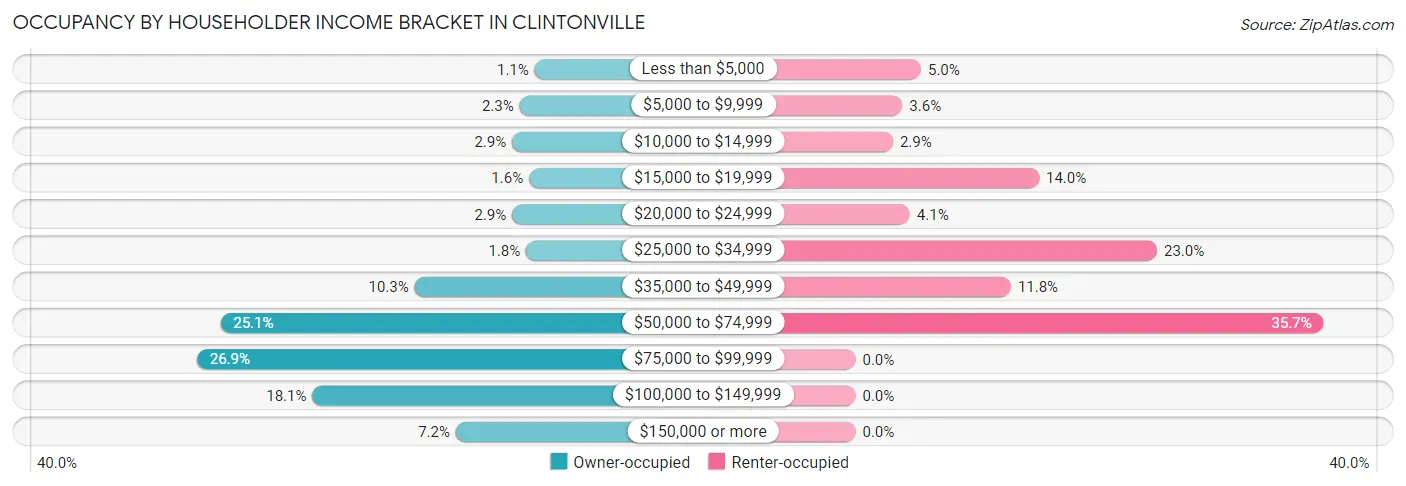
| Income Bracket | Owner-occupied | Renter-occupied |
| Less than $5,000 | 16 (1.1%) | 35 (5.0%) |
| $5,000 to $9,999 | 32 (2.3%) | 25 (3.6%) |
| $10,000 to $14,999 | 40 (2.9%) | 20 (2.9%) |
| $15,000 to $19,999 | 22 (1.6%) | 98 (14.0%) |
| $20,000 to $24,999 | 40 (2.9%) | 29 (4.1%) |
| $25,000 to $34,999 | 25 (1.8%) | 161 (23.0%) |
| $35,000 to $49,999 | 144 (10.3%) | 83 (11.8%) |
| $50,000 to $74,999 | 351 (25.1%) | 250 (35.7%) |
| $75,000 to $99,999 | 376 (26.9%) | 0 (0.0%) |
| $100,000 to $149,999 | 253 (18.1%) | 0 (0.0%) |
| $150,000 or more | 100 (7.1%) | 0 (0.0%) |
| Total | 1,399 (100.0%) | 701 (100.0%) |
Monthly Housing Cost Tiers in Clintonville
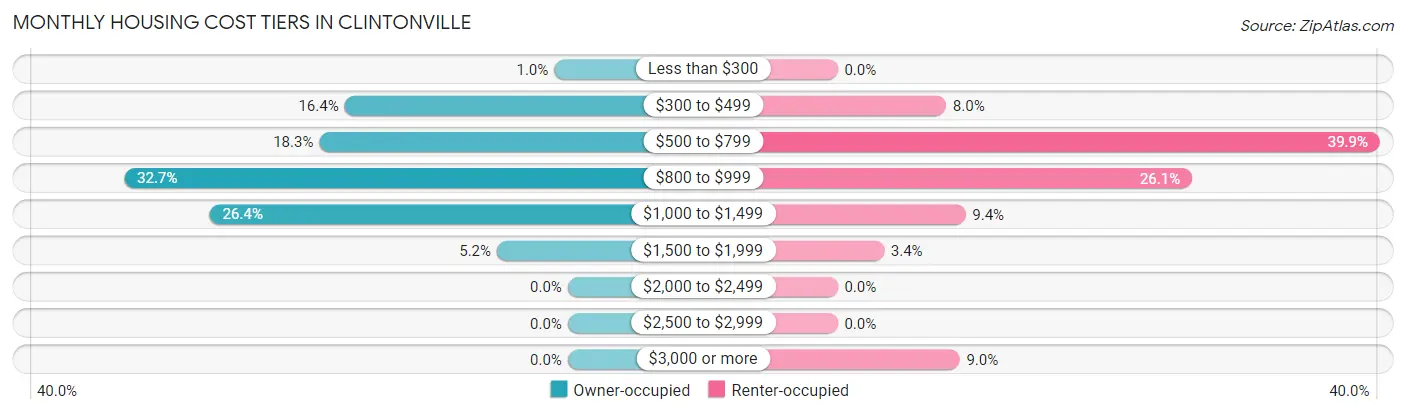
| Monthly Cost | Owner-occupied | Renter-occupied |
| Less than $300 | 14 (1.0%) | 0 (0.0%) |
| $300 to $499 | 230 (16.4%) | 56 (8.0%) |
| $500 to $799 | 256 (18.3%) | 280 (39.9%) |
| $800 to $999 | 457 (32.7%) | 183 (26.1%) |
| $1,000 to $1,499 | 369 (26.4%) | 66 (9.4%) |
| $1,500 to $1,999 | 73 (5.2%) | 24 (3.4%) |
| $2,000 to $2,499 | 0 (0.0%) | 0 (0.0%) |
| $2,500 to $2,999 | 0 (0.0%) | 0 (0.0%) |
| $3,000 or more | 0 (0.0%) | 63 (9.0%) |
| Total | 1,399 (100.0%) | 701 (100.0%) |
Physical Housing Characteristics in Clintonville
Housing Structures in Clintonville
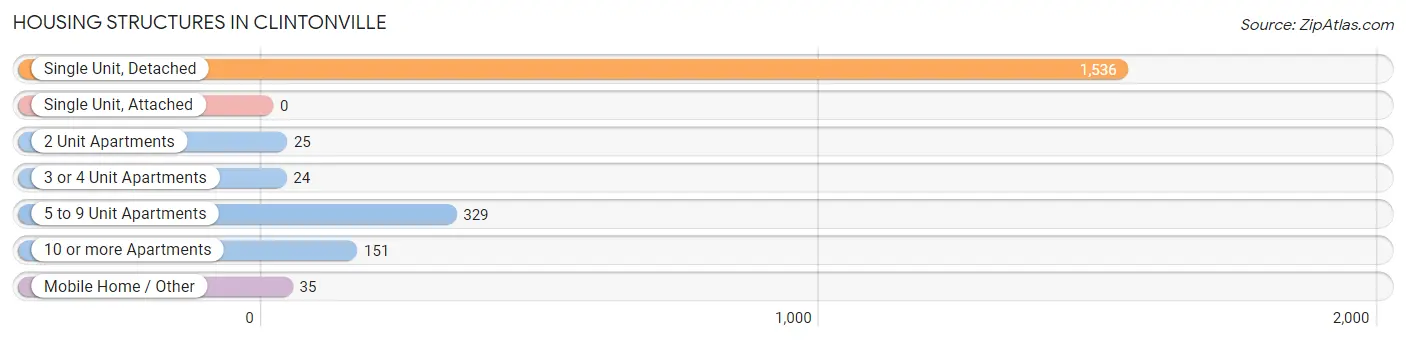
| Structure Type | # Housing Units | % Housing Units |
| Single Unit, Detached | 1,536 | 73.1% |
| Single Unit, Attached | 0 | 0.0% |
| 2 Unit Apartments | 25 | 1.2% |
| 3 or 4 Unit Apartments | 24 | 1.1% |
| 5 to 9 Unit Apartments | 329 | 15.7% |
| 10 or more Apartments | 151 | 7.2% |
| Mobile Home / Other | 35 | 1.7% |
| Total | 2,100 | 100.0% |
Housing Structures by Occupancy in Clintonville
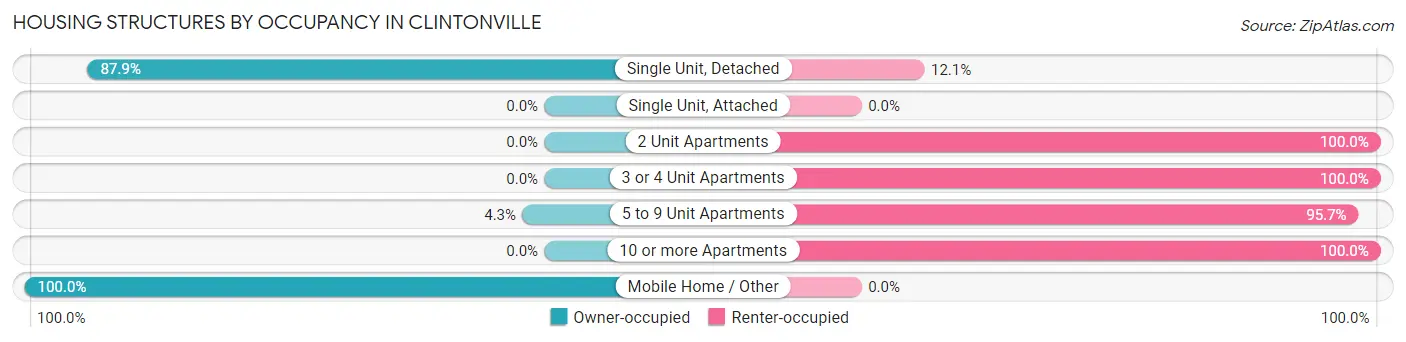
| Structure Type | Owner-occupied | Renter-occupied |
| Single Unit, Detached | 1,350 (87.9%) | 186 (12.1%) |
| Single Unit, Attached | 0 (0.0%) | 0 (0.0%) |
| 2 Unit Apartments | 0 (0.0%) | 25 (100.0%) |
| 3 or 4 Unit Apartments | 0 (0.0%) | 24 (100.0%) |
| 5 to 9 Unit Apartments | 14 (4.3%) | 315 (95.7%) |
| 10 or more Apartments | 0 (0.0%) | 151 (100.0%) |
| Mobile Home / Other | 35 (100.0%) | 0 (0.0%) |
| Total | 1,399 (66.6%) | 701 (33.4%) |
Housing Structures by Number of Rooms in Clintonville
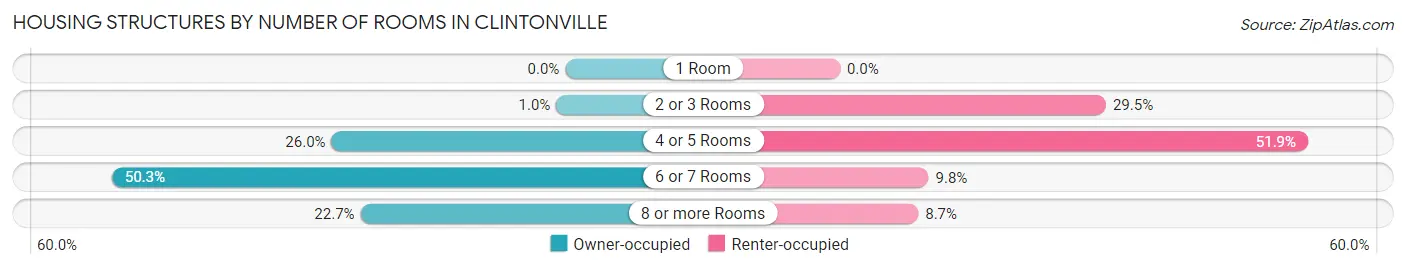
| Number of Rooms | Owner-occupied | Renter-occupied |
| 1 Room | 0 (0.0%) | 0 (0.0%) |
| 2 or 3 Rooms | 14 (1.0%) | 207 (29.5%) |
| 4 or 5 Rooms | 363 (26.0%) | 364 (51.9%) |
| 6 or 7 Rooms | 704 (50.3%) | 69 (9.8%) |
| 8 or more Rooms | 318 (22.7%) | 61 (8.7%) |
| Total | 1,399 (100.0%) | 701 (100.0%) |
Housing Structure by Heating Type in Clintonville
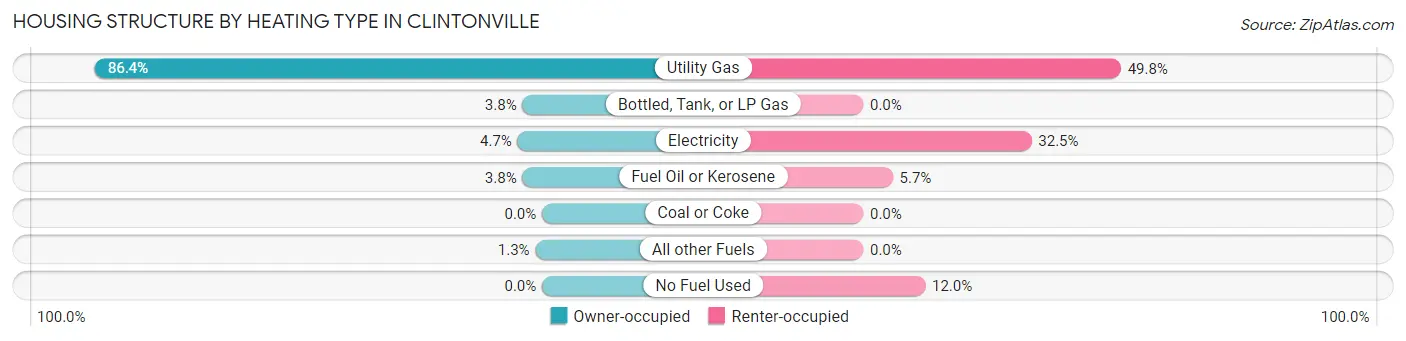
| Heating Type | Owner-occupied | Renter-occupied |
| Utility Gas | 1,209 (86.4%) | 349 (49.8%) |
| Bottled, Tank, or LP Gas | 53 (3.8%) | 0 (0.0%) |
| Electricity | 66 (4.7%) | 228 (32.5%) |
| Fuel Oil or Kerosene | 53 (3.8%) | 40 (5.7%) |
| Coal or Coke | 0 (0.0%) | 0 (0.0%) |
| All other Fuels | 18 (1.3%) | 0 (0.0%) |
| No Fuel Used | 0 (0.0%) | 84 (12.0%) |
| Total | 1,399 (100.0%) | 701 (100.0%) |
Household Vehicle Usage in Clintonville
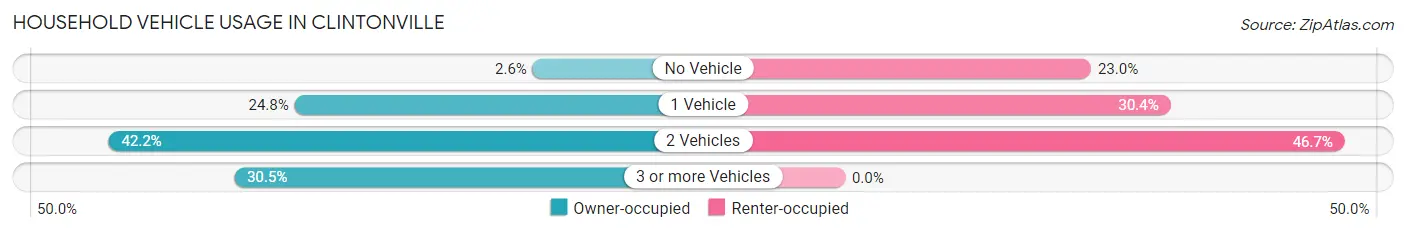
| Vehicles per Household | Owner-occupied | Renter-occupied |
| No Vehicle | 36 (2.6%) | 161 (23.0%) |
| 1 Vehicle | 347 (24.8%) | 213 (30.4%) |
| 2 Vehicles | 590 (42.2%) | 327 (46.7%) |
| 3 or more Vehicles | 426 (30.4%) | 0 (0.0%) |
| Total | 1,399 (100.0%) | 701 (100.0%) |
Real Estate & Mortgages in Clintonville
Real Estate and Mortgage Overview in Clintonville
| Characteristic | Without Mortgage | With Mortgage |
| Housing Units | 441 | 958 |
| Median Property Value | $97,900 | $110,000 |
| Median Household Income | $58,651 | $53 |
| Monthly Housing Costs | $502 | $0 |
| Real Estate Taxes | $2,567 | $13 |
Property Value by Mortgage Status in Clintonville
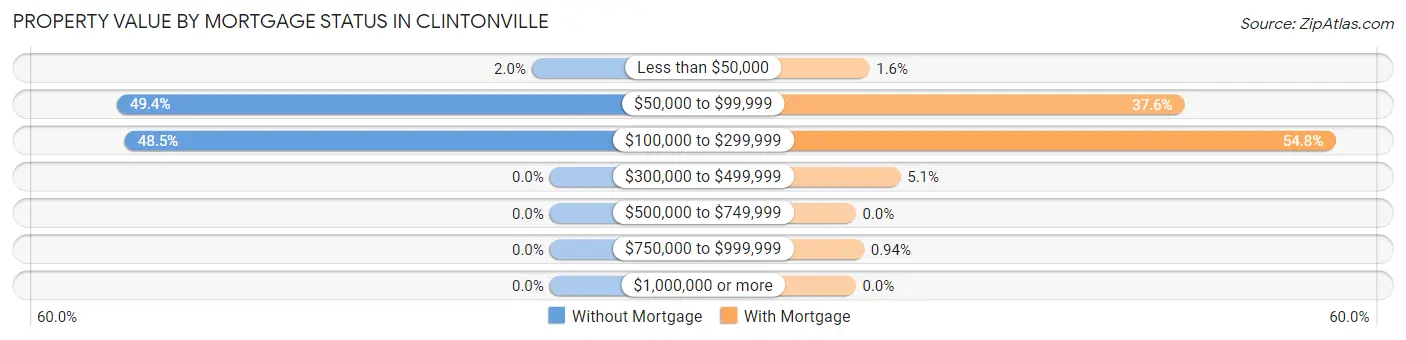
| Property Value | Without Mortgage | With Mortgage |
| Less than $50,000 | 9 (2.0%) | 15 (1.6%) |
| $50,000 to $99,999 | 218 (49.4%) | 360 (37.6%) |
| $100,000 to $299,999 | 214 (48.5%) | 525 (54.8%) |
| $300,000 to $499,999 | 0 (0.0%) | 49 (5.1%) |
| $500,000 to $749,999 | 0 (0.0%) | 0 (0.0%) |
| $750,000 to $999,999 | 0 (0.0%) | 9 (0.9%) |
| $1,000,000 or more | 0 (0.0%) | 0 (0.0%) |
| Total | 441 (100.0%) | 958 (100.0%) |
Household Income by Mortgage Status in Clintonville
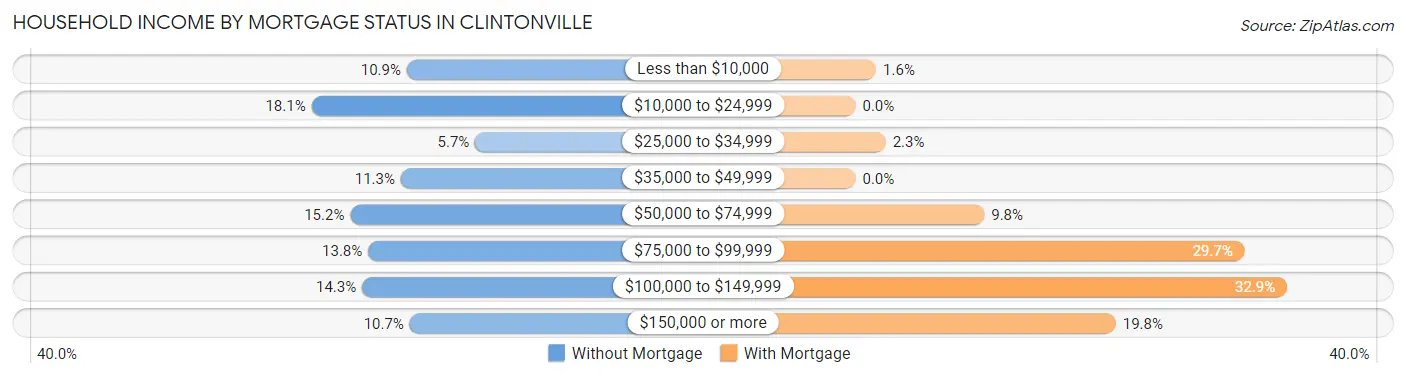
| Household Income | Without Mortgage | With Mortgage |
| Less than $10,000 | 48 (10.9%) | 15 (1.6%) |
| $10,000 to $24,999 | 80 (18.1%) | 0 (0.0%) |
| $25,000 to $34,999 | 25 (5.7%) | 22 (2.3%) |
| $35,000 to $49,999 | 50 (11.3%) | 0 (0.0%) |
| $50,000 to $74,999 | 67 (15.2%) | 94 (9.8%) |
| $75,000 to $99,999 | 61 (13.8%) | 284 (29.6%) |
| $100,000 to $149,999 | 63 (14.3%) | 315 (32.9%) |
| $150,000 or more | 47 (10.7%) | 190 (19.8%) |
| Total | 441 (100.0%) | 958 (100.0%) |
Property Value to Household Income Ratio in Clintonville
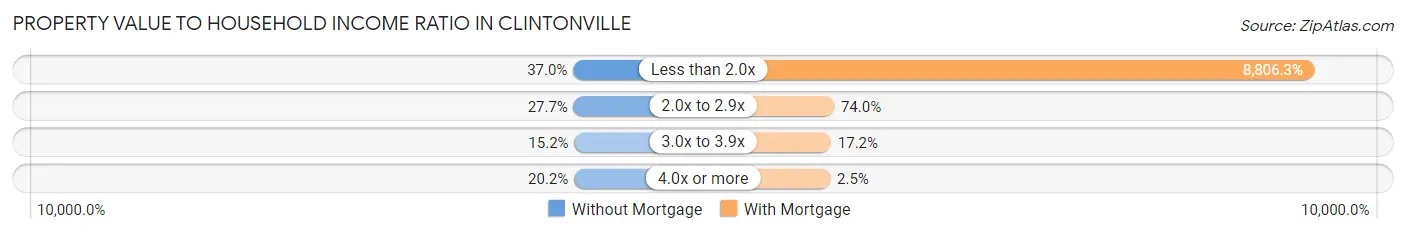
| Value-to-Income Ratio | Without Mortgage | With Mortgage |
| Less than 2.0x | 163 (37.0%) | 84,364 (8,806.3%) |
| 2.0x to 2.9x | 122 (27.7%) | 709 (74.0%) |
| 3.0x to 3.9x | 67 (15.2%) | 165 (17.2%) |
| 4.0x or more | 89 (20.2%) | 24 (2.5%) |
| Total | 441 (100.0%) | 958 (100.0%) |
Real Estate Taxes by Mortgage Status in Clintonville
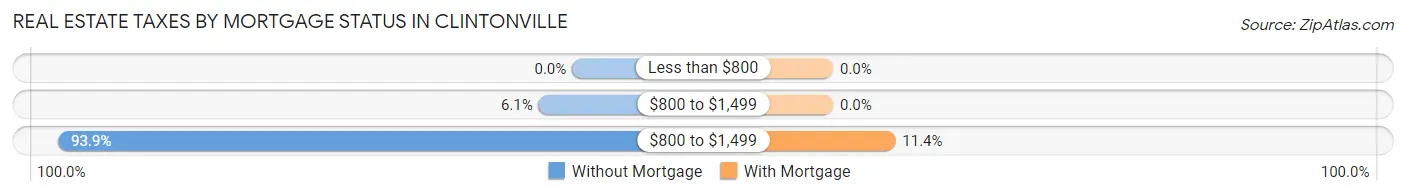
| Property Taxes | Without Mortgage | With Mortgage |
| Less than $800 | 0 (0.0%) | 0 (0.0%) |
| $800 to $1,499 | 27 (6.1%) | 0 (0.0%) |
| $800 to $1,499 | 414 (93.9%) | 109 (11.4%) |
| Total | 441 (100.0%) | 958 (100.0%) |
Health & Disability in Clintonville
Health Insurance Coverage by Age in Clintonville
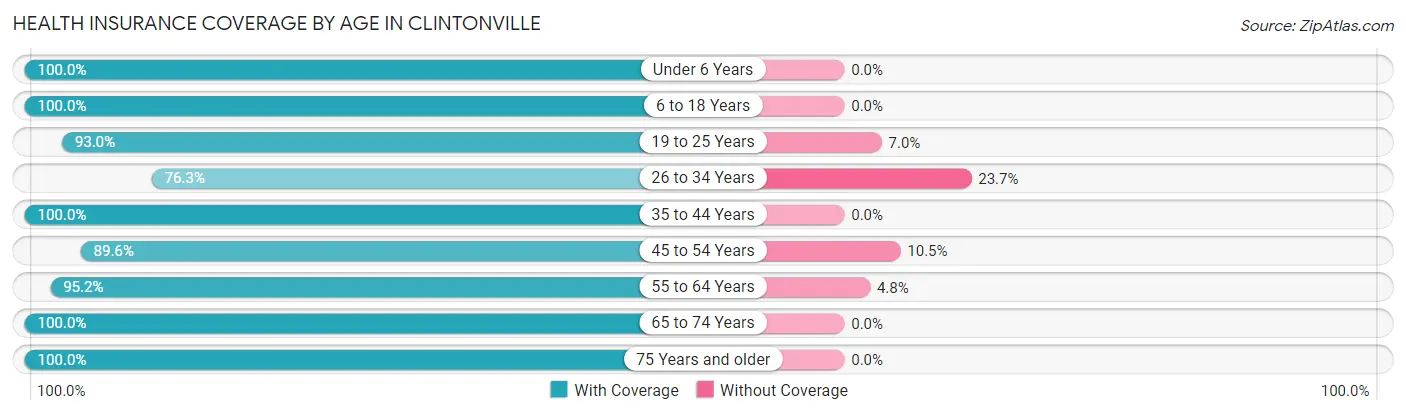
| Age Bracket | With Coverage | Without Coverage |
| Under 6 Years | 326 (100.0%) | 0 (0.0%) |
| 6 to 18 Years | 476 (100.0%) | 0 (0.0%) |
| 19 to 25 Years | 535 (93.0%) | 40 (7.0%) |
| 26 to 34 Years | 519 (76.3%) | 161 (23.7%) |
| 35 to 44 Years | 491 (100.0%) | 0 (0.0%) |
| 45 to 54 Years | 480 (89.5%) | 56 (10.4%) |
| 55 to 64 Years | 657 (95.2%) | 33 (4.8%) |
| 65 to 74 Years | 333 (100.0%) | 0 (0.0%) |
| 75 Years and older | 403 (100.0%) | 0 (0.0%) |
| Total | 4,220 (93.6%) | 290 (6.4%) |
Health Insurance Coverage by Citizenship Status in Clintonville
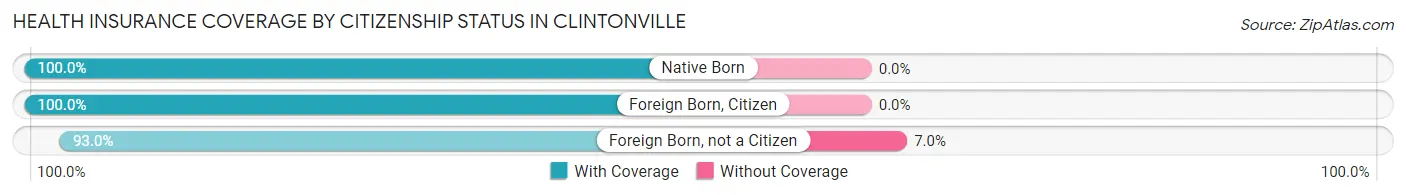
| Citizenship Status | With Coverage | Without Coverage |
| Native Born | 326 (100.0%) | 0 (0.0%) |
| Foreign Born, Citizen | 476 (100.0%) | 0 (0.0%) |
| Foreign Born, not a Citizen | 535 (93.0%) | 40 (7.0%) |
Health Insurance Coverage by Household Income in Clintonville
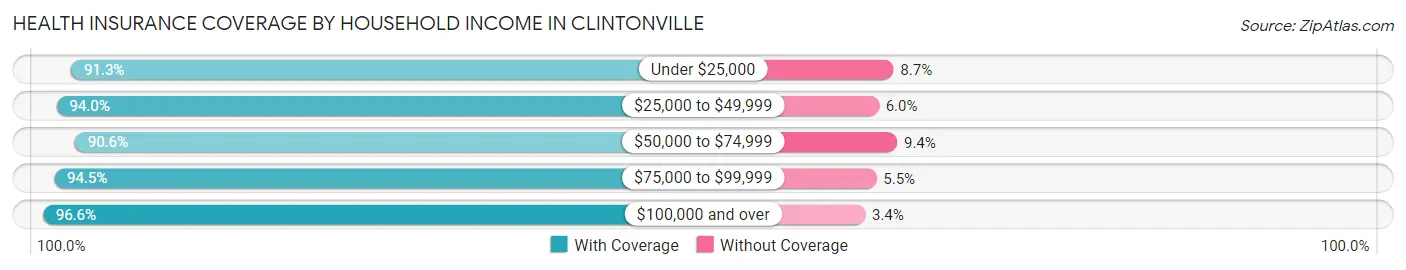
| Household Income | With Coverage | Without Coverage |
| Under $25,000 | 418 (91.3%) | 40 (8.7%) |
| $25,000 to $49,999 | 566 (94.0%) | 36 (6.0%) |
| $50,000 to $74,999 | 1,146 (90.6%) | 119 (9.4%) |
| $75,000 to $99,999 | 954 (94.5%) | 56 (5.5%) |
| $100,000 and over | 1,103 (96.6%) | 39 (3.4%) |
Public vs Private Health Insurance Coverage by Age in Clintonville
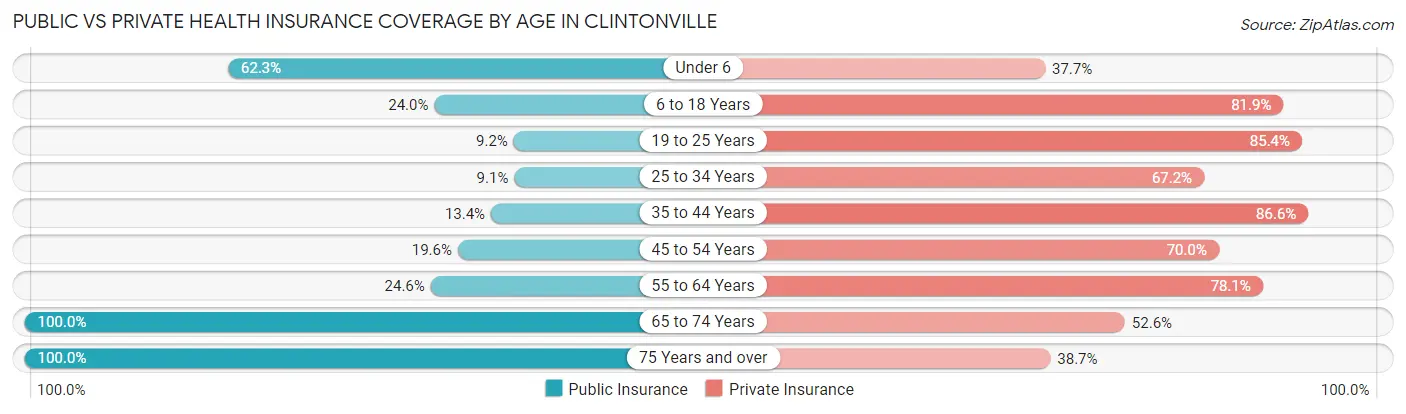
| Age Bracket | Public Insurance | Private Insurance |
| Under 6 | 203 (62.3%) | 123 (37.7%) |
| 6 to 18 Years | 114 (23.9%) | 390 (81.9%) |
| 19 to 25 Years | 53 (9.2%) | 491 (85.4%) |
| 25 to 34 Years | 62 (9.1%) | 457 (67.2%) |
| 35 to 44 Years | 66 (13.4%) | 425 (86.6%) |
| 45 to 54 Years | 105 (19.6%) | 375 (70.0%) |
| 55 to 64 Years | 170 (24.6%) | 539 (78.1%) |
| 65 to 74 Years | 333 (100.0%) | 175 (52.5%) |
| 75 Years and over | 403 (100.0%) | 156 (38.7%) |
| Total | 1,509 (33.5%) | 3,131 (69.4%) |
Disability Status by Sex by Age in Clintonville
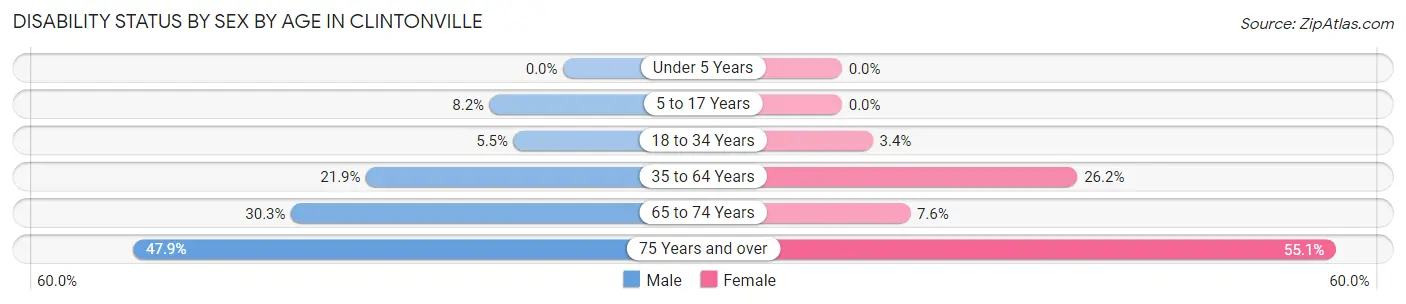
| Age Bracket | Male | Female |
| Under 5 Years | 0 (0.0%) | 0 (0.0%) |
| 5 to 17 Years | 18 (8.2%) | 0 (0.0%) |
| 18 to 34 Years | 34 (5.5%) | 24 (3.4%) |
| 35 to 64 Years | 206 (21.9%) | 204 (26.2%) |
| 65 to 74 Years | 53 (30.3%) | 12 (7.6%) |
| 75 Years and over | 46 (47.9%) | 169 (55.0%) |
Disability Class by Sex by Age in Clintonville
Disability Class: Hearing Difficulty
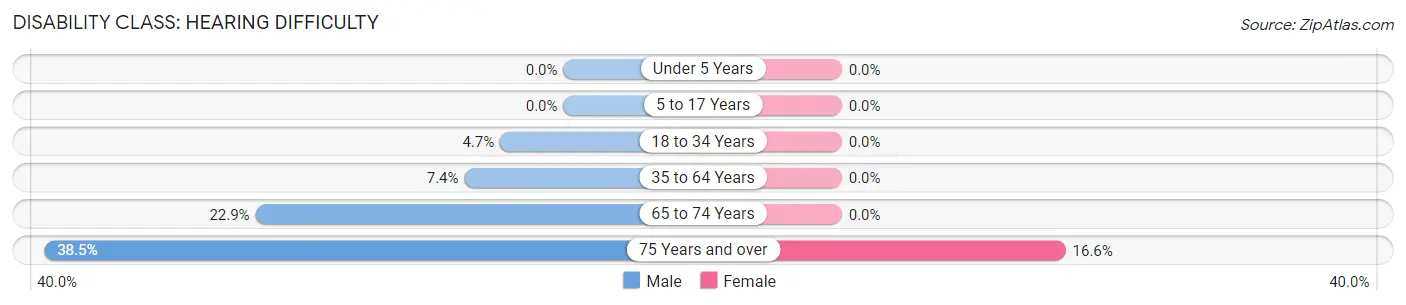
| Age Bracket | Male | Female |
| Under 5 Years | 0 (0.0%) | 0 (0.0%) |
| 5 to 17 Years | 0 (0.0%) | 0 (0.0%) |
| 18 to 34 Years | 29 (4.7%) | 0 (0.0%) |
| 35 to 64 Years | 69 (7.3%) | 0 (0.0%) |
| 65 to 74 Years | 40 (22.9%) | 0 (0.0%) |
| 75 Years and over | 37 (38.5%) | 51 (16.6%) |
Disability Class: Vision Difficulty
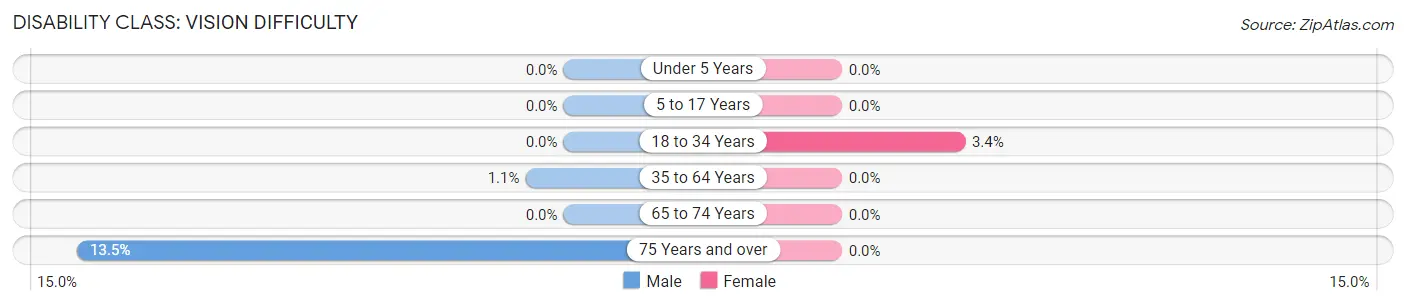
| Age Bracket | Male | Female |
| Under 5 Years | 0 (0.0%) | 0 (0.0%) |
| 5 to 17 Years | 0 (0.0%) | 0 (0.0%) |
| 18 to 34 Years | 0 (0.0%) | 24 (3.4%) |
| 35 to 64 Years | 10 (1.1%) | 0 (0.0%) |
| 65 to 74 Years | 0 (0.0%) | 0 (0.0%) |
| 75 Years and over | 13 (13.5%) | 0 (0.0%) |
Disability Class: Cognitive Difficulty
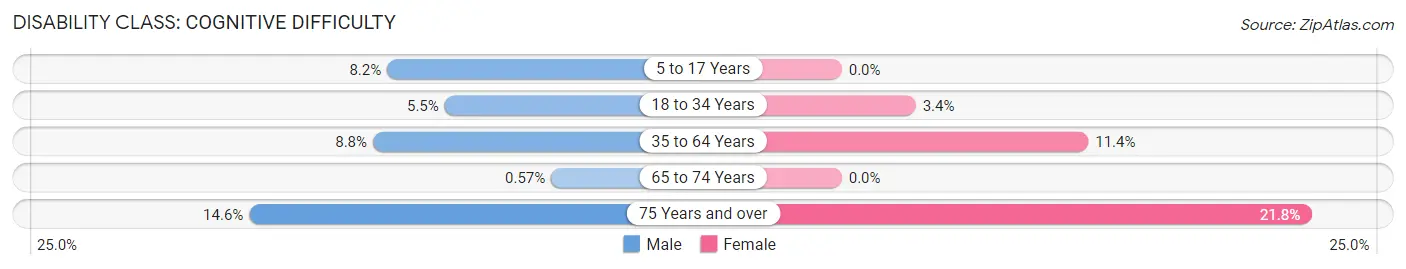
| Age Bracket | Male | Female |
| 5 to 17 Years | 18 (8.2%) | 0 (0.0%) |
| 18 to 34 Years | 34 (5.5%) | 24 (3.4%) |
| 35 to 64 Years | 83 (8.8%) | 89 (11.4%) |
| 65 to 74 Years | 1 (0.6%) | 0 (0.0%) |
| 75 Years and over | 14 (14.6%) | 67 (21.8%) |
Disability Class: Ambulatory Difficulty
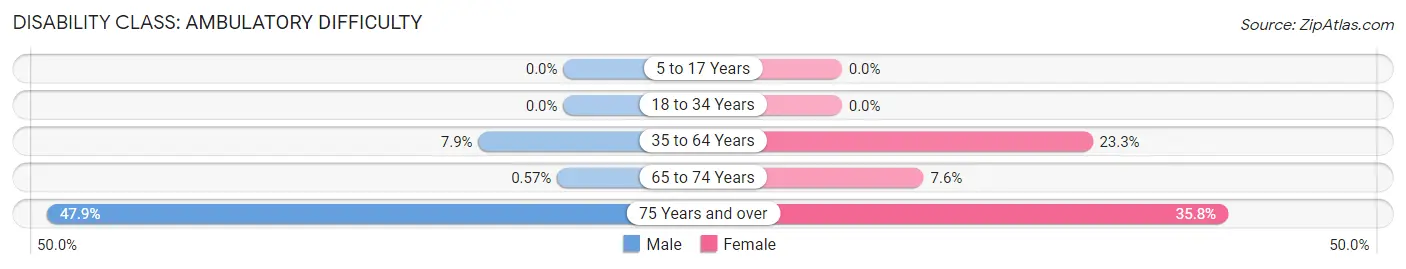
| Age Bracket | Male | Female |
| 5 to 17 Years | 0 (0.0%) | 0 (0.0%) |
| 18 to 34 Years | 0 (0.0%) | 0 (0.0%) |
| 35 to 64 Years | 74 (7.9%) | 181 (23.3%) |
| 65 to 74 Years | 1 (0.6%) | 12 (7.6%) |
| 75 Years and over | 46 (47.9%) | 110 (35.8%) |
Disability Class: Self-Care Difficulty
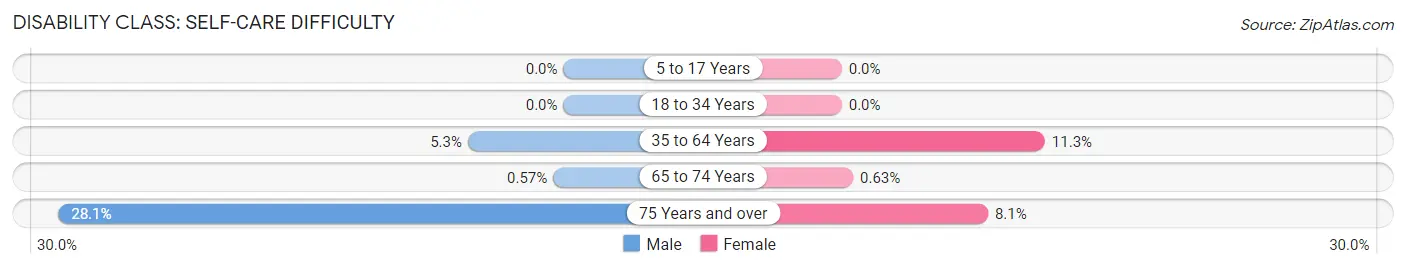
| Age Bracket | Male | Female |
| 5 to 17 Years | 0 (0.0%) | 0 (0.0%) |
| 18 to 34 Years | 0 (0.0%) | 0 (0.0%) |
| 35 to 64 Years | 50 (5.3%) | 88 (11.3%) |
| 65 to 74 Years | 1 (0.6%) | 1 (0.6%) |
| 75 Years and over | 27 (28.1%) | 25 (8.1%) |
Technology Access in Clintonville
Computing Device Access in Clintonville
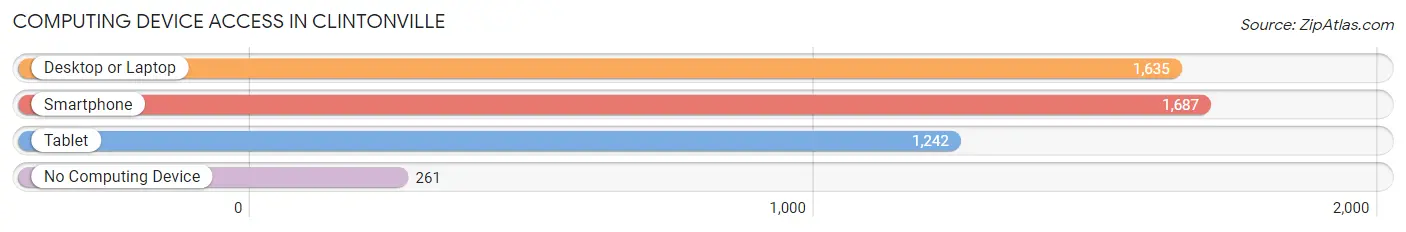
| Device Type | # Households | % Households |
| Desktop or Laptop | 1,635 | 77.9% |
| Smartphone | 1,687 | 80.3% |
| Tablet | 1,242 | 59.1% |
| No Computing Device | 261 | 12.4% |
| Total | 2,100 | 100.0% |
Internet Access in Clintonville
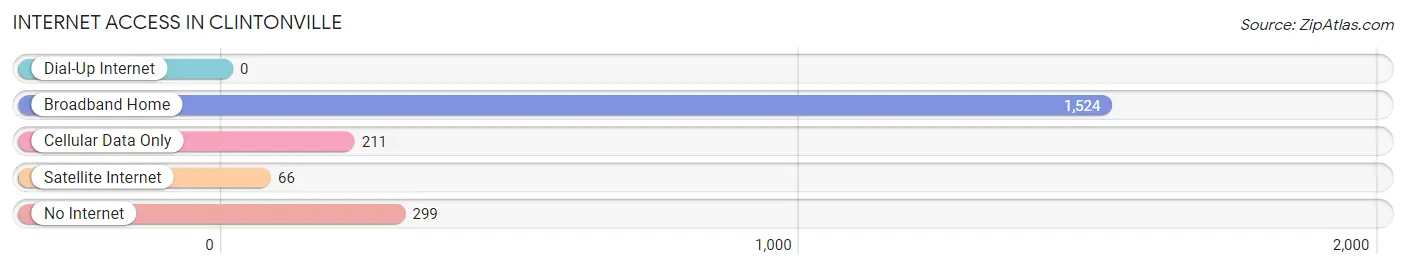
| Internet Type | # Households | % Households |
| Dial-Up Internet | 0 | 0.0% |
| Broadband Home | 1,524 | 72.6% |
| Cellular Data Only | 211 | 10.1% |
| Satellite Internet | 66 | 3.1% |
| No Internet | 299 | 14.2% |
| Total | 2,100 | 100.0% |
Clintonville Summary
History
The area now known as Clintonville, Wisconsin was first settled in the late 1840s by a group of German immigrants. The town was originally called “New Berlin” and was located in the Town of Larrabee, Waupaca County. The first post office was established in 1854 and the name was changed to Clintonville in 1856. The name was chosen to honor DeWitt Clinton, the former governor of New York.
The first industry in Clintonville was a sawmill, which was built in 1856. This was followed by a grist mill in 1858 and a woolen mill in 1864. The town grew rapidly in the late 19th century, with the population reaching 1,000 by 1900.
The first railroad arrived in Clintonville in 1871, connecting the town to the larger cities of Waupaca and Shawano. This allowed for the growth of the lumber industry, which was the main industry in the area for many years.
In the early 20th century, Clintonville became a center for the dairy industry. The first cheese factory was built in 1906 and the first creamery in 1908. The town also became a center for the production of butter and cheese.
Geography
Clintonville is located in the north-central part of Wisconsin, in Waupaca County. The town is situated on the Wolf River, which flows through the center of town. The town is surrounded by rolling hills and forests, and is located about 40 miles northwest of Green Bay.
The town covers an area of 4.2 square miles, with a population of 4,559 as of the 2010 census. The town is located at an elevation of 890 feet above sea level.
Economy
The economy of Clintonville is largely based on agriculture and manufacturing. The town is home to several dairy farms, as well as a number of cheese factories. The town is also home to several manufacturing companies, including a paper mill, a furniture factory, and a plastics factory.
The town is also home to several retail stores, including a grocery store, a hardware store, and a variety of specialty shops. The town also has a number of restaurants, bars, and other businesses.
Demographics
As of the 2010 census, the population of Clintonville was 4,559. The racial makeup of the town was 97.2% White, 0.4% African American, 0.3% Native American, 0.4% Asian, 0.1% Pacific Islander, 0.7% from other races, and 0.9% from two or more races. Hispanic or Latino of any race were 1.7% of the population.
The median household income in Clintonville was $45,938, and the median family income was $54,917. The per capita income was $21,945. About 8.2% of families and 10.2% of the population were below the poverty line, including 14.2% of those under age 18 and 6.2% of those age 65 or over.
Common Questions
What is Per Capita Income in Clintonville?
Per Capita income in Clintonville is $33,646.
What is the Median Family Income in Clintonville?
Median Family Income in Clintonville is $71,339.
What is the Median Household income in Clintonville?
Median Household Income in Clintonville is $58,377.
What is Income or Wage Gap in Clintonville?
Income or Wage Gap in Clintonville is 39.8%.
Women in Clintonville earn 60.2 cents for every dollar earned by a man.
What is Inequality or Gini Index in Clintonville?
Inequality or Gini Index in Clintonville is 0.38.
What is the Total Population of Clintonville?
Total Population of Clintonville is 4,549.
What is the Total Male Population of Clintonville?
Total Male Population of Clintonville is 2,265.
What is the Total Female Population of Clintonville?
Total Female Population of Clintonville is 2,284.
What is the Ratio of Males per 100 Females in Clintonville?
There are 99.17 Males per 100 Females in Clintonville.
What is the Ratio of Females per 100 Males in Clintonville?
There are 100.84 Females per 100 Males in Clintonville.
What is the Median Population Age in Clintonville?
Median Population Age in Clintonville is 38.8 Years.
What is the Average Family Size in Clintonville
Average Family Size in Clintonville is 2.7 People.
What is the Average Household Size in Clintonville
Average Household Size in Clintonville is 2.1 People.
How Large is the Labor Force in Clintonville?
There are 2,489 People in the Labor Forcein in Clintonville.
What is the Percentage of People in the Labor Force in Clintonville?
63.3% of People are in the Labor Force in Clintonville.
What is the Unemployment Rate in Clintonville?
Unemployment Rate in Clintonville is 3.3%.