Mosinee, WI Map & Demographics
Mosinee Map
Mosinee Overview
$37,505
PER CAPITA INCOME
$86,250
AVG FAMILY INCOME
$68,219
AVG HOUSEHOLD INCOME
23.5%
WAGE / INCOME GAP [ % ]
76.5¢/ $1
WAGE / INCOME GAP [ $ ]
0.37
INEQUALITY / GINI INDEX
4,467
TOTAL POPULATION
2,106
MALE POPULATION
2,361
FEMALE POPULATION
89.20
MALES / 100 FEMALES
112.11
FEMALES / 100 MALES
35.2
MEDIAN AGE
2.7
AVG FAMILY SIZE
2.1
AVG HOUSEHOLD SIZE
2,666
LABOR FORCE [ PEOPLE ]
68.8%
PERCENT IN LABOR FORCE
0.1%
UNEMPLOYMENT RATE
Mosinee Zip Codes
Mosinee Area Codes
Income in Mosinee
Income Overview in Mosinee
Per Capita Income in Mosinee is $37,505, while median incomes of families and households are $86,250 and $68,219 respectively.
| Characteristic | Number | Measure |
| Per Capita Income | 4,467 | $37,505 |
| Median Family Income | 1,005 | $86,250 |
| Mean Family Income | 1,005 | $97,019 |
| Median Household Income | 2,131 | $68,219 |
| Mean Household Income | 2,131 | $76,778 |
| Income Deficit | 1,005 | $0 |
| Wage / Income Gap (%) | 4,467 | 23.53% |
| Wage / Income Gap ($) | 4,467 | 76.47¢ per $1 |
| Gini / Inequality Index | 4,467 | 0.37 |
Earnings by Sex in Mosinee
Average Earnings in Mosinee are $46,098, $51,284 for men and $39,217 for women, a difference of 23.5%.
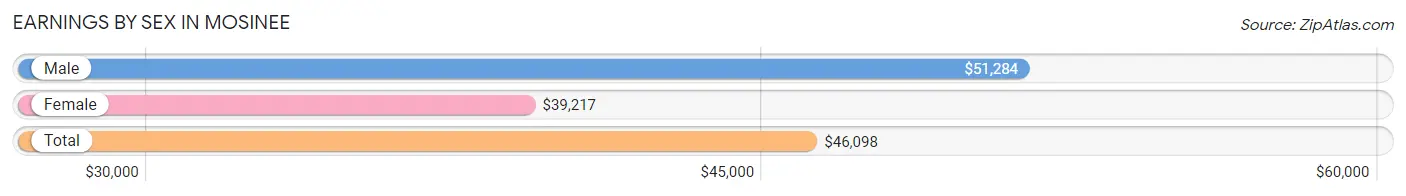
| Sex | Number | Average Earnings |
| Male | 1,401 (50.2%) | $51,284 |
| Female | 1,389 (49.8%) | $39,217 |
| Total | 2,790 (100.0%) | $46,098 |
Earnings by Sex by Income Bracket in Mosinee
The most common earnings brackets in Mosinee are $45,000 to $49,999 for men (205 | 14.6%) and $25,000 to $29,999 for women (194 | 14.0%).
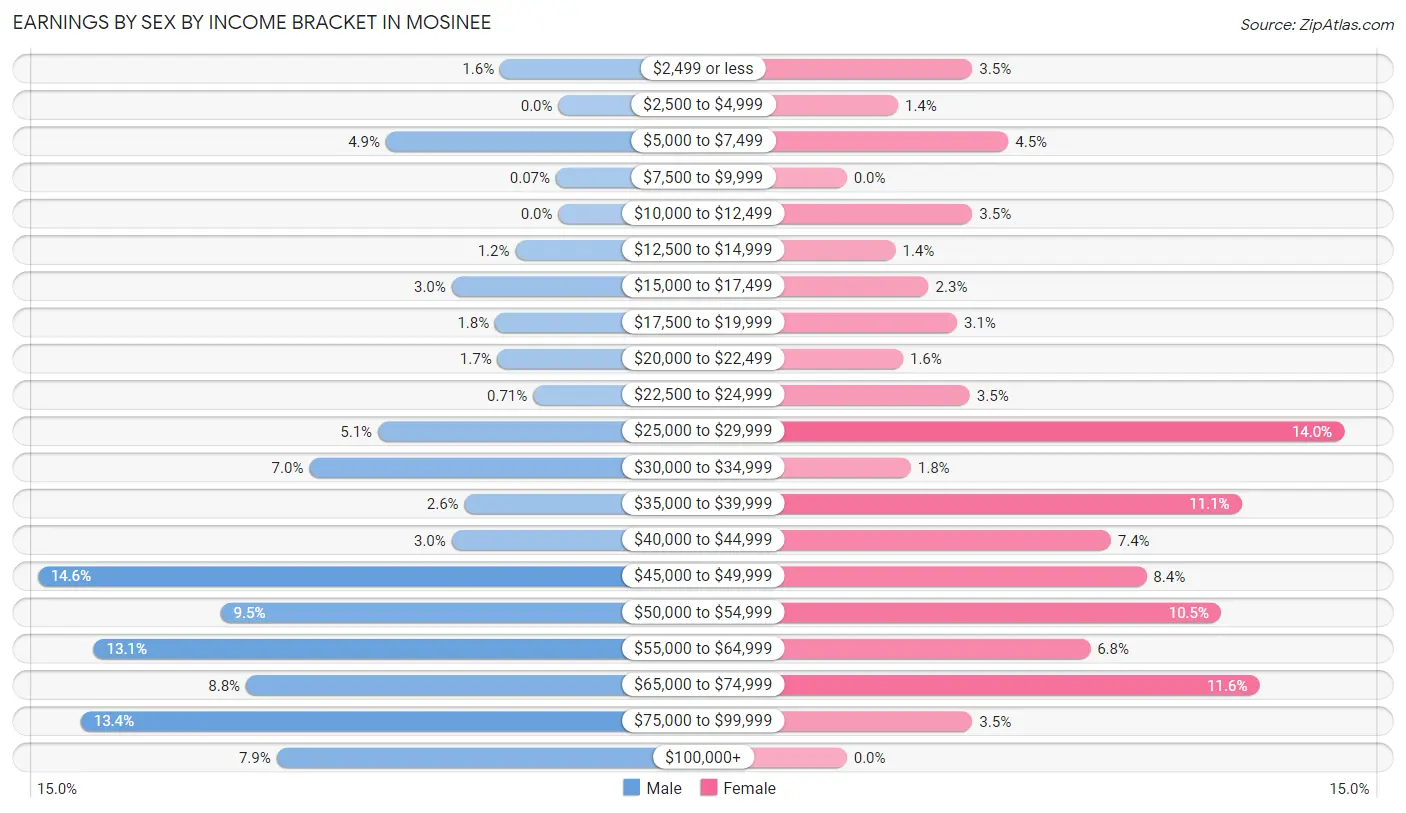
| Income | Male | Female |
| $2,499 or less | 23 (1.6%) | 49 (3.5%) |
| $2,500 to $4,999 | 0 (0.0%) | 20 (1.4%) |
| $5,000 to $7,499 | 68 (4.9%) | 63 (4.5%) |
| $7,500 to $9,999 | 1 (0.1%) | 0 (0.0%) |
| $10,000 to $12,499 | 0 (0.0%) | 49 (3.5%) |
| $12,500 to $14,999 | 17 (1.2%) | 19 (1.4%) |
| $15,000 to $17,499 | 42 (3.0%) | 32 (2.3%) |
| $17,500 to $19,999 | 25 (1.8%) | 43 (3.1%) |
| $20,000 to $22,499 | 24 (1.7%) | 22 (1.6%) |
| $22,500 to $24,999 | 10 (0.7%) | 48 (3.5%) |
| $25,000 to $29,999 | 71 (5.1%) | 194 (14.0%) |
| $30,000 to $34,999 | 98 (7.0%) | 25 (1.8%) |
| $35,000 to $39,999 | 37 (2.6%) | 154 (11.1%) |
| $40,000 to $44,999 | 42 (3.0%) | 103 (7.4%) |
| $45,000 to $49,999 | 205 (14.6%) | 117 (8.4%) |
| $50,000 to $54,999 | 133 (9.5%) | 146 (10.5%) |
| $55,000 to $64,999 | 183 (13.1%) | 95 (6.8%) |
| $65,000 to $74,999 | 123 (8.8%) | 161 (11.6%) |
| $75,000 to $99,999 | 188 (13.4%) | 49 (3.5%) |
| $100,000+ | 111 (7.9%) | 0 (0.0%) |
| Total | 1,401 (100.0%) | 1,389 (100.0%) |
Earnings by Sex by Educational Attainment in Mosinee
Average earnings in Mosinee are $53,708 for men and $47,716 for women, a difference of 11.2%. Men with an educational attainment of graduate degree enjoy the highest average annual earnings of $80,658, while those with high school diploma education earn the least with $46,576. Women with an educational attainment of bachelor's degree earn the most with the average annual earnings of $53,063, while those with high school diploma education have the smallest earnings of $34,732.
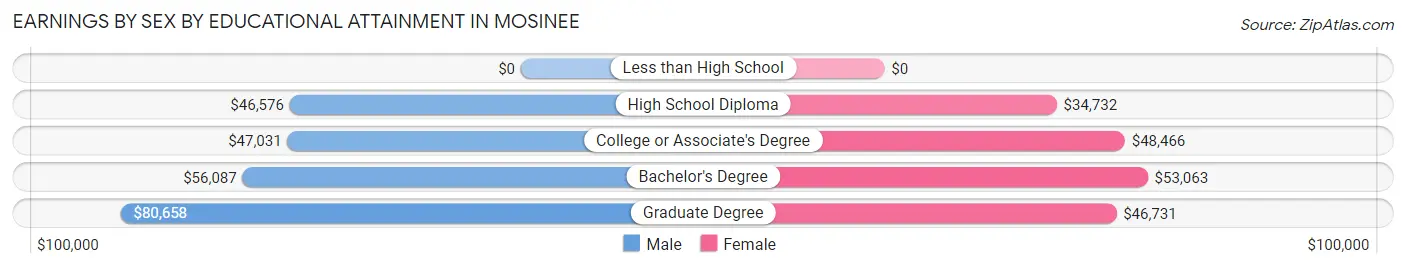
| Educational Attainment | Male Income | Female Income |
| Less than High School | - | - |
| High School Diploma | $46,576 | $34,732 |
| College or Associate's Degree | $47,031 | $48,466 |
| Bachelor's Degree | $56,087 | $53,063 |
| Graduate Degree | $80,658 | $46,731 |
| Total | $53,708 | $47,716 |
Family Income in Mosinee
Family Income Brackets in Mosinee
According to the Mosinee family income data, there are 265 families falling into the $100,000 to $149,999 income range, which is the most common income bracket and makes up 26.4% of all families. Conversely, the $15,000 to $24,999 income bracket is the least frequent group with only 15 families (1.5%) belonging to this category.
| Income Bracket | # Families | % Families |
| Less than $10,000 | 21 | 2.1% |
| $10,000 to $14,999 | 17 | 1.7% |
| $15,000 to $24,999 | 15 | 1.5% |
| $25,000 to $34,999 | 100 | 10.0% |
| $35,000 to $49,999 | 53 | 5.3% |
| $50,000 to $74,999 | 208 | 20.7% |
| $75,000 to $99,999 | 153 | 15.2% |
| $100,000 to $149,999 | 265 | 26.4% |
| $150,000 to $199,999 | 155 | 15.4% |
| $200,000+ | 18 | 1.8% |
Family Income by Famaliy Size in Mosinee
4-person families (156 | 15.5%) account for the highest median family income in Mosinee with $119,583 per family, while 2-person families (531 | 52.8%) have the highest median income of $35,352 per family member.
| Income Bracket | # Families | Median Income |
| 2-Person Families | 531 (52.8%) | $70,703 |
| 3-Person Families | 277 (27.6%) | $85,197 |
| 4-Person Families | 156 (15.5%) | $119,583 |
| 5-Person Families | 41 (4.1%) | $0 |
| 6-Person Families | 0 (0.0%) | $0 |
| 7+ Person Families | 0 (0.0%) | $0 |
| Total | 1,005 (100.0%) | $86,250 |
Family Income by Number of Earners in Mosinee
The median family income in Mosinee is $86,250, with families comprising 3+ earners (139) having the highest median family income of $159,358, while families with no earners (125) have the lowest median family income of $57,697, accounting for 13.8% and 12.4% of families, respectively.
| Number of Earners | # Families | Median Income |
| No Earners | 125 (12.4%) | $57,697 |
| 1 Earner | 348 (34.6%) | $73,041 |
| 2 Earners | 393 (39.1%) | $114,306 |
| 3+ Earners | 139 (13.8%) | $159,358 |
| Total | 1,005 (100.0%) | $86,250 |
Household Income in Mosinee
Household Income Brackets in Mosinee
With 422 households falling in the category, the $50,000 to $74,999 income range is the most frequent in Mosinee, accounting for 19.8% of all households. In contrast, only 34 households (1.6%) fall into the $200,000+ income bracket, making it the least populous group.
| Income Bracket | # Households | % Households |
| Less than $10,000 | 81 | 3.8% |
| $10,000 to $14,999 | 70 | 3.3% |
| $15,000 to $24,999 | 83 | 3.9% |
| $25,000 to $34,999 | 254 | 11.9% |
| $35,000 to $49,999 | 279 | 13.1% |
| $50,000 to $74,999 | 422 | 19.8% |
| $75,000 to $99,999 | 349 | 16.4% |
| $100,000 to $149,999 | 375 | 17.6% |
| $150,000 to $199,999 | 181 | 8.5% |
| $200,000+ | 34 | 1.6% |
Household Income by Householder Age in Mosinee
The median household income in Mosinee is $68,219, with the highest median household income of $89,861 found in the 45 to 64 years age bracket for the primary householder. A total of 532 households (25.0%) fall into this category. Meanwhile, the 65+ years age bracket for the primary householder has the lowest median household income of $40,968, with 690 households (32.4%) in this group.
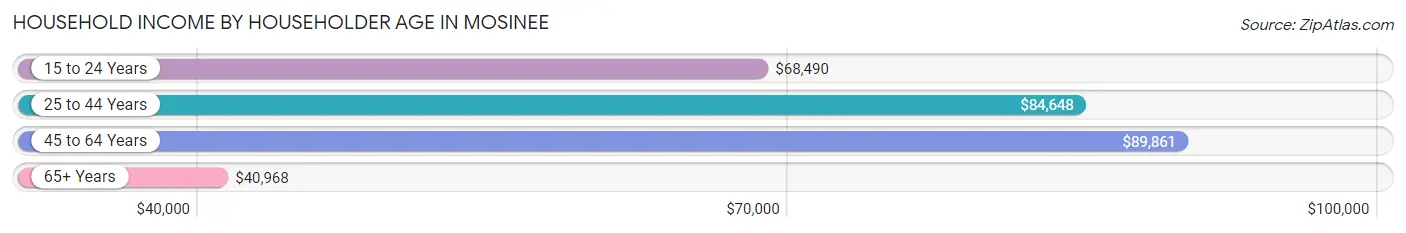
| Income Bracket | # Households | Median Income |
| 15 to 24 Years | 131 (6.1%) | $68,490 |
| 25 to 44 Years | 778 (36.5%) | $84,648 |
| 45 to 64 Years | 532 (25.0%) | $89,861 |
| 65+ Years | 690 (32.4%) | $40,968 |
| Total | 2,131 (100.0%) | $68,219 |
Poverty in Mosinee
Income Below Poverty by Sex and Age in Mosinee
With 2.7% poverty level for males and 10.5% for females among the residents of Mosinee, 55 to 64 year old males and 18 to 24 year old females are the most vulnerable to poverty, with 35 males (13.8%) and 122 females (22.9%) in their respective age groups living below the poverty level.
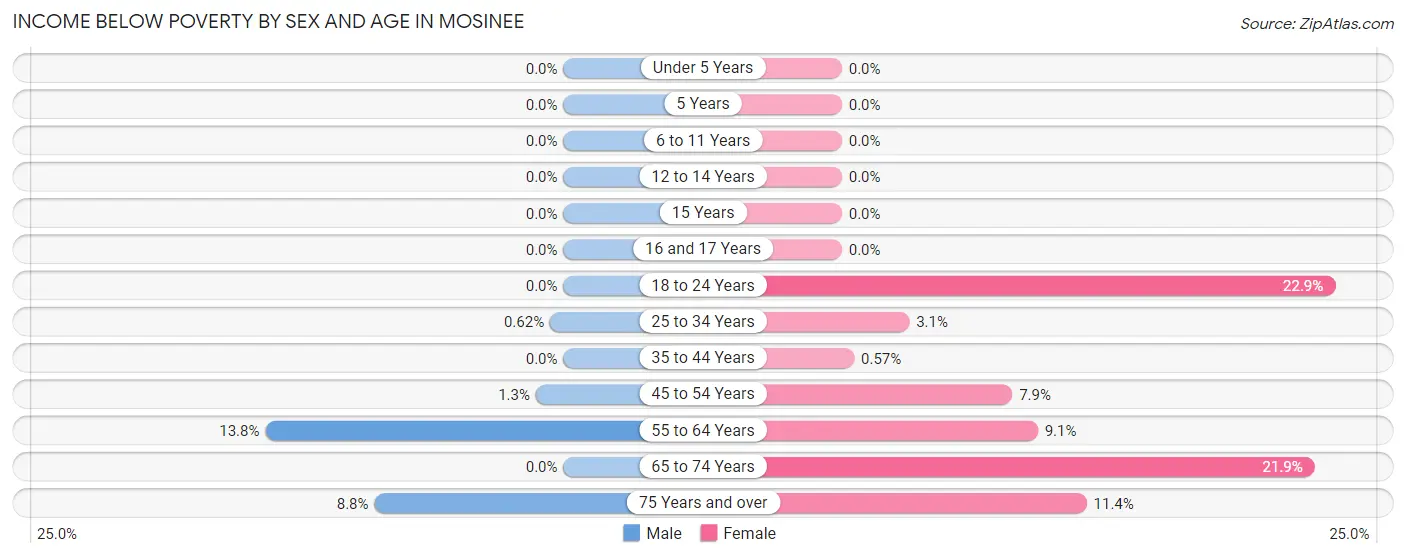
| Age Bracket | Male | Female |
| Under 5 Years | 0 (0.0%) | 0 (0.0%) |
| 5 Years | 0 (0.0%) | 0 (0.0%) |
| 6 to 11 Years | 0 (0.0%) | 0 (0.0%) |
| 12 to 14 Years | 0 (0.0%) | 0 (0.0%) |
| 15 Years | 0 (0.0%) | 0 (0.0%) |
| 16 and 17 Years | 0 (0.0%) | 0 (0.0%) |
| 18 to 24 Years | 0 (0.0%) | 122 (22.9%) |
| 25 to 34 Years | 3 (0.6%) | 13 (3.1%) |
| 35 to 44 Years | 0 (0.0%) | 1 (0.6%) |
| 45 to 54 Years | 4 (1.3%) | 17 (7.9%) |
| 55 to 64 Years | 35 (13.8%) | 21 (9.1%) |
| 65 to 74 Years | 0 (0.0%) | 43 (21.9%) |
| 75 Years and over | 15 (8.8%) | 30 (11.4%) |
| Total | 57 (2.7%) | 247 (10.5%) |
Income Above Poverty by Sex and Age in Mosinee
According to the poverty statistics in Mosinee, males aged under 5 years and females aged under 5 years are the age groups that are most secure financially, with 100.0% of males and 100.0% of females in these age groups living above the poverty line.
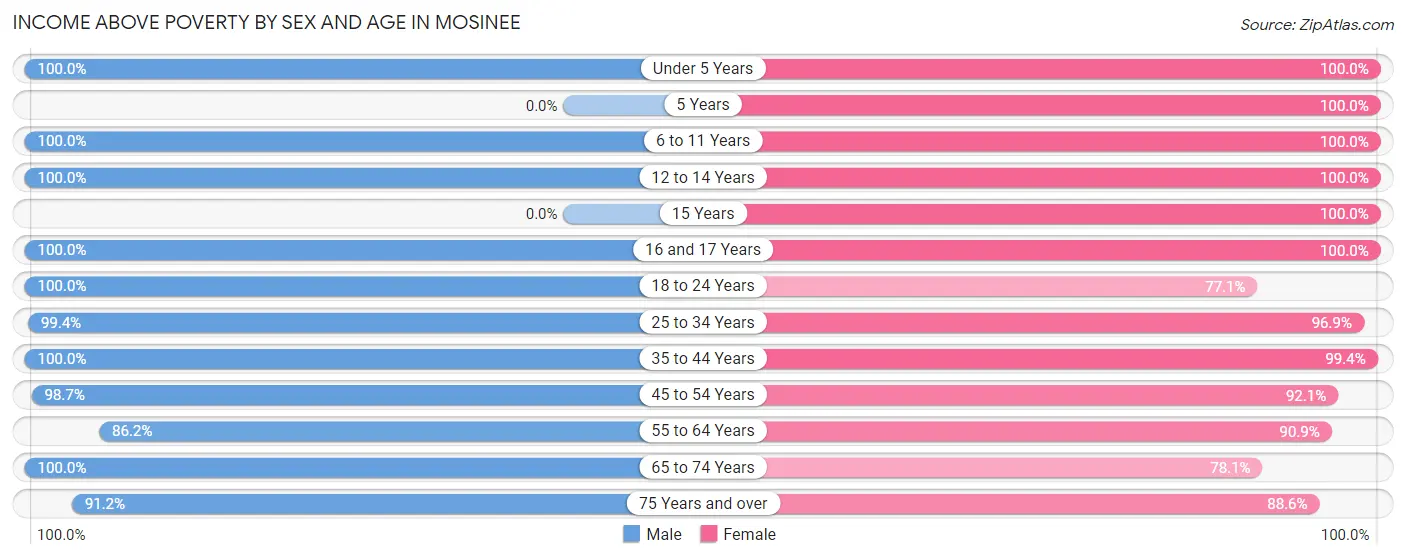
| Age Bracket | Male | Female |
| Under 5 Years | 81 (100.0%) | 92 (100.0%) |
| 5 Years | 0 (0.0%) | 39 (100.0%) |
| 6 to 11 Years | 167 (100.0%) | 78 (100.0%) |
| 12 to 14 Years | 51 (100.0%) | 49 (100.0%) |
| 15 Years | 0 (0.0%) | 35 (100.0%) |
| 16 and 17 Years | 29 (100.0%) | 38 (100.0%) |
| 18 to 24 Years | 129 (100.0%) | 411 (77.1%) |
| 25 to 34 Years | 479 (99.4%) | 402 (96.9%) |
| 35 to 44 Years | 221 (100.0%) | 175 (99.4%) |
| 45 to 54 Years | 309 (98.7%) | 198 (92.1%) |
| 55 to 64 Years | 218 (86.2%) | 210 (90.9%) |
| 65 to 74 Years | 209 (100.0%) | 153 (78.1%) |
| 75 Years and over | 156 (91.2%) | 234 (88.6%) |
| Total | 2,049 (97.3%) | 2,114 (89.5%) |
Income Below Poverty Among Married-Couple Families in Mosinee
The poverty statistics for married-couple families in Mosinee show that 2.8% or 21 of the total 761 families live below the poverty line. Families with no children have the highest poverty rate of 4.4%, comprising of 21 families. On the other hand, families with 1 or 2 children have the lowest poverty rate of 0.0%, which includes 0 families.
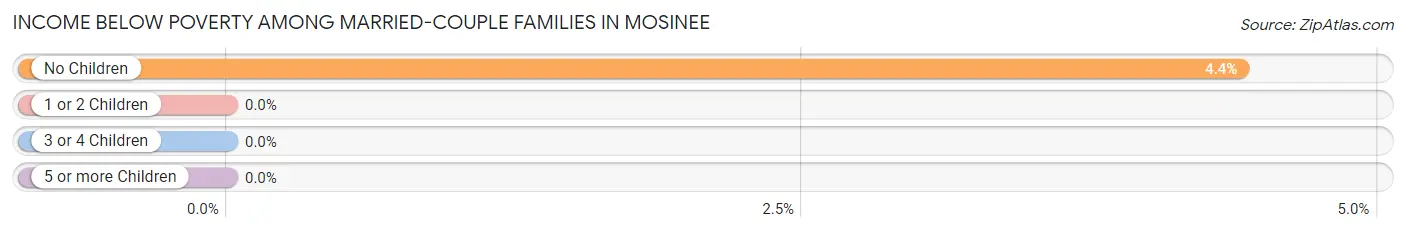
| Children | Above Poverty | Below Poverty |
| No Children | 456 (95.6%) | 21 (4.4%) |
| 1 or 2 Children | 243 (100.0%) | 0 (0.0%) |
| 3 or 4 Children | 41 (100.0%) | 0 (0.0%) |
| 5 or more Children | 0 (0.0%) | 0 (0.0%) |
| Total | 740 (97.2%) | 21 (2.8%) |
Income Below Poverty Among Single-Parent Households in Mosinee
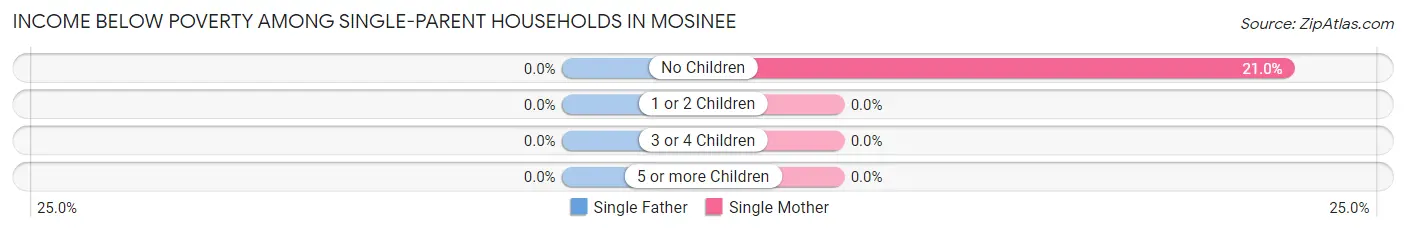
| Children | Single Father | Single Mother |
| No Children | 0 (0.0%) | 17 (21.0%) |
| 1 or 2 Children | 0 (0.0%) | 0 (0.0%) |
| 3 or 4 Children | 0 (0.0%) | 0 (0.0%) |
| 5 or more Children | 0 (0.0%) | 0 (0.0%) |
| Total | 0 (0.0%) | 17 (9.3%) |
Income Below Poverty Among Married-Couple vs Single-Parent Households in Mosinee
The poverty data for Mosinee shows that 21 of the married-couple family households (2.8%) and 17 of the single-parent households (7.0%) are living below the poverty level. Within the married-couple family households, those with no children have the highest poverty rate, with 21 households (4.4%) falling below the poverty line. Among the single-parent households, those with no children have the highest poverty rate, with 17 household (17.2%) living below poverty.
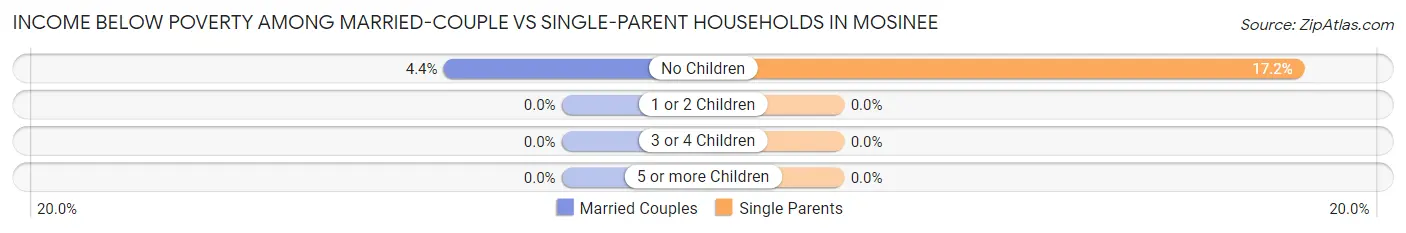
| Children | Married-Couple Families | Single-Parent Households |
| No Children | 21 (4.4%) | 17 (17.2%) |
| 1 or 2 Children | 0 (0.0%) | 0 (0.0%) |
| 3 or 4 Children | 0 (0.0%) | 0 (0.0%) |
| 5 or more Children | 0 (0.0%) | 0 (0.0%) |
| Total | 21 (2.8%) | 17 (7.0%) |
Race in Mosinee
The most populous races in Mosinee are White / Caucasian (4,336 | 97.1%), Asian (82 | 1.8%), and Two or more Races (49 | 1.1%).
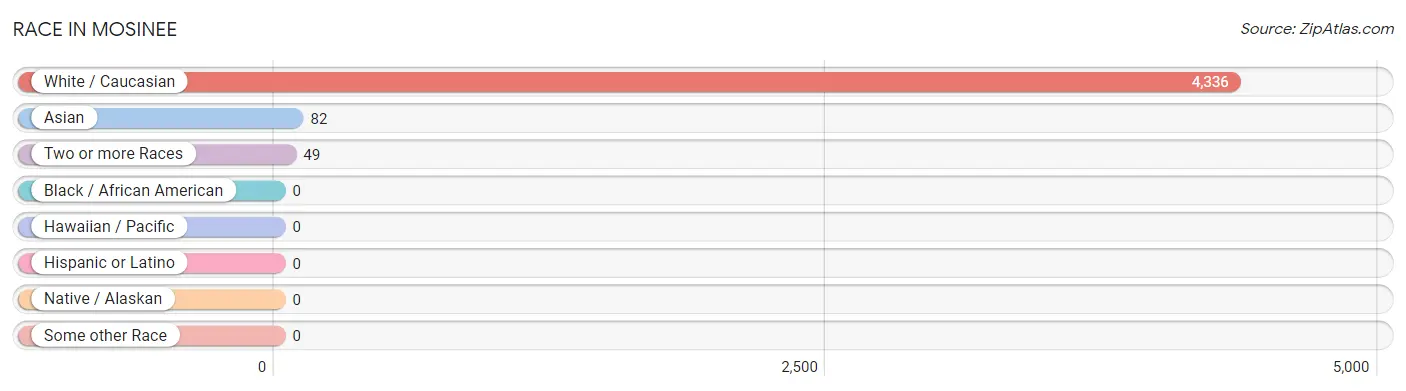
| Race | # Population | % Population |
| Asian | 82 | 1.8% |
| Black / African American | 0 | 0.0% |
| Hawaiian / Pacific | 0 | 0.0% |
| Hispanic or Latino | 0 | 0.0% |
| Native / Alaskan | 0 | 0.0% |
| White / Caucasian | 4,336 | 97.1% |
| Two or more Races | 49 | 1.1% |
| Some other Race | 0 | 0.0% |
| Total | 4,467 | 100.0% |
Ancestry in Mosinee
The most populous ancestries reported in Mosinee are German (2,078 | 46.5%), Polish (1,140 | 25.5%), Irish (464 | 10.4%), English (208 | 4.7%), and American (192 | 4.3%), together accounting for 91.4% of all Mosinee residents.
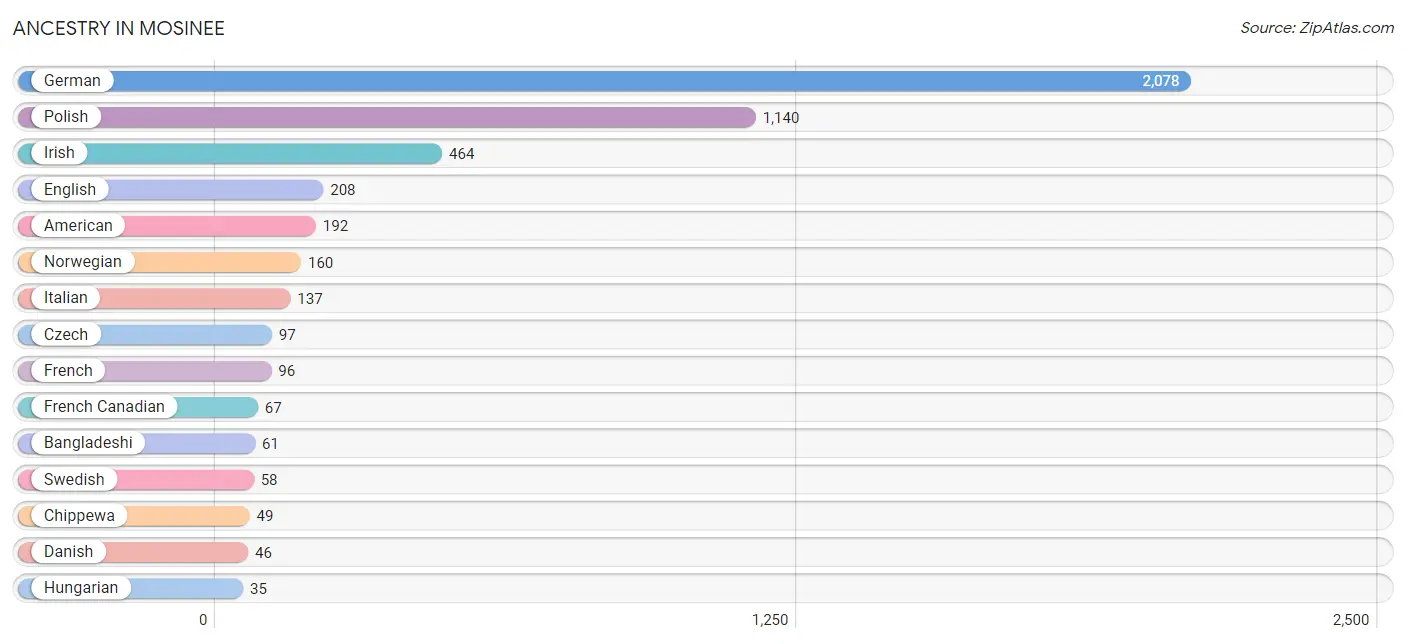
| Ancestry | # Population | % Population |
| American | 192 | 4.3% |
| Bangladeshi | 61 | 1.4% |
| Chippewa | 49 | 1.1% |
| Croatian | 26 | 0.6% |
| Czech | 97 | 2.2% |
| Danish | 46 | 1.0% |
| English | 208 | 4.7% |
| French | 96 | 2.1% |
| French Canadian | 67 | 1.5% |
| German | 2,078 | 46.5% |
| Greek | 2 | 0.0% |
| Hungarian | 35 | 0.8% |
| Indian (Asian) | 21 | 0.5% |
| Irish | 464 | 10.4% |
| Italian | 137 | 3.1% |
| Lithuanian | 20 | 0.4% |
| Norwegian | 160 | 3.6% |
| Polish | 1,140 | 25.5% |
| Swedish | 58 | 1.3% |
| Welsh | 18 | 0.4% | View All 20 Rows |
Immigrants in Mosinee
The most numerous immigrant groups reported in Mosinee came from Asia (21 | 0.5%), China (21 | 0.5%), Eastern Asia (21 | 0.5%), Europe (9 | 0.2%), and Eastern Europe (7 | 0.2%), together accounting for 1.8% of all Mosinee residents.
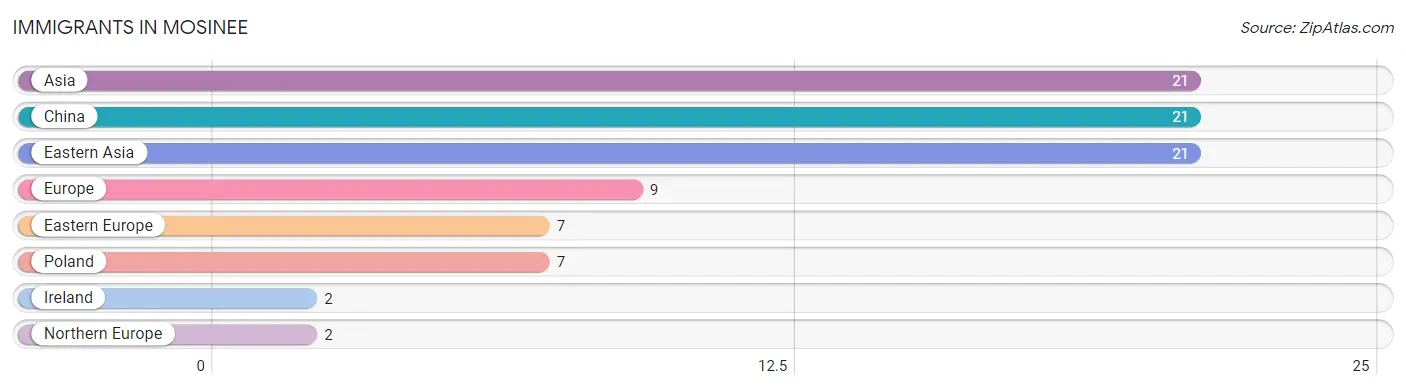
| Immigration Origin | # Population | % Population |
| Asia | 21 | 0.5% |
| China | 21 | 0.5% |
| Eastern Asia | 21 | 0.5% |
| Eastern Europe | 7 | 0.2% |
| Europe | 9 | 0.2% |
| Ireland | 2 | 0.0% |
| Northern Europe | 2 | 0.0% |
| Poland | 7 | 0.2% | View All 8 Rows |
Sex and Age in Mosinee
Sex and Age in Mosinee
The most populous age groups in Mosinee are 25 to 29 Years (374 | 17.8%) for men and 20 to 24 Years (533 | 22.6%) for women.
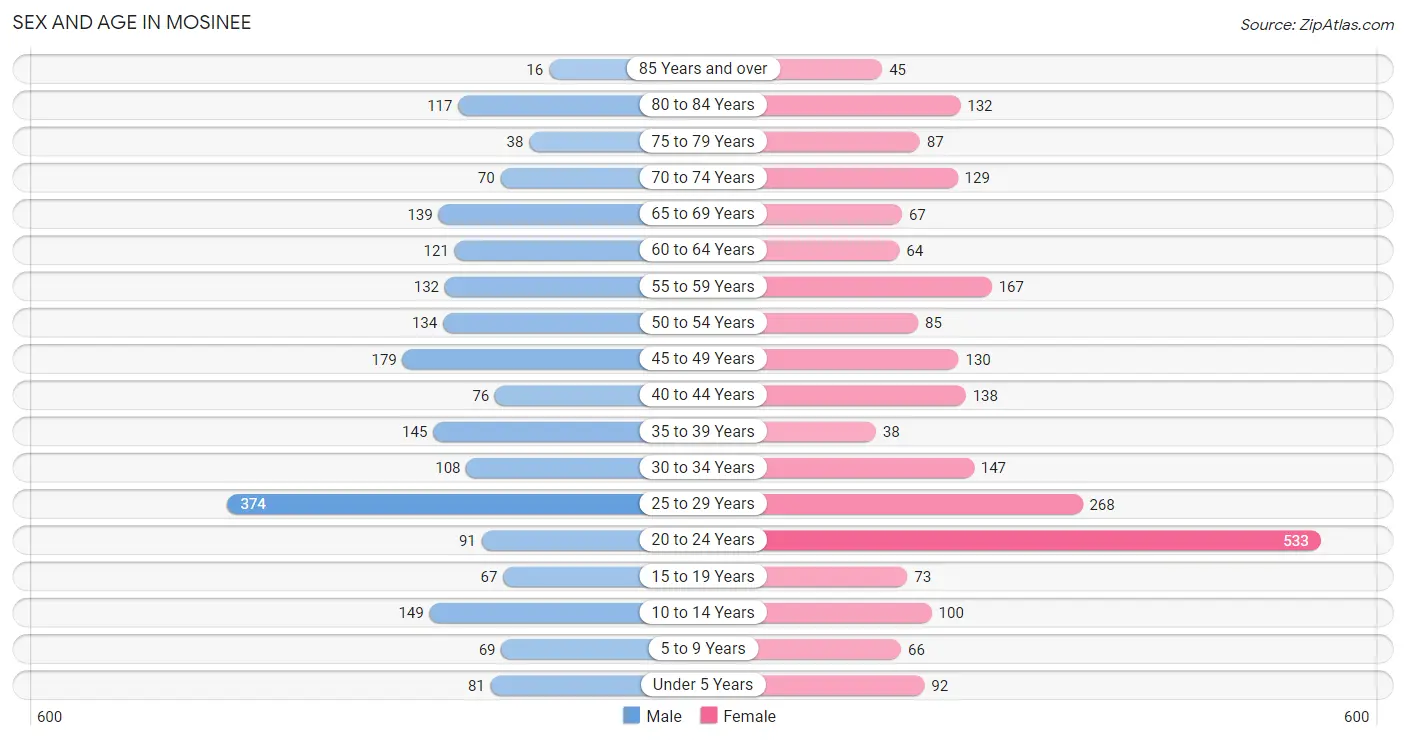
| Age Bracket | Male | Female |
| Under 5 Years | 81 (3.8%) | 92 (3.9%) |
| 5 to 9 Years | 69 (3.3%) | 66 (2.8%) |
| 10 to 14 Years | 149 (7.1%) | 100 (4.2%) |
| 15 to 19 Years | 67 (3.2%) | 73 (3.1%) |
| 20 to 24 Years | 91 (4.3%) | 533 (22.6%) |
| 25 to 29 Years | 374 (17.8%) | 268 (11.4%) |
| 30 to 34 Years | 108 (5.1%) | 147 (6.2%) |
| 35 to 39 Years | 145 (6.9%) | 38 (1.6%) |
| 40 to 44 Years | 76 (3.6%) | 138 (5.8%) |
| 45 to 49 Years | 179 (8.5%) | 130 (5.5%) |
| 50 to 54 Years | 134 (6.4%) | 85 (3.6%) |
| 55 to 59 Years | 132 (6.3%) | 167 (7.1%) |
| 60 to 64 Years | 121 (5.8%) | 64 (2.7%) |
| 65 to 69 Years | 139 (6.6%) | 67 (2.8%) |
| 70 to 74 Years | 70 (3.3%) | 129 (5.5%) |
| 75 to 79 Years | 38 (1.8%) | 87 (3.7%) |
| 80 to 84 Years | 117 (5.6%) | 132 (5.6%) |
| 85 Years and over | 16 (0.8%) | 45 (1.9%) |
| Total | 2,106 (100.0%) | 2,361 (100.0%) |
Families and Households in Mosinee
Median Family Size in Mosinee
The median family size in Mosinee is 2.71 persons per family, with married-couple families (761 | 75.7%) accounting for the largest median family size of 2.75 persons per family. On the other hand, single male/father families (62 | 6.2%) represent the smallest median family size with 2.53 persons per family.
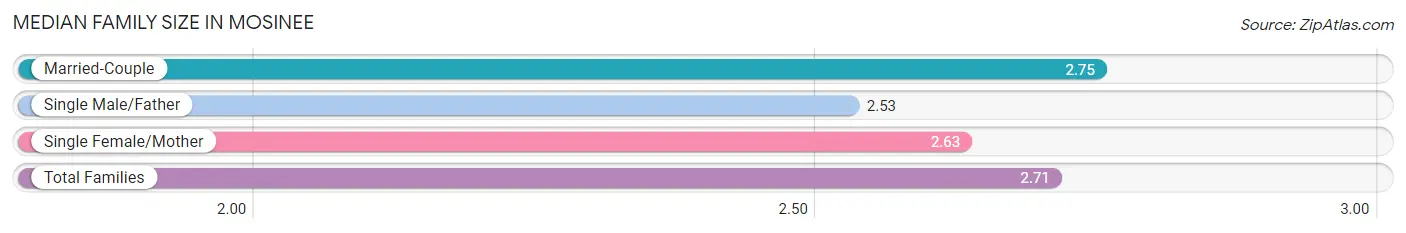
| Family Type | # Families | Family Size |
| Married-Couple | 761 (75.7%) | 2.75 |
| Single Male/Father | 62 (6.2%) | 2.53 |
| Single Female/Mother | 182 (18.1%) | 2.63 |
| Total Families | 1,005 (100.0%) | 2.71 |
Median Household Size in Mosinee
The median household size in Mosinee is 2.09 persons per household, with single female/mother households (182 | 8.5%) accounting for the largest median household size of 2.97 persons per household. non-family households (1,126 | 52.8%) represent the smallest median household size with 1.48 persons per household.
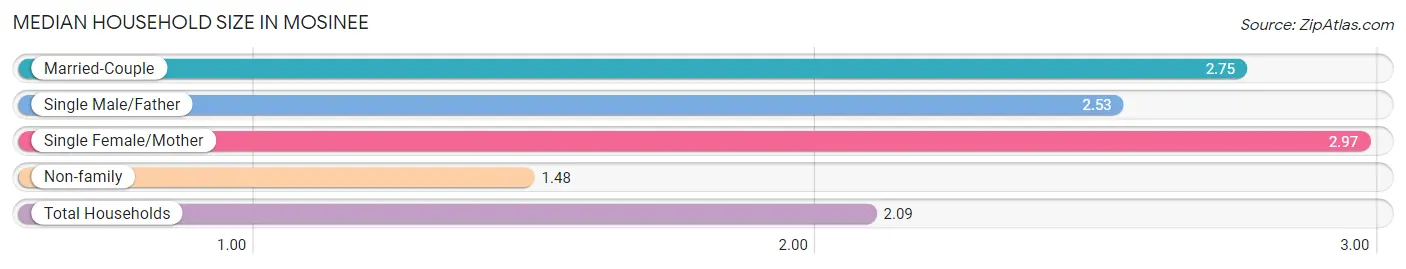
| Household Type | # Households | Household Size |
| Married-Couple | 761 (35.7%) | 2.75 |
| Single Male/Father | 62 (2.9%) | 2.53 |
| Single Female/Mother | 182 (8.5%) | 2.97 |
| Non-family | 1,126 (52.8%) | 1.48 |
| Total Households | 2,131 (100.0%) | 2.09 |
Household Size by Marriage Status in Mosinee
Out of a total of 2,131 households in Mosinee, 1,005 (47.2%) are family households, while 1,126 (52.8%) are nonfamily households. The most numerous type of family households are 2-person households, comprising 531, and the most common type of nonfamily households are 1-person households, comprising 745.
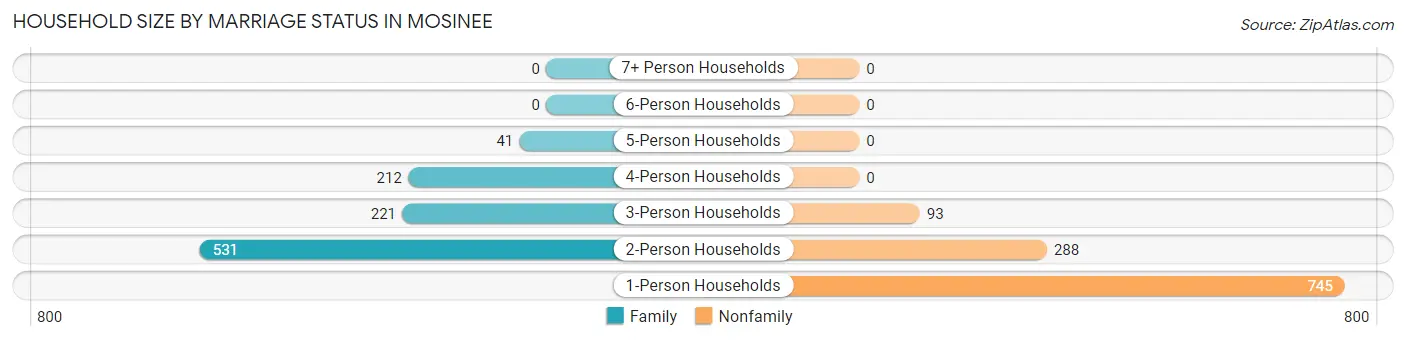
| Household Size | Family Households | Nonfamily Households |
| 1-Person Households | - | 745 (35.0%) |
| 2-Person Households | 531 (24.9%) | 288 (13.5%) |
| 3-Person Households | 221 (10.4%) | 93 (4.4%) |
| 4-Person Households | 212 (10.0%) | 0 (0.0%) |
| 5-Person Households | 41 (1.9%) | 0 (0.0%) |
| 6-Person Households | 0 (0.0%) | 0 (0.0%) |
| 7+ Person Households | 0 (0.0%) | 0 (0.0%) |
| Total | 1,005 (47.2%) | 1,126 (52.8%) |
Female Fertility in Mosinee
Fertility by Age in Mosinee
Average fertility rate in Mosinee is 31.0 births per 1,000 women. Women in the age bracket of 20 to 34 years have the highest fertility rate with 43.0 births per 1,000 women. Women in the age bracket of 20 to 34 years acount for 100.0% of all women with births.
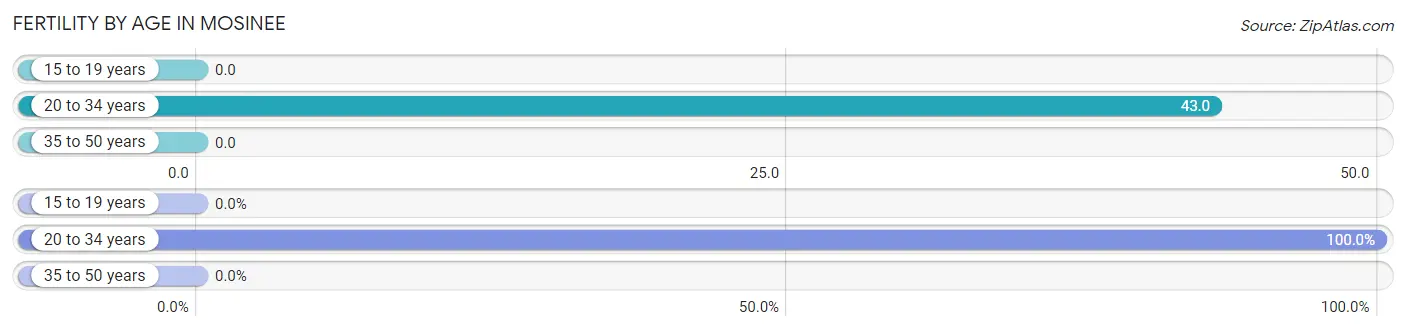
| Age Bracket | Women with Births | Births / 1,000 Women |
| 15 to 19 years | 0 (0.0%) | 0.0 |
| 20 to 34 years | 41 (100.0%) | 43.0 |
| 35 to 50 years | 0 (0.0%) | 0.0 |
| Total | 41 (100.0%) | 31.0 |
Fertility by Age by Marriage Status in Mosinee
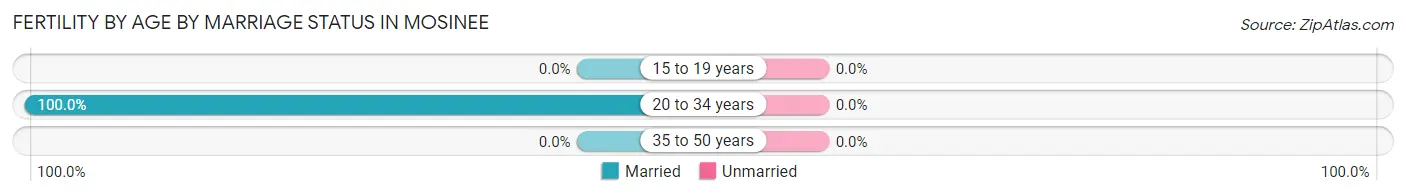
| Age Bracket | Married | Unmarried |
| 15 to 19 years | 0 (0.0%) | 0 (0.0%) |
| 20 to 34 years | 41 (100.0%) | 0 (0.0%) |
| 35 to 50 years | 0 (0.0%) | 0 (0.0%) |
| Total | 41 (100.0%) | 0 (0.0%) |
Fertility by Education in Mosinee
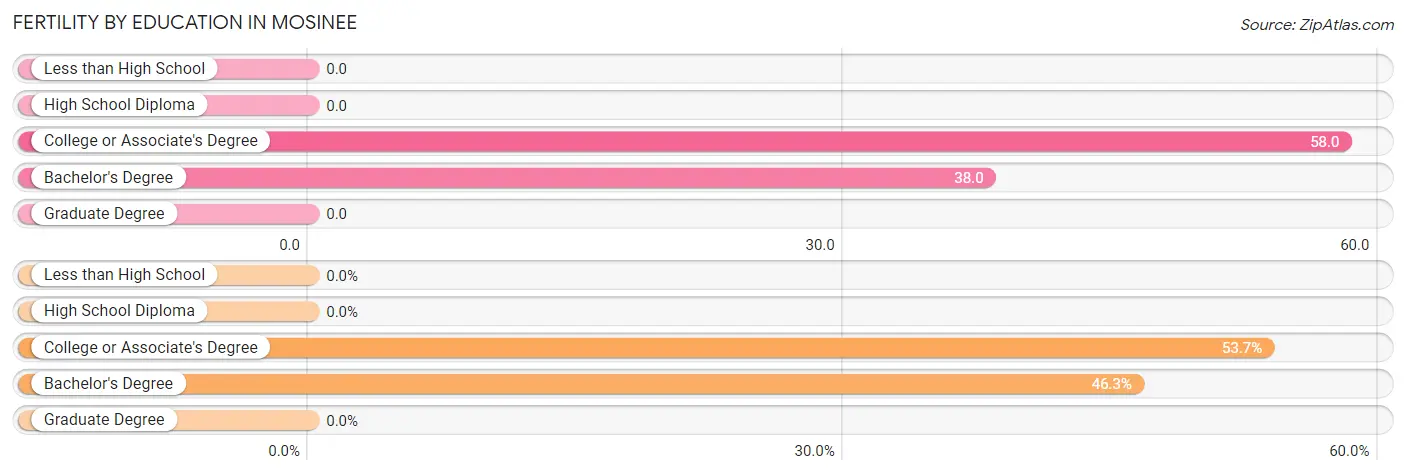
| Educational Attainment | Women with Births | Births / 1,000 Women |
| Less than High School | 0 (0.0%) | 0.0 |
| High School Diploma | 0 (0.0%) | 0.0 |
| College or Associate's Degree | 22 (53.7%) | 58.0 |
| Bachelor's Degree | 19 (46.3%) | 38.0 |
| Graduate Degree | 0 (0.0%) | 0.0 |
| Total | 41 (100.0%) | 31.0 |
Fertility by Education by Marriage Status in Mosinee
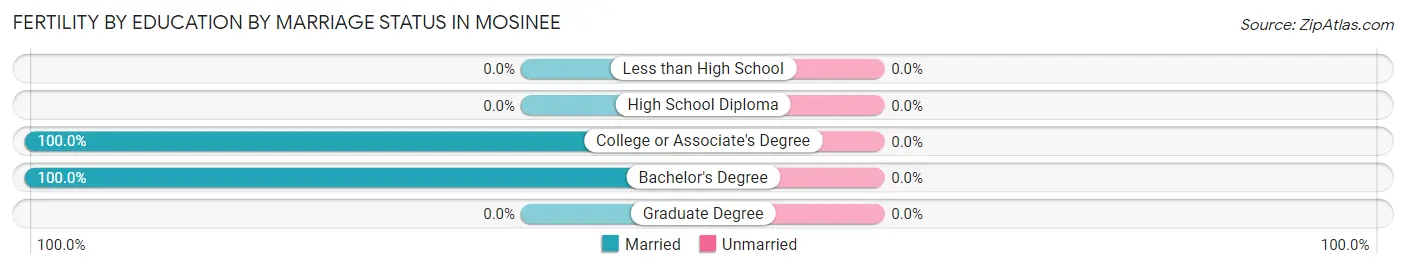
| Educational Attainment | Married | Unmarried |
| Less than High School | 0 (0.0%) | 0 (0.0%) |
| High School Diploma | 0 (0.0%) | 0 (0.0%) |
| College or Associate's Degree | 22 (100.0%) | 0 (0.0%) |
| Bachelor's Degree | 19 (100.0%) | 0 (0.0%) |
| Graduate Degree | 0 (0.0%) | 0 (0.0%) |
| Total | 41 (100.0%) | 0 (0.0%) |
Employment Characteristics in Mosinee
Employment by Class of Employer in Mosinee
Among the 2,665 employed individuals in Mosinee, private company employees (1,849 | 69.4%), local government employees (382 | 14.3%), and not-for-profit organizations (324 | 12.2%) make up the most common classes of employment.
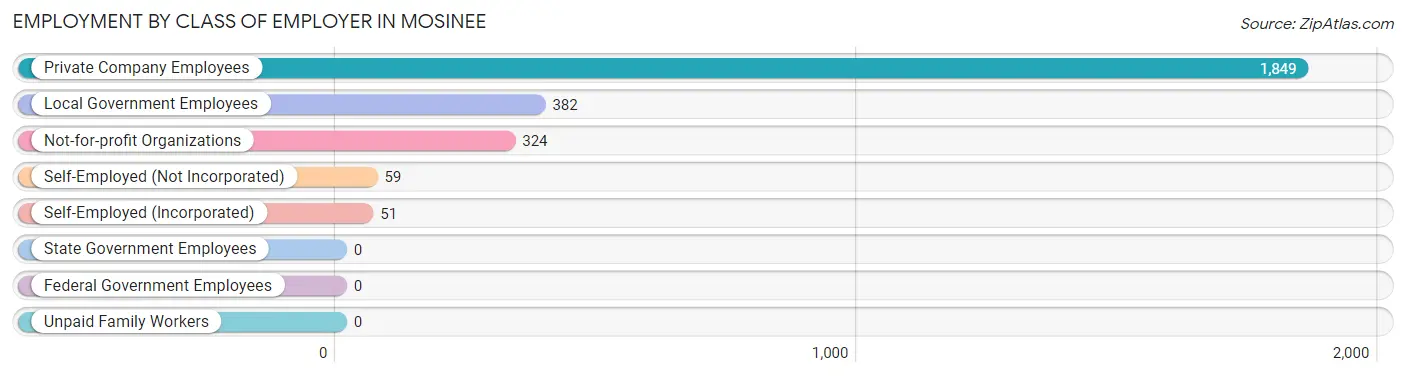
| Employer Class | # Employees | % Employees |
| Private Company Employees | 1,849 | 69.4% |
| Self-Employed (Incorporated) | 51 | 1.9% |
| Self-Employed (Not Incorporated) | 59 | 2.2% |
| Not-for-profit Organizations | 324 | 12.2% |
| Local Government Employees | 382 | 14.3% |
| State Government Employees | 0 | 0.0% |
| Federal Government Employees | 0 | 0.0% |
| Unpaid Family Workers | 0 | 0.0% |
| Total | 2,665 | 100.0% |
Employment Status by Age in Mosinee
According to the labor force statistics for Mosinee, out of the total population over 16 years of age (3,875), 68.8% or 2,666 individuals are in the labor force, with 0.1% or 3 of them unemployed. The age group with the highest labor force participation rate is 35 to 44 years, with 99.7% or 396 individuals in the labor force. Within the labor force, the 25 to 29 years age range has the highest percentage of unemployed individuals, with 0.3% or 2 of them being unemployed.
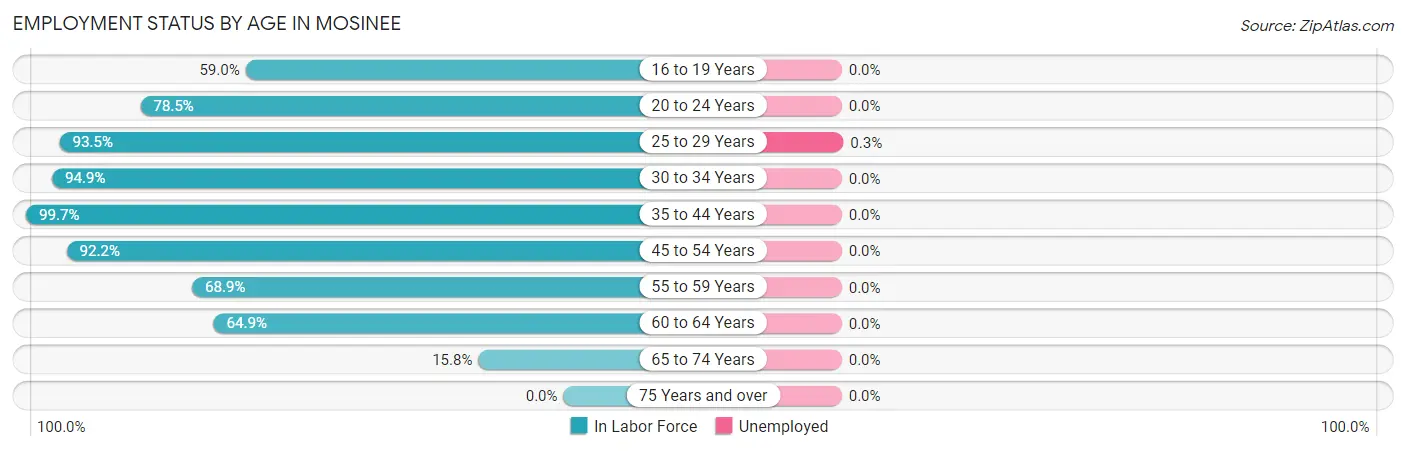
| Age Bracket | In Labor Force | Unemployed |
| 16 to 19 Years | 62 (59.0%) | 0 (0.0%) |
| 20 to 24 Years | 490 (78.5%) | 0 (0.0%) |
| 25 to 29 Years | 600 (93.5%) | 2 (0.3%) |
| 30 to 34 Years | 242 (94.9%) | 0 (0.0%) |
| 35 to 44 Years | 396 (99.7%) | 0 (0.0%) |
| 45 to 54 Years | 487 (92.2%) | 0 (0.0%) |
| 55 to 59 Years | 206 (68.9%) | 0 (0.0%) |
| 60 to 64 Years | 120 (64.9%) | 0 (0.0%) |
| 65 to 74 Years | 64 (15.8%) | 0 (0.0%) |
| 75 Years and over | 0 (0.0%) | 0 (0.0%) |
| Total | 2,666 (68.8%) | 3 (0.1%) |
Employment Status by Educational Attainment in Mosinee
According to labor force statistics for Mosinee, 88.9% of individuals (2,050) out of the total population between 25 and 64 years of age (2,306) are in the labor force, with 0.1% or 2 of them being unemployed. The group with the highest labor force participation rate are those with the educational attainment of bachelor's degree or higher, with 99.1% or 761 individuals in the labor force. Within the labor force, individuals with high school diploma education have the highest percentage of unemployment, with 0.4% or 2 of them being unemployed.
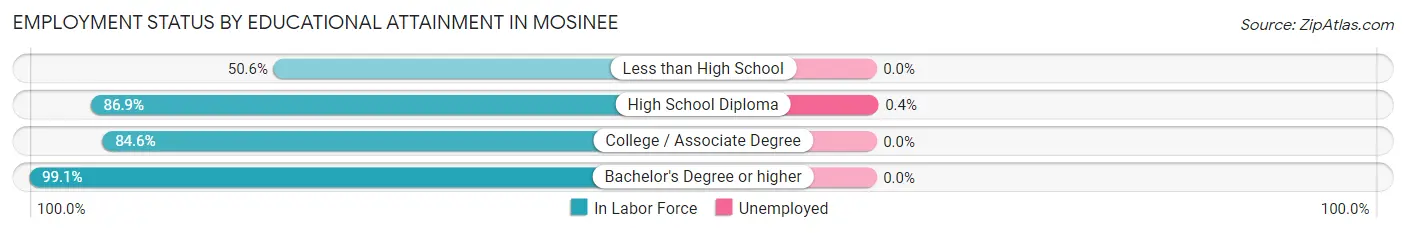
| Educational Attainment | In Labor Force | Unemployed |
| Less than High School | 39 (50.6%) | 0 (0.0%) |
| High School Diploma | 568 (86.9%) | 3 (0.4%) |
| College / Associate Degree | 683 (84.6%) | 0 (0.0%) |
| Bachelor's Degree or higher | 761 (99.1%) | 0 (0.0%) |
| Total | 2,050 (88.9%) | 2 (0.1%) |
Employment Occupations by Sex in Mosinee
Management, Business, Science and Arts Occupations
The most common Management, Business, Science and Arts occupations in Mosinee are Community & Social Service (436 | 16.4%), Education Instruction & Library (322 | 12.1%), Business & Financial (282 | 10.6%), Management (237 | 8.9%), and Health Diagnosing & Treating (165 | 6.2%).
Management, Business, Science and Arts Occupations by Sex
Within the Management, Business, Science and Arts occupations in Mosinee, the most male-oriented occupations are Computers & Mathematics (100.0%), Management (62.9%), and Computers, Engineering & Science (55.2%), while the most female-oriented occupations are Education, Arts & Media (100.0%), Health Technologists (84.1%), and Life, Physical & Social Science (73.2%).
| Occupation | Male | Female |
| Management | 149 (62.9%) | 88 (37.1%) |
| Business & Financial | 79 (28.0%) | 203 (72.0%) |
| Computers, Engineering & Science | 64 (55.2%) | 52 (44.8%) |
| Computers & Mathematics | 45 (100.0%) | 0 (0.0%) |
| Architecture & Engineering | 0 (0.0%) | 0 (0.0%) |
| Life, Physical & Social Science | 19 (26.8%) | 52 (73.2%) |
| Community & Social Service | 144 (33.0%) | 292 (67.0%) |
| Education, Arts & Media | 0 (0.0%) | 114 (100.0%) |
| Legal Services & Support | 0 (0.0%) | 0 (0.0%) |
| Education Instruction & Library | 144 (44.7%) | 178 (55.3%) |
| Arts, Media & Entertainment | 0 (0.0%) | 0 (0.0%) |
| Health Diagnosing & Treating | 46 (27.9%) | 119 (72.1%) |
| Health Technologists | 21 (15.9%) | 111 (84.1%) |
| Total (Category) | 482 (39.0%) | 754 (61.0%) |
| Total (Overall) | 1,339 (50.2%) | 1,326 (49.8%) |
Services Occupations
The most common Services occupations in Mosinee are Cleaning & Maintenance (102 | 3.8%), Food Preparation & Serving (51 | 1.9%), Healthcare Support (41 | 1.5%), Security & Protection (29 | 1.1%), and Law Enforcement (29 | 1.1%).
Services Occupations by Sex
Within the Services occupations in Mosinee, the most male-oriented occupations are Security & Protection (100.0%), Law Enforcement (100.0%), and Cleaning & Maintenance (53.9%), while the most female-oriented occupations are Healthcare Support (100.0%), Personal Care & Service (100.0%), and Food Preparation & Serving (47.1%).
| Occupation | Male | Female |
| Healthcare Support | 0 (0.0%) | 41 (100.0%) |
| Security & Protection | 29 (100.0%) | 0 (0.0%) |
| Firefighting & Prevention | 0 (0.0%) | 0 (0.0%) |
| Law Enforcement | 29 (100.0%) | 0 (0.0%) |
| Food Preparation & Serving | 27 (52.9%) | 24 (47.1%) |
| Cleaning & Maintenance | 55 (53.9%) | 47 (46.1%) |
| Personal Care & Service | 0 (0.0%) | 18 (100.0%) |
| Total (Category) | 111 (46.1%) | 130 (53.9%) |
| Total (Overall) | 1,339 (50.2%) | 1,326 (49.8%) |
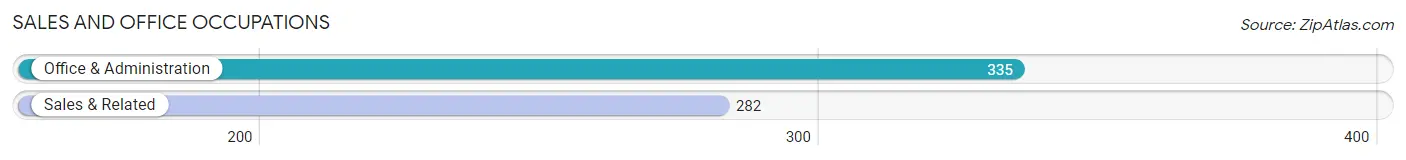
Sales and Office Occupations
The most common Sales and Office occupations in Mosinee are Office & Administration (335 | 12.6%), and Sales & Related (282 | 10.6%).
Sales and Office Occupations by Sex
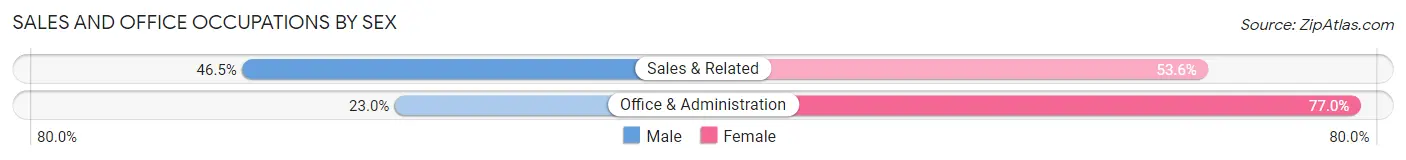
| Occupation | Male | Female |
| Sales & Related | 131 (46.5%) | 151 (53.5%) |
| Office & Administration | 77 (23.0%) | 258 (77.0%) |
| Total (Category) | 208 (33.7%) | 409 (66.3%) |
| Total (Overall) | 1,339 (50.2%) | 1,326 (49.8%) |
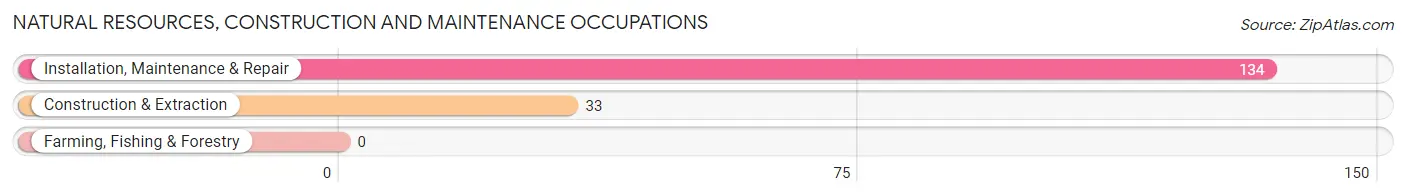
Natural Resources, Construction and Maintenance Occupations
The most common Natural Resources, Construction and Maintenance occupations in Mosinee are Installation, Maintenance & Repair (134 | 5.0%), and Construction & Extraction (33 | 1.2%).
Natural Resources, Construction and Maintenance Occupations by Sex
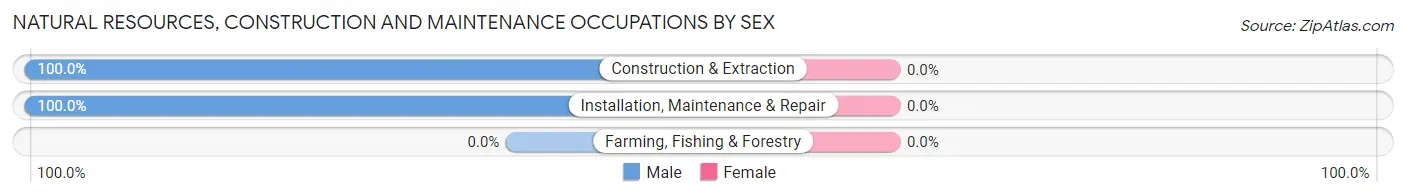
| Occupation | Male | Female |
| Farming, Fishing & Forestry | 0 (0.0%) | 0 (0.0%) |
| Construction & Extraction | 33 (100.0%) | 0 (0.0%) |
| Installation, Maintenance & Repair | 134 (100.0%) | 0 (0.0%) |
| Total (Category) | 167 (100.0%) | 0 (0.0%) |
| Total (Overall) | 1,339 (50.2%) | 1,326 (49.8%) |
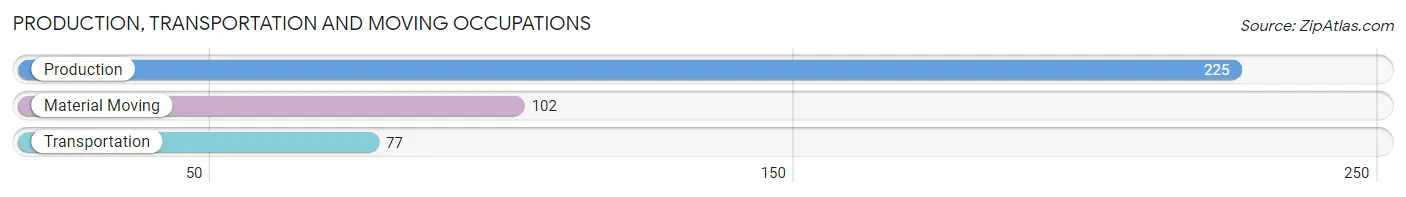
Production, Transportation and Moving Occupations
The most common Production, Transportation and Moving occupations in Mosinee are Production (225 | 8.4%), Material Moving (102 | 3.8%), and Transportation (77 | 2.9%).
Production, Transportation and Moving Occupations by Sex
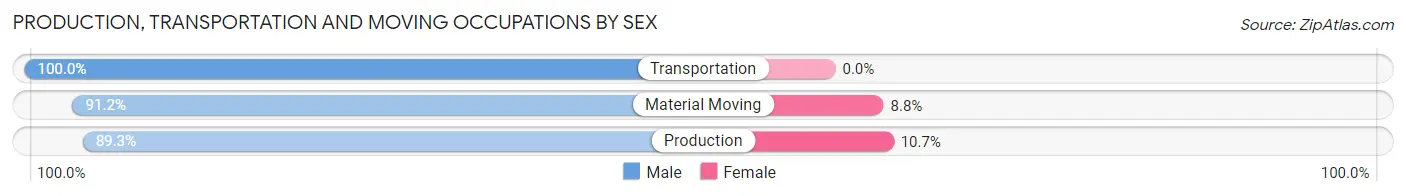
| Occupation | Male | Female |
| Production | 201 (89.3%) | 24 (10.7%) |
| Transportation | 77 (100.0%) | 0 (0.0%) |
| Material Moving | 93 (91.2%) | 9 (8.8%) |
| Total (Category) | 371 (91.8%) | 33 (8.2%) |
| Total (Overall) | 1,339 (50.2%) | 1,326 (49.8%) |
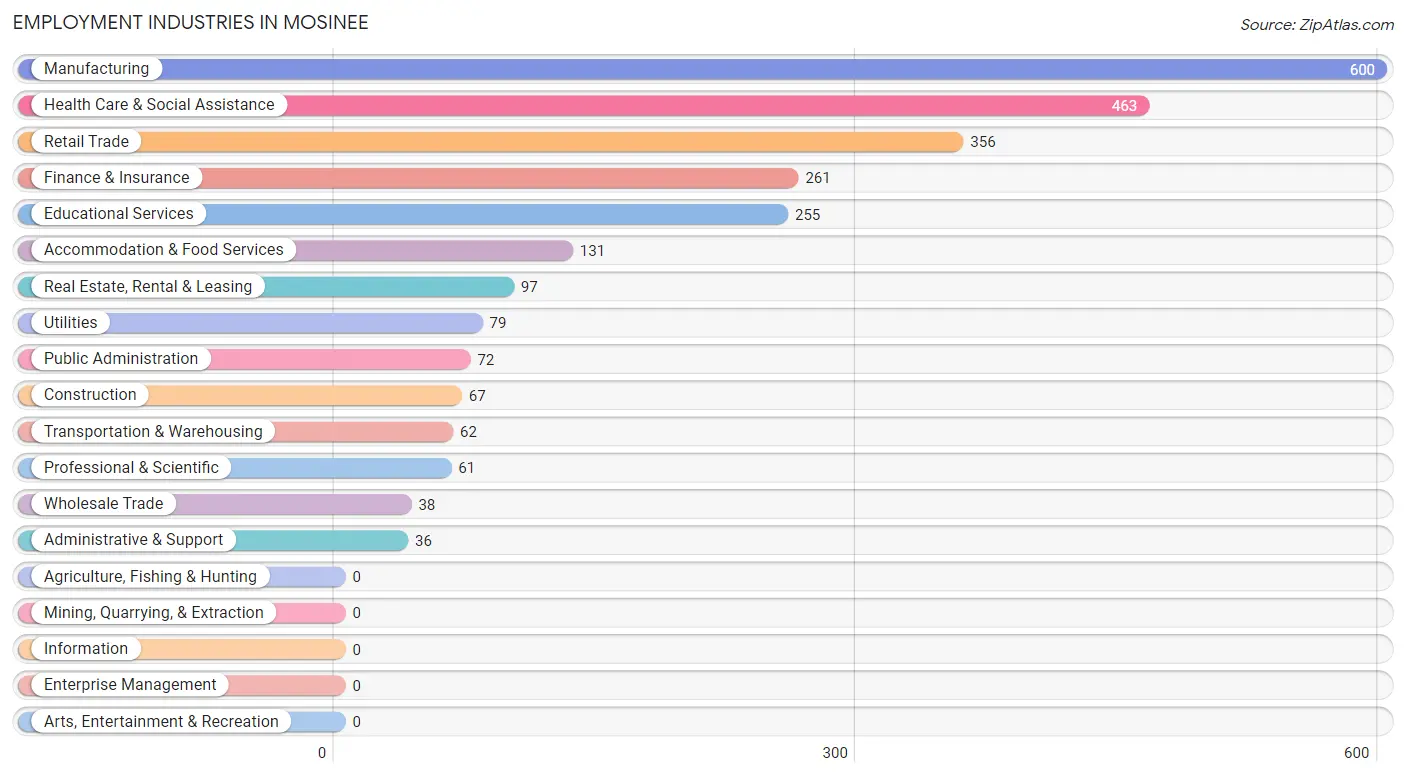
Employment Industries by Sex in Mosinee
Employment Industries in Mosinee
The major employment industries in Mosinee include Manufacturing (600 | 22.5%), Health Care & Social Assistance (463 | 17.4%), Retail Trade (356 | 13.4%), Finance & Insurance (261 | 9.8%), and Educational Services (255 | 9.6%).
Employment Industries by Sex in Mosinee
The Mosinee industries that see more men than women are Construction (100.0%), Utilities (100.0%), and Public Administration (100.0%), whereas the industries that tend to have a higher number of women are Health Care & Social Assistance (95.5%), Real Estate, Rental & Leasing (73.2%), and Finance & Insurance (67.4%).
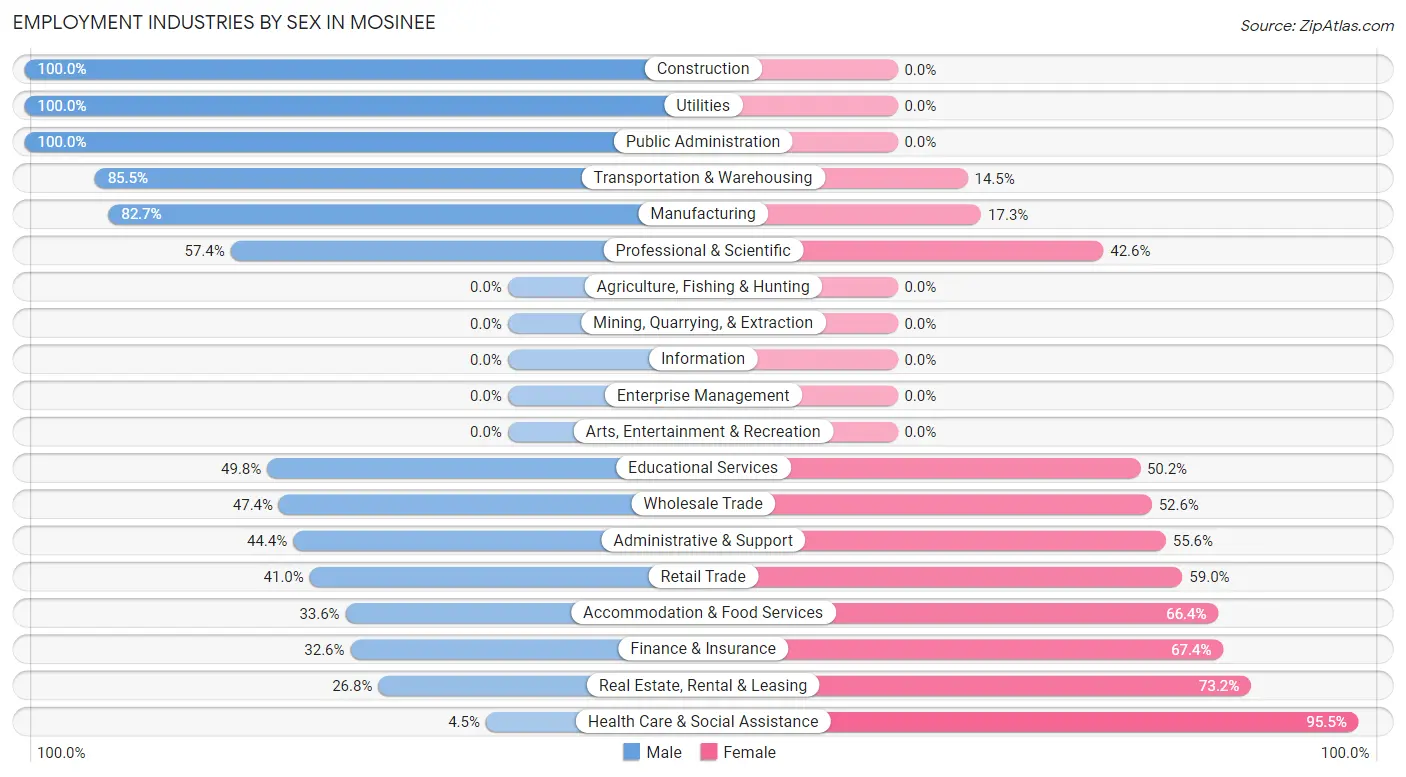
| Industry | Male | Female |
| Agriculture, Fishing & Hunting | 0 (0.0%) | 0 (0.0%) |
| Mining, Quarrying, & Extraction | 0 (0.0%) | 0 (0.0%) |
| Construction | 67 (100.0%) | 0 (0.0%) |
| Manufacturing | 496 (82.7%) | 104 (17.3%) |
| Wholesale Trade | 18 (47.4%) | 20 (52.6%) |
| Retail Trade | 146 (41.0%) | 210 (59.0%) |
| Transportation & Warehousing | 53 (85.5%) | 9 (14.5%) |
| Utilities | 79 (100.0%) | 0 (0.0%) |
| Information | 0 (0.0%) | 0 (0.0%) |
| Finance & Insurance | 85 (32.6%) | 176 (67.4%) |
| Real Estate, Rental & Leasing | 26 (26.8%) | 71 (73.2%) |
| Professional & Scientific | 35 (57.4%) | 26 (42.6%) |
| Enterprise Management | 0 (0.0%) | 0 (0.0%) |
| Administrative & Support | 16 (44.4%) | 20 (55.6%) |
| Educational Services | 127 (49.8%) | 128 (50.2%) |
| Health Care & Social Assistance | 21 (4.5%) | 442 (95.5%) |
| Arts, Entertainment & Recreation | 0 (0.0%) | 0 (0.0%) |
| Accommodation & Food Services | 44 (33.6%) | 87 (66.4%) |
| Public Administration | 72 (100.0%) | 0 (0.0%) |
| Total | 1,339 (50.2%) | 1,326 (49.8%) |
Education in Mosinee
School Enrollment in Mosinee
The most common levels of schooling among the 834 students in Mosinee are middle school (249 | 29.9%), college / undergraduate (247 | 29.6%), and high school (115 | 13.8%).
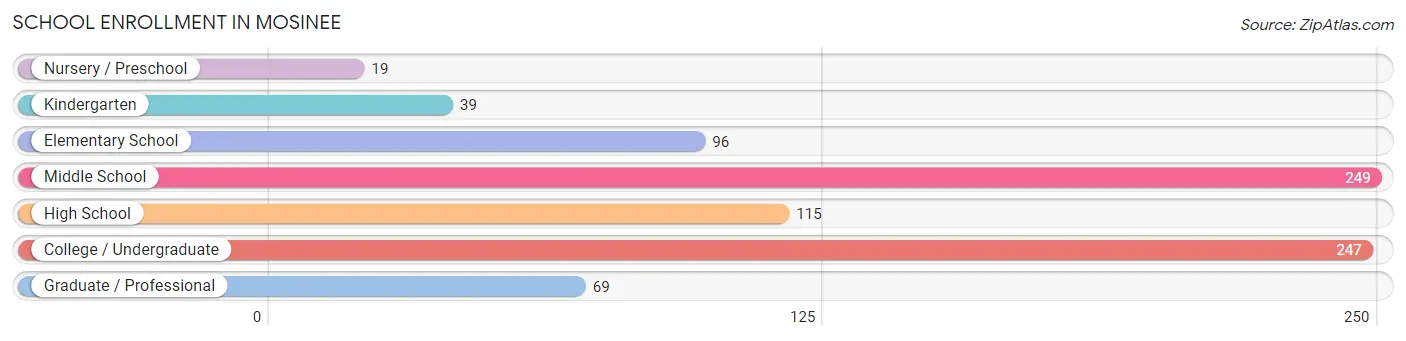
| School Level | # Students | % Students |
| Nursery / Preschool | 19 | 2.3% |
| Kindergarten | 39 | 4.7% |
| Elementary School | 96 | 11.5% |
| Middle School | 249 | 29.9% |
| High School | 115 | 13.8% |
| College / Undergraduate | 247 | 29.6% |
| Graduate / Professional | 69 | 8.3% |
| Total | 834 | 100.0% |
School Enrollment by Age by Funding Source in Mosinee
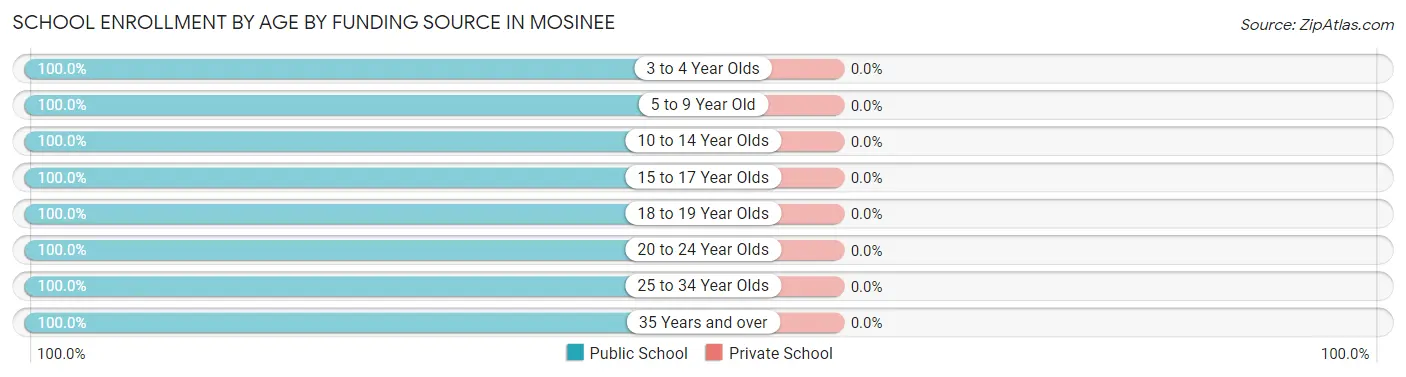
| Age Bracket | Public School | Private School |
| 3 to 4 Year Olds | 19 (100.0%) | 0 (0.0%) |
| 5 to 9 Year Old | 135 (100.0%) | 0 (0.0%) |
| 10 to 14 Year Olds | 249 (100.0%) | 0 (0.0%) |
| 15 to 17 Year Olds | 102 (100.0%) | 0 (0.0%) |
| 18 to 19 Year Olds | 38 (100.0%) | 0 (0.0%) |
| 20 to 24 Year Olds | 229 (100.0%) | 0 (0.0%) |
| 25 to 34 Year Olds | 44 (100.0%) | 0 (0.0%) |
| 35 Years and over | 18 (100.0%) | 0 (0.0%) |
| Total | 834 (100.0%) | 0 (0.0%) |
Educational Attainment by Field of Study in Mosinee
Business (284 | 32.2%), education (220 | 24.9%), psychology (124 | 14.0%), arts & humanities (100 | 11.3%), and social sciences (39 | 4.4%) are the most common fields of study among 883 individuals in Mosinee who have obtained a bachelor's degree or higher.
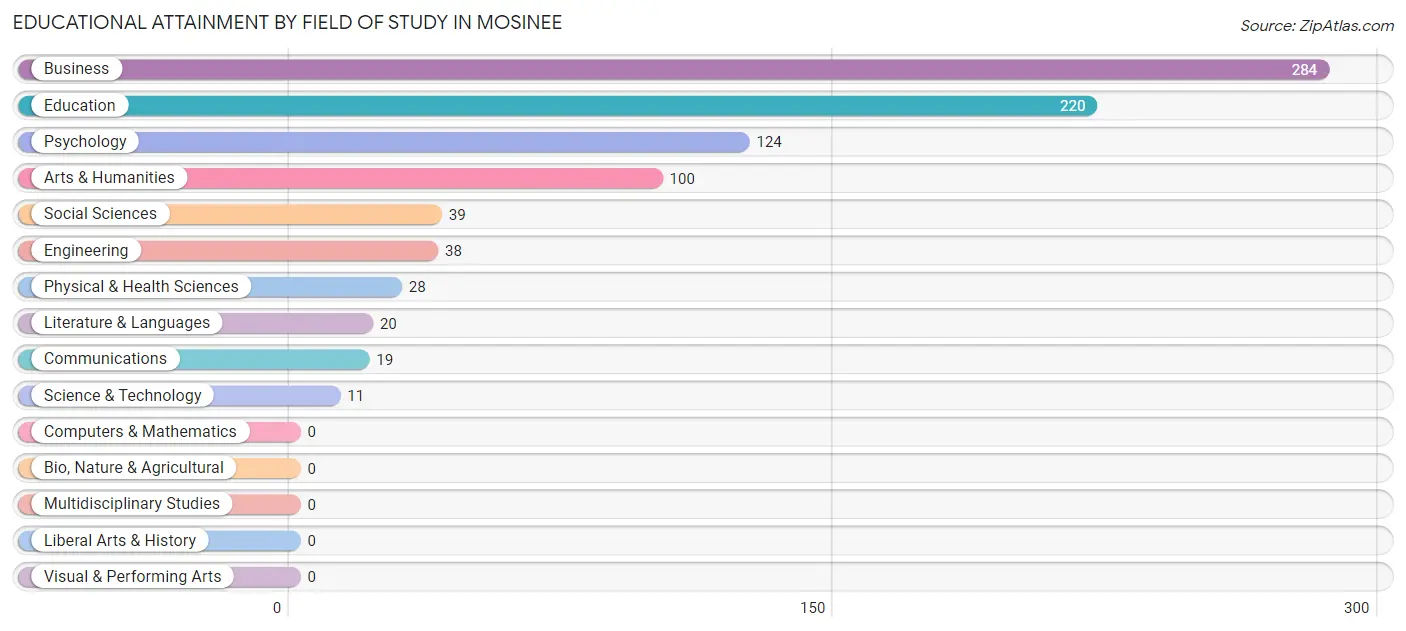
| Field of Study | # Graduates | % Graduates |
| Computers & Mathematics | 0 | 0.0% |
| Bio, Nature & Agricultural | 0 | 0.0% |
| Physical & Health Sciences | 28 | 3.2% |
| Psychology | 124 | 14.0% |
| Social Sciences | 39 | 4.4% |
| Engineering | 38 | 4.3% |
| Multidisciplinary Studies | 0 | 0.0% |
| Science & Technology | 11 | 1.3% |
| Business | 284 | 32.2% |
| Education | 220 | 24.9% |
| Literature & Languages | 20 | 2.3% |
| Liberal Arts & History | 0 | 0.0% |
| Visual & Performing Arts | 0 | 0.0% |
| Communications | 19 | 2.1% |
| Arts & Humanities | 100 | 11.3% |
| Total | 883 | 100.0% |
Transportation & Commute in Mosinee
Vehicle Availability by Sex in Mosinee
The most prevalent vehicle ownership categories in Mosinee are males with 2 vehicles (951, accounting for 71.1%) and females with 2 vehicles (766, making up 71.7%).
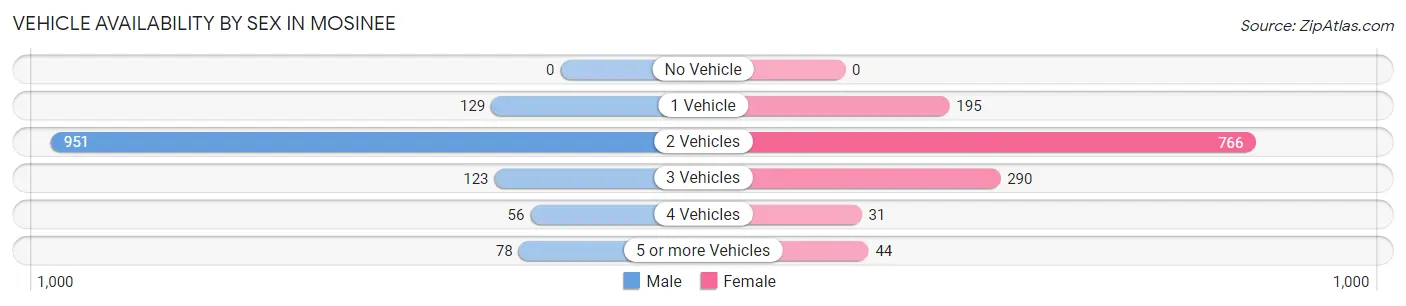
| Vehicles Available | Male | Female |
| No Vehicle | 0 (0.0%) | 0 (0.0%) |
| 1 Vehicle | 129 (9.7%) | 195 (14.7%) |
| 2 Vehicles | 951 (71.1%) | 766 (57.8%) |
| 3 Vehicles | 123 (9.2%) | 290 (21.9%) |
| 4 Vehicles | 56 (4.2%) | 31 (2.3%) |
| 5 or more Vehicles | 78 (5.8%) | 44 (3.3%) |
| Total | 1,337 (100.0%) | 1,326 (100.0%) |
Commute Time in Mosinee
The most frequently occuring commute durations in Mosinee are 15 to 19 minutes (552 commuters, 22.4%), 20 to 24 minutes (471 commuters, 19.1%), and 5 to 9 minutes (260 commuters, 10.6%).
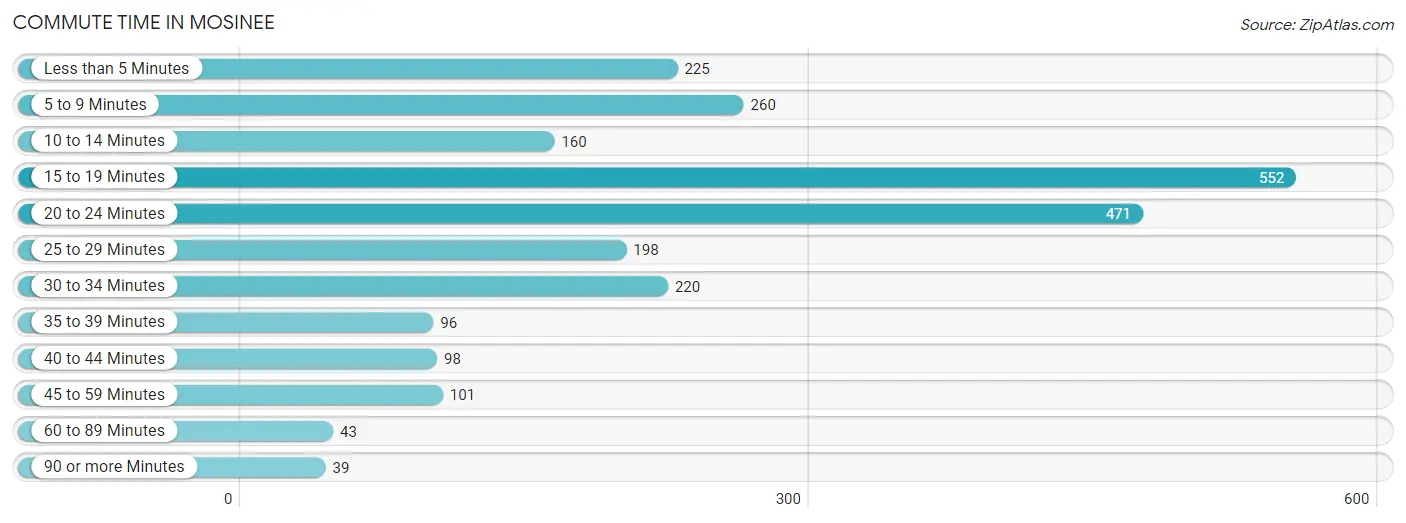
| Commute Time | # Commuters | % Commuters |
| Less than 5 Minutes | 225 | 9.1% |
| 5 to 9 Minutes | 260 | 10.6% |
| 10 to 14 Minutes | 160 | 6.5% |
| 15 to 19 Minutes | 552 | 22.4% |
| 20 to 24 Minutes | 471 | 19.1% |
| 25 to 29 Minutes | 198 | 8.0% |
| 30 to 34 Minutes | 220 | 8.9% |
| 35 to 39 Minutes | 96 | 3.9% |
| 40 to 44 Minutes | 98 | 4.0% |
| 45 to 59 Minutes | 101 | 4.1% |
| 60 to 89 Minutes | 43 | 1.8% |
| 90 or more Minutes | 39 | 1.6% |
Commute Time by Sex in Mosinee
The most common commute times in Mosinee are 15 to 19 minutes (300 commuters, 24.7%) for males and 15 to 19 minutes (252 commuters, 20.2%) for females.
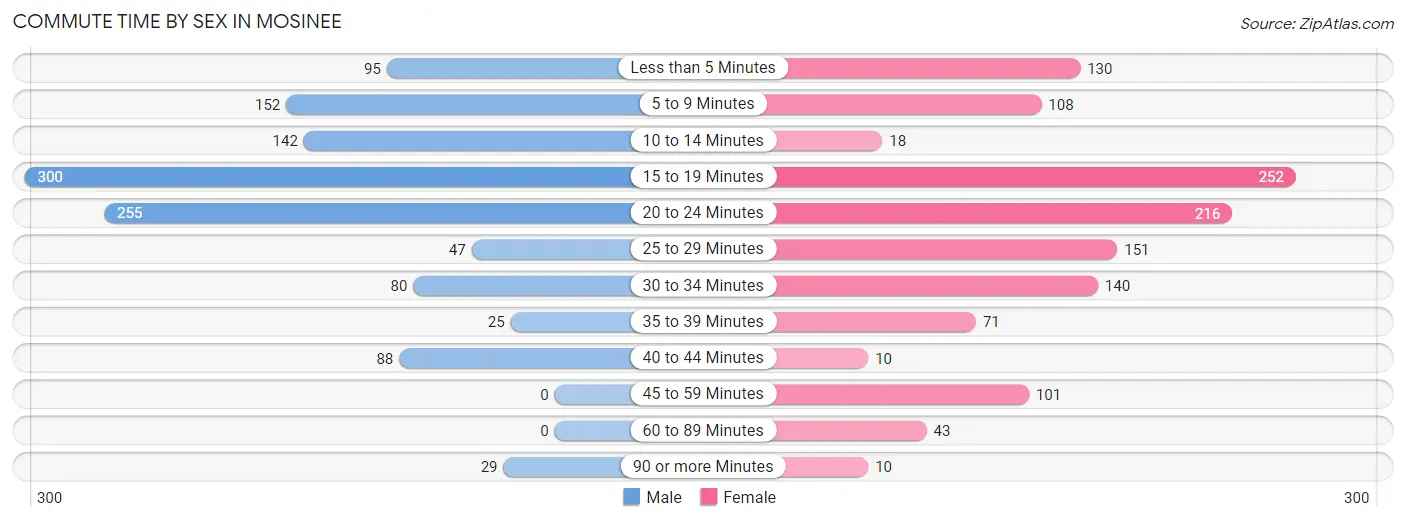
| Commute Time | Male | Female |
| Less than 5 Minutes | 95 (7.8%) | 130 (10.4%) |
| 5 to 9 Minutes | 152 (12.5%) | 108 (8.6%) |
| 10 to 14 Minutes | 142 (11.7%) | 18 (1.4%) |
| 15 to 19 Minutes | 300 (24.7%) | 252 (20.2%) |
| 20 to 24 Minutes | 255 (21.0%) | 216 (17.3%) |
| 25 to 29 Minutes | 47 (3.9%) | 151 (12.1%) |
| 30 to 34 Minutes | 80 (6.6%) | 140 (11.2%) |
| 35 to 39 Minutes | 25 (2.1%) | 71 (5.7%) |
| 40 to 44 Minutes | 88 (7.2%) | 10 (0.8%) |
| 45 to 59 Minutes | 0 (0.0%) | 101 (8.1%) |
| 60 to 89 Minutes | 0 (0.0%) | 43 (3.4%) |
| 90 or more Minutes | 29 (2.4%) | 10 (0.8%) |
Time of Departure to Work by Sex in Mosinee
The most frequent times of departure to work in Mosinee are 6:00 AM to 6:29 AM (215, 17.7%) for males and 7:00 AM to 7:29 AM (461, 36.9%) for females.
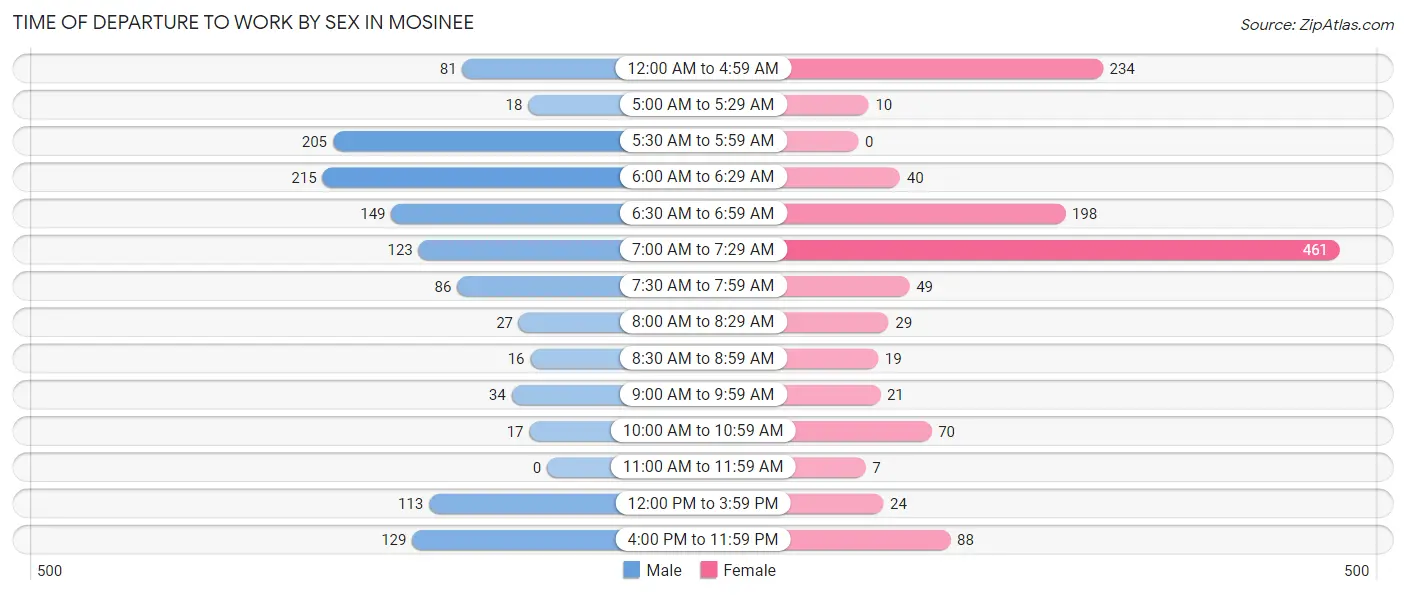
| Time of Departure | Male | Female |
| 12:00 AM to 4:59 AM | 81 (6.7%) | 234 (18.7%) |
| 5:00 AM to 5:29 AM | 18 (1.5%) | 10 (0.8%) |
| 5:30 AM to 5:59 AM | 205 (16.9%) | 0 (0.0%) |
| 6:00 AM to 6:29 AM | 215 (17.7%) | 40 (3.2%) |
| 6:30 AM to 6:59 AM | 149 (12.3%) | 198 (15.8%) |
| 7:00 AM to 7:29 AM | 123 (10.1%) | 461 (36.9%) |
| 7:30 AM to 7:59 AM | 86 (7.1%) | 49 (3.9%) |
| 8:00 AM to 8:29 AM | 27 (2.2%) | 29 (2.3%) |
| 8:30 AM to 8:59 AM | 16 (1.3%) | 19 (1.5%) |
| 9:00 AM to 9:59 AM | 34 (2.8%) | 21 (1.7%) |
| 10:00 AM to 10:59 AM | 17 (1.4%) | 70 (5.6%) |
| 11:00 AM to 11:59 AM | 0 (0.0%) | 7 (0.6%) |
| 12:00 PM to 3:59 PM | 113 (9.3%) | 24 (1.9%) |
| 4:00 PM to 11:59 PM | 129 (10.6%) | 88 (7.0%) |
| Total | 1,213 (100.0%) | 1,250 (100.0%) |
Housing Occupancy in Mosinee
Occupancy by Ownership in Mosinee
Of the total 2,131 dwellings in Mosinee, owner-occupied units account for 1,262 (59.2%), while renter-occupied units make up 869 (40.8%).
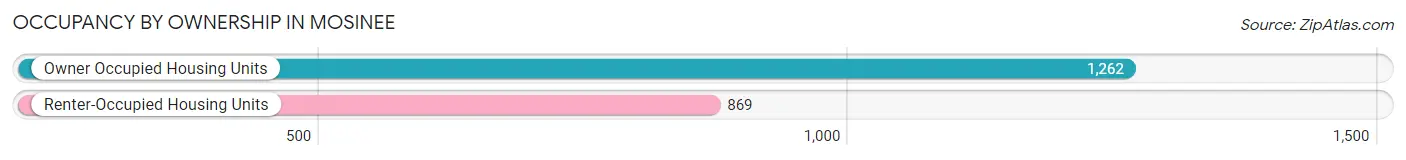
| Occupancy | # Housing Units | % Housing Units |
| Owner Occupied Housing Units | 1,262 | 59.2% |
| Renter-Occupied Housing Units | 869 | 40.8% |
| Total Occupied Housing Units | 2,131 | 100.0% |
Occupancy by Household Size in Mosinee
| Household Size | # Housing Units | % Housing Units |
| 1-Person Household | 745 | 35.0% |
| 2-Person Household | 819 | 38.4% |
| 3-Person Household | 314 | 14.7% |
| 4+ Person Household | 253 | 11.9% |
| Total Housing Units | 2,131 | 100.0% |
Occupancy by Ownership by Household Size in Mosinee
| Household Size | Owner-occupied | Renter-occupied |
| 1-Person Household | 388 (52.1%) | 357 (47.9%) |
| 2-Person Household | 474 (57.9%) | 345 (42.1%) |
| 3-Person Household | 165 (52.5%) | 149 (47.4%) |
| 4+ Person Household | 235 (92.9%) | 18 (7.1%) |
| Total Housing Units | 1,262 (59.2%) | 869 (40.8%) |
Occupancy by Educational Attainment in Mosinee
| Household Size | Owner-occupied | Renter-occupied |
| Less than High School | 37 (26.8%) | 101 (73.2%) |
| High School Diploma | 368 (52.3%) | 336 (47.7%) |
| College/Associate Degree | 554 (67.1%) | 271 (32.9%) |
| Bachelor's Degree or higher | 303 (65.3%) | 161 (34.7%) |
Occupancy by Age of Householder in Mosinee
| Age Bracket | # Households | % Households |
| Under 35 Years | 646 | 30.3% |
| 35 to 44 Years | 263 | 12.3% |
| 45 to 54 Years | 256 | 12.0% |
| 55 to 64 Years | 276 | 13.0% |
| 65 to 74 Years | 326 | 15.3% |
| 75 to 84 Years | 303 | 14.2% |
| 85 Years and Over | 61 | 2.9% |
| Total | 2,131 | 100.0% |
Housing Finances in Mosinee
Median Income by Occupancy in Mosinee
| Occupancy Type | # Households | Median Income |
| Owner-Occupied | 1,262 (59.2%) | $86,582 |
| Renter-Occupied | 869 (40.8%) | $57,740 |
| Average | 2,131 (100.0%) | $68,219 |
Occupancy by Householder Income Bracket in Mosinee
| Income Bracket | Owner-occupied | Renter-occupied |
| Less than $5,000 | 66 (5.2%) | 0 (0.0%) |
| $5,000 to $9,999 | 14 (1.1%) | 0 (0.0%) |
| $10,000 to $14,999 | 17 (1.3%) | 54 (6.2%) |
| $15,000 to $19,999 | 15 (1.2%) | 54 (6.2%) |
| $20,000 to $24,999 | 15 (1.2%) | 0 (0.0%) |
| $25,000 to $34,999 | 69 (5.5%) | 185 (21.3%) |
| $35,000 to $49,999 | 173 (13.7%) | 106 (12.2%) |
| $50,000 to $74,999 | 186 (14.7%) | 236 (27.2%) |
| $75,000 to $99,999 | 144 (11.4%) | 205 (23.6%) |
| $100,000 to $149,999 | 376 (29.8%) | 0 (0.0%) |
| $150,000 or more | 187 (14.8%) | 29 (3.3%) |
| Total | 1,262 (100.0%) | 869 (100.0%) |
Monthly Housing Cost Tiers in Mosinee
| Monthly Cost | Owner-occupied | Renter-occupied |
| Less than $300 | 0 (0.0%) | 0 (0.0%) |
| $300 to $499 | 177 (14.0%) | 42 (4.8%) |
| $500 to $799 | 339 (26.9%) | 256 (29.5%) |
| $800 to $999 | 241 (19.1%) | 253 (29.1%) |
| $1,000 to $1,499 | 339 (26.9%) | 209 (24.0%) |
| $1,500 to $1,999 | 66 (5.2%) | 96 (11.1%) |
| $2,000 to $2,499 | 83 (6.6%) | 0 (0.0%) |
| $2,500 to $2,999 | 0 (0.0%) | 0 (0.0%) |
| $3,000 or more | 17 (1.3%) | 0 (0.0%) |
| Total | 1,262 (100.0%) | 869 (100.0%) |
Physical Housing Characteristics in Mosinee
Housing Structures in Mosinee
| Structure Type | # Housing Units | % Housing Units |
| Single Unit, Detached | 1,403 | 65.8% |
| Single Unit, Attached | 89 | 4.2% |
| 2 Unit Apartments | 138 | 6.5% |
| 3 or 4 Unit Apartments | 15 | 0.7% |
| 5 to 9 Unit Apartments | 204 | 9.6% |
| 10 or more Apartments | 282 | 13.2% |
| Mobile Home / Other | 0 | 0.0% |
| Total | 2,131 | 100.0% |
Housing Structures by Occupancy in Mosinee
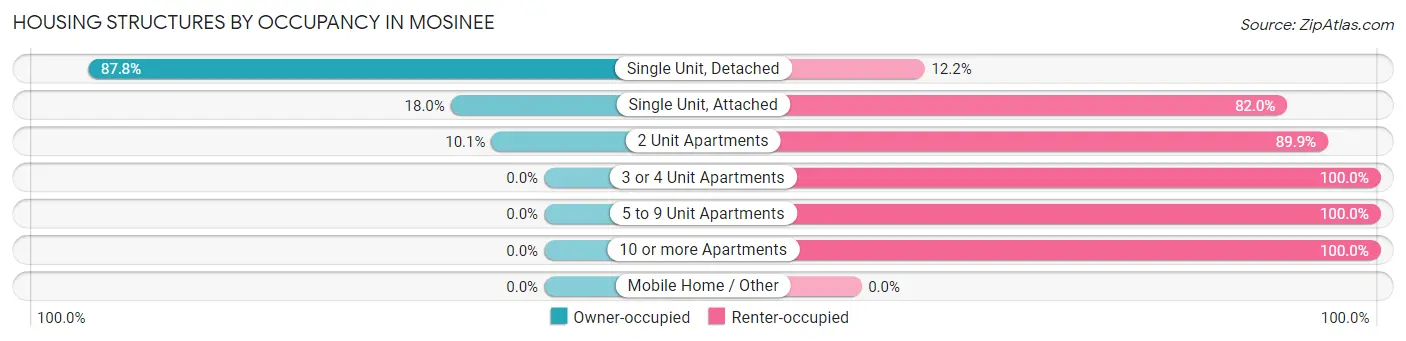
| Structure Type | Owner-occupied | Renter-occupied |
| Single Unit, Detached | 1,232 (87.8%) | 171 (12.2%) |
| Single Unit, Attached | 16 (18.0%) | 73 (82.0%) |
| 2 Unit Apartments | 14 (10.1%) | 124 (89.9%) |
| 3 or 4 Unit Apartments | 0 (0.0%) | 15 (100.0%) |
| 5 to 9 Unit Apartments | 0 (0.0%) | 204 (100.0%) |
| 10 or more Apartments | 0 (0.0%) | 282 (100.0%) |
| Mobile Home / Other | 0 (0.0%) | 0 (0.0%) |
| Total | 1,262 (59.2%) | 869 (40.8%) |
Housing Structures by Number of Rooms in Mosinee
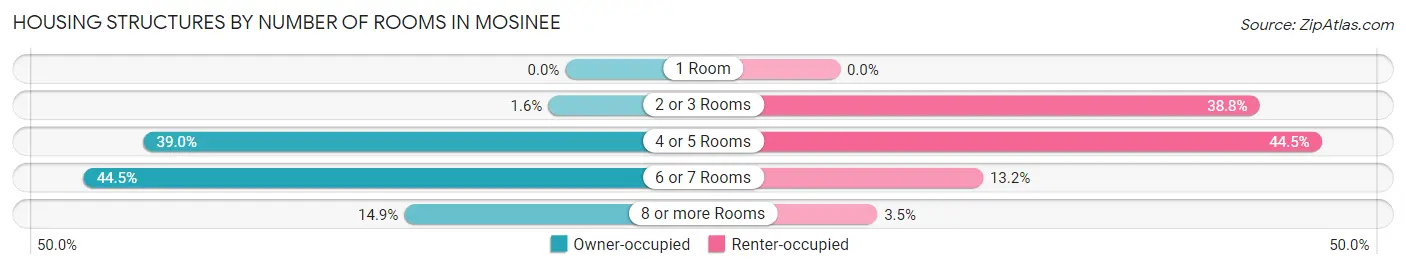
| Number of Rooms | Owner-occupied | Renter-occupied |
| 1 Room | 0 (0.0%) | 0 (0.0%) |
| 2 or 3 Rooms | 20 (1.6%) | 337 (38.8%) |
| 4 or 5 Rooms | 492 (39.0%) | 387 (44.5%) |
| 6 or 7 Rooms | 562 (44.5%) | 115 (13.2%) |
| 8 or more Rooms | 188 (14.9%) | 30 (3.5%) |
| Total | 1,262 (100.0%) | 869 (100.0%) |
Housing Structure by Heating Type in Mosinee
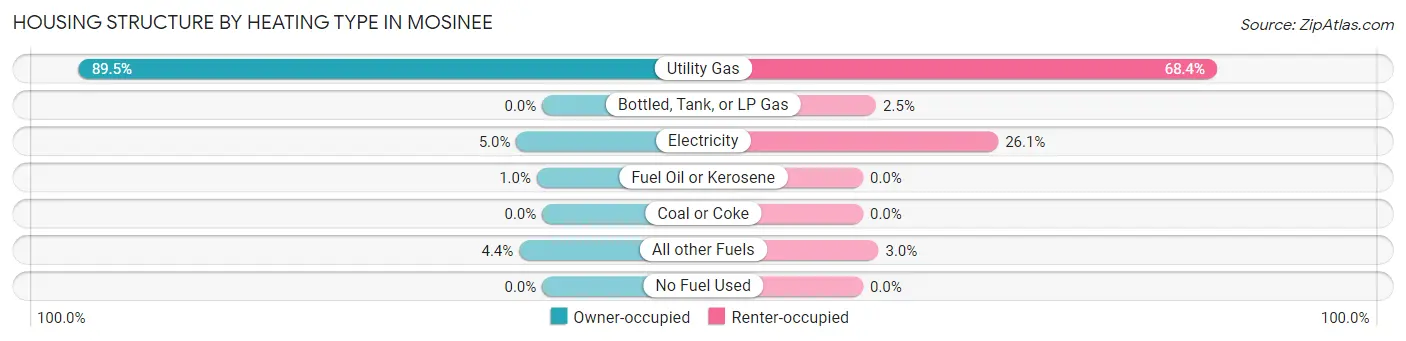
| Heating Type | Owner-occupied | Renter-occupied |
| Utility Gas | 1,130 (89.5%) | 594 (68.3%) |
| Bottled, Tank, or LP Gas | 0 (0.0%) | 22 (2.5%) |
| Electricity | 63 (5.0%) | 227 (26.1%) |
| Fuel Oil or Kerosene | 13 (1.0%) | 0 (0.0%) |
| Coal or Coke | 0 (0.0%) | 0 (0.0%) |
| All other Fuels | 56 (4.4%) | 26 (3.0%) |
| No Fuel Used | 0 (0.0%) | 0 (0.0%) |
| Total | 1,262 (100.0%) | 869 (100.0%) |
Household Vehicle Usage in Mosinee
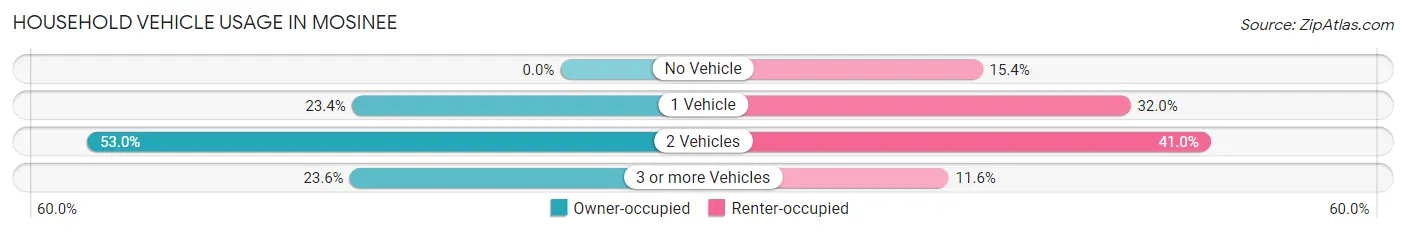
| Vehicles per Household | Owner-occupied | Renter-occupied |
| No Vehicle | 0 (0.0%) | 134 (15.4%) |
| 1 Vehicle | 295 (23.4%) | 278 (32.0%) |
| 2 Vehicles | 669 (53.0%) | 356 (41.0%) |
| 3 or more Vehicles | 298 (23.6%) | 101 (11.6%) |
| Total | 1,262 (100.0%) | 869 (100.0%) |
Real Estate & Mortgages in Mosinee
Real Estate and Mortgage Overview in Mosinee
| Characteristic | Without Mortgage | With Mortgage |
| Housing Units | 550 | 712 |
| Median Property Value | $160,400 | $157,600 |
| Median Household Income | $53,886 | $134 |
| Monthly Housing Costs | $551 | $0 |
| Real Estate Taxes | $2,857 | $0 |
Property Value by Mortgage Status in Mosinee
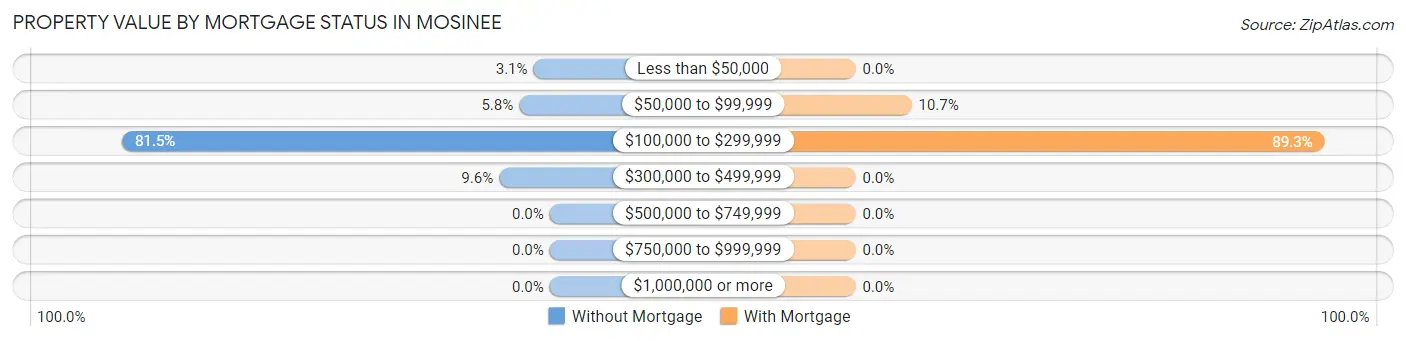
| Property Value | Without Mortgage | With Mortgage |
| Less than $50,000 | 17 (3.1%) | 0 (0.0%) |
| $50,000 to $99,999 | 32 (5.8%) | 76 (10.7%) |
| $100,000 to $299,999 | 448 (81.5%) | 636 (89.3%) |
| $300,000 to $499,999 | 53 (9.6%) | 0 (0.0%) |
| $500,000 to $749,999 | 0 (0.0%) | 0 (0.0%) |
| $750,000 to $999,999 | 0 (0.0%) | 0 (0.0%) |
| $1,000,000 or more | 0 (0.0%) | 0 (0.0%) |
| Total | 550 (100.0%) | 712 (100.0%) |
Household Income by Mortgage Status in Mosinee
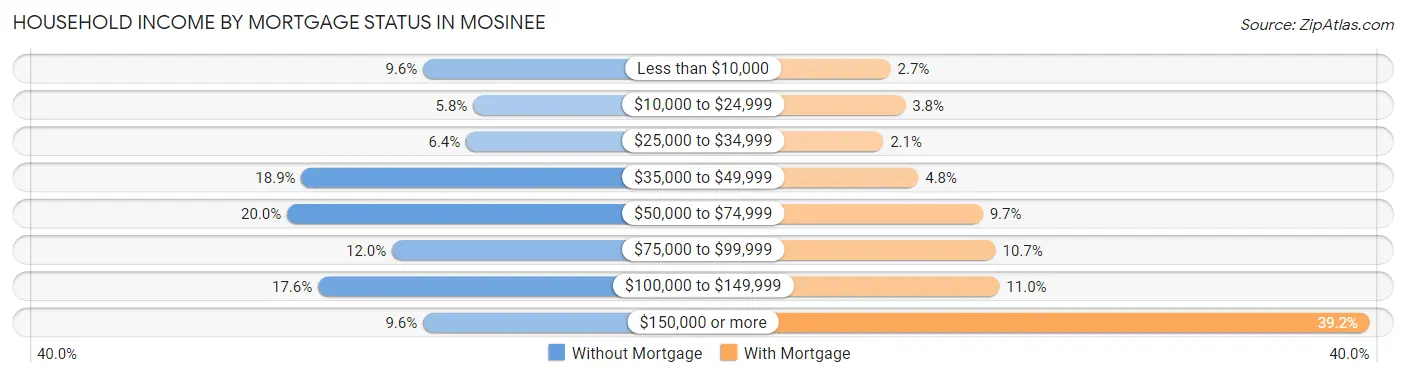
| Household Income | Without Mortgage | With Mortgage |
| Less than $10,000 | 53 (9.6%) | 19 (2.7%) |
| $10,000 to $24,999 | 32 (5.8%) | 27 (3.8%) |
| $25,000 to $34,999 | 35 (6.4%) | 15 (2.1%) |
| $35,000 to $49,999 | 104 (18.9%) | 34 (4.8%) |
| $50,000 to $74,999 | 110 (20.0%) | 69 (9.7%) |
| $75,000 to $99,999 | 66 (12.0%) | 76 (10.7%) |
| $100,000 to $149,999 | 97 (17.6%) | 78 (11.0%) |
| $150,000 or more | 53 (9.6%) | 279 (39.2%) |
| Total | 550 (100.0%) | 712 (100.0%) |
Property Value to Household Income Ratio in Mosinee
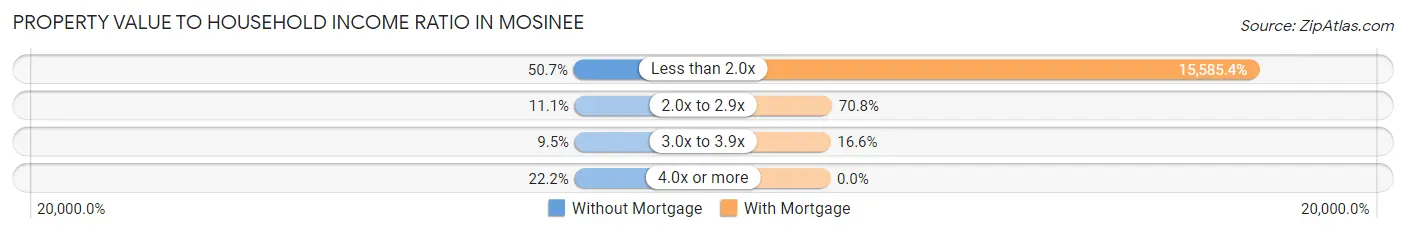
| Value-to-Income Ratio | Without Mortgage | With Mortgage |
| Less than 2.0x | 279 (50.7%) | 110,968 (15,585.4%) |
| 2.0x to 2.9x | 61 (11.1%) | 504 (70.8%) |
| 3.0x to 3.9x | 52 (9.5%) | 118 (16.6%) |
| 4.0x or more | 122 (22.2%) | 0 (0.0%) |
| Total | 550 (100.0%) | 712 (100.0%) |
Real Estate Taxes by Mortgage Status in Mosinee
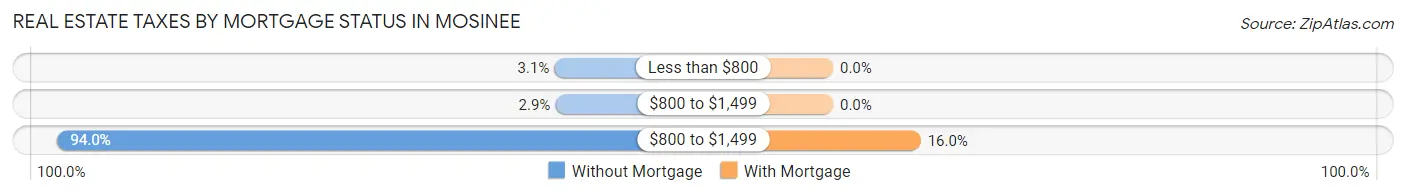
| Property Taxes | Without Mortgage | With Mortgage |
| Less than $800 | 17 (3.1%) | 0 (0.0%) |
| $800 to $1,499 | 16 (2.9%) | 0 (0.0%) |
| $800 to $1,499 | 517 (94.0%) | 114 (16.0%) |
| Total | 550 (100.0%) | 712 (100.0%) |
Health & Disability in Mosinee
Health Insurance Coverage by Age in Mosinee
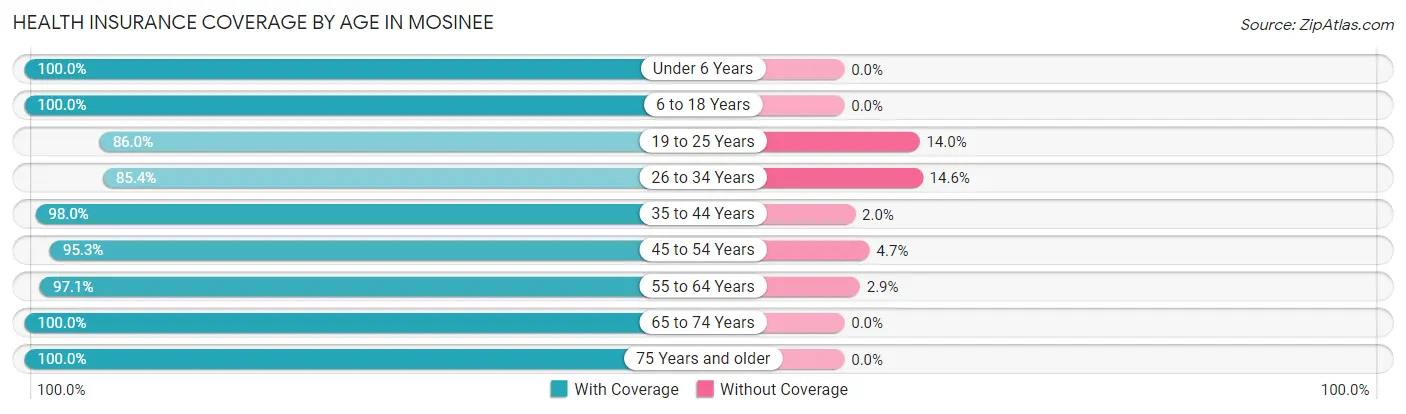
| Age Bracket | With Coverage | Without Coverage |
| Under 6 Years | 212 (100.0%) | 0 (0.0%) |
| 6 to 18 Years | 447 (100.0%) | 0 (0.0%) |
| 19 to 25 Years | 693 (86.0%) | 113 (14.0%) |
| 26 to 34 Years | 643 (85.4%) | 110 (14.6%) |
| 35 to 44 Years | 389 (98.0%) | 8 (2.0%) |
| 45 to 54 Years | 503 (95.3%) | 25 (4.7%) |
| 55 to 64 Years | 470 (97.1%) | 14 (2.9%) |
| 65 to 74 Years | 405 (100.0%) | 0 (0.0%) |
| 75 Years and older | 435 (100.0%) | 0 (0.0%) |
| Total | 4,197 (94.0%) | 270 (6.0%) |
Health Insurance Coverage by Citizenship Status in Mosinee
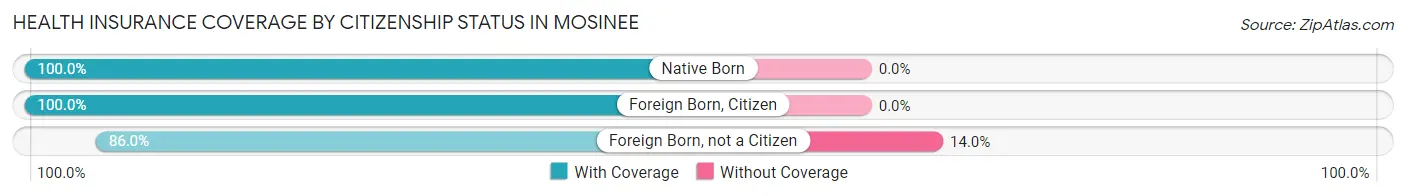
| Citizenship Status | With Coverage | Without Coverage |
| Native Born | 212 (100.0%) | 0 (0.0%) |
| Foreign Born, Citizen | 447 (100.0%) | 0 (0.0%) |
| Foreign Born, not a Citizen | 693 (86.0%) | 113 (14.0%) |
Health Insurance Coverage by Household Income in Mosinee
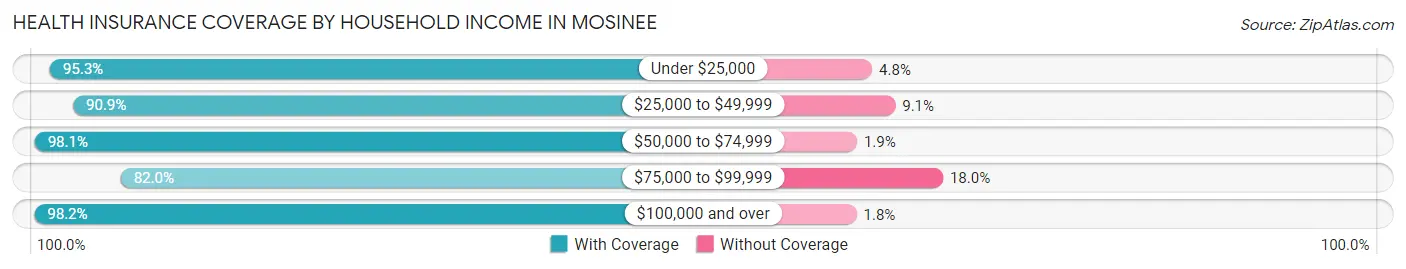
| Household Income | With Coverage | Without Coverage |
| Under $25,000 | 281 (95.3%) | 14 (4.8%) |
| $25,000 to $49,999 | 671 (90.9%) | 67 (9.1%) |
| $50,000 to $74,999 | 827 (98.1%) | 16 (1.9%) |
| $75,000 to $99,999 | 637 (82.0%) | 140 (18.0%) |
| $100,000 and over | 1,768 (98.2%) | 33 (1.8%) |
Public vs Private Health Insurance Coverage by Age in Mosinee
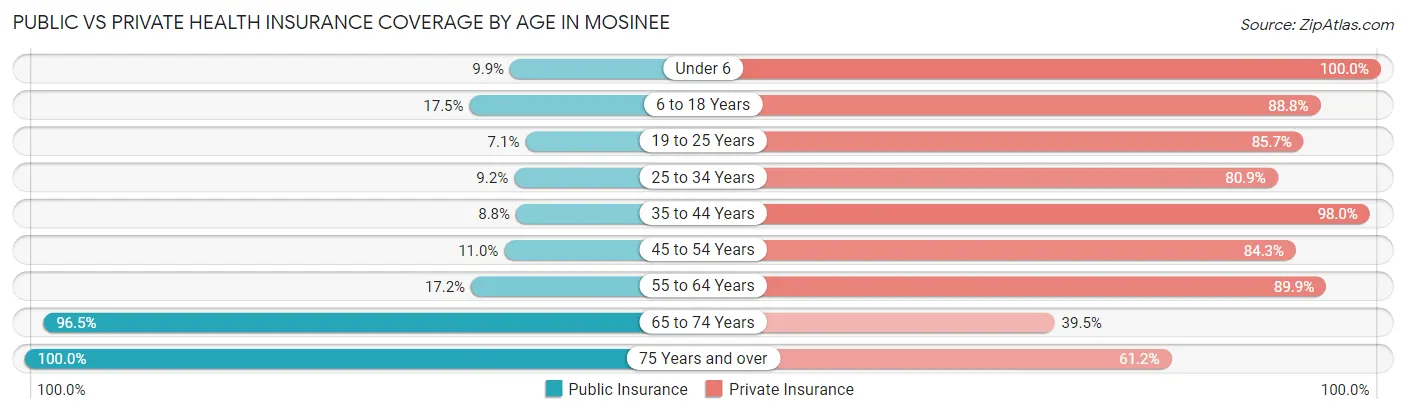
| Age Bracket | Public Insurance | Private Insurance |
| Under 6 | 21 (9.9%) | 212 (100.0%) |
| 6 to 18 Years | 78 (17.4%) | 397 (88.8%) |
| 19 to 25 Years | 57 (7.1%) | 691 (85.7%) |
| 25 to 34 Years | 69 (9.2%) | 609 (80.9%) |
| 35 to 44 Years | 35 (8.8%) | 389 (98.0%) |
| 45 to 54 Years | 58 (11.0%) | 445 (84.3%) |
| 55 to 64 Years | 83 (17.2%) | 435 (89.9%) |
| 65 to 74 Years | 391 (96.5%) | 160 (39.5%) |
| 75 Years and over | 435 (100.0%) | 266 (61.2%) |
| Total | 1,227 (27.5%) | 3,604 (80.7%) |
Disability Status by Sex by Age in Mosinee
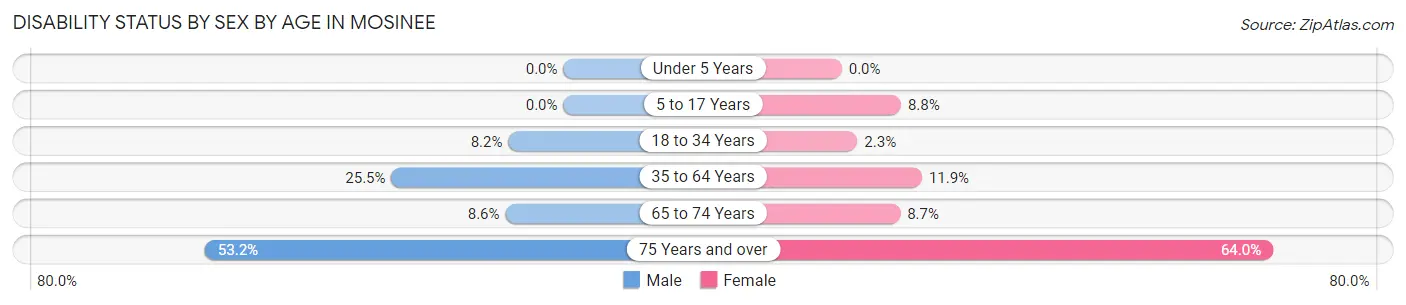
| Age Bracket | Male | Female |
| Under 5 Years | 0 (0.0%) | 0 (0.0%) |
| 5 to 17 Years | 0 (0.0%) | 21 (8.8%) |
| 18 to 34 Years | 50 (8.2%) | 22 (2.3%) |
| 35 to 64 Years | 201 (25.5%) | 74 (11.9%) |
| 65 to 74 Years | 18 (8.6%) | 17 (8.7%) |
| 75 Years and over | 91 (53.2%) | 169 (64.0%) |
Disability Class by Sex by Age in Mosinee
Disability Class: Hearing Difficulty
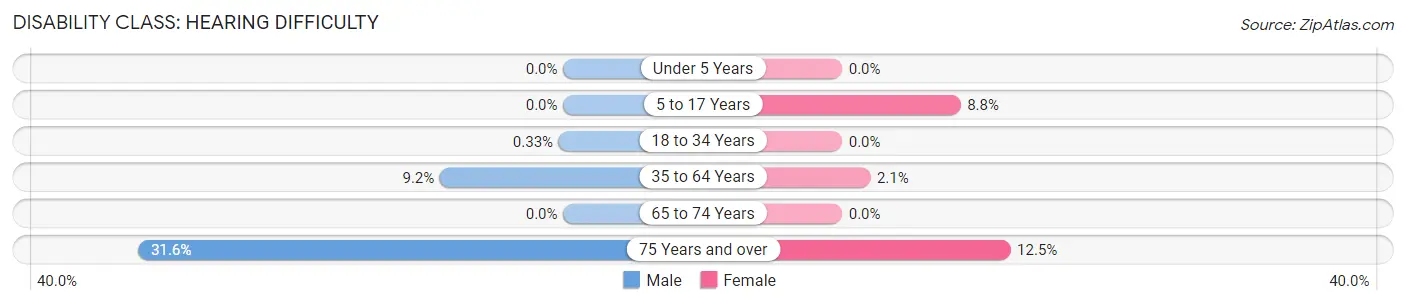
| Age Bracket | Male | Female |
| Under 5 Years | 0 (0.0%) | 0 (0.0%) |
| 5 to 17 Years | 0 (0.0%) | 21 (8.8%) |
| 18 to 34 Years | 2 (0.3%) | 0 (0.0%) |
| 35 to 64 Years | 72 (9.1%) | 13 (2.1%) |
| 65 to 74 Years | 0 (0.0%) | 0 (0.0%) |
| 75 Years and over | 54 (31.6%) | 33 (12.5%) |
Disability Class: Vision Difficulty
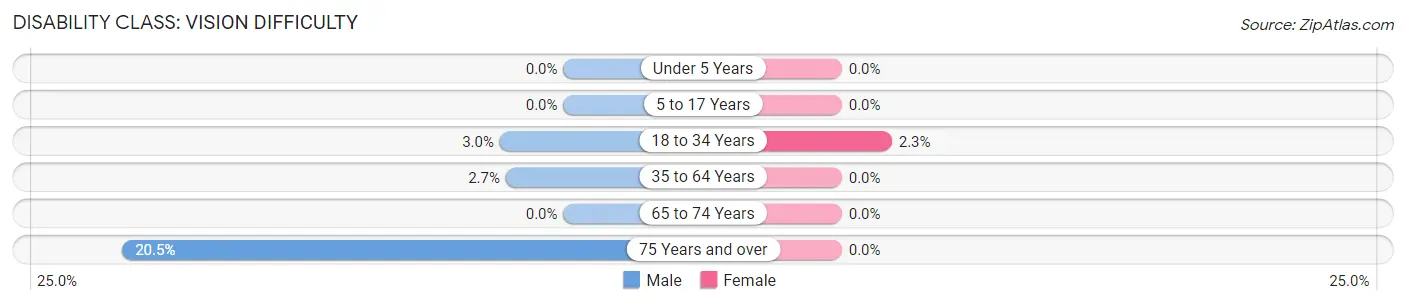
| Age Bracket | Male | Female |
| Under 5 Years | 0 (0.0%) | 0 (0.0%) |
| 5 to 17 Years | 0 (0.0%) | 0 (0.0%) |
| 18 to 34 Years | 18 (2.9%) | 22 (2.3%) |
| 35 to 64 Years | 21 (2.7%) | 0 (0.0%) |
| 65 to 74 Years | 0 (0.0%) | 0 (0.0%) |
| 75 Years and over | 35 (20.5%) | 0 (0.0%) |
Disability Class: Cognitive Difficulty
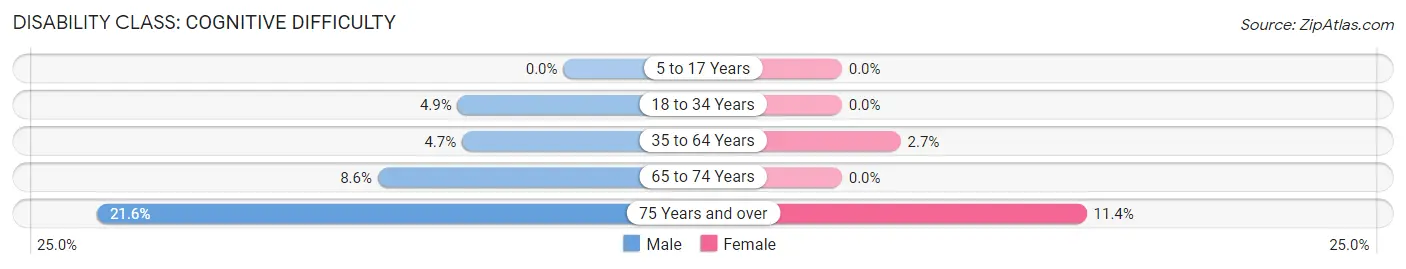
| Age Bracket | Male | Female |
| 5 to 17 Years | 0 (0.0%) | 0 (0.0%) |
| 18 to 34 Years | 30 (4.9%) | 0 (0.0%) |
| 35 to 64 Years | 37 (4.7%) | 17 (2.7%) |
| 65 to 74 Years | 18 (8.6%) | 0 (0.0%) |
| 75 Years and over | 37 (21.6%) | 30 (11.4%) |
Disability Class: Ambulatory Difficulty
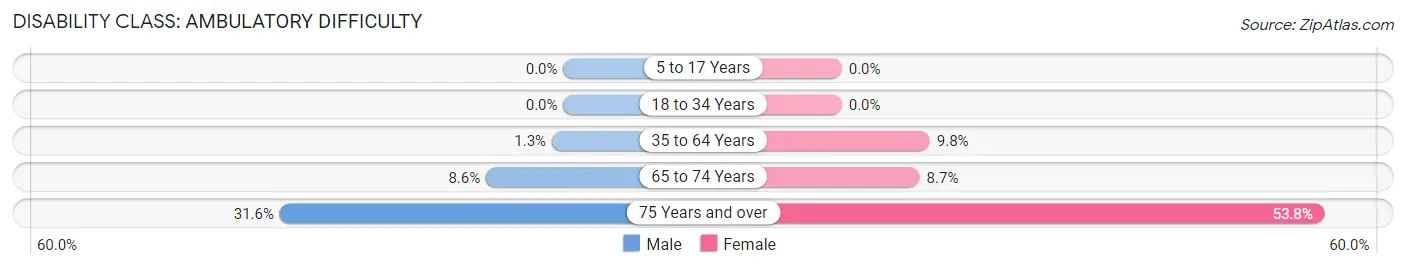
| Age Bracket | Male | Female |
| 5 to 17 Years | 0 (0.0%) | 0 (0.0%) |
| 18 to 34 Years | 0 (0.0%) | 0 (0.0%) |
| 35 to 64 Years | 10 (1.3%) | 61 (9.8%) |
| 65 to 74 Years | 18 (8.6%) | 17 (8.7%) |
| 75 Years and over | 54 (31.6%) | 142 (53.8%) |
Disability Class: Self-Care Difficulty
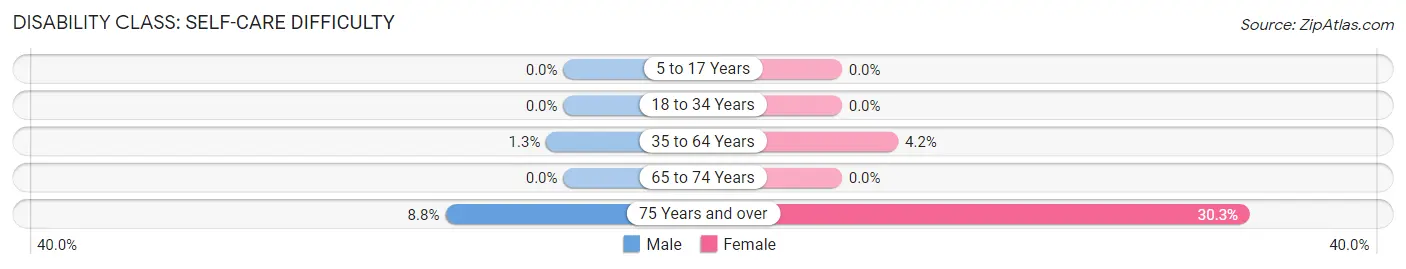
| Age Bracket | Male | Female |
| 5 to 17 Years | 0 (0.0%) | 0 (0.0%) |
| 18 to 34 Years | 0 (0.0%) | 0 (0.0%) |
| 35 to 64 Years | 10 (1.3%) | 26 (4.2%) |
| 65 to 74 Years | 0 (0.0%) | 0 (0.0%) |
| 75 Years and over | 15 (8.8%) | 80 (30.3%) |
Technology Access in Mosinee
Computing Device Access in Mosinee
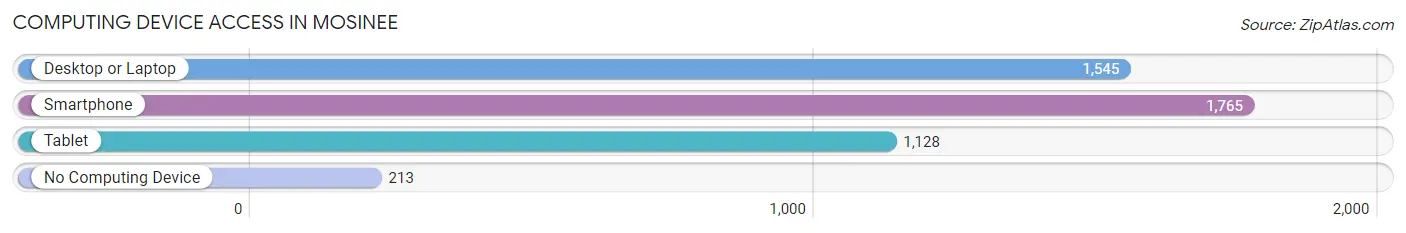
| Device Type | # Households | % Households |
| Desktop or Laptop | 1,545 | 72.5% |
| Smartphone | 1,765 | 82.8% |
| Tablet | 1,128 | 52.9% |
| No Computing Device | 213 | 10.0% |
| Total | 2,131 | 100.0% |
Internet Access in Mosinee
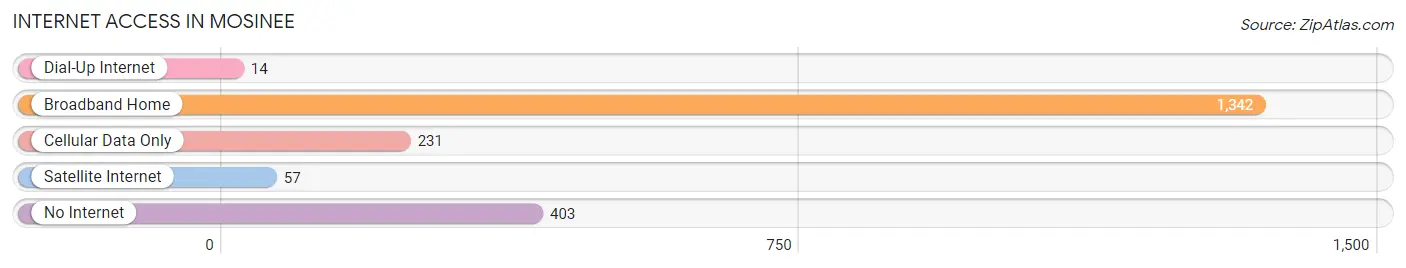
| Internet Type | # Households | % Households |
| Dial-Up Internet | 14 | 0.7% |
| Broadband Home | 1,342 | 63.0% |
| Cellular Data Only | 231 | 10.8% |
| Satellite Internet | 57 | 2.7% |
| No Internet | 403 | 18.9% |
| Total | 2,131 | 100.0% |
Mosinee Summary
Mosinee, Wisconsin is a small city located in Marathon County, Wisconsin. It is situated on the Wisconsin River, about 10 miles northwest of Wausau. The city has a population of 3,711 people, according to the 2010 census.
History
The area that is now Mosinee was first settled in the early 1800s by French-Canadian fur traders. The first permanent settlers arrived in the 1840s, and the town was officially founded in 1856. The town was named after Chief Mosinee, a leader of the Menominee tribe.
In the late 1800s, Mosinee became an important lumber town. The Wisconsin River was used to transport logs to sawmills in the area. The town also had a number of other industries, including a brickyard, a flour mill, and a brewery.
In the early 1900s, Mosinee began to experience a decline in its economy. The lumber industry had moved on, and the town was no longer a major transportation hub. The Great Depression further weakened the town’s economy, and many of its businesses closed.
In the 1950s, Mosinee began to experience a resurgence. The town was chosen as the site of a new paper mill, which provided much-needed jobs and economic stability. The paper mill is still in operation today, and is the largest employer in the city.
Geography
Mosinee is located in Marathon County, Wisconsin, about 10 miles northwest of Wausau. The city is situated on the Wisconsin River, and is surrounded by rolling hills and forests. The city has a total area of 4.2 square miles, all of which is land.
The climate in Mosinee is classified as humid continental. The summers are warm and humid, with temperatures reaching into the 80s. The winters are cold and snowy, with temperatures often dropping below zero.
Economy
The economy of Mosinee is largely based on the paper mill, which is the largest employer in the city. Other major employers include the Mosinee School District, the Mosinee Medical Center, and the Mosinee Fire Department.
The city also has a number of small businesses, including restaurants, retail stores, and service providers. The city is also home to a number of manufacturing companies, including a plastics manufacturer and a metal fabrication company.
Demographics
According to the 2010 census, the population of Mosinee was 3,711. The population is predominantly white (94.3%), with small percentages of African American (1.2%), Native American (0.7%), Asian (0.6%), and Hispanic (1.2%) residents.
The median household income in Mosinee is $45,813, and the median home value is $128,400. The city has a poverty rate of 11.3%, which is slightly higher than the national average.
Conclusion
Mosinee, Wisconsin is a small city located in Marathon County, Wisconsin. It is situated on the Wisconsin River, about 10 miles northwest of Wausau. The city has a population of 3,711 people, according to the 2010 census. The economy of Mosinee is largely based on the paper mill, which is the largest employer in the city. The population is predominantly white, with small percentages of African American, Native American, Asian, and Hispanic residents. The median household income in Mosinee is $45,813, and the median home value is $128,400. The city has a poverty rate of 11.3%, which is slightly higher than the national average.
Common Questions
What is Per Capita Income in Mosinee?
Per Capita income in Mosinee is $37,505.
What is the Median Family Income in Mosinee?
Median Family Income in Mosinee is $86,250.
What is the Median Household income in Mosinee?
Median Household Income in Mosinee is $68,219.
What is Income or Wage Gap in Mosinee?
Income or Wage Gap in Mosinee is 23.5%.
Women in Mosinee earn 76.5 cents for every dollar earned by a man.
What is Inequality or Gini Index in Mosinee?
Inequality or Gini Index in Mosinee is 0.37.
What is the Total Population of Mosinee?
Total Population of Mosinee is 4,467.
What is the Total Male Population of Mosinee?
Total Male Population of Mosinee is 2,106.
What is the Total Female Population of Mosinee?
Total Female Population of Mosinee is 2,361.
What is the Ratio of Males per 100 Females in Mosinee?
There are 89.20 Males per 100 Females in Mosinee.
What is the Ratio of Females per 100 Males in Mosinee?
There are 112.11 Females per 100 Males in Mosinee.
What is the Median Population Age in Mosinee?
Median Population Age in Mosinee is 35.2 Years.
What is the Average Family Size in Mosinee
Average Family Size in Mosinee is 2.7 People.
What is the Average Household Size in Mosinee
Average Household Size in Mosinee is 2.1 People.
How Large is the Labor Force in Mosinee?
There are 2,666 People in the Labor Forcein in Mosinee.
What is the Percentage of People in the Labor Force in Mosinee?
68.8% of People are in the Labor Force in Mosinee.
What is the Unemployment Rate in Mosinee?
Unemployment Rate in Mosinee is 0.1%.