Millston, WI Map & Demographics
Millston Map

Millston Overview
$26,290
PER CAPITA INCOME
$65,833
AVG FAMILY INCOME
$50,625
AVG HOUSEHOLD INCOME
0.6%
WAGE / INCOME GAP [ % ]
99.4¢/ $1
WAGE / INCOME GAP [ $ ]
0.31
INEQUALITY / GINI INDEX
139
TOTAL POPULATION
77
MALE POPULATION
62
FEMALE POPULATION
124.19
MALES / 100 FEMALES
80.52
FEMALES / 100 MALES
51.2
MEDIAN AGE
2.7
AVG FAMILY SIZE
2.2
AVG HOUSEHOLD SIZE
74
LABOR FORCE [ PEOPLE ]
58.3%
PERCENT IN LABOR FORCE
9.5%
UNEMPLOYMENT RATE
Millston Zip Codes
Income in Millston
Income Overview in Millston
Per Capita Income in Millston is $26,290, while median incomes of families and households are $65,833 and $50,625 respectively.
| Characteristic | Number | Measure |
| Per Capita Income | 139 | $26,290 |
| Median Family Income | 42 | $65,833 |
| Mean Family Income | 42 | $68,343 |
| Median Household Income | 62 | $50,625 |
| Mean Household Income | 62 | $57,900 |
| Income Deficit | 42 | $0 |
| Wage / Income Gap (%) | 139 | 0.62% |
| Wage / Income Gap ($) | 139 | 99.38¢ per $1 |
| Gini / Inequality Index | 139 | 0.31 |
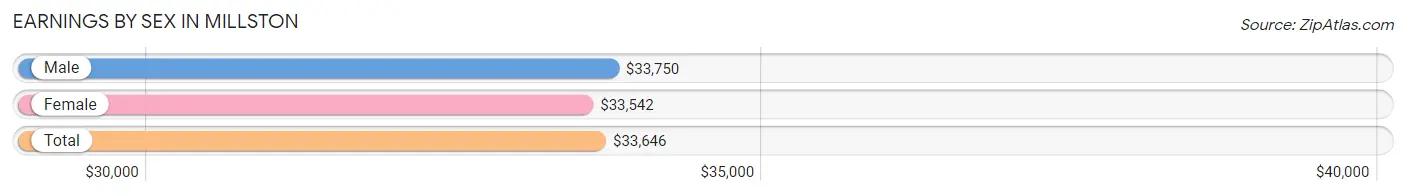
Earnings by Sex in Millston
Average Earnings in Millston are $33,646, $33,750 for men and $33,542 for women, a difference of 0.6%.
| Sex | Number | Average Earnings |
| Male | 48 (60.8%) | $33,750 |
| Female | 31 (39.2%) | $33,542 |
| Total | 79 (100.0%) | $33,646 |
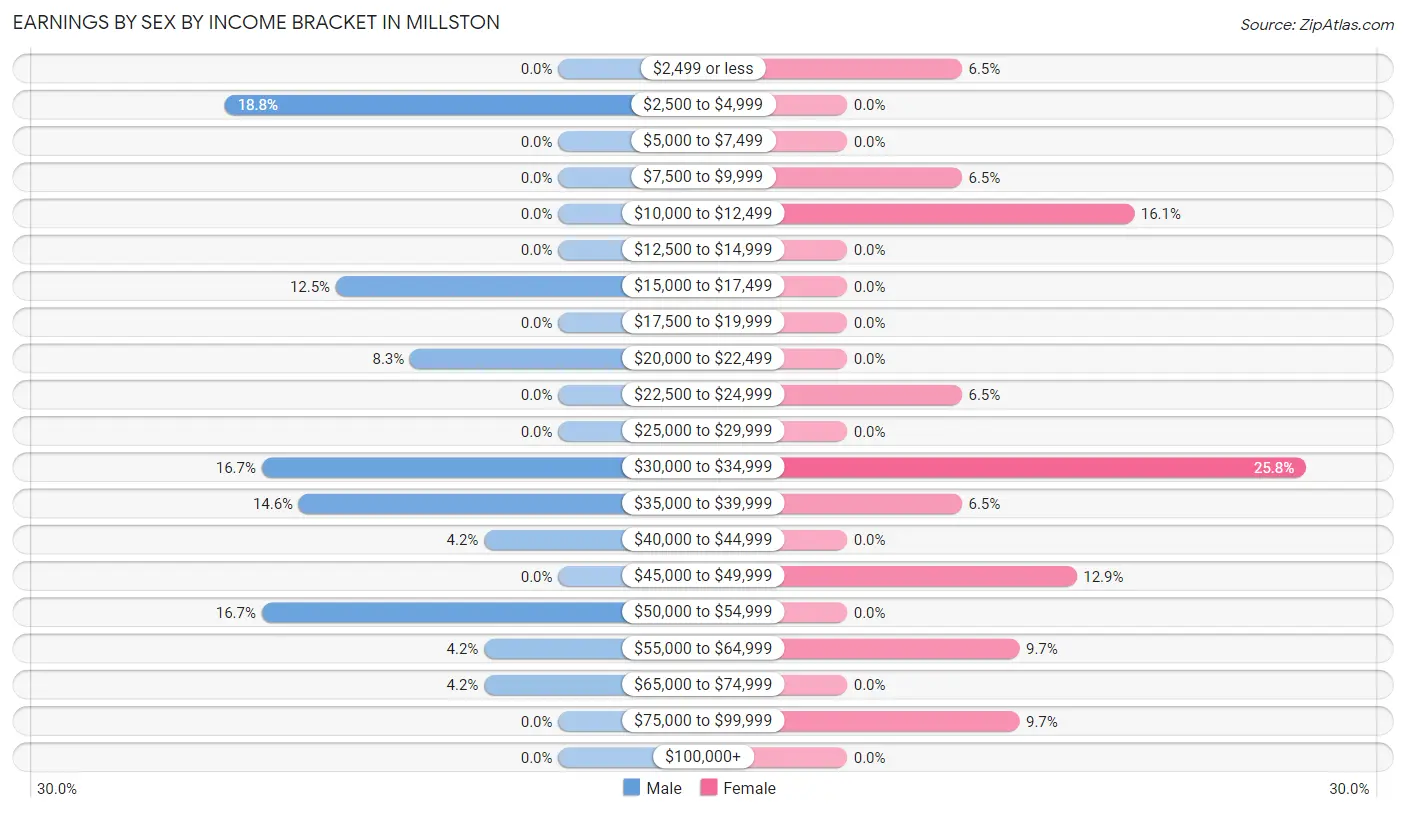
Earnings by Sex by Income Bracket in Millston
The most common earnings brackets in Millston are $2,500 to $4,999 for men (9 | 18.8%) and $30,000 to $34,999 for women (8 | 25.8%).
| Income | Male | Female |
| $2,499 or less | 0 (0.0%) | 2 (6.5%) |
| $2,500 to $4,999 | 9 (18.8%) | 0 (0.0%) |
| $5,000 to $7,499 | 0 (0.0%) | 0 (0.0%) |
| $7,500 to $9,999 | 0 (0.0%) | 2 (6.5%) |
| $10,000 to $12,499 | 0 (0.0%) | 5 (16.1%) |
| $12,500 to $14,999 | 0 (0.0%) | 0 (0.0%) |
| $15,000 to $17,499 | 6 (12.5%) | 0 (0.0%) |
| $17,500 to $19,999 | 0 (0.0%) | 0 (0.0%) |
| $20,000 to $22,499 | 4 (8.3%) | 0 (0.0%) |
| $22,500 to $24,999 | 0 (0.0%) | 2 (6.5%) |
| $25,000 to $29,999 | 0 (0.0%) | 0 (0.0%) |
| $30,000 to $34,999 | 8 (16.7%) | 8 (25.8%) |
| $35,000 to $39,999 | 7 (14.6%) | 2 (6.5%) |
| $40,000 to $44,999 | 2 (4.2%) | 0 (0.0%) |
| $45,000 to $49,999 | 0 (0.0%) | 4 (12.9%) |
| $50,000 to $54,999 | 8 (16.7%) | 0 (0.0%) |
| $55,000 to $64,999 | 2 (4.2%) | 3 (9.7%) |
| $65,000 to $74,999 | 2 (4.2%) | 0 (0.0%) |
| $75,000 to $99,999 | 0 (0.0%) | 3 (9.7%) |
| $100,000+ | 0 (0.0%) | 0 (0.0%) |
| Total | 48 (100.0%) | 31 (100.0%) |
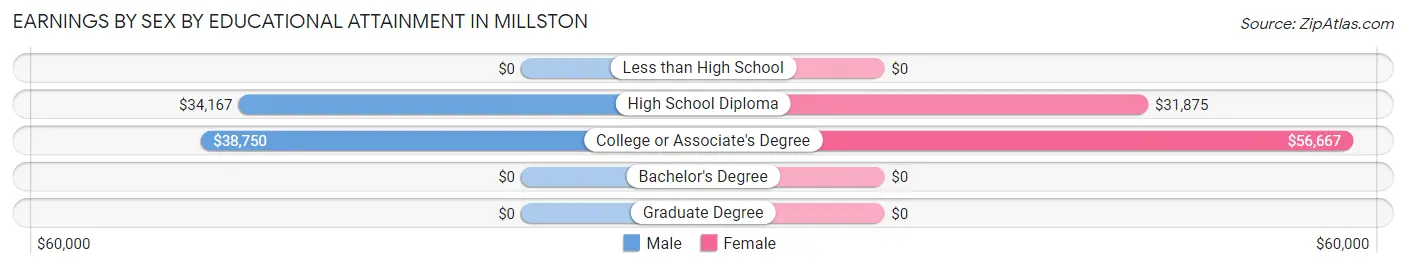
Earnings by Sex by Educational Attainment in Millston
Average earnings in Millston are $34,583 for men and $33,542 for women, a difference of 3.0%. Men with an educational attainment of college or associate's degree enjoy the highest average annual earnings of $38,750, while those with high school diploma education earn the least with $34,167. Women with an educational attainment of college or associate's degree earn the most with the average annual earnings of $56,667, while those with high school diploma education have the smallest earnings of $31,875.
| Educational Attainment | Male Income | Female Income |
| Less than High School | - | - |
| High School Diploma | $34,167 | $31,875 |
| College or Associate's Degree | $38,750 | $56,667 |
| Bachelor's Degree | - | - |
| Graduate Degree | - | - |
| Total | $34,583 | $33,542 |
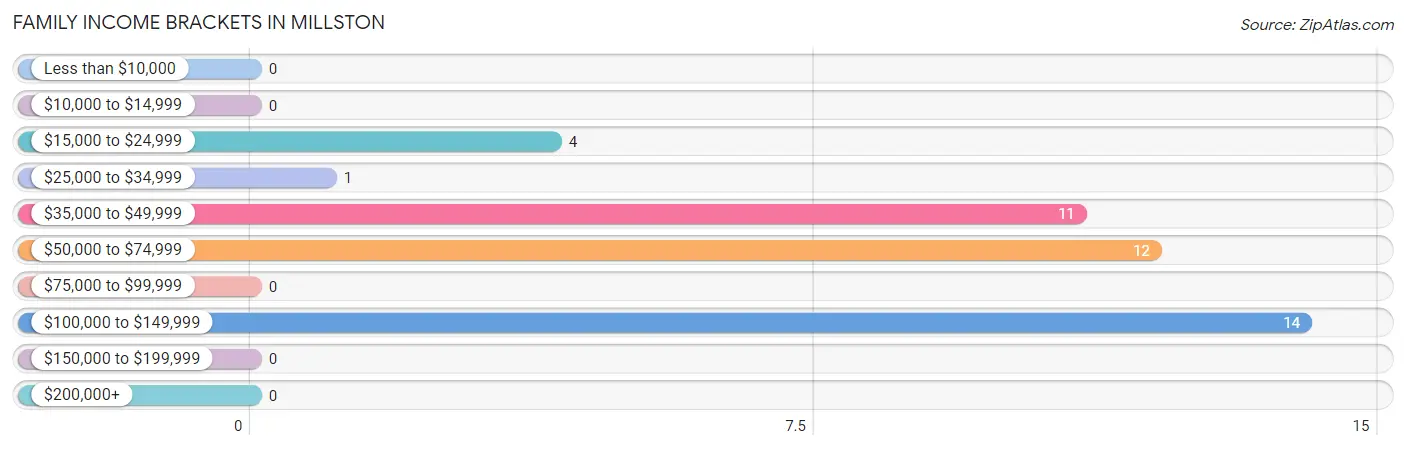
Family Income in Millston
Family Income Brackets in Millston
According to the Millston family income data, there are 14 families falling into the $100,000 to $149,999 income range, which is the most common income bracket and makes up 33.3% of all families.
| Income Bracket | # Families | % Families |
| Less than $10,000 | 0 | 0.0% |
| $10,000 to $14,999 | 0 | 0.0% |
| $15,000 to $24,999 | 4 | 9.5% |
| $25,000 to $34,999 | 1 | 2.4% |
| $35,000 to $49,999 | 11 | 26.2% |
| $50,000 to $74,999 | 12 | 28.6% |
| $75,000 to $99,999 | 0 | 0.0% |
| $100,000 to $149,999 | 14 | 33.3% |
| $150,000 to $199,999 | 0 | 0.0% |
| $200,000+ | 0 | 0.0% |
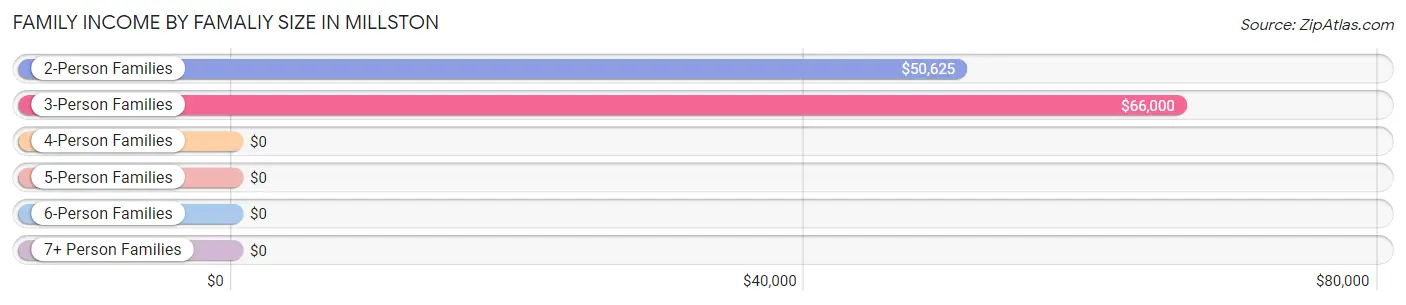
Family Income by Famaliy Size in Millston
3-person families (12 | 28.6%) account for the highest median family income in Millston with $66,000 per family, while 2-person families (25 | 59.5%) have the highest median income of $25,312 per family member.
| Income Bracket | # Families | Median Income |
| 2-Person Families | 25 (59.5%) | $50,625 |
| 3-Person Families | 12 (28.6%) | $66,000 |
| 4-Person Families | 5 (11.9%) | $0 |
| 5-Person Families | 0 (0.0%) | $0 |
| 6-Person Families | 0 (0.0%) | $0 |
| 7+ Person Families | 0 (0.0%) | $0 |
| Total | 42 (100.0%) | $65,833 |
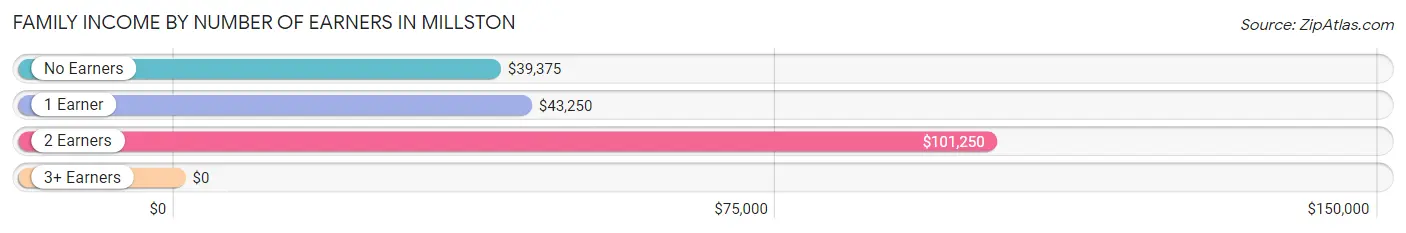
Family Income by Number of Earners in Millston
| Number of Earners | # Families | Median Income |
| No Earners | 11 (26.2%) | $39,375 |
| 1 Earner | 9 (21.4%) | $43,250 |
| 2 Earners | 16 (38.1%) | $101,250 |
| 3+ Earners | 6 (14.3%) | $0 |
| Total | 42 (100.0%) | $65,833 |
Household Income in Millston
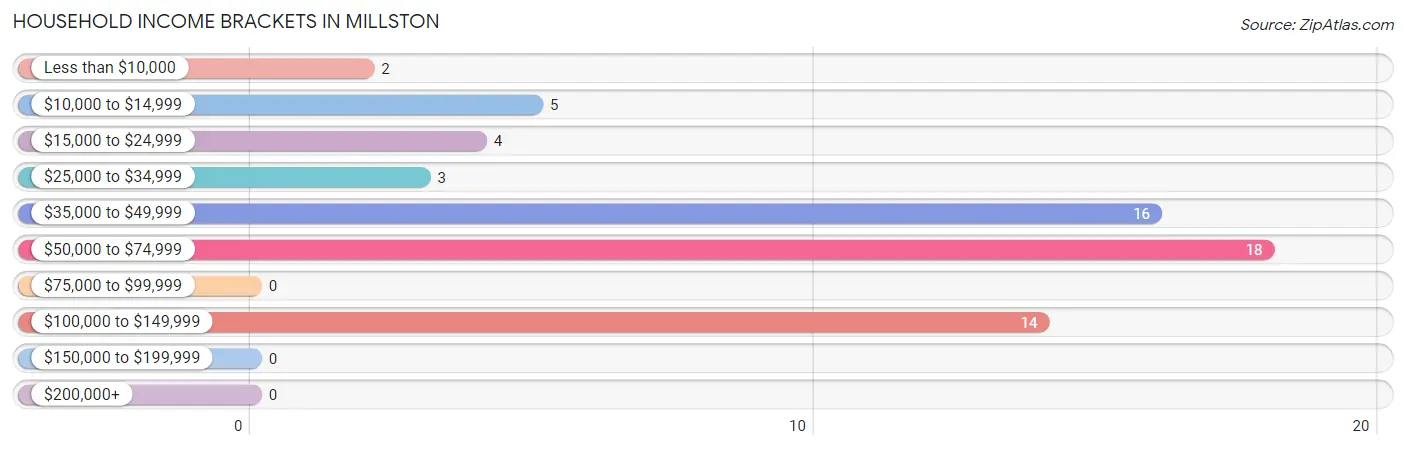
Household Income Brackets in Millston
With 18 households falling in the category, the $50,000 to $74,999 income range is the most frequent in Millston, accounting for 29.0% of all households.
| Income Bracket | # Households | % Households |
| Less than $10,000 | 2 | 3.2% |
| $10,000 to $14,999 | 5 | 8.1% |
| $15,000 to $24,999 | 4 | 6.5% |
| $25,000 to $34,999 | 3 | 4.8% |
| $35,000 to $49,999 | 16 | 25.8% |
| $50,000 to $74,999 | 18 | 29.0% |
| $75,000 to $99,999 | 0 | 0.0% |
| $100,000 to $149,999 | 14 | 22.6% |
| $150,000 to $199,999 | 0 | 0.0% |
| $200,000+ | 0 | 0.0% |
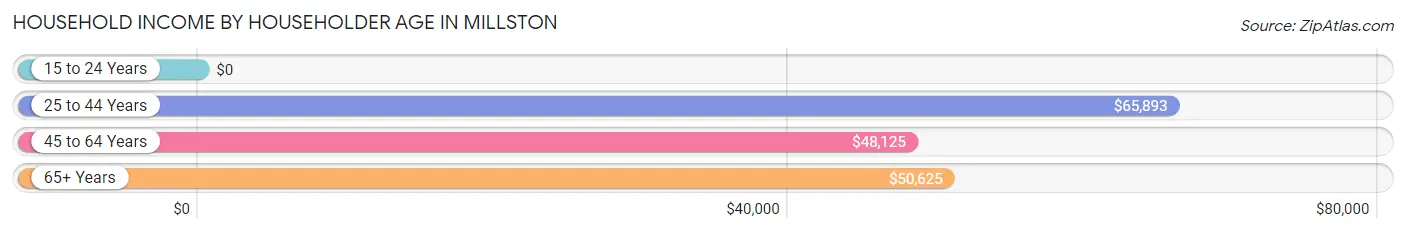
Household Income by Householder Age in Millston
The median household income in Millston is $50,625, with the highest median household income of $65,893 found in the 25 to 44 years age bracket for the primary householder. A total of 15 households (24.2%) fall into this category.
| Income Bracket | # Households | Median Income |
| 15 to 24 Years | 0 (0.0%) | $0 |
| 25 to 44 Years | 15 (24.2%) | $65,893 |
| 45 to 64 Years | 26 (41.9%) | $48,125 |
| 65+ Years | 21 (33.9%) | $50,625 |
| Total | 62 (100.0%) | $50,625 |
Poverty in Millston
Income Below Poverty by Sex and Age in Millston
With 5.2% poverty level for males and 11.3% for females among the residents of Millston, 55 to 64 year old males and 25 to 34 year old females are the most vulnerable to poverty, with 4 males (36.4%) and 2 females (50.0%) in their respective age groups living below the poverty level.
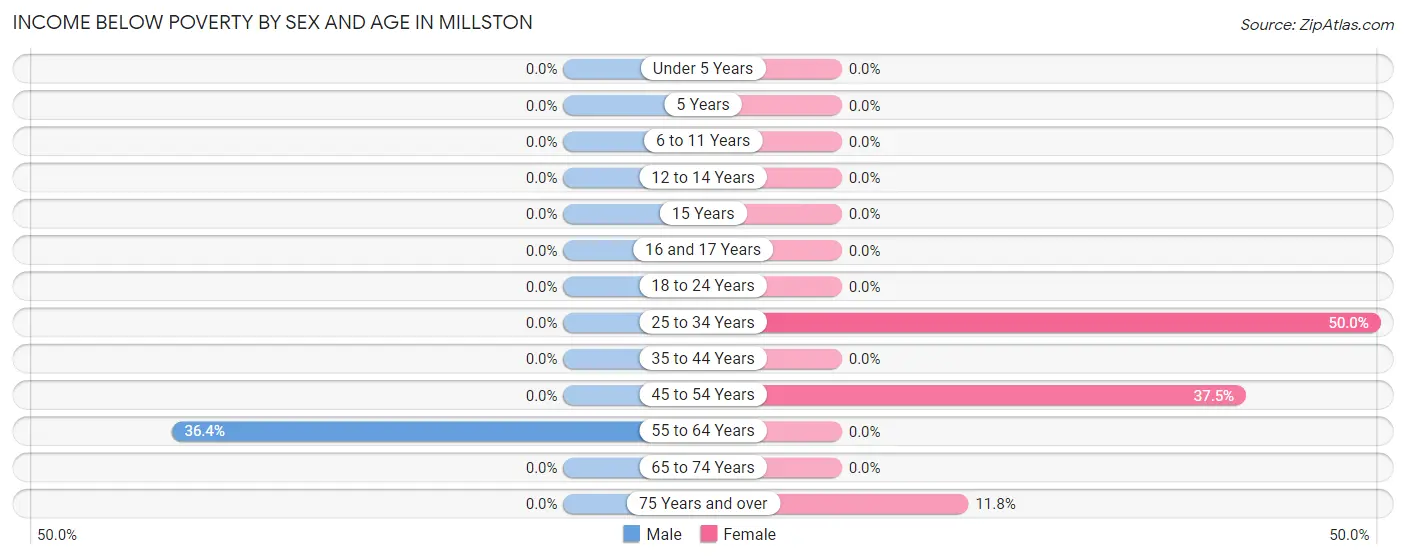
| Age Bracket | Male | Female |
| Under 5 Years | 0 (0.0%) | 0 (0.0%) |
| 5 Years | 0 (0.0%) | 0 (0.0%) |
| 6 to 11 Years | 0 (0.0%) | 0 (0.0%) |
| 12 to 14 Years | 0 (0.0%) | 0 (0.0%) |
| 15 Years | 0 (0.0%) | 0 (0.0%) |
| 16 and 17 Years | 0 (0.0%) | 0 (0.0%) |
| 18 to 24 Years | 0 (0.0%) | 0 (0.0%) |
| 25 to 34 Years | 0 (0.0%) | 2 (50.0%) |
| 35 to 44 Years | 0 (0.0%) | 0 (0.0%) |
| 45 to 54 Years | 0 (0.0%) | 3 (37.5%) |
| 55 to 64 Years | 4 (36.4%) | 0 (0.0%) |
| 65 to 74 Years | 0 (0.0%) | 0 (0.0%) |
| 75 Years and over | 0 (0.0%) | 2 (11.8%) |
| Total | 4 (5.2%) | 7 (11.3%) |
Income Above Poverty by Sex and Age in Millston
According to the poverty statistics in Millston, males aged 6 to 11 years and females aged under 5 years are the age groups that are most secure financially, with 100.0% of males and 100.0% of females in these age groups living above the poverty line.
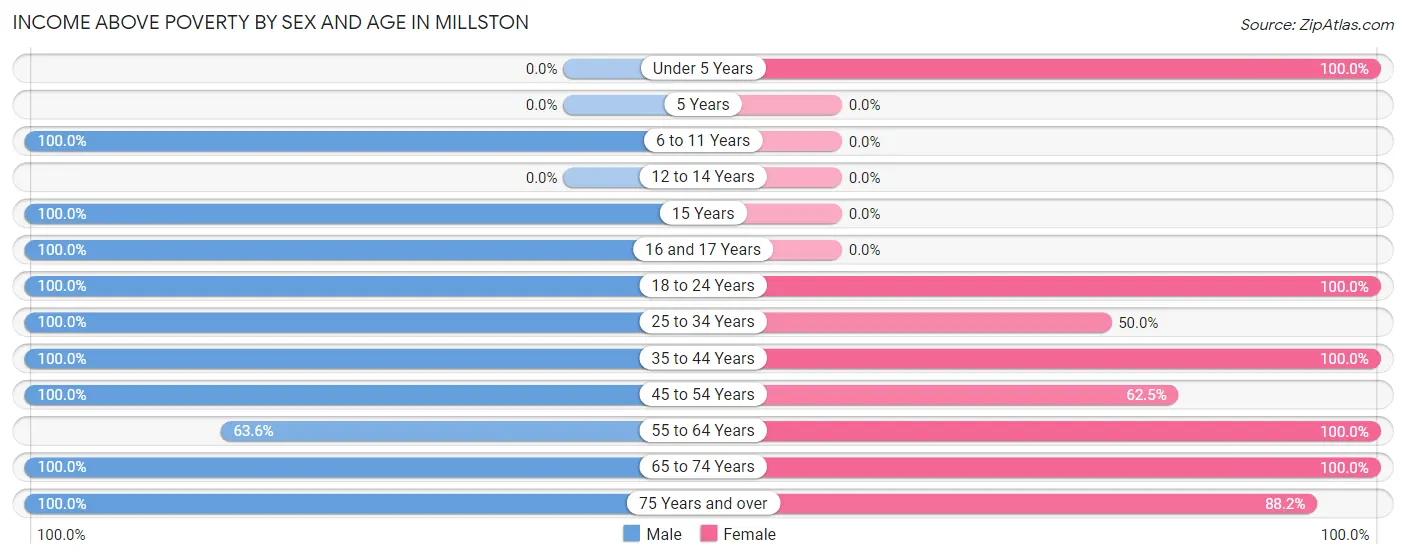
| Age Bracket | Male | Female |
| Under 5 Years | 0 (0.0%) | 1 (100.0%) |
| 5 Years | 0 (0.0%) | 0 (0.0%) |
| 6 to 11 Years | 4 (100.0%) | 0 (0.0%) |
| 12 to 14 Years | 0 (0.0%) | 0 (0.0%) |
| 15 Years | 7 (100.0%) | 0 (0.0%) |
| 16 and 17 Years | 3 (100.0%) | 0 (0.0%) |
| 18 to 24 Years | 3 (100.0%) | 3 (100.0%) |
| 25 to 34 Years | 3 (100.0%) | 2 (50.0%) |
| 35 to 44 Years | 23 (100.0%) | 15 (100.0%) |
| 45 to 54 Years | 7 (100.0%) | 5 (62.5%) |
| 55 to 64 Years | 7 (63.6%) | 11 (100.0%) |
| 65 to 74 Years | 6 (100.0%) | 3 (100.0%) |
| 75 Years and over | 10 (100.0%) | 15 (88.2%) |
| Total | 73 (94.8%) | 55 (88.7%) |
Income Below Poverty Among Married-Couple Families in Millston
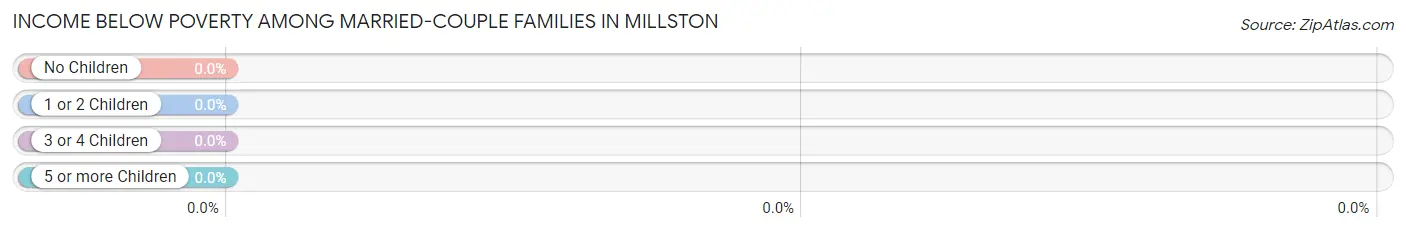
| Children | Above Poverty | Below Poverty |
| No Children | 27 (100.0%) | 0 (0.0%) |
| 1 or 2 Children | 5 (100.0%) | 0 (0.0%) |
| 3 or 4 Children | 0 (0.0%) | 0 (0.0%) |
| 5 or more Children | 0 (0.0%) | 0 (0.0%) |
| Total | 32 (100.0%) | 0 (0.0%) |
Income Below Poverty Among Single-Parent Households in Millston
| Children | Single Father | Single Mother |
| No Children | 0 (0.0%) | 0 (0.0%) |
| 1 or 2 Children | 0 (0.0%) | 0 (0.0%) |
| 3 or 4 Children | 0 (0.0%) | 0 (0.0%) |
| 5 or more Children | 0 (0.0%) | 0 (0.0%) |
| Total | 0 (0.0%) | 0 (0.0%) |
Income Below Poverty Among Married-Couple vs Single-Parent Households in Millston
| Children | Married-Couple Families | Single-Parent Households |
| No Children | 0 (0.0%) | 0 (0.0%) |
| 1 or 2 Children | 0 (0.0%) | 0 (0.0%) |
| 3 or 4 Children | 0 (0.0%) | 0 (0.0%) |
| 5 or more Children | 0 (0.0%) | 0 (0.0%) |
| Total | 0 (0.0%) | 0 (0.0%) |
Race in Millston
The most populous races in Millston are White / Caucasian (138 | 99.3%), and Native / Alaskan (1 | 0.7%).
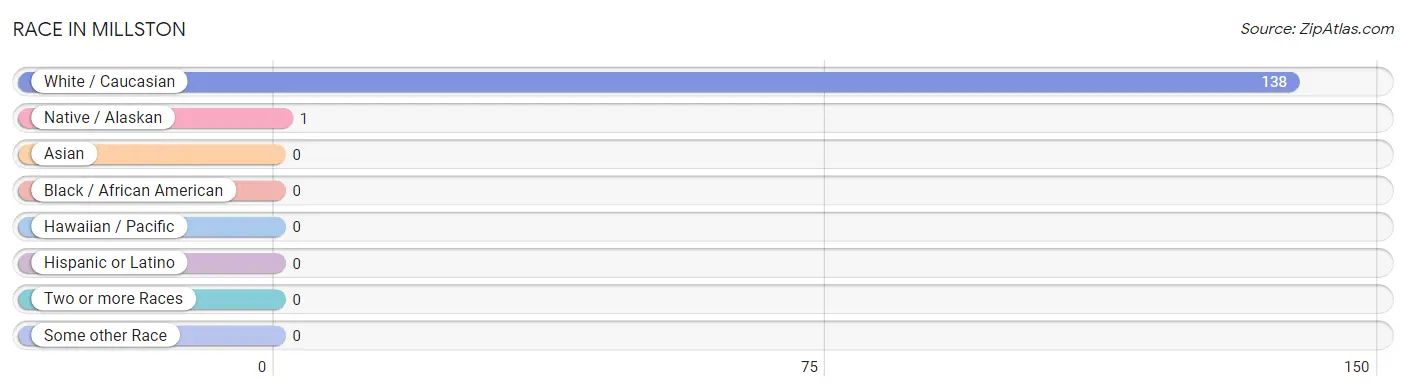
| Race | # Population | % Population |
| Asian | 0 | 0.0% |
| Black / African American | 0 | 0.0% |
| Hawaiian / Pacific | 0 | 0.0% |
| Hispanic or Latino | 0 | 0.0% |
| Native / Alaskan | 1 | 0.7% |
| White / Caucasian | 138 | 99.3% |
| Two or more Races | 0 | 0.0% |
| Some other Race | 0 | 0.0% |
| Total | 139 | 100.0% |
Ancestry in Millston
The most populous ancestries reported in Millston are German (51 | 36.7%), American (10 | 7.2%), Polish (10 | 7.2%), English (9 | 6.5%), and Norwegian (9 | 6.5%), together accounting for 64.0% of all Millston residents.
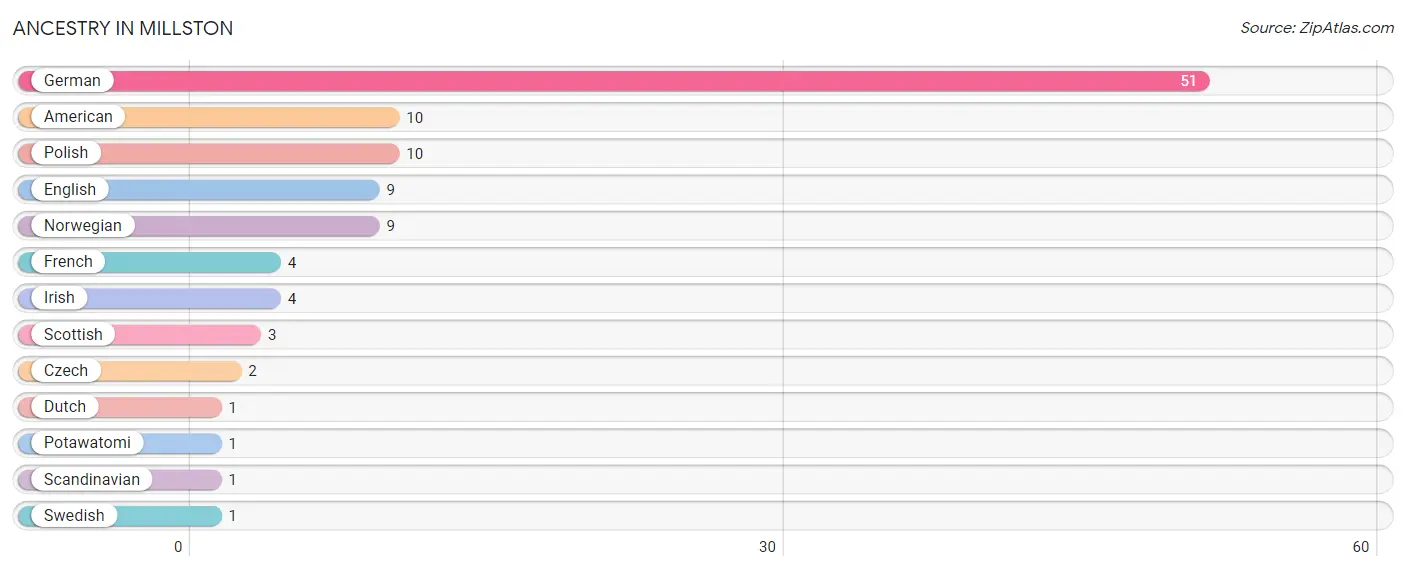
| Ancestry | # Population | % Population |
| American | 10 | 7.2% |
| Czech | 2 | 1.4% |
| Dutch | 1 | 0.7% |
| English | 9 | 6.5% |
| French | 4 | 2.9% |
| German | 51 | 36.7% |
| Irish | 4 | 2.9% |
| Norwegian | 9 | 6.5% |
| Polish | 10 | 7.2% |
| Potawatomi | 1 | 0.7% |
| Scandinavian | 1 | 0.7% |
| Scottish | 3 | 2.2% |
| Swedish | 1 | 0.7% | View All 13 Rows |
Immigrants in Millston

| Immigration Origin | # Population | % Population | View All 0 Rows |
Sex and Age in Millston
Sex and Age in Millston
The most populous age groups in Millston are 40 to 44 Years (15 | 19.5%) for men and 75 to 79 Years (14 | 22.6%) for women.
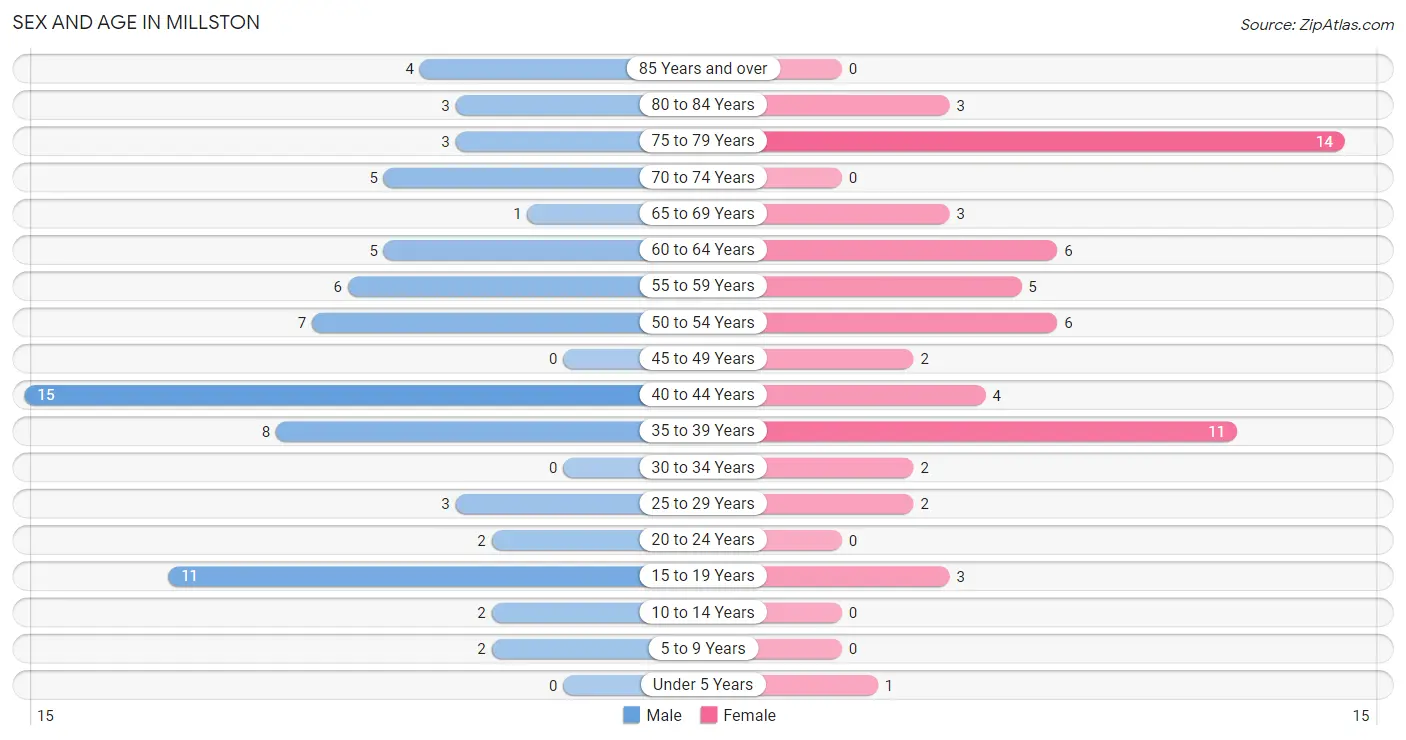
| Age Bracket | Male | Female |
| Under 5 Years | 0 (0.0%) | 1 (1.6%) |
| 5 to 9 Years | 2 (2.6%) | 0 (0.0%) |
| 10 to 14 Years | 2 (2.6%) | 0 (0.0%) |
| 15 to 19 Years | 11 (14.3%) | 3 (4.8%) |
| 20 to 24 Years | 2 (2.6%) | 0 (0.0%) |
| 25 to 29 Years | 3 (3.9%) | 2 (3.2%) |
| 30 to 34 Years | 0 (0.0%) | 2 (3.2%) |
| 35 to 39 Years | 8 (10.4%) | 11 (17.7%) |
| 40 to 44 Years | 15 (19.5%) | 4 (6.5%) |
| 45 to 49 Years | 0 (0.0%) | 2 (3.2%) |
| 50 to 54 Years | 7 (9.1%) | 6 (9.7%) |
| 55 to 59 Years | 6 (7.8%) | 5 (8.1%) |
| 60 to 64 Years | 5 (6.5%) | 6 (9.7%) |
| 65 to 69 Years | 1 (1.3%) | 3 (4.8%) |
| 70 to 74 Years | 5 (6.5%) | 0 (0.0%) |
| 75 to 79 Years | 3 (3.9%) | 14 (22.6%) |
| 80 to 84 Years | 3 (3.9%) | 3 (4.8%) |
| 85 Years and over | 4 (5.2%) | 0 (0.0%) |
| Total | 77 (100.0%) | 62 (100.0%) |
Families and Households in Millston
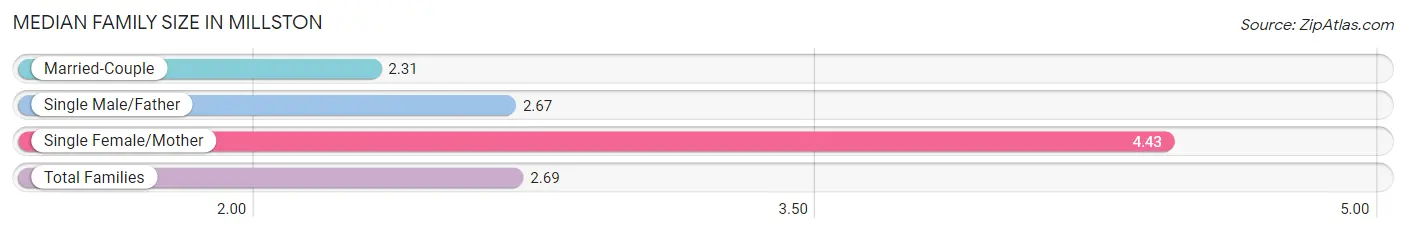
Median Family Size in Millston
The median family size in Millston is 2.69 persons per family, with single female/mother families (7 | 16.7%) accounting for the largest median family size of 4.43 persons per family. On the other hand, married-couple families (32 | 76.2%) represent the smallest median family size with 2.31 persons per family.
| Family Type | # Families | Family Size |
| Married-Couple | 32 (76.2%) | 2.31 |
| Single Male/Father | 3 (7.1%) | 2.67 |
| Single Female/Mother | 7 (16.7%) | 4.43 |
| Total Families | 42 (100.0%) | 2.69 |
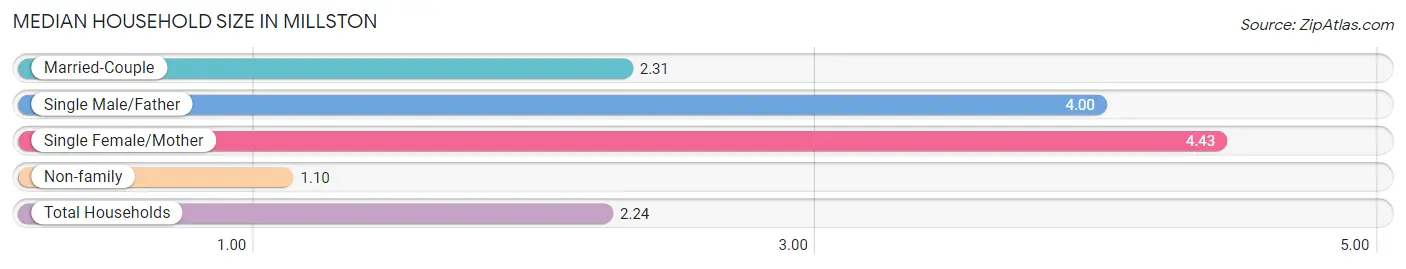
Median Household Size in Millston
The median household size in Millston is 2.24 persons per household, with single female/mother households (7 | 11.3%) accounting for the largest median household size of 4.43 persons per household. non-family households (20 | 32.3%) represent the smallest median household size with 1.10 persons per household.
| Household Type | # Households | Household Size |
| Married-Couple | 32 (51.6%) | 2.31 |
| Single Male/Father | 3 (4.8%) | 4.00 |
| Single Female/Mother | 7 (11.3%) | 4.43 |
| Non-family | 20 (32.3%) | 1.10 |
| Total Households | 62 (100.0%) | 2.24 |
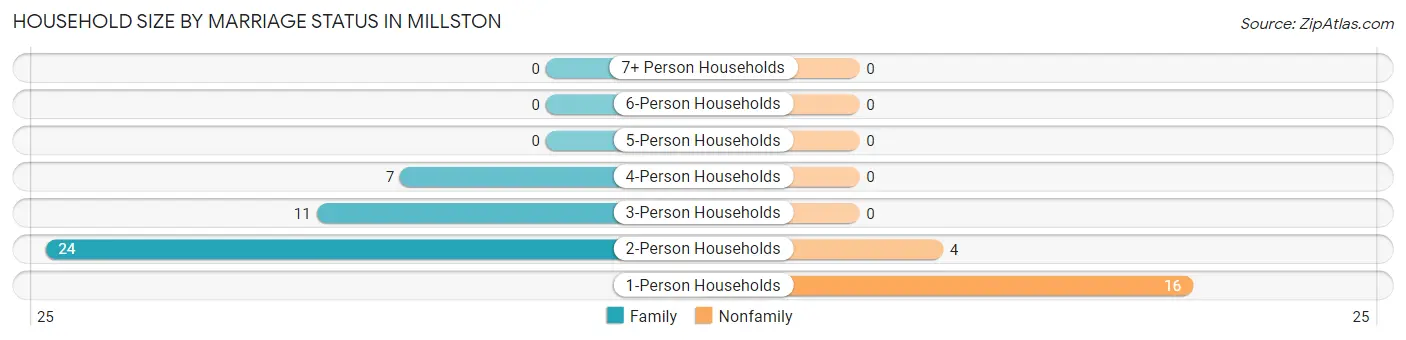
Household Size by Marriage Status in Millston
Out of a total of 62 households in Millston, 42 (67.7%) are family households, while 20 (32.3%) are nonfamily households. The most numerous type of family households are 2-person households, comprising 24, and the most common type of nonfamily households are 1-person households, comprising 16.
| Household Size | Family Households | Nonfamily Households |
| 1-Person Households | - | 16 (25.8%) |
| 2-Person Households | 24 (38.7%) | 4 (6.5%) |
| 3-Person Households | 11 (17.7%) | 0 (0.0%) |
| 4-Person Households | 7 (11.3%) | 0 (0.0%) |
| 5-Person Households | 0 (0.0%) | 0 (0.0%) |
| 6-Person Households | 0 (0.0%) | 0 (0.0%) |
| 7+ Person Households | 0 (0.0%) | 0 (0.0%) |
| Total | 42 (67.7%) | 20 (32.3%) |
Female Fertility in Millston
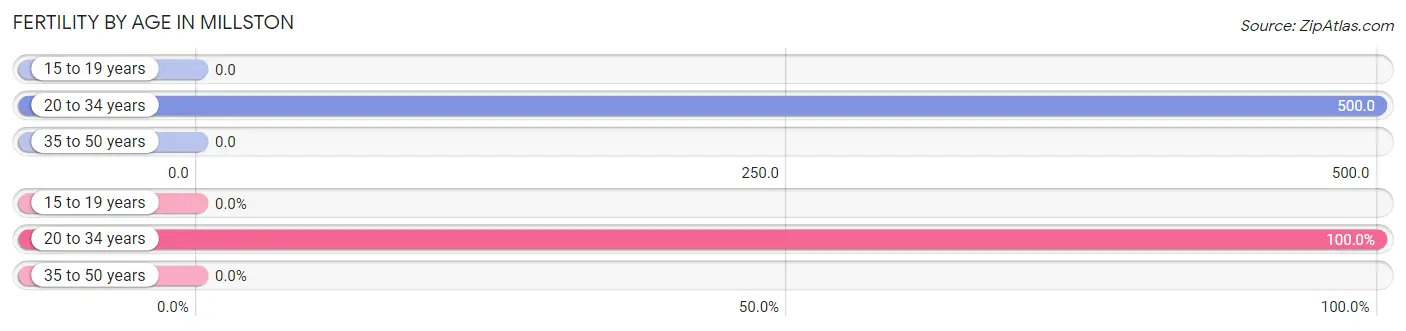
Fertility by Age in Millston
Average fertility rate in Millston is 83.0 births per 1,000 women. Women in the age bracket of 20 to 34 years have the highest fertility rate with 500.0 births per 1,000 women. Women in the age bracket of 20 to 34 years acount for 100.0% of all women with births.
| Age Bracket | Women with Births | Births / 1,000 Women |
| 15 to 19 years | 0 (0.0%) | 0.0 |
| 20 to 34 years | 2 (100.0%) | 500.0 |
| 35 to 50 years | 0 (0.0%) | 0.0 |
| Total | 2 (100.0%) | 83.0 |
Fertility by Age by Marriage Status in Millston
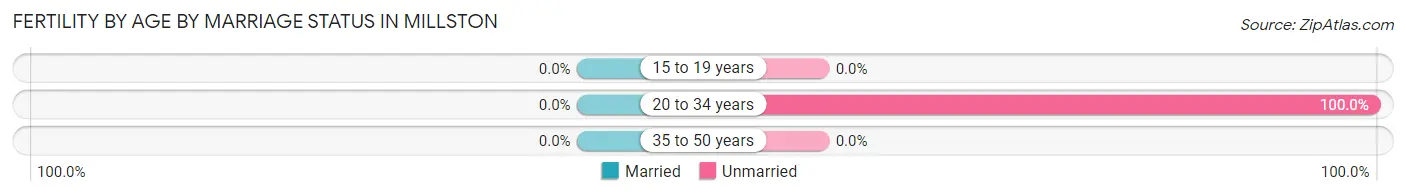
| Age Bracket | Married | Unmarried |
| 15 to 19 years | 0 (0.0%) | 0 (0.0%) |
| 20 to 34 years | 0 (0.0%) | 2 (100.0%) |
| 35 to 50 years | 0 (0.0%) | 0 (0.0%) |
| Total | 0 (0.0%) | 2 (100.0%) |
Fertility by Education in Millston
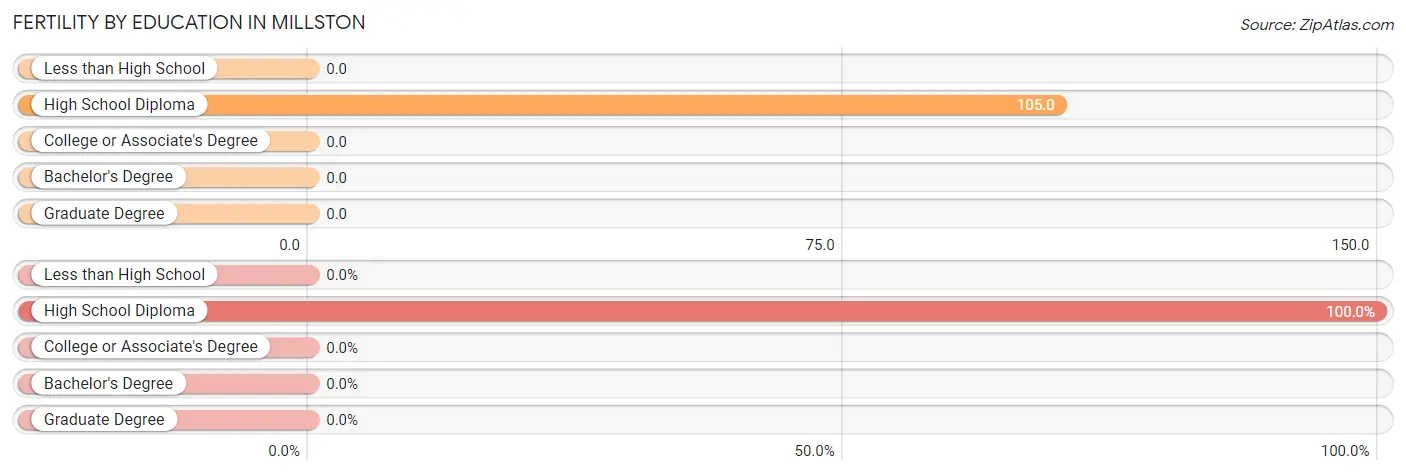
| Educational Attainment | Women with Births | Births / 1,000 Women |
| Less than High School | 0 (0.0%) | 0.0 |
| High School Diploma | 2 (100.0%) | 105.0 |
| College or Associate's Degree | 0 (0.0%) | 0.0 |
| Bachelor's Degree | 0 (0.0%) | 0.0 |
| Graduate Degree | 0 (0.0%) | 0.0 |
| Total | 2 (100.0%) | 83.0 |
Fertility by Education by Marriage Status in Millston
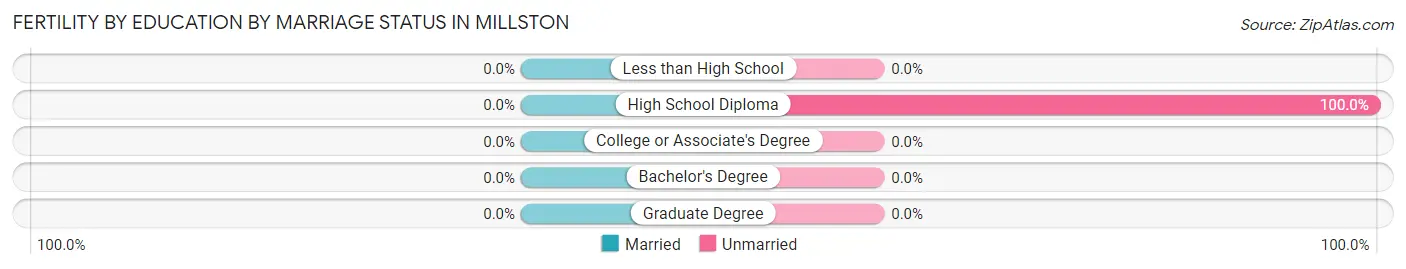
| Educational Attainment | Married | Unmarried |
| Less than High School | 0 (0.0%) | 0 (0.0%) |
| High School Diploma | 0 (0.0%) | 2 (100.0%) |
| College or Associate's Degree | 0 (0.0%) | 0 (0.0%) |
| Bachelor's Degree | 0 (0.0%) | 0 (0.0%) |
| Graduate Degree | 0 (0.0%) | 0 (0.0%) |
| Total | 0 (0.0%) | 2 (100.0%) |
Employment Characteristics in Millston
Employment by Class of Employer in Millston
Among the 67 employed individuals in Millston, private company employees (41 | 61.2%), self-employed (incorporated) (15 | 22.4%), and state government employees (4 | 6.0%) make up the most common classes of employment.
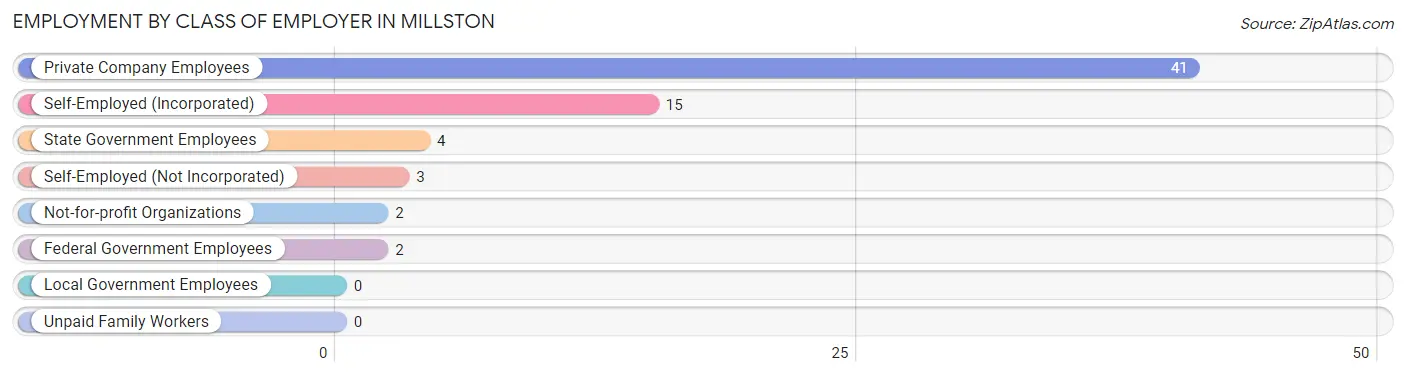
| Employer Class | # Employees | % Employees |
| Private Company Employees | 41 | 61.2% |
| Self-Employed (Incorporated) | 15 | 22.4% |
| Self-Employed (Not Incorporated) | 3 | 4.5% |
| Not-for-profit Organizations | 2 | 3.0% |
| Local Government Employees | 0 | 0.0% |
| State Government Employees | 4 | 6.0% |
| Federal Government Employees | 2 | 3.0% |
| Unpaid Family Workers | 0 | 0.0% |
| Total | 67 | 100.0% |
Employment Status by Age in Millston
According to the labor force statistics for Millston, out of the total population over 16 years of age (127), 58.3% or 74 individuals are in the labor force, with 9.5% or 7 of them unemployed. The age group with the highest labor force participation rate is 30 to 34 years, with 100.0% or 2 individuals in the labor force. Within the labor force, the 35 to 44 years age range has the highest percentage of unemployed individuals, with 15.8% or 6 of them being unemployed.
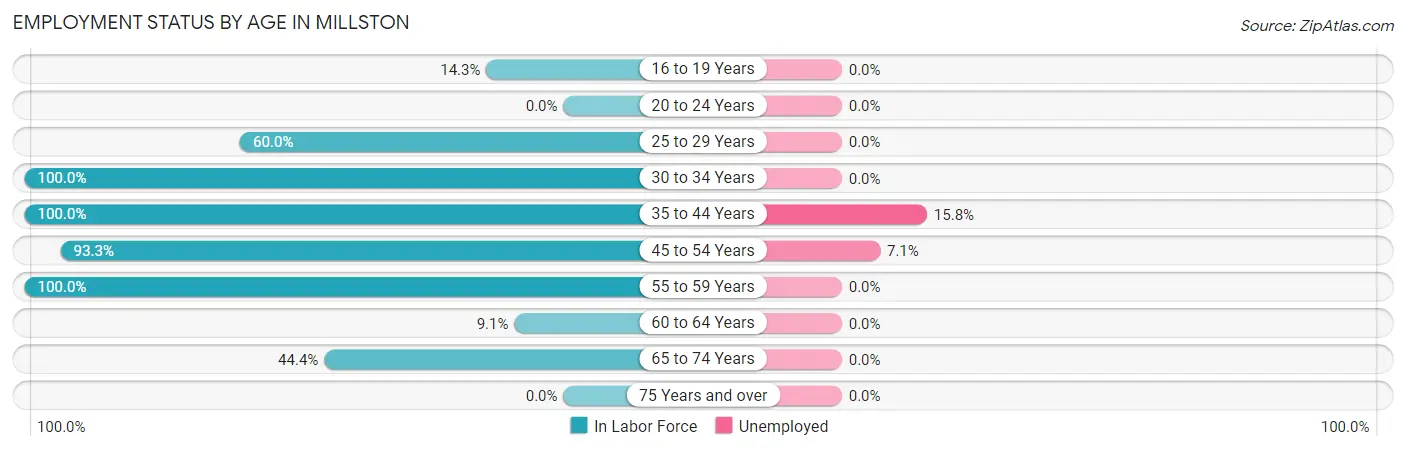
| Age Bracket | In Labor Force | Unemployed |
| 16 to 19 Years | 1 (14.3%) | 0 (0.0%) |
| 20 to 24 Years | 0 (0.0%) | 0 (0.0%) |
| 25 to 29 Years | 3 (60.0%) | 0 (0.0%) |
| 30 to 34 Years | 2 (100.0%) | 0 (0.0%) |
| 35 to 44 Years | 38 (100.0%) | 6 (15.8%) |
| 45 to 54 Years | 14 (93.3%) | 1 (7.1%) |
| 55 to 59 Years | 11 (100.0%) | 0 (0.0%) |
| 60 to 64 Years | 1 (9.1%) | 0 (0.0%) |
| 65 to 74 Years | 4 (44.4%) | 0 (0.0%) |
| 75 Years and over | 0 (0.0%) | 0 (0.0%) |
| Total | 74 (58.3%) | 7 (9.5%) |
Employment Status by Educational Attainment in Millston
According to labor force statistics for Millston, 84.1% of individuals (69) out of the total population between 25 and 64 years of age (82) are in the labor force, with 10.1% or 7 of them being unemployed. The group with the highest labor force participation rate are those with the educational attainment of less than high school, with 100.0% or 3 individuals in the labor force. Within the labor force, individuals with bachelor's degree or higher education have the highest percentage of unemployment, with 33.3% or 1 of them being unemployed.
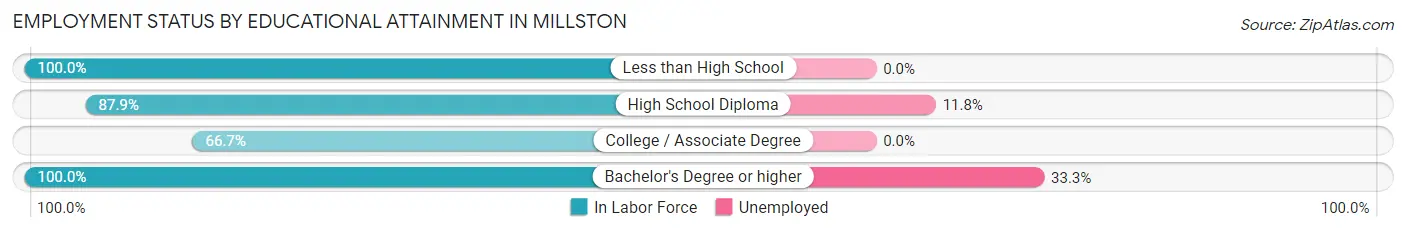
| Educational Attainment | In Labor Force | Unemployed |
| Less than High School | 3 (100.0%) | 0 (0.0%) |
| High School Diploma | 51 (87.9%) | 7 (11.8%) |
| College / Associate Degree | 12 (66.7%) | 0 (0.0%) |
| Bachelor's Degree or higher | 3 (100.0%) | 1 (33.3%) |
| Total | 69 (84.1%) | 8 (10.1%) |
Employment Occupations by Sex in Millston
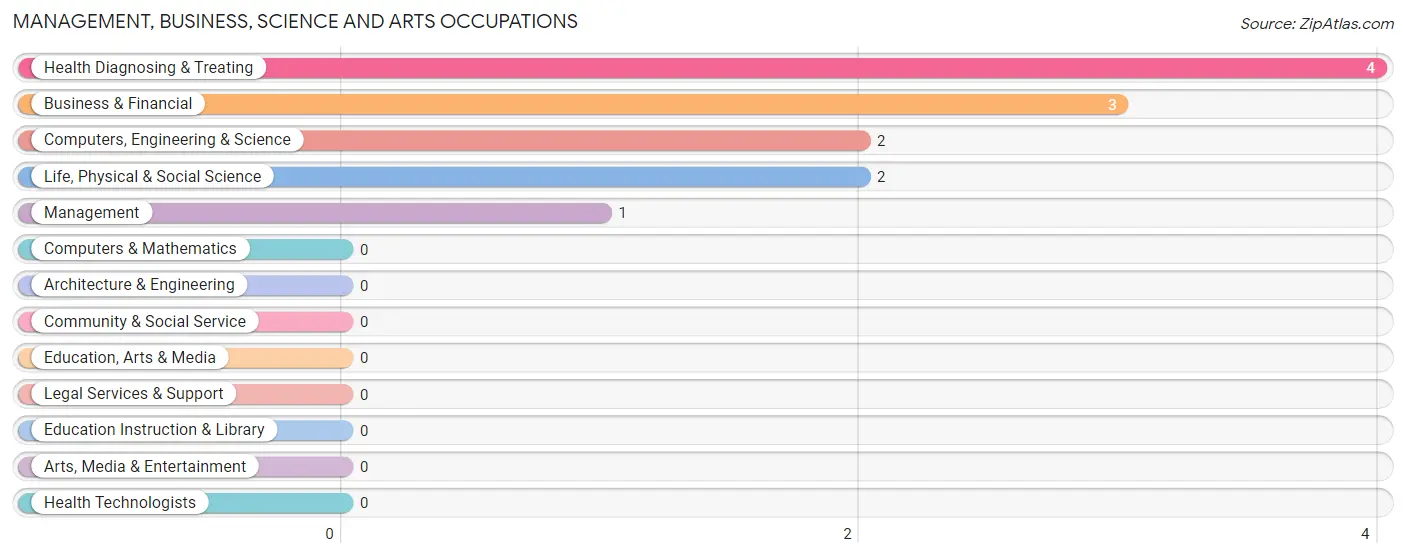
Management, Business, Science and Arts Occupations
The most common Management, Business, Science and Arts occupations in Millston are Health Diagnosing & Treating (4 | 6.0%), Business & Financial (3 | 4.5%), Computers, Engineering & Science (2 | 3.0%), Life, Physical & Social Science (2 | 3.0%), and Management (1 | 1.5%).
Management, Business, Science and Arts Occupations by Sex
Within the Management, Business, Science and Arts occupations in Millston, the most male-oriented occupations are Management (100.0%), Computers, Engineering & Science (100.0%), and Life, Physical & Social Science (100.0%), while the most female-oriented occupations are Business & Financial (100.0%), and Health Diagnosing & Treating (50.0%).
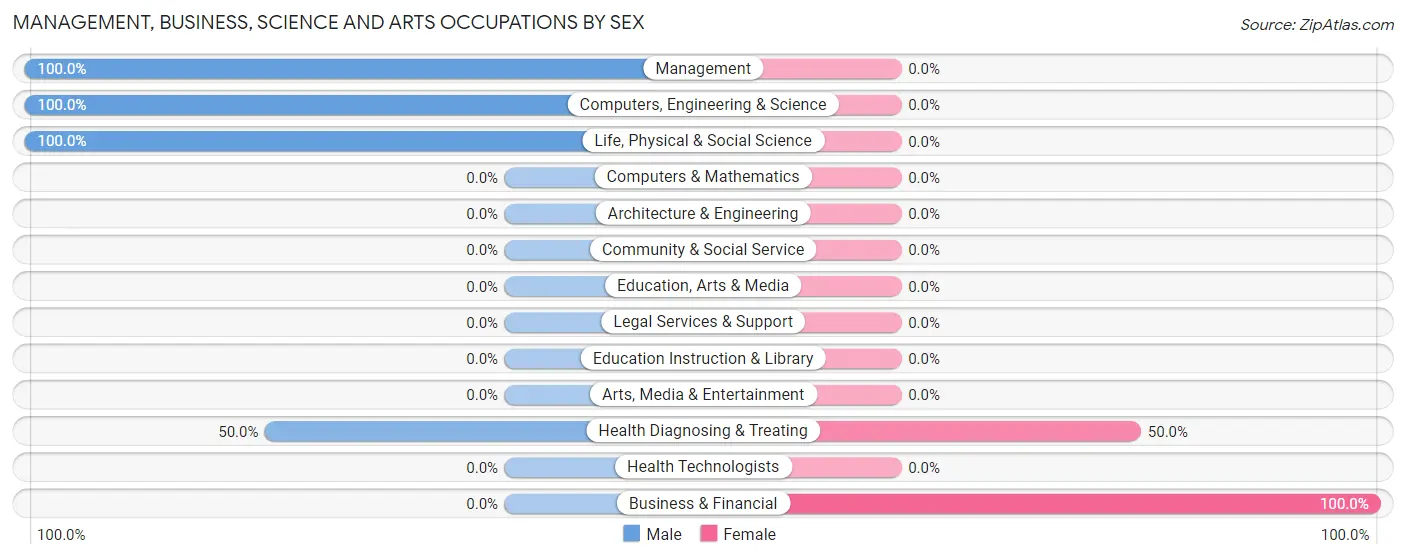
| Occupation | Male | Female |
| Management | 1 (100.0%) | 0 (0.0%) |
| Business & Financial | 0 (0.0%) | 3 (100.0%) |
| Computers, Engineering & Science | 2 (100.0%) | 0 (0.0%) |
| Computers & Mathematics | 0 (0.0%) | 0 (0.0%) |
| Architecture & Engineering | 0 (0.0%) | 0 (0.0%) |
| Life, Physical & Social Science | 2 (100.0%) | 0 (0.0%) |
| Community & Social Service | 0 (0.0%) | 0 (0.0%) |
| Education, Arts & Media | 0 (0.0%) | 0 (0.0%) |
| Legal Services & Support | 0 (0.0%) | 0 (0.0%) |
| Education Instruction & Library | 0 (0.0%) | 0 (0.0%) |
| Arts, Media & Entertainment | 0 (0.0%) | 0 (0.0%) |
| Health Diagnosing & Treating | 2 (50.0%) | 2 (50.0%) |
| Health Technologists | 0 (0.0%) | 0 (0.0%) |
| Total (Category) | 5 (50.0%) | 5 (50.0%) |
| Total (Overall) | 38 (56.7%) | 29 (43.3%) |
Services Occupations
The most common Services occupations in Millston are , and Food Preparation & Serving (5 | 7.5%).
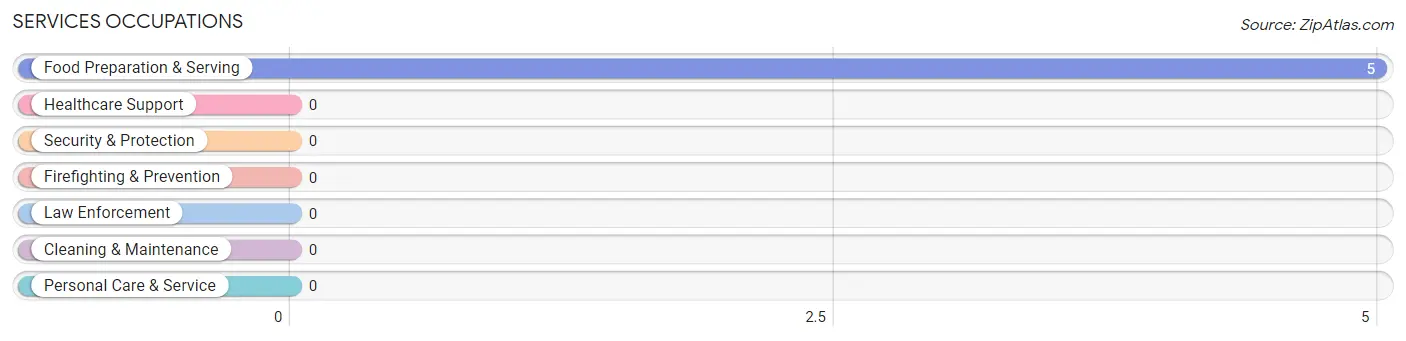
Services Occupations by Sex
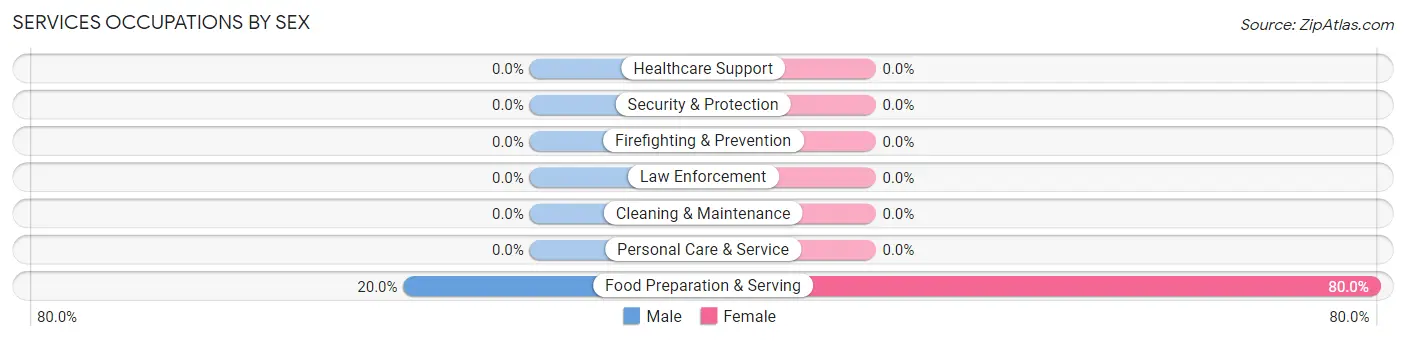
| Occupation | Male | Female |
| Healthcare Support | 0 (0.0%) | 0 (0.0%) |
| Security & Protection | 0 (0.0%) | 0 (0.0%) |
| Firefighting & Prevention | 0 (0.0%) | 0 (0.0%) |
| Law Enforcement | 0 (0.0%) | 0 (0.0%) |
| Food Preparation & Serving | 1 (20.0%) | 4 (80.0%) |
| Cleaning & Maintenance | 0 (0.0%) | 0 (0.0%) |
| Personal Care & Service | 0 (0.0%) | 0 (0.0%) |
| Total (Category) | 1 (20.0%) | 4 (80.0%) |
| Total (Overall) | 38 (56.7%) | 29 (43.3%) |
Sales and Office Occupations
The most common Sales and Office occupations in Millston are Office & Administration (15 | 22.4%), and Sales & Related (4 | 6.0%).
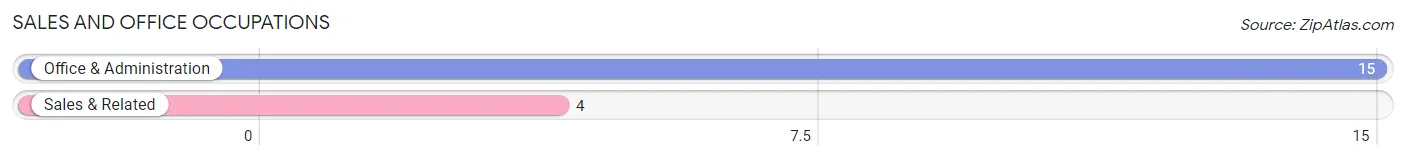
Sales and Office Occupations by Sex

| Occupation | Male | Female |
| Sales & Related | 4 (100.0%) | 0 (0.0%) |
| Office & Administration | 6 (40.0%) | 9 (60.0%) |
| Total (Category) | 10 (52.6%) | 9 (47.4%) |
| Total (Overall) | 38 (56.7%) | 29 (43.3%) |
Natural Resources, Construction and Maintenance Occupations
The most common Natural Resources, Construction and Maintenance occupations in Millston are Installation, Maintenance & Repair (10 | 14.9%), and Farming, Fishing & Forestry (6 | 9.0%).
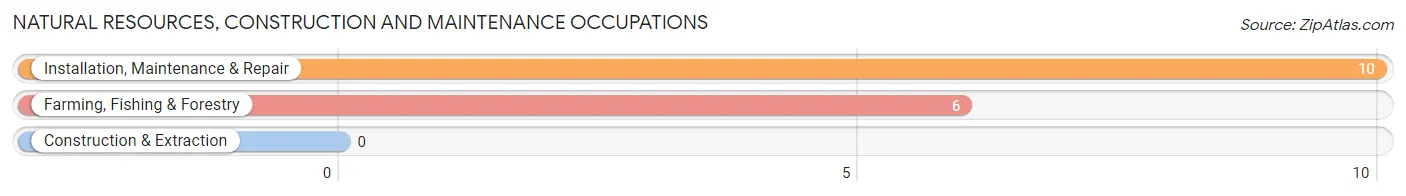
Natural Resources, Construction and Maintenance Occupations by Sex
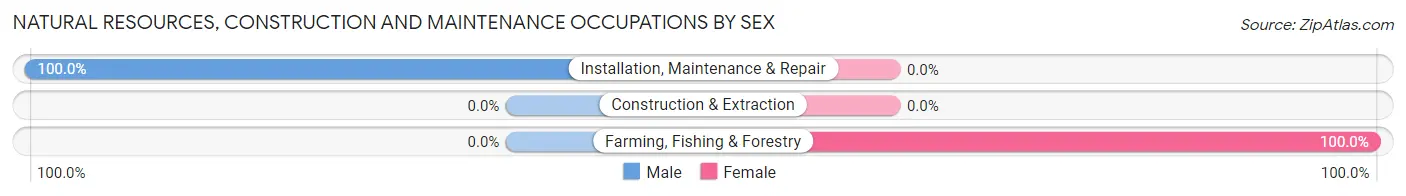
| Occupation | Male | Female |
| Farming, Fishing & Forestry | 0 (0.0%) | 6 (100.0%) |
| Construction & Extraction | 0 (0.0%) | 0 (0.0%) |
| Installation, Maintenance & Repair | 10 (100.0%) | 0 (0.0%) |
| Total (Category) | 10 (62.5%) | 6 (37.5%) |
| Total (Overall) | 38 (56.7%) | 29 (43.3%) |
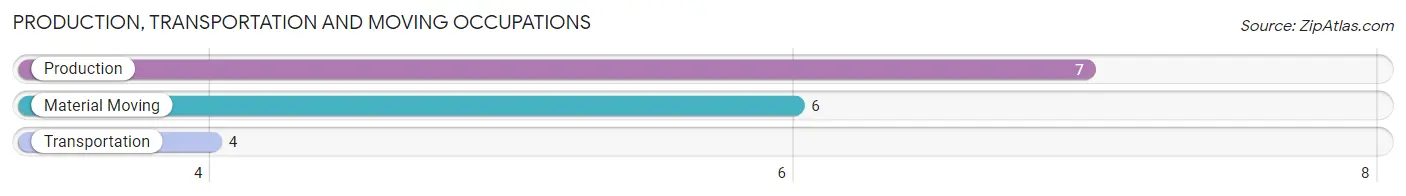
Production, Transportation and Moving Occupations
The most common Production, Transportation and Moving occupations in Millston are Production (7 | 10.4%), Material Moving (6 | 9.0%), and Transportation (4 | 6.0%).
Production, Transportation and Moving Occupations by Sex
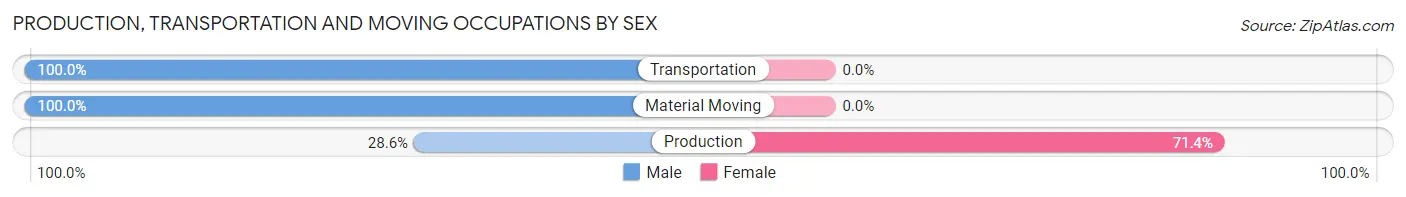
| Occupation | Male | Female |
| Production | 2 (28.6%) | 5 (71.4%) |
| Transportation | 4 (100.0%) | 0 (0.0%) |
| Material Moving | 6 (100.0%) | 0 (0.0%) |
| Total (Category) | 12 (70.6%) | 5 (29.4%) |
| Total (Overall) | 38 (56.7%) | 29 (43.3%) |
Employment Industries by Sex in Millston
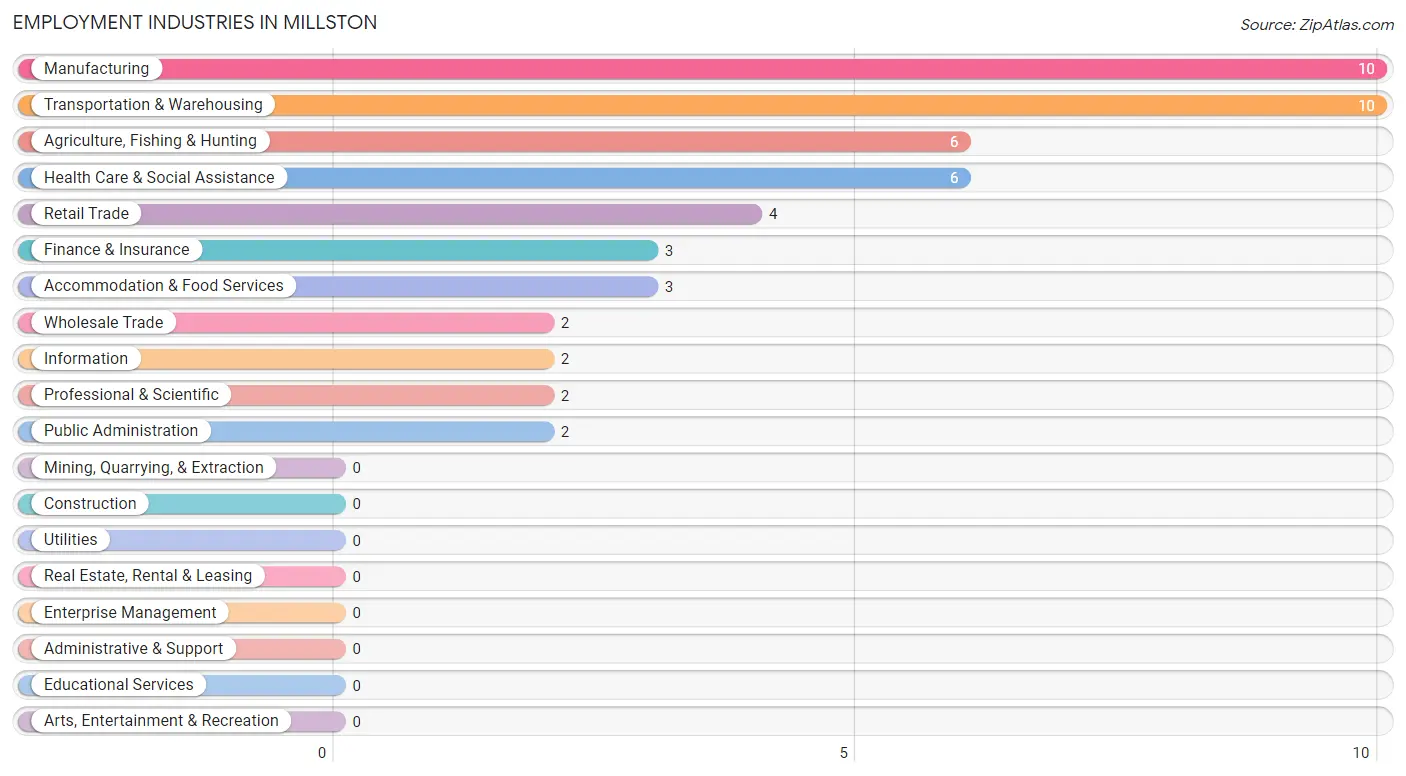
Employment Industries in Millston
The major employment industries in Millston include Manufacturing (10 | 14.9%), Transportation & Warehousing (10 | 14.9%), Agriculture, Fishing & Hunting (6 | 9.0%), Health Care & Social Assistance (6 | 9.0%), and Retail Trade (4 | 6.0%).
Employment Industries by Sex in Millston
The Millston industries that see more men than women are Wholesale Trade (100.0%), Retail Trade (100.0%), and Transportation & Warehousing (100.0%), whereas the industries that tend to have a higher number of women are Agriculture, Fishing & Hunting (100.0%), Finance & Insurance (100.0%), and Professional & Scientific (100.0%).
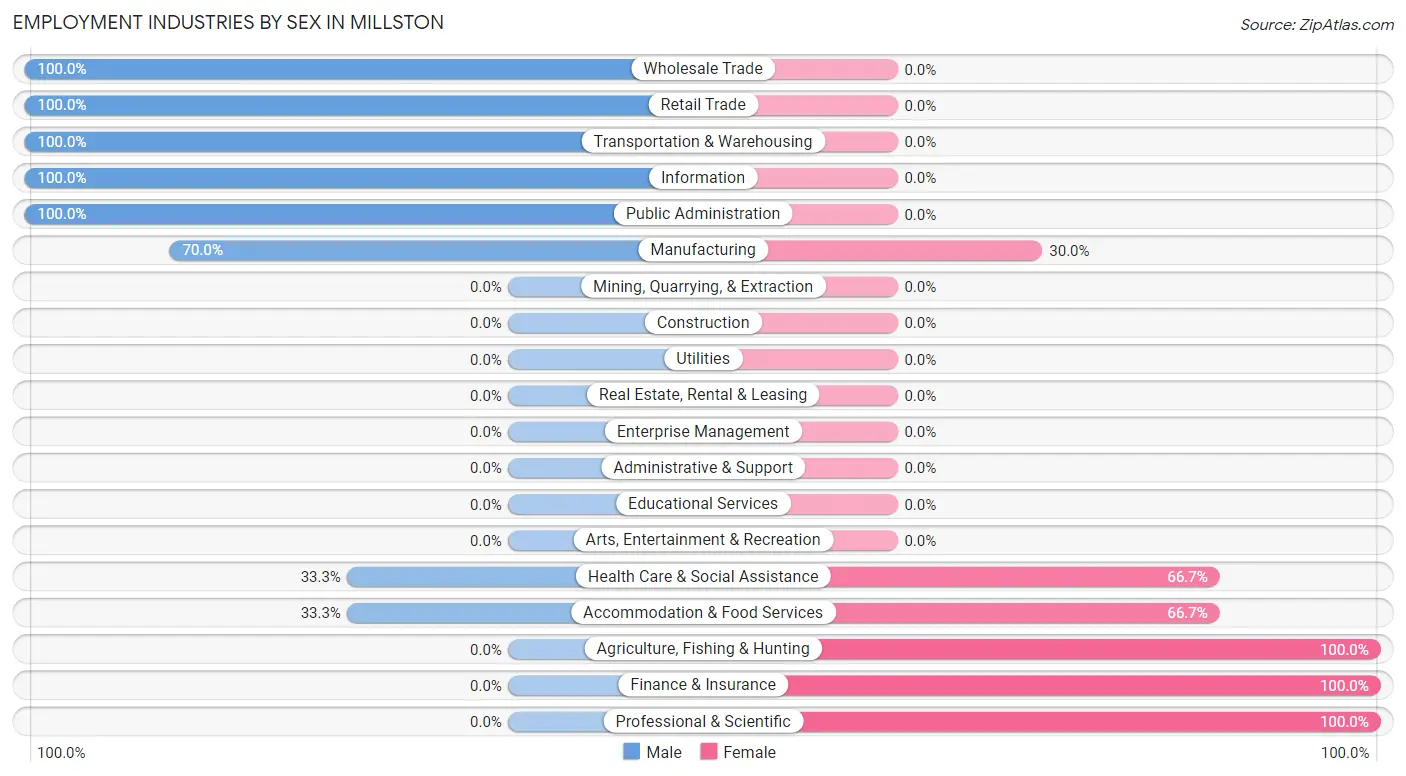
| Industry | Male | Female |
| Agriculture, Fishing & Hunting | 0 (0.0%) | 6 (100.0%) |
| Mining, Quarrying, & Extraction | 0 (0.0%) | 0 (0.0%) |
| Construction | 0 (0.0%) | 0 (0.0%) |
| Manufacturing | 7 (70.0%) | 3 (30.0%) |
| Wholesale Trade | 2 (100.0%) | 0 (0.0%) |
| Retail Trade | 4 (100.0%) | 0 (0.0%) |
| Transportation & Warehousing | 10 (100.0%) | 0 (0.0%) |
| Utilities | 0 (0.0%) | 0 (0.0%) |
| Information | 2 (100.0%) | 0 (0.0%) |
| Finance & Insurance | 0 (0.0%) | 3 (100.0%) |
| Real Estate, Rental & Leasing | 0 (0.0%) | 0 (0.0%) |
| Professional & Scientific | 0 (0.0%) | 2 (100.0%) |
| Enterprise Management | 0 (0.0%) | 0 (0.0%) |
| Administrative & Support | 0 (0.0%) | 0 (0.0%) |
| Educational Services | 0 (0.0%) | 0 (0.0%) |
| Health Care & Social Assistance | 2 (33.3%) | 4 (66.7%) |
| Arts, Entertainment & Recreation | 0 (0.0%) | 0 (0.0%) |
| Accommodation & Food Services | 1 (33.3%) | 2 (66.7%) |
| Public Administration | 2 (100.0%) | 0 (0.0%) |
| Total | 38 (56.7%) | 29 (43.3%) |
Education in Millston
School Enrollment in Millston
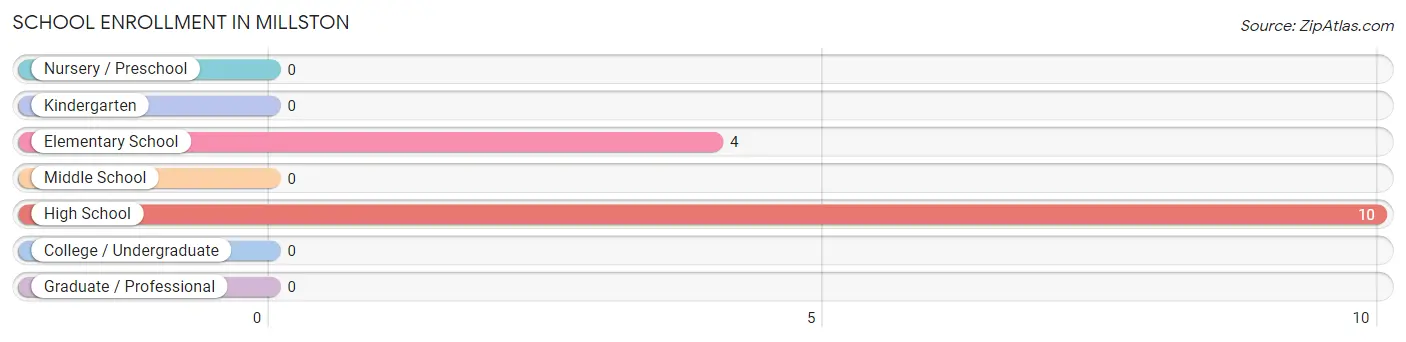
The most common levels of schooling among the 14 students in Millston are high school (10 | 71.4%), and elementary school (4 | 28.6%).
| School Level | # Students | % Students |
| Nursery / Preschool | 0 | 0.0% |
| Kindergarten | 0 | 0.0% |
| Elementary School | 4 | 28.6% |
| Middle School | 0 | 0.0% |
| High School | 10 | 71.4% |
| College / Undergraduate | 0 | 0.0% |
| Graduate / Professional | 0 | 0.0% |
| Total | 14 | 100.0% |
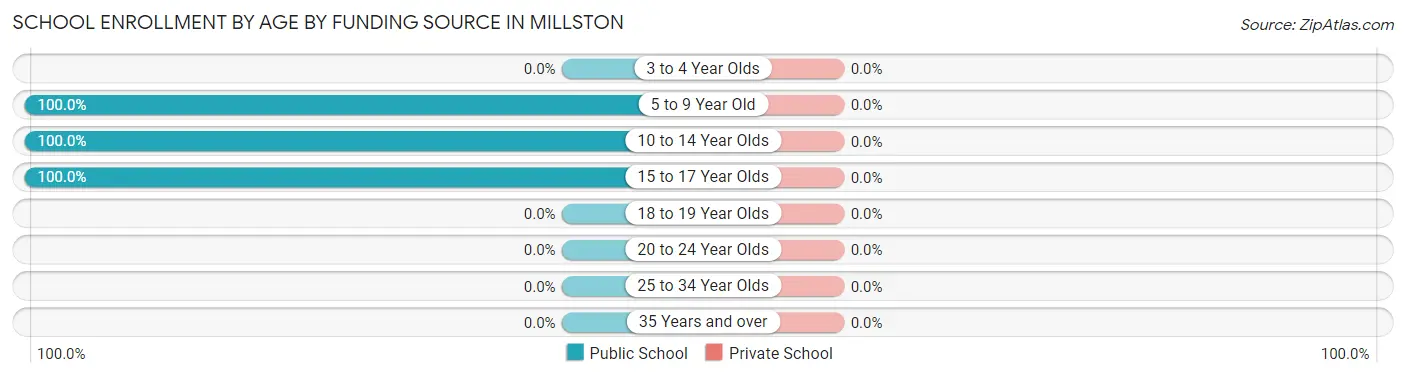
School Enrollment by Age by Funding Source in Millston
| Age Bracket | Public School | Private School |
| 3 to 4 Year Olds | 0 (0.0%) | 0 (0.0%) |
| 5 to 9 Year Old | 2 (100.0%) | 0 (0.0%) |
| 10 to 14 Year Olds | 2 (100.0%) | 0 (0.0%) |
| 15 to 17 Year Olds | 10 (100.0%) | 0 (0.0%) |
| 18 to 19 Year Olds | 0 (0.0%) | 0 (0.0%) |
| 20 to 24 Year Olds | 0 (0.0%) | 0 (0.0%) |
| 25 to 34 Year Olds | 0 (0.0%) | 0 (0.0%) |
| 35 Years and over | 0 (0.0%) | 0 (0.0%) |
| Total | 14 (100.0%) | 0 (0.0%) |
Educational Attainment by Field of Study in Millston
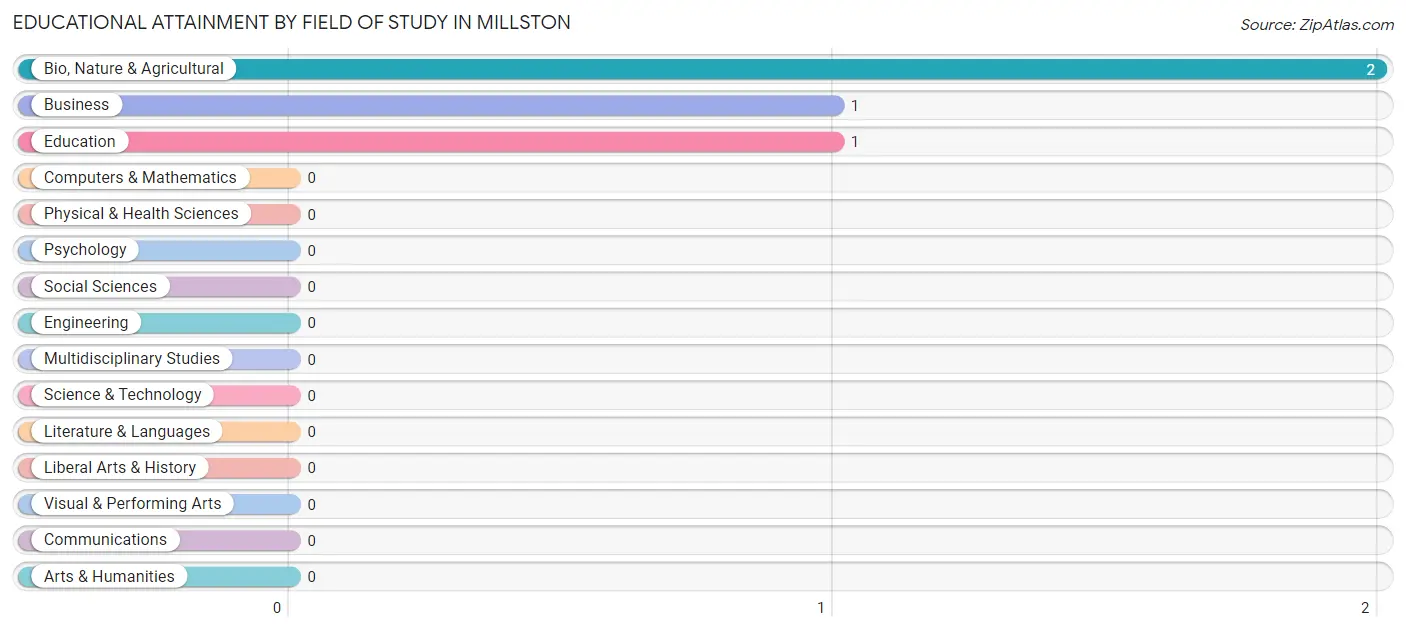
Bio, nature & agricultural (2 | 50.0%), business (1 | 25.0%), and education (1 | 25.0%) are the most common fields of study among 4 individuals in Millston who have obtained a bachelor's degree or higher.
| Field of Study | # Graduates | % Graduates |
| Computers & Mathematics | 0 | 0.0% |
| Bio, Nature & Agricultural | 2 | 50.0% |
| Physical & Health Sciences | 0 | 0.0% |
| Psychology | 0 | 0.0% |
| Social Sciences | 0 | 0.0% |
| Engineering | 0 | 0.0% |
| Multidisciplinary Studies | 0 | 0.0% |
| Science & Technology | 0 | 0.0% |
| Business | 1 | 25.0% |
| Education | 1 | 25.0% |
| Literature & Languages | 0 | 0.0% |
| Liberal Arts & History | 0 | 0.0% |
| Visual & Performing Arts | 0 | 0.0% |
| Communications | 0 | 0.0% |
| Arts & Humanities | 0 | 0.0% |
| Total | 4 | 100.0% |
Transportation & Commute in Millston
Vehicle Availability by Sex in Millston
The most prevalent vehicle ownership categories in Millston are males with 3 vehicles (16, accounting for 42.1%) and females with 3 vehicles (11, making up 55.2%).
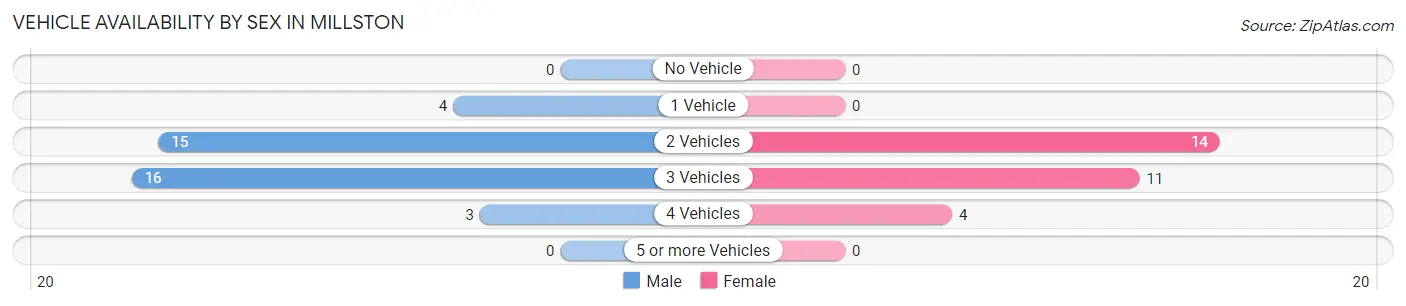
| Vehicles Available | Male | Female |
| No Vehicle | 0 (0.0%) | 0 (0.0%) |
| 1 Vehicle | 4 (10.5%) | 0 (0.0%) |
| 2 Vehicles | 15 (39.5%) | 14 (48.3%) |
| 3 Vehicles | 16 (42.1%) | 11 (37.9%) |
| 4 Vehicles | 3 (7.9%) | 4 (13.8%) |
| 5 or more Vehicles | 0 (0.0%) | 0 (0.0%) |
| Total | 38 (100.0%) | 29 (100.0%) |
Commute Time in Millston
The most frequently occuring commute durations in Millston are 20 to 24 minutes (18 commuters, 27.7%), 30 to 34 minutes (13 commuters, 20.0%), and 90 or more minutes (10 commuters, 15.4%).
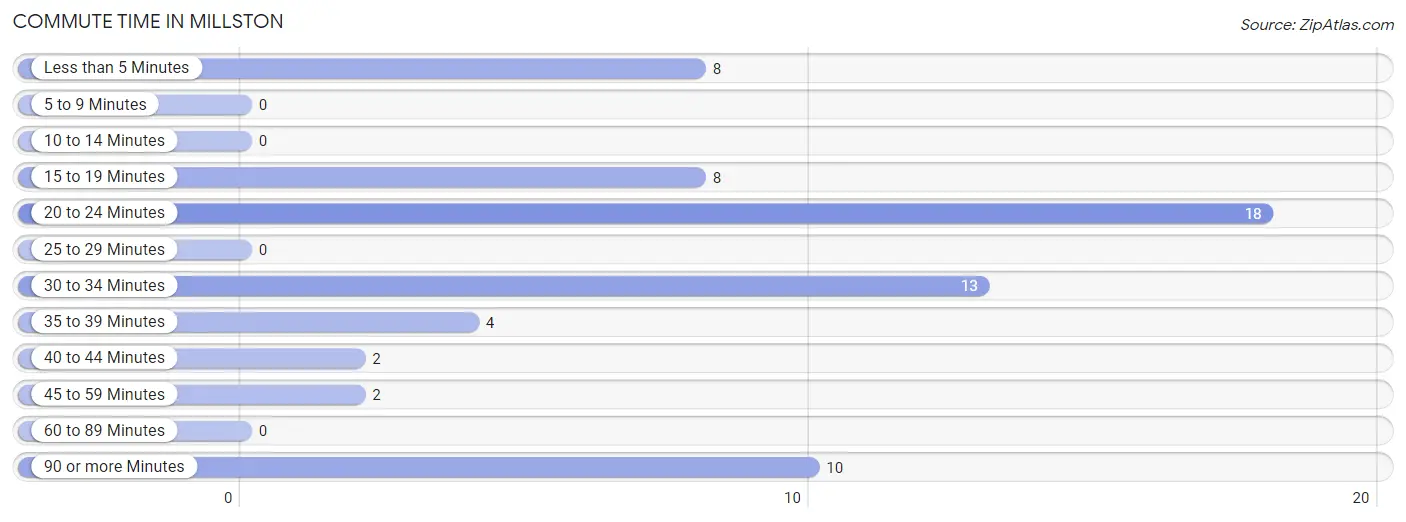
| Commute Time | # Commuters | % Commuters |
| Less than 5 Minutes | 8 | 12.3% |
| 5 to 9 Minutes | 0 | 0.0% |
| 10 to 14 Minutes | 0 | 0.0% |
| 15 to 19 Minutes | 8 | 12.3% |
| 20 to 24 Minutes | 18 | 27.7% |
| 25 to 29 Minutes | 0 | 0.0% |
| 30 to 34 Minutes | 13 | 20.0% |
| 35 to 39 Minutes | 4 | 6.1% |
| 40 to 44 Minutes | 2 | 3.1% |
| 45 to 59 Minutes | 2 | 3.1% |
| 60 to 89 Minutes | 0 | 0.0% |
| 90 or more Minutes | 10 | 15.4% |
Commute Time by Sex in Millston
The most common commute times in Millston are 20 to 24 minutes (11 commuters, 28.9%) for males and less than 5 minutes (8 commuters, 29.6%) for females.
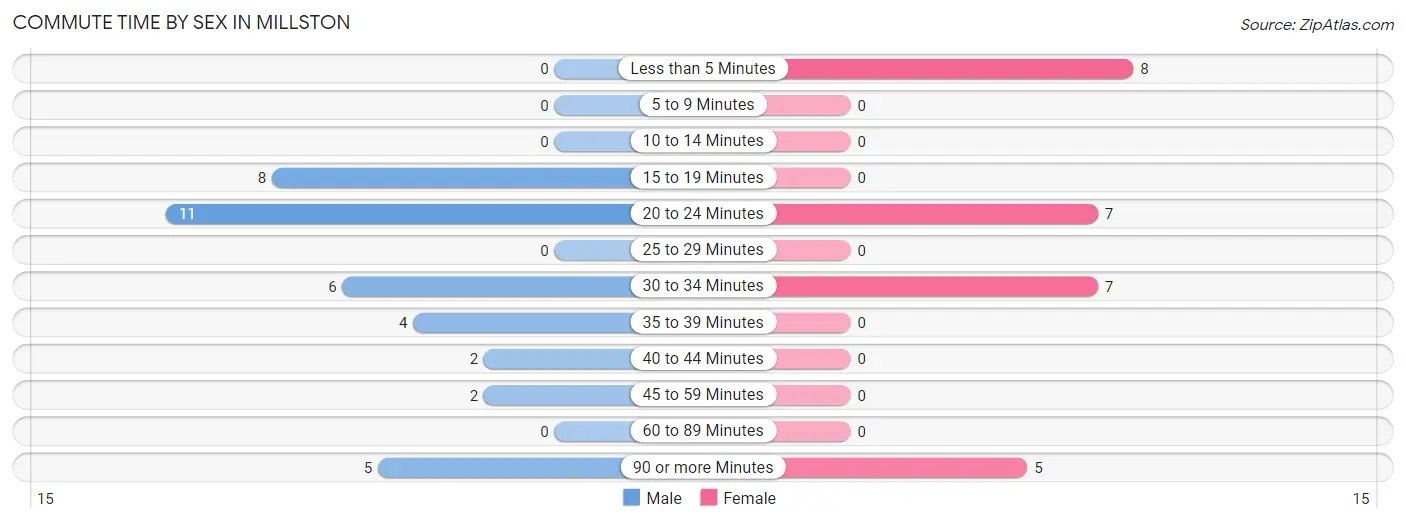
| Commute Time | Male | Female |
| Less than 5 Minutes | 0 (0.0%) | 8 (29.6%) |
| 5 to 9 Minutes | 0 (0.0%) | 0 (0.0%) |
| 10 to 14 Minutes | 0 (0.0%) | 0 (0.0%) |
| 15 to 19 Minutes | 8 (21.0%) | 0 (0.0%) |
| 20 to 24 Minutes | 11 (28.9%) | 7 (25.9%) |
| 25 to 29 Minutes | 0 (0.0%) | 0 (0.0%) |
| 30 to 34 Minutes | 6 (15.8%) | 7 (25.9%) |
| 35 to 39 Minutes | 4 (10.5%) | 0 (0.0%) |
| 40 to 44 Minutes | 2 (5.3%) | 0 (0.0%) |
| 45 to 59 Minutes | 2 (5.3%) | 0 (0.0%) |
| 60 to 89 Minutes | 0 (0.0%) | 0 (0.0%) |
| 90 or more Minutes | 5 (13.2%) | 5 (18.5%) |
Time of Departure to Work by Sex in Millston
The most frequent times of departure to work in Millston are 7:00 AM to 7:29 AM (10, 26.3%) for males and 7:00 AM to 7:29 AM (9, 33.3%) for females.
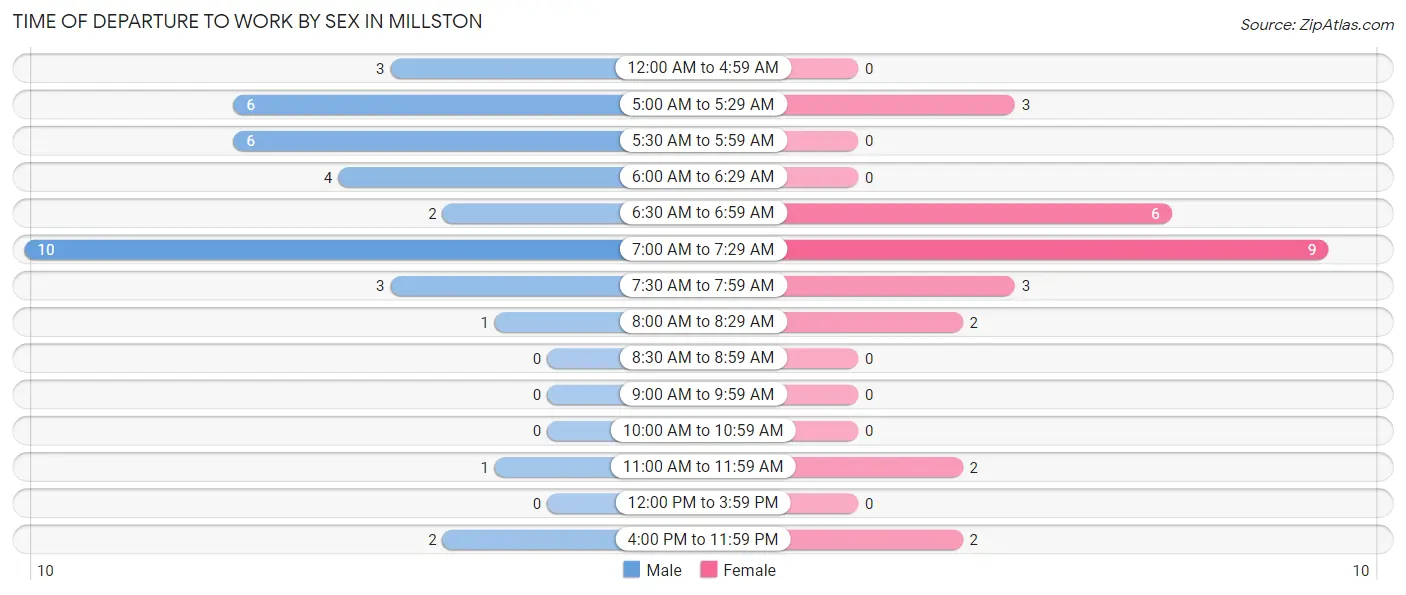
| Time of Departure | Male | Female |
| 12:00 AM to 4:59 AM | 3 (7.9%) | 0 (0.0%) |
| 5:00 AM to 5:29 AM | 6 (15.8%) | 3 (11.1%) |
| 5:30 AM to 5:59 AM | 6 (15.8%) | 0 (0.0%) |
| 6:00 AM to 6:29 AM | 4 (10.5%) | 0 (0.0%) |
| 6:30 AM to 6:59 AM | 2 (5.3%) | 6 (22.2%) |
| 7:00 AM to 7:29 AM | 10 (26.3%) | 9 (33.3%) |
| 7:30 AM to 7:59 AM | 3 (7.9%) | 3 (11.1%) |
| 8:00 AM to 8:29 AM | 1 (2.6%) | 2 (7.4%) |
| 8:30 AM to 8:59 AM | 0 (0.0%) | 0 (0.0%) |
| 9:00 AM to 9:59 AM | 0 (0.0%) | 0 (0.0%) |
| 10:00 AM to 10:59 AM | 0 (0.0%) | 0 (0.0%) |
| 11:00 AM to 11:59 AM | 1 (2.6%) | 2 (7.4%) |
| 12:00 PM to 3:59 PM | 0 (0.0%) | 0 (0.0%) |
| 4:00 PM to 11:59 PM | 2 (5.3%) | 2 (7.4%) |
| Total | 38 (100.0%) | 27 (100.0%) |
Housing Occupancy in Millston
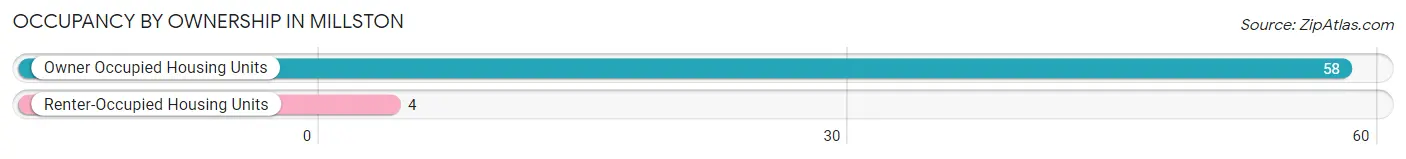
Occupancy by Ownership in Millston
Of the total 62 dwellings in Millston, owner-occupied units account for 58 (93.5%), while renter-occupied units make up 4 (6.5%).
| Occupancy | # Housing Units | % Housing Units |
| Owner Occupied Housing Units | 58 | 93.5% |
| Renter-Occupied Housing Units | 4 | 6.5% |
| Total Occupied Housing Units | 62 | 100.0% |
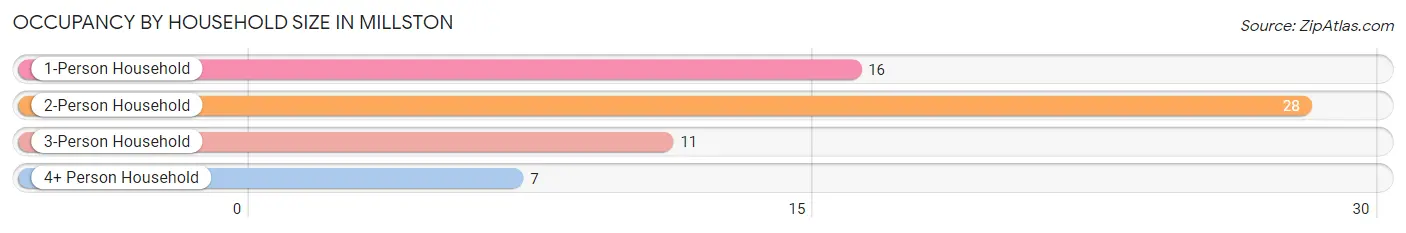
Occupancy by Household Size in Millston
| Household Size | # Housing Units | % Housing Units |
| 1-Person Household | 16 | 25.8% |
| 2-Person Household | 28 | 45.2% |
| 3-Person Household | 11 | 17.7% |
| 4+ Person Household | 7 | 11.3% |
| Total Housing Units | 62 | 100.0% |
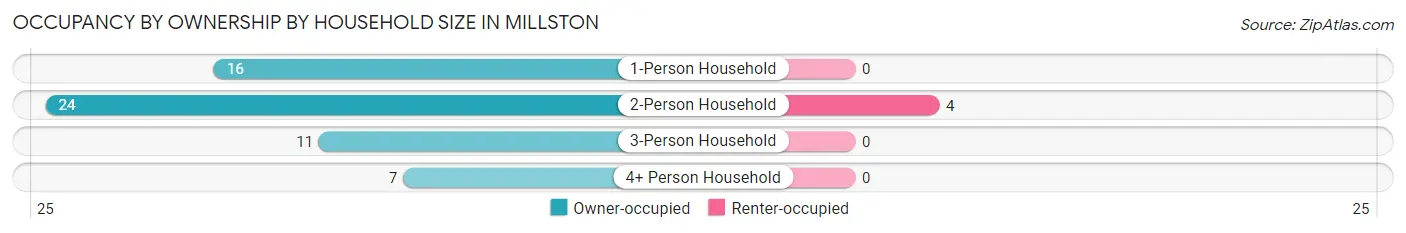
Occupancy by Ownership by Household Size in Millston
| Household Size | Owner-occupied | Renter-occupied |
| 1-Person Household | 16 (100.0%) | 0 (0.0%) |
| 2-Person Household | 24 (85.7%) | 4 (14.3%) |
| 3-Person Household | 11 (100.0%) | 0 (0.0%) |
| 4+ Person Household | 7 (100.0%) | 0 (0.0%) |
| Total Housing Units | 58 (93.5%) | 4 (6.5%) |
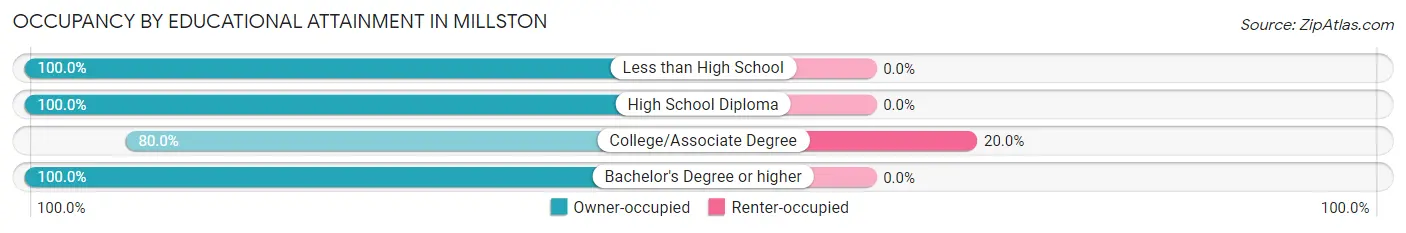
Occupancy by Educational Attainment in Millston
| Household Size | Owner-occupied | Renter-occupied |
| Less than High School | 2 (100.0%) | 0 (0.0%) |
| High School Diploma | 36 (100.0%) | 0 (0.0%) |
| College/Associate Degree | 16 (80.0%) | 4 (20.0%) |
| Bachelor's Degree or higher | 4 (100.0%) | 0 (0.0%) |
Occupancy by Age of Householder in Millston
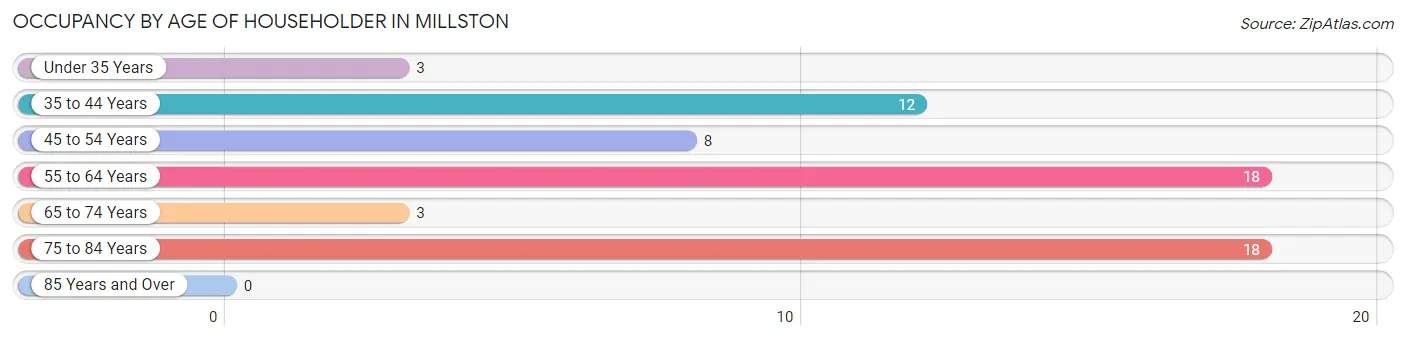
| Age Bracket | # Households | % Households |
| Under 35 Years | 3 | 4.8% |
| 35 to 44 Years | 12 | 19.4% |
| 45 to 54 Years | 8 | 12.9% |
| 55 to 64 Years | 18 | 29.0% |
| 65 to 74 Years | 3 | 4.8% |
| 75 to 84 Years | 18 | 29.0% |
| 85 Years and Over | 0 | 0.0% |
| Total | 62 | 100.0% |
Housing Finances in Millston
Median Income by Occupancy in Millston
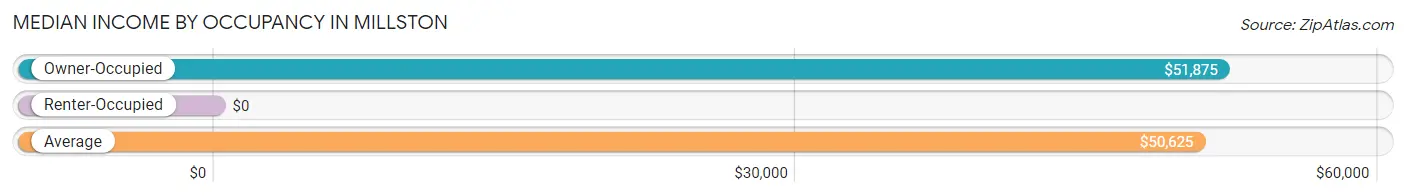
| Occupancy Type | # Households | Median Income |
| Owner-Occupied | 58 (93.5%) | $51,875 |
| Renter-Occupied | 4 (6.5%) | $0 |
| Average | 62 (100.0%) | $50,625 |
Occupancy by Householder Income Bracket in Millston
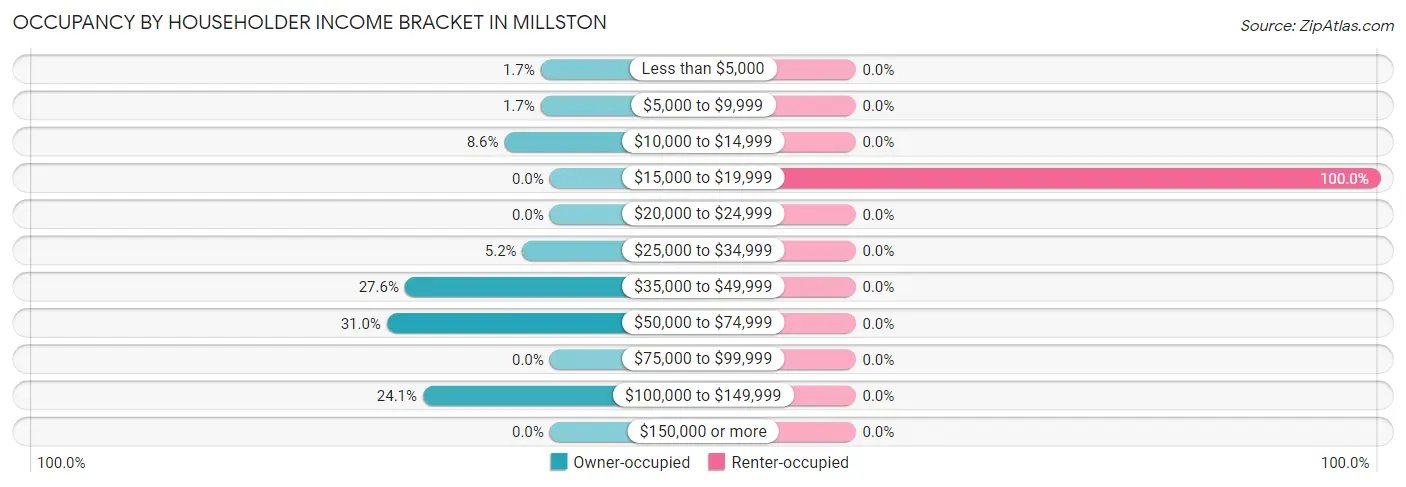
| Income Bracket | Owner-occupied | Renter-occupied |
| Less than $5,000 | 1 (1.7%) | 0 (0.0%) |
| $5,000 to $9,999 | 1 (1.7%) | 0 (0.0%) |
| $10,000 to $14,999 | 5 (8.6%) | 0 (0.0%) |
| $15,000 to $19,999 | 0 (0.0%) | 4 (100.0%) |
| $20,000 to $24,999 | 0 (0.0%) | 0 (0.0%) |
| $25,000 to $34,999 | 3 (5.2%) | 0 (0.0%) |
| $35,000 to $49,999 | 16 (27.6%) | 0 (0.0%) |
| $50,000 to $74,999 | 18 (31.0%) | 0 (0.0%) |
| $75,000 to $99,999 | 0 (0.0%) | 0 (0.0%) |
| $100,000 to $149,999 | 14 (24.1%) | 0 (0.0%) |
| $150,000 or more | 0 (0.0%) | 0 (0.0%) |
| Total | 58 (100.0%) | 4 (100.0%) |
Monthly Housing Cost Tiers in Millston
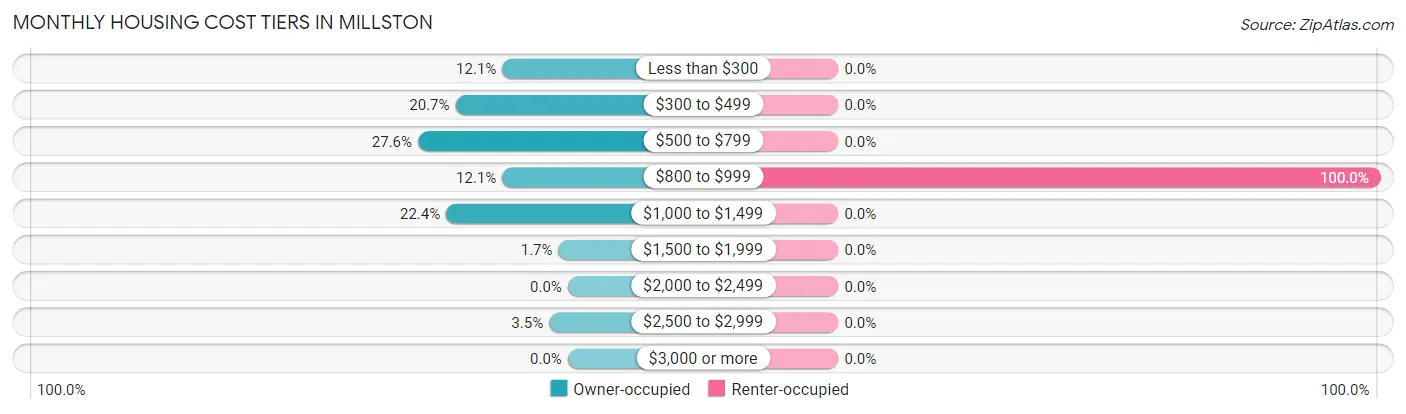
| Monthly Cost | Owner-occupied | Renter-occupied |
| Less than $300 | 7 (12.1%) | 0 (0.0%) |
| $300 to $499 | 12 (20.7%) | 0 (0.0%) |
| $500 to $799 | 16 (27.6%) | 0 (0.0%) |
| $800 to $999 | 7 (12.1%) | 4 (100.0%) |
| $1,000 to $1,499 | 13 (22.4%) | 0 (0.0%) |
| $1,500 to $1,999 | 1 (1.7%) | 0 (0.0%) |
| $2,000 to $2,499 | 0 (0.0%) | 0 (0.0%) |
| $2,500 to $2,999 | 2 (3.5%) | 0 (0.0%) |
| $3,000 or more | 0 (0.0%) | 0 (0.0%) |
| Total | 58 (100.0%) | 4 (100.0%) |
Physical Housing Characteristics in Millston
Housing Structures in Millston
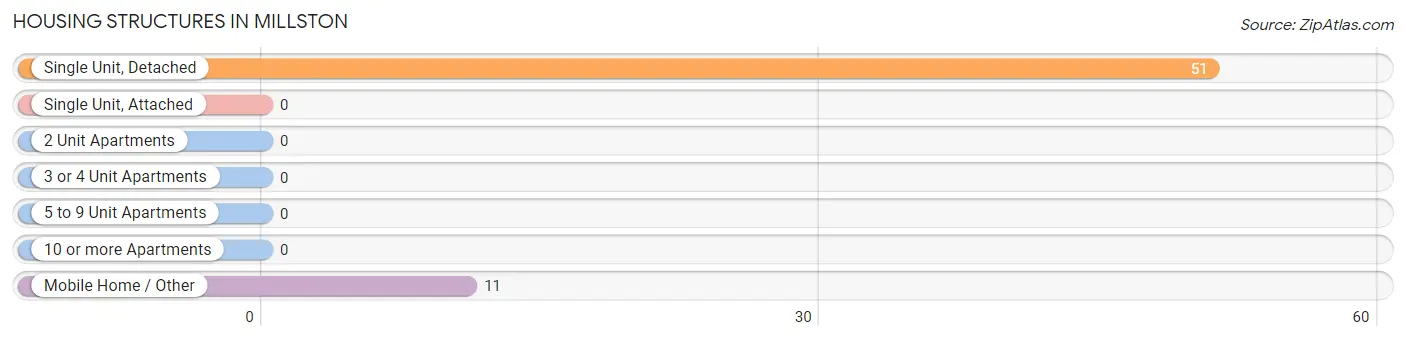
| Structure Type | # Housing Units | % Housing Units |
| Single Unit, Detached | 51 | 82.3% |
| Single Unit, Attached | 0 | 0.0% |
| 2 Unit Apartments | 0 | 0.0% |
| 3 or 4 Unit Apartments | 0 | 0.0% |
| 5 to 9 Unit Apartments | 0 | 0.0% |
| 10 or more Apartments | 0 | 0.0% |
| Mobile Home / Other | 11 | 17.7% |
| Total | 62 | 100.0% |
Housing Structures by Occupancy in Millston
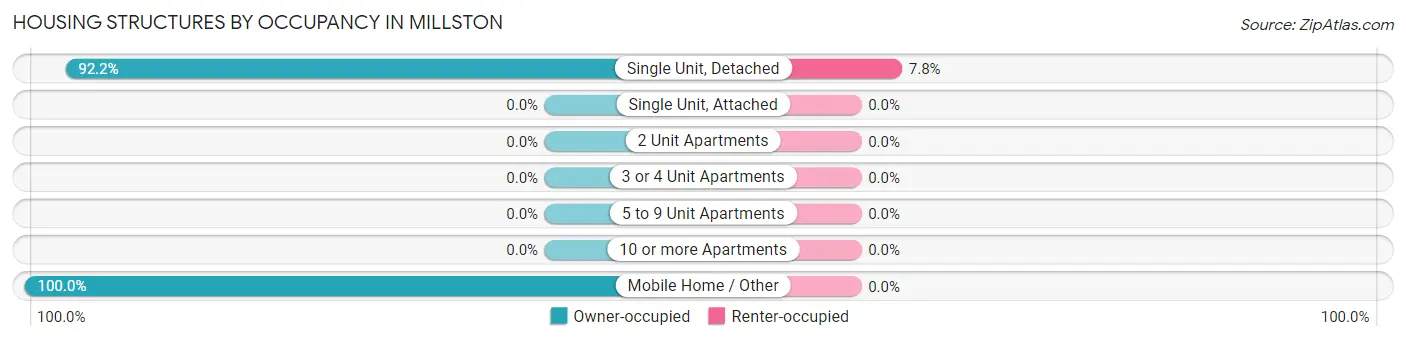
| Structure Type | Owner-occupied | Renter-occupied |
| Single Unit, Detached | 47 (92.2%) | 4 (7.8%) |
| Single Unit, Attached | 0 (0.0%) | 0 (0.0%) |
| 2 Unit Apartments | 0 (0.0%) | 0 (0.0%) |
| 3 or 4 Unit Apartments | 0 (0.0%) | 0 (0.0%) |
| 5 to 9 Unit Apartments | 0 (0.0%) | 0 (0.0%) |
| 10 or more Apartments | 0 (0.0%) | 0 (0.0%) |
| Mobile Home / Other | 11 (100.0%) | 0 (0.0%) |
| Total | 58 (93.5%) | 4 (6.5%) |
Housing Structures by Number of Rooms in Millston
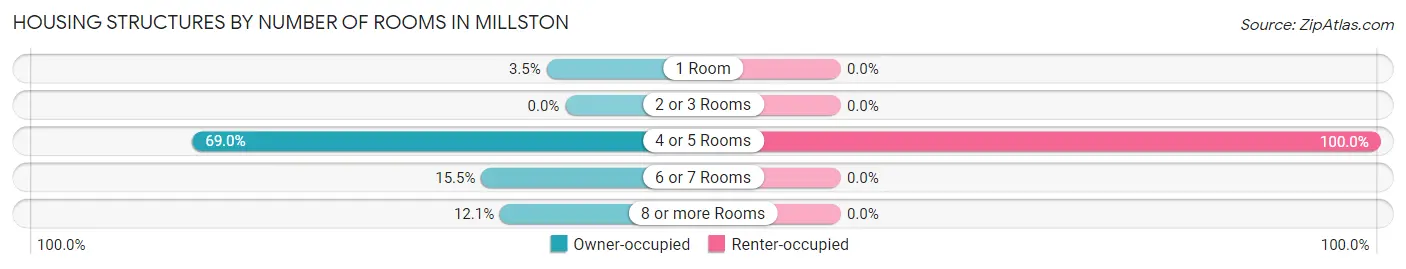
| Number of Rooms | Owner-occupied | Renter-occupied |
| 1 Room | 2 (3.5%) | 0 (0.0%) |
| 2 or 3 Rooms | 0 (0.0%) | 0 (0.0%) |
| 4 or 5 Rooms | 40 (69.0%) | 4 (100.0%) |
| 6 or 7 Rooms | 9 (15.5%) | 0 (0.0%) |
| 8 or more Rooms | 7 (12.1%) | 0 (0.0%) |
| Total | 58 (100.0%) | 4 (100.0%) |
Housing Structure by Heating Type in Millston
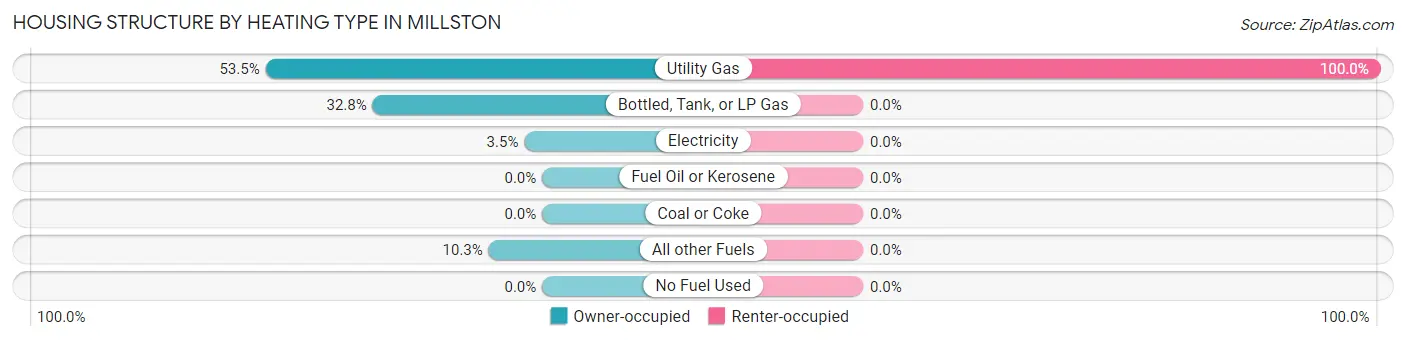
| Heating Type | Owner-occupied | Renter-occupied |
| Utility Gas | 31 (53.4%) | 4 (100.0%) |
| Bottled, Tank, or LP Gas | 19 (32.8%) | 0 (0.0%) |
| Electricity | 2 (3.5%) | 0 (0.0%) |
| Fuel Oil or Kerosene | 0 (0.0%) | 0 (0.0%) |
| Coal or Coke | 0 (0.0%) | 0 (0.0%) |
| All other Fuels | 6 (10.3%) | 0 (0.0%) |
| No Fuel Used | 0 (0.0%) | 0 (0.0%) |
| Total | 58 (100.0%) | 4 (100.0%) |
Household Vehicle Usage in Millston
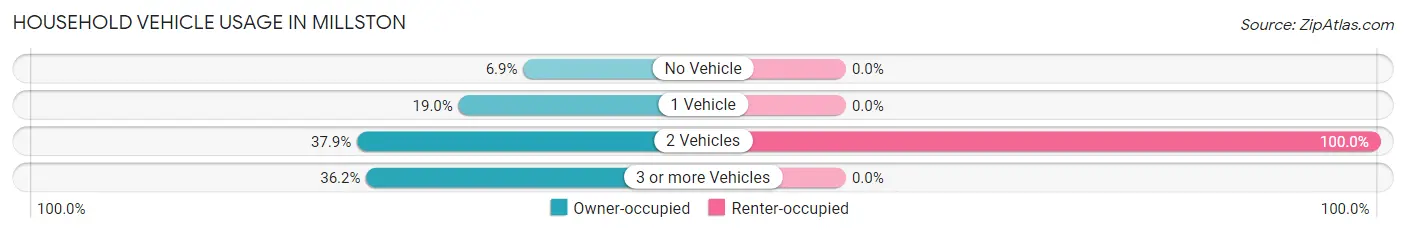
| Vehicles per Household | Owner-occupied | Renter-occupied |
| No Vehicle | 4 (6.9%) | 0 (0.0%) |
| 1 Vehicle | 11 (19.0%) | 0 (0.0%) |
| 2 Vehicles | 22 (37.9%) | 4 (100.0%) |
| 3 or more Vehicles | 21 (36.2%) | 0 (0.0%) |
| Total | 58 (100.0%) | 4 (100.0%) |
Real Estate & Mortgages in Millston
Real Estate and Mortgage Overview in Millston
| Characteristic | Without Mortgage | With Mortgage |
| Housing Units | 27 | 31 |
| Median Property Value | $120,800 | $97,500 |
| Median Household Income | $44,250 | $0 |
| Monthly Housing Costs | $388 | $0 |
| Real Estate Taxes | $1,583 | $0 |
Property Value by Mortgage Status in Millston
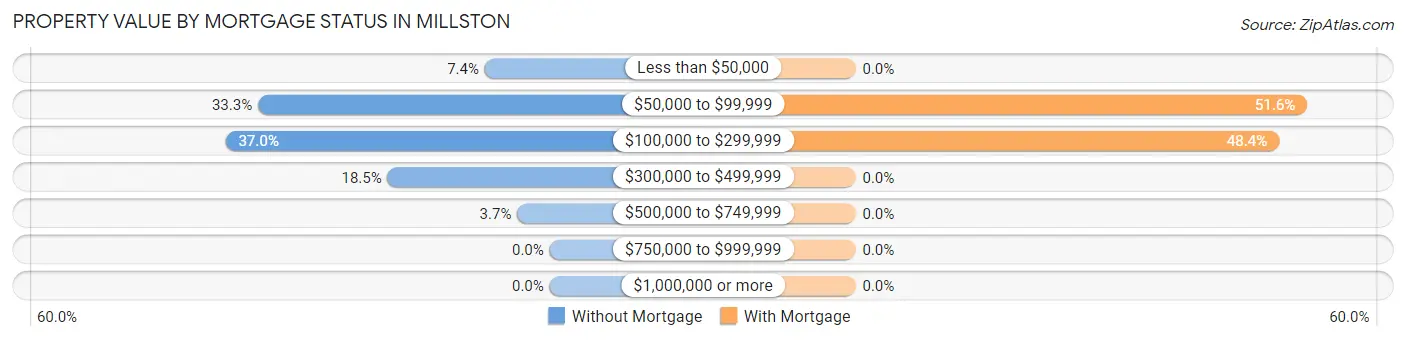
| Property Value | Without Mortgage | With Mortgage |
| Less than $50,000 | 2 (7.4%) | 0 (0.0%) |
| $50,000 to $99,999 | 9 (33.3%) | 16 (51.6%) |
| $100,000 to $299,999 | 10 (37.0%) | 15 (48.4%) |
| $300,000 to $499,999 | 5 (18.5%) | 0 (0.0%) |
| $500,000 to $749,999 | 1 (3.7%) | 0 (0.0%) |
| $750,000 to $999,999 | 0 (0.0%) | 0 (0.0%) |
| $1,000,000 or more | 0 (0.0%) | 0 (0.0%) |
| Total | 27 (100.0%) | 31 (100.0%) |
Household Income by Mortgage Status in Millston
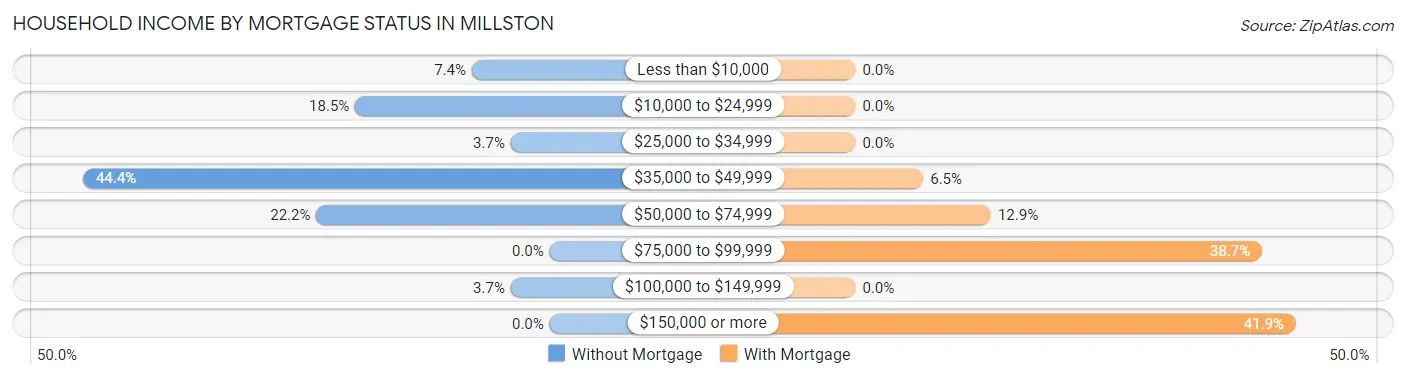
| Household Income | Without Mortgage | With Mortgage |
| Less than $10,000 | 2 (7.4%) | 0 (0.0%) |
| $10,000 to $24,999 | 5 (18.5%) | 0 (0.0%) |
| $25,000 to $34,999 | 1 (3.7%) | 0 (0.0%) |
| $35,000 to $49,999 | 12 (44.4%) | 2 (6.5%) |
| $50,000 to $74,999 | 6 (22.2%) | 4 (12.9%) |
| $75,000 to $99,999 | 0 (0.0%) | 12 (38.7%) |
| $100,000 to $149,999 | 1 (3.7%) | 0 (0.0%) |
| $150,000 or more | 0 (0.0%) | 13 (41.9%) |
| Total | 27 (100.0%) | 31 (100.0%) |
Property Value to Household Income Ratio in Millston
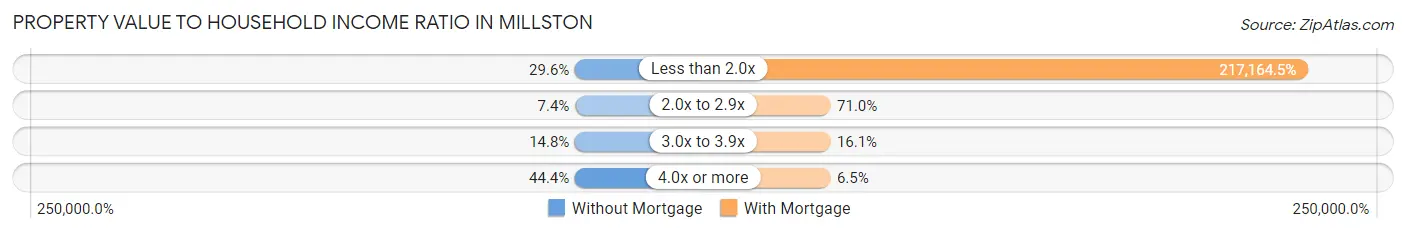
| Value-to-Income Ratio | Without Mortgage | With Mortgage |
| Less than 2.0x | 8 (29.6%) | 67,321 (217,164.5%) |
| 2.0x to 2.9x | 2 (7.4%) | 22 (71.0%) |
| 3.0x to 3.9x | 4 (14.8%) | 5 (16.1%) |
| 4.0x or more | 12 (44.4%) | 2 (6.5%) |
| Total | 27 (100.0%) | 31 (100.0%) |
Real Estate Taxes by Mortgage Status in Millston
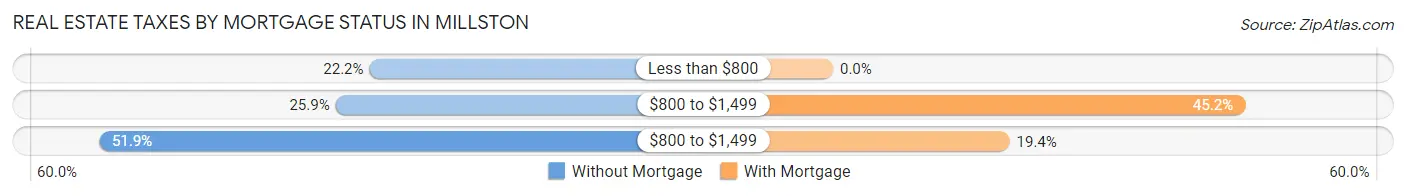
| Property Taxes | Without Mortgage | With Mortgage |
| Less than $800 | 6 (22.2%) | 0 (0.0%) |
| $800 to $1,499 | 7 (25.9%) | 14 (45.2%) |
| $800 to $1,499 | 14 (51.8%) | 6 (19.4%) |
| Total | 27 (100.0%) | 31 (100.0%) |
Health & Disability in Millston
Health Insurance Coverage by Age in Millston
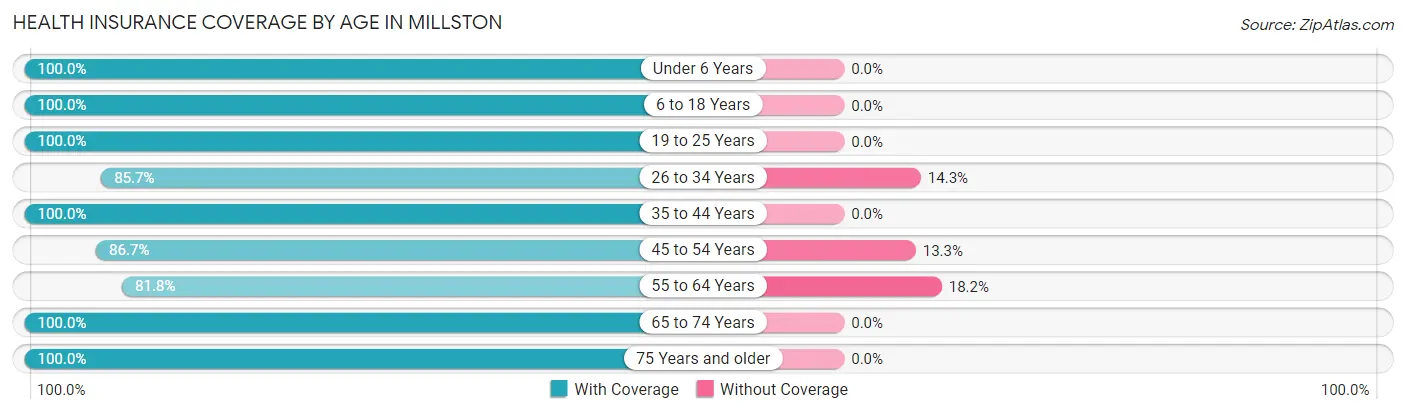
| Age Bracket | With Coverage | Without Coverage |
| Under 6 Years | 1 (100.0%) | 0 (0.0%) |
| 6 to 18 Years | 14 (100.0%) | 0 (0.0%) |
| 19 to 25 Years | 6 (100.0%) | 0 (0.0%) |
| 26 to 34 Years | 6 (85.7%) | 1 (14.3%) |
| 35 to 44 Years | 38 (100.0%) | 0 (0.0%) |
| 45 to 54 Years | 13 (86.7%) | 2 (13.3%) |
| 55 to 64 Years | 18 (81.8%) | 4 (18.2%) |
| 65 to 74 Years | 9 (100.0%) | 0 (0.0%) |
| 75 Years and older | 27 (100.0%) | 0 (0.0%) |
| Total | 132 (95.0%) | 7 (5.0%) |
Health Insurance Coverage by Citizenship Status in Millston
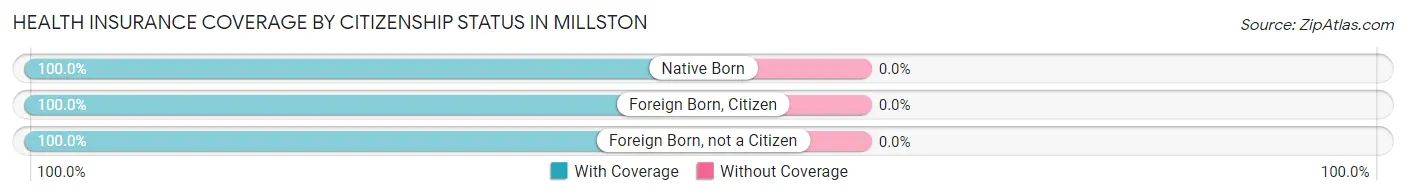
| Citizenship Status | With Coverage | Without Coverage |
| Native Born | 1 (100.0%) | 0 (0.0%) |
| Foreign Born, Citizen | 14 (100.0%) | 0 (0.0%) |
| Foreign Born, not a Citizen | 6 (100.0%) | 0 (0.0%) |
Health Insurance Coverage by Household Income in Millston
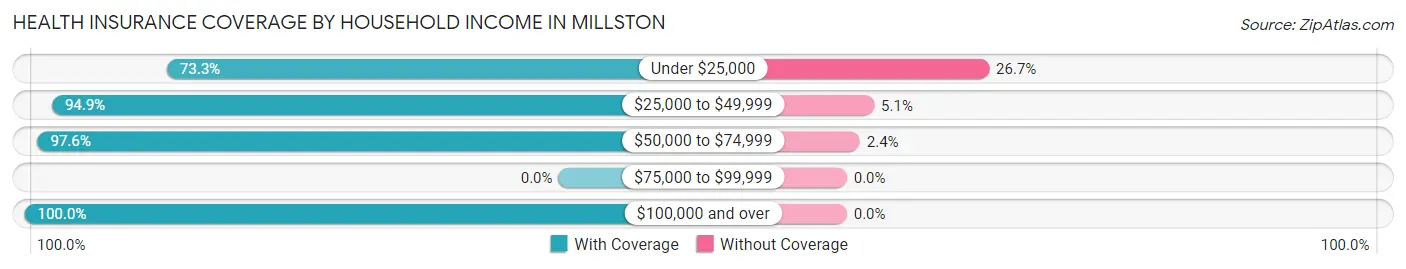
| Household Income | With Coverage | Without Coverage |
| Under $25,000 | 11 (73.3%) | 4 (26.7%) |
| $25,000 to $49,999 | 37 (94.9%) | 2 (5.1%) |
| $50,000 to $74,999 | 40 (97.6%) | 1 (2.4%) |
| $75,000 to $99,999 | 0 (0.0%) | 0 (0.0%) |
| $100,000 and over | 44 (100.0%) | 0 (0.0%) |
Public vs Private Health Insurance Coverage by Age in Millston
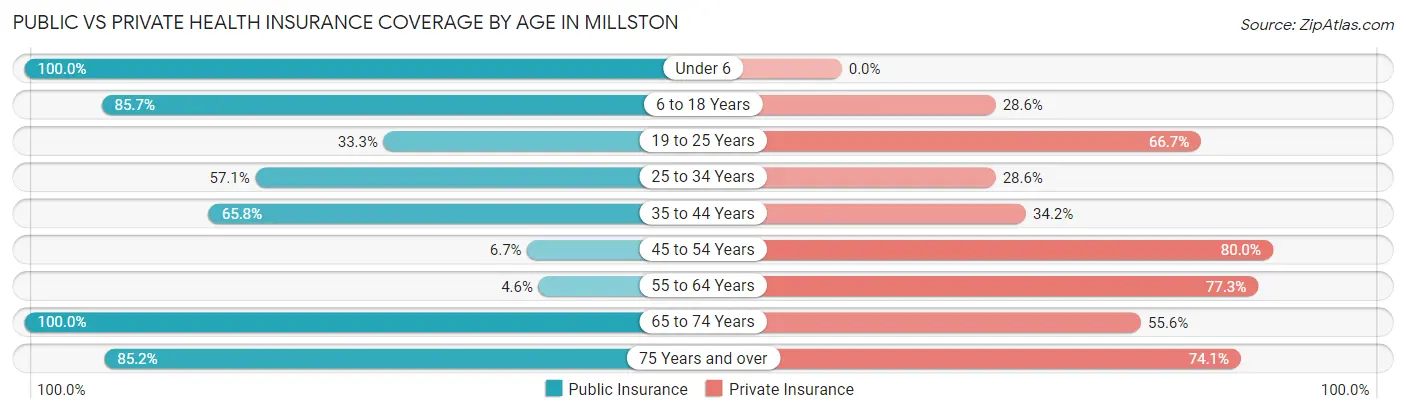
| Age Bracket | Public Insurance | Private Insurance |
| Under 6 | 1 (100.0%) | 0 (0.0%) |
| 6 to 18 Years | 12 (85.7%) | 4 (28.6%) |
| 19 to 25 Years | 2 (33.3%) | 4 (66.7%) |
| 25 to 34 Years | 4 (57.1%) | 2 (28.6%) |
| 35 to 44 Years | 25 (65.8%) | 13 (34.2%) |
| 45 to 54 Years | 1 (6.7%) | 12 (80.0%) |
| 55 to 64 Years | 1 (4.5%) | 17 (77.3%) |
| 65 to 74 Years | 9 (100.0%) | 5 (55.6%) |
| 75 Years and over | 23 (85.2%) | 20 (74.1%) |
| Total | 78 (56.1%) | 77 (55.4%) |
Disability Status by Sex by Age in Millston
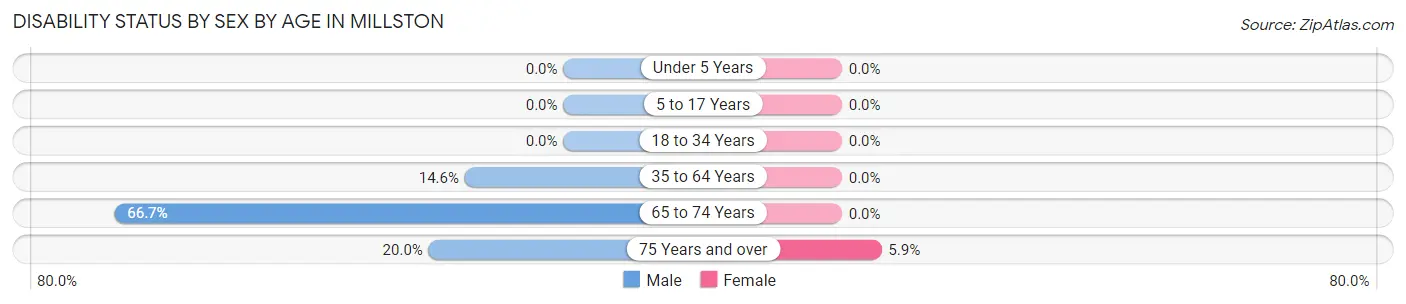
| Age Bracket | Male | Female |
| Under 5 Years | 0 (0.0%) | 0 (0.0%) |
| 5 to 17 Years | 0 (0.0%) | 0 (0.0%) |
| 18 to 34 Years | 0 (0.0%) | 0 (0.0%) |
| 35 to 64 Years | 6 (14.6%) | 0 (0.0%) |
| 65 to 74 Years | 4 (66.7%) | 0 (0.0%) |
| 75 Years and over | 2 (20.0%) | 1 (5.9%) |
Disability Class by Sex by Age in Millston
Disability Class: Hearing Difficulty
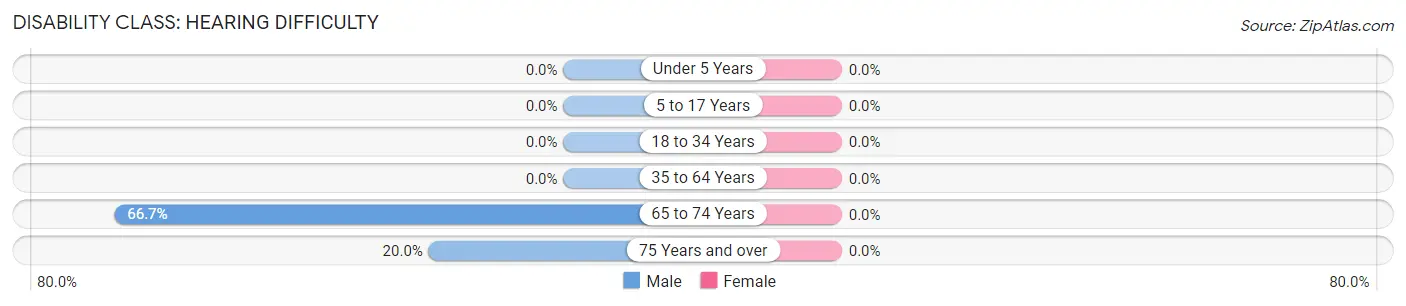
| Age Bracket | Male | Female |
| Under 5 Years | 0 (0.0%) | 0 (0.0%) |
| 5 to 17 Years | 0 (0.0%) | 0 (0.0%) |
| 18 to 34 Years | 0 (0.0%) | 0 (0.0%) |
| 35 to 64 Years | 0 (0.0%) | 0 (0.0%) |
| 65 to 74 Years | 4 (66.7%) | 0 (0.0%) |
| 75 Years and over | 2 (20.0%) | 0 (0.0%) |
Disability Class: Vision Difficulty
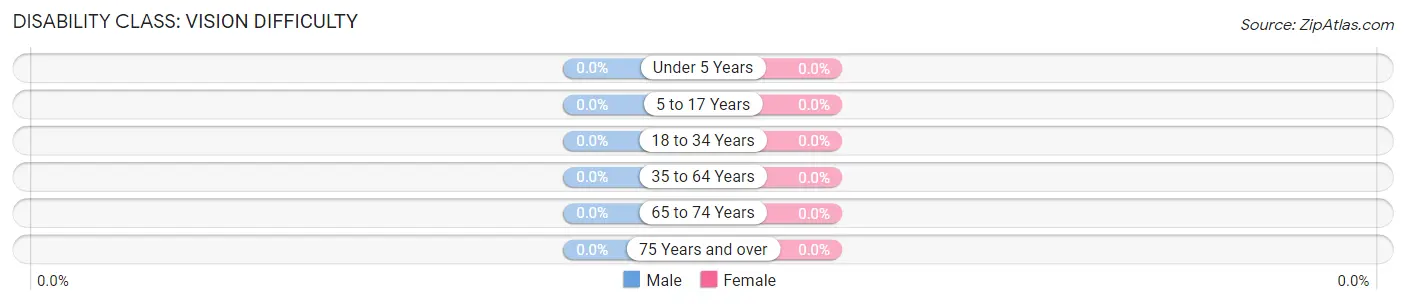
| Age Bracket | Male | Female |
| Under 5 Years | 0 (0.0%) | 0 (0.0%) |
| 5 to 17 Years | 0 (0.0%) | 0 (0.0%) |
| 18 to 34 Years | 0 (0.0%) | 0 (0.0%) |
| 35 to 64 Years | 0 (0.0%) | 0 (0.0%) |
| 65 to 74 Years | 0 (0.0%) | 0 (0.0%) |
| 75 Years and over | 0 (0.0%) | 0 (0.0%) |
Disability Class: Cognitive Difficulty
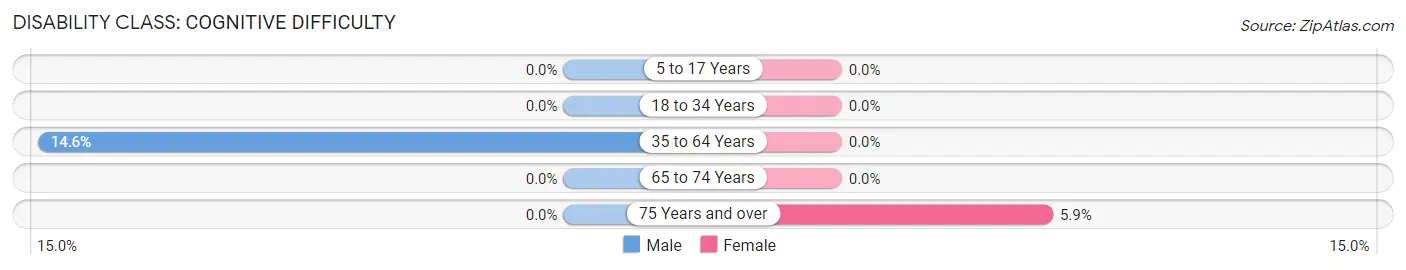
| Age Bracket | Male | Female |
| 5 to 17 Years | 0 (0.0%) | 0 (0.0%) |
| 18 to 34 Years | 0 (0.0%) | 0 (0.0%) |
| 35 to 64 Years | 6 (14.6%) | 0 (0.0%) |
| 65 to 74 Years | 0 (0.0%) | 0 (0.0%) |
| 75 Years and over | 0 (0.0%) | 1 (5.9%) |
Disability Class: Ambulatory Difficulty
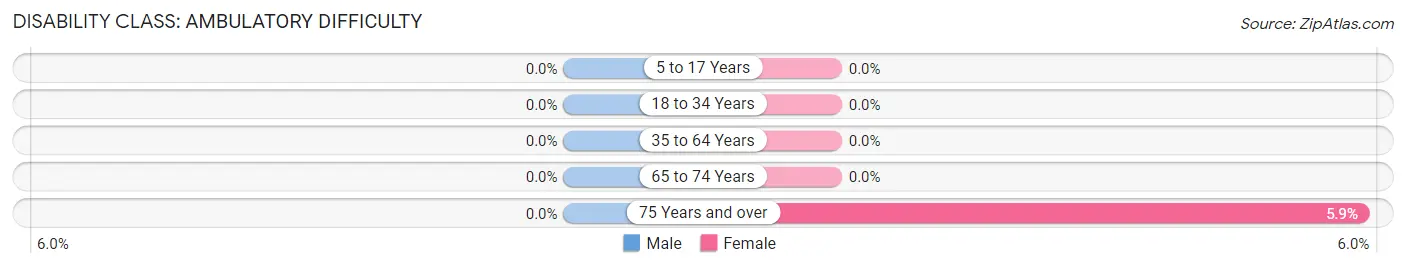
| Age Bracket | Male | Female |
| 5 to 17 Years | 0 (0.0%) | 0 (0.0%) |
| 18 to 34 Years | 0 (0.0%) | 0 (0.0%) |
| 35 to 64 Years | 0 (0.0%) | 0 (0.0%) |
| 65 to 74 Years | 0 (0.0%) | 0 (0.0%) |
| 75 Years and over | 0 (0.0%) | 1 (5.9%) |
Disability Class: Self-Care Difficulty
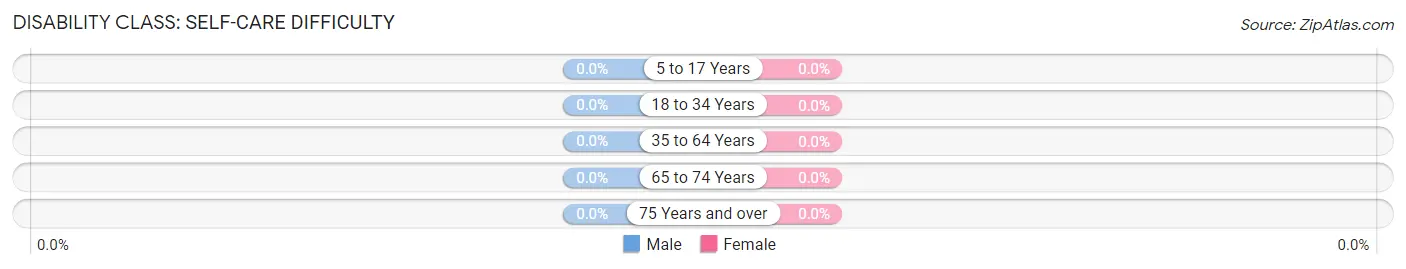
| Age Bracket | Male | Female |
| 5 to 17 Years | 0 (0.0%) | 0 (0.0%) |
| 18 to 34 Years | 0 (0.0%) | 0 (0.0%) |
| 35 to 64 Years | 0 (0.0%) | 0 (0.0%) |
| 65 to 74 Years | 0 (0.0%) | 0 (0.0%) |
| 75 Years and over | 0 (0.0%) | 0 (0.0%) |
Technology Access in Millston
Computing Device Access in Millston
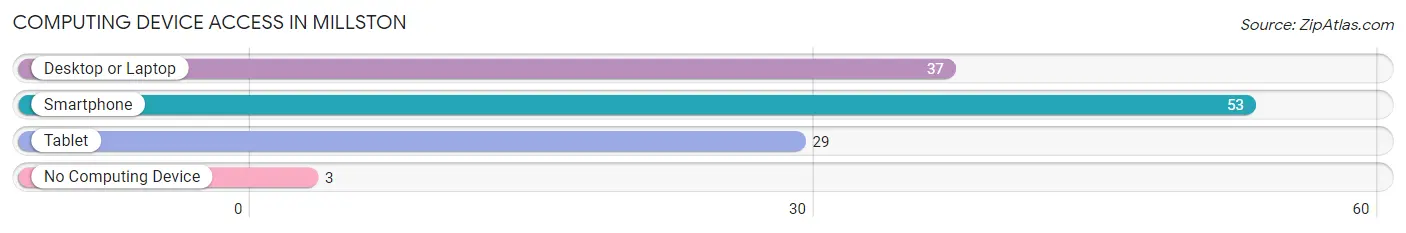
| Device Type | # Households | % Households |
| Desktop or Laptop | 37 | 59.7% |
| Smartphone | 53 | 85.5% |
| Tablet | 29 | 46.8% |
| No Computing Device | 3 | 4.8% |
| Total | 62 | 100.0% |
Internet Access in Millston
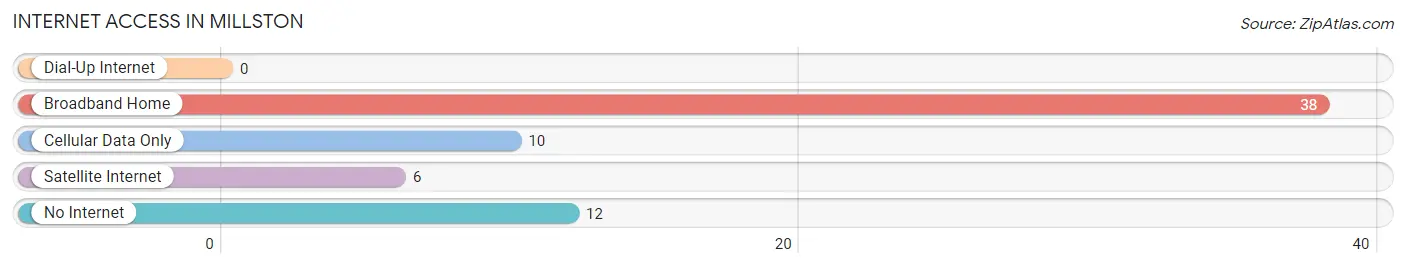
| Internet Type | # Households | % Households |
| Dial-Up Internet | 0 | 0.0% |
| Broadband Home | 38 | 61.3% |
| Cellular Data Only | 10 | 16.1% |
| Satellite Internet | 6 | 9.7% |
| No Internet | 12 | 19.4% |
| Total | 62 | 100.0% |
Millston Summary
History
Millston, Wisconsin is a small town located in Jackson County, Wisconsin. It is situated on the banks of the Black River and is home to a population of just over 500 people. The town was founded in 1854 by a group of settlers from New York and Pennsylvania. The settlers were attracted to the area due to its abundance of natural resources, including timber and fertile soil.
The town was originally named Millstone, after the nearby millstone quarry. The name was later changed to Millston to avoid confusion with another town in the area. The town was incorporated in 1871 and has remained relatively unchanged since then.
The town has a rich history of logging and farming. In the late 1800s, the town was home to several sawmills and gristmills. The town also had a thriving dairy industry, with several cheese factories in operation.
The town was also home to a number of small businesses, including a general store, a blacksmith shop, and a hotel. The town also had a post office, which was established in 1871.
The town was also home to a number of churches, including the Methodist Episcopal Church, the Congregational Church, and the Presbyterian Church.
Geography
Millston is located in Jackson County, Wisconsin. It is situated on the banks of the Black River, which flows through the town. The town is surrounded by rolling hills and is home to a variety of wildlife, including deer, turkey, and other small game.
The town is located approximately 30 miles from the city of Eau Claire, Wisconsin. It is also located approximately 40 miles from the city of La Crosse, Wisconsin.
Economy
The economy of Millston is largely based on agriculture and tourism. The town is home to several small farms, which produce a variety of crops, including corn, soybeans, and hay. The town is also home to several small businesses, including a general store, a blacksmith shop, and a hotel.
The town is also home to a number of tourist attractions, including the Millston Historical Museum, the Millston Logging Museum, and the Millston Wildlife Refuge. The town is also home to a number of outdoor recreational activities, including fishing, hunting, and camping.
Demographics
As of the 2010 census, the population of Millston was 514. The racial makeup of the town was 97.3% White, 0.2% African American, 0.4% Native American, 0.4% Asian, 0.2% from other races, and 1.5% from two or more races. Hispanic or Latino of any race were 0.8% of the population.
The median income for a household in the town was $37,500, and the median income for a family was $45,000. The per capita income for the town was $18,945. About 8.3% of families and 10.2% of the population were below the poverty line, including 14.3% of those under age 18 and 6.3% of those age 65 or over.
Common Questions
What is Per Capita Income in Millston?
Per Capita income in Millston is $26,290.
What is the Median Family Income in Millston?
Median Family Income in Millston is $65,833.
What is the Median Household income in Millston?
Median Household Income in Millston is $50,625.
What is Income or Wage Gap in Millston?
Income or Wage Gap in Millston is 0.6%.
Women in Millston earn 99.4 cents for every dollar earned by a man.
What is Inequality or Gini Index in Millston?
Inequality or Gini Index in Millston is 0.31.
What is the Total Population of Millston?
Total Population of Millston is 139.
What is the Total Male Population of Millston?
Total Male Population of Millston is 77.
What is the Total Female Population of Millston?
Total Female Population of Millston is 62.
What is the Ratio of Males per 100 Females in Millston?
There are 124.19 Males per 100 Females in Millston.
What is the Ratio of Females per 100 Males in Millston?
There are 80.52 Females per 100 Males in Millston.
What is the Median Population Age in Millston?
Median Population Age in Millston is 51.2 Years.
What is the Average Family Size in Millston
Average Family Size in Millston is 2.7 People.
What is the Average Household Size in Millston
Average Household Size in Millston is 2.2 People.
How Large is the Labor Force in Millston?
There are 74 People in the Labor Forcein in Millston.
What is the Percentage of People in the Labor Force in Millston?
58.3% of People are in the Labor Force in Millston.
What is the Unemployment Rate in Millston?
Unemployment Rate in Millston is 9.5%.