Lake Tomahawk, WI Map & Demographics
Lake Tomahawk Map
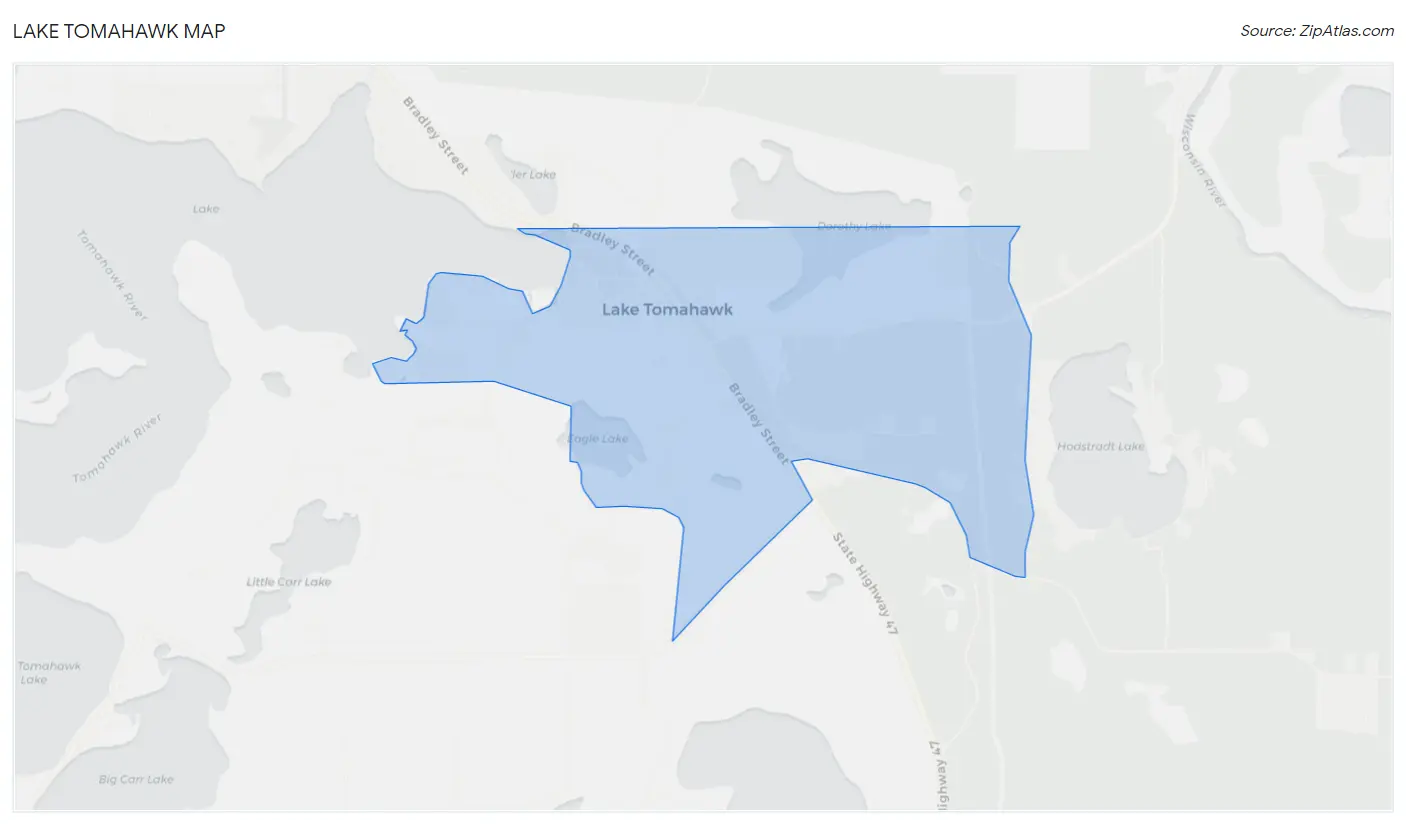
Lake Tomahawk Overview
$28,686
PER CAPITA INCOME
$62,083
AVG FAMILY INCOME
$47,000
AVG HOUSEHOLD INCOME
0.42
INEQUALITY / GINI INDEX
173
TOTAL POPULATION
66
MALE POPULATION
107
FEMALE POPULATION
61.68
MALES / 100 FEMALES
162.12
FEMALES / 100 MALES
43.8
MEDIAN AGE
2.2
AVG FAMILY SIZE
1.9
AVG HOUSEHOLD SIZE
92
LABOR FORCE [ PEOPLE ]
65.7%
PERCENT IN LABOR FORCE
7.6%
UNEMPLOYMENT RATE
Lake Tomahawk Zip Codes
Lake Tomahawk Area Codes
Income in Lake Tomahawk
Income Overview in Lake Tomahawk
Per Capita Income in Lake Tomahawk is $28,686, while median incomes of families and households are $62,083 and $47,000 respectively.
| Characteristic | Number | Measure |
| Per Capita Income | 173 | $28,686 |
| Median Family Income | 57 | $62,083 |
| Mean Family Income | 57 | $51,714 |
| Median Household Income | 90 | $47,000 |
| Mean Household Income | 90 | $53,871 |
| Income Deficit | 57 | $0 |
| Wage / Income Gap (%) | 173 | 0.00% |
| Wage / Income Gap ($) | 173 | 100.00¢ per $1 |
| Gini / Inequality Index | 173 | 0.42 |
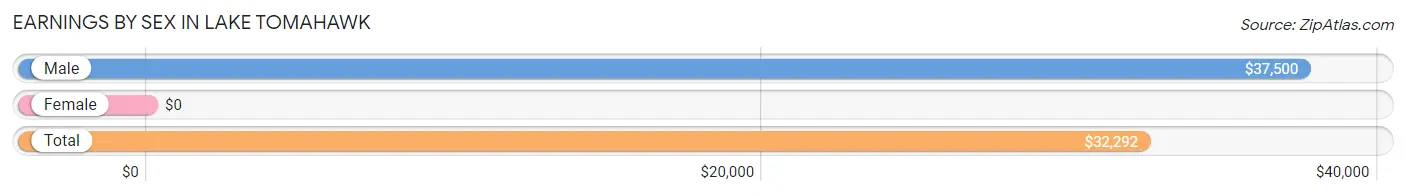
Earnings by Sex in Lake Tomahawk
| Sex | Number | Average Earnings |
| Male | 38 (37.6%) | $37,500 |
| Female | 63 (62.4%) | $0 |
| Total | 101 (100.0%) | $32,292 |
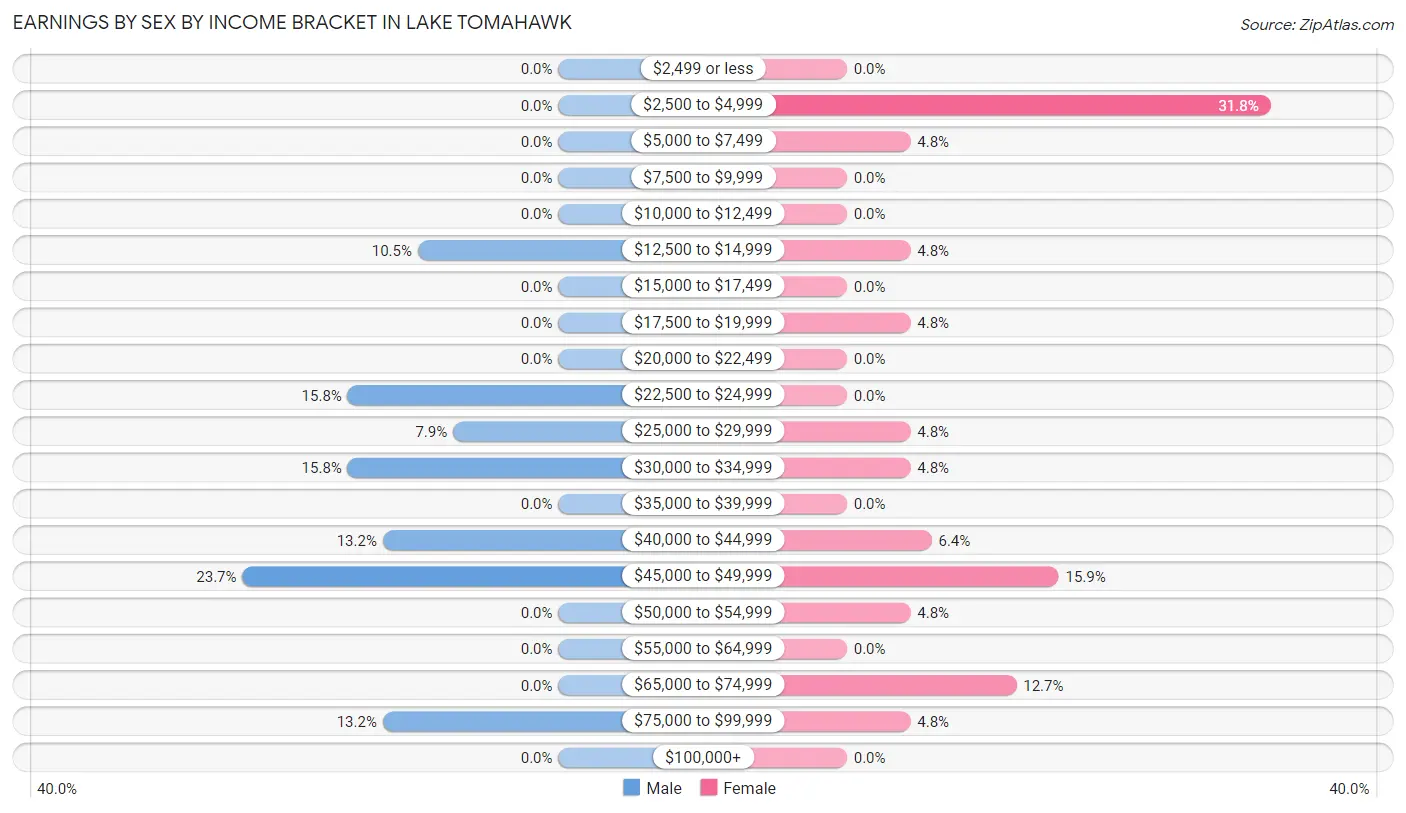
Earnings by Sex by Income Bracket in Lake Tomahawk
The most common earnings brackets in Lake Tomahawk are $45,000 to $49,999 for men (9 | 23.7%) and $2,500 to $4,999 for women (20 | 31.8%).
| Income | Male | Female |
| $2,499 or less | 0 (0.0%) | 0 (0.0%) |
| $2,500 to $4,999 | 0 (0.0%) | 20 (31.8%) |
| $5,000 to $7,499 | 0 (0.0%) | 3 (4.8%) |
| $7,500 to $9,999 | 0 (0.0%) | 0 (0.0%) |
| $10,000 to $12,499 | 0 (0.0%) | 0 (0.0%) |
| $12,500 to $14,999 | 4 (10.5%) | 3 (4.8%) |
| $15,000 to $17,499 | 0 (0.0%) | 0 (0.0%) |
| $17,500 to $19,999 | 0 (0.0%) | 3 (4.8%) |
| $20,000 to $22,499 | 0 (0.0%) | 0 (0.0%) |
| $22,500 to $24,999 | 6 (15.8%) | 0 (0.0%) |
| $25,000 to $29,999 | 3 (7.9%) | 3 (4.8%) |
| $30,000 to $34,999 | 6 (15.8%) | 3 (4.8%) |
| $35,000 to $39,999 | 0 (0.0%) | 0 (0.0%) |
| $40,000 to $44,999 | 5 (13.2%) | 4 (6.4%) |
| $45,000 to $49,999 | 9 (23.7%) | 10 (15.9%) |
| $50,000 to $54,999 | 0 (0.0%) | 3 (4.8%) |
| $55,000 to $64,999 | 0 (0.0%) | 0 (0.0%) |
| $65,000 to $74,999 | 0 (0.0%) | 8 (12.7%) |
| $75,000 to $99,999 | 5 (13.2%) | 3 (4.8%) |
| $100,000+ | 0 (0.0%) | 0 (0.0%) |
| Total | 38 (100.0%) | 63 (100.0%) |
Earnings by Sex by Educational Attainment in Lake Tomahawk
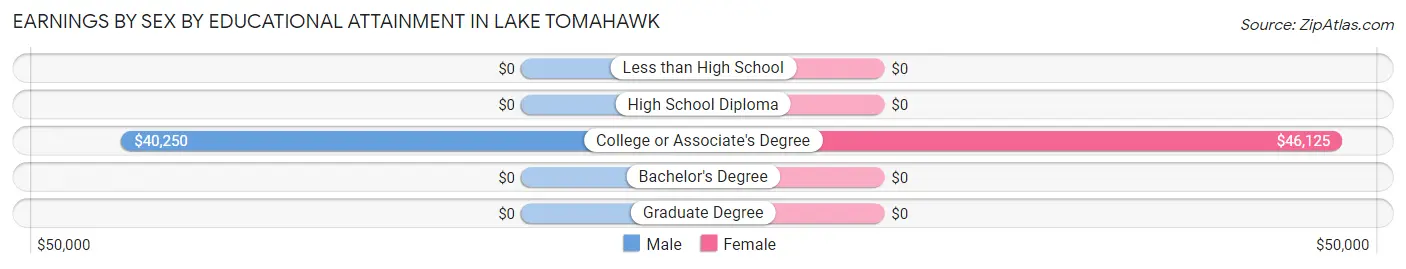
| Educational Attainment | Male Income | Female Income |
| Less than High School | - | - |
| High School Diploma | - | - |
| College or Associate's Degree | $40,250 | $46,125 |
| Bachelor's Degree | - | - |
| Graduate Degree | - | - |
| Total | $37,500 | $0 |
Family Income in Lake Tomahawk
Family Income Brackets in Lake Tomahawk
According to the Lake Tomahawk family income data, there are 25 families falling into the $50,000 to $74,999 income range, which is the most common income bracket and makes up 43.9% of all families.
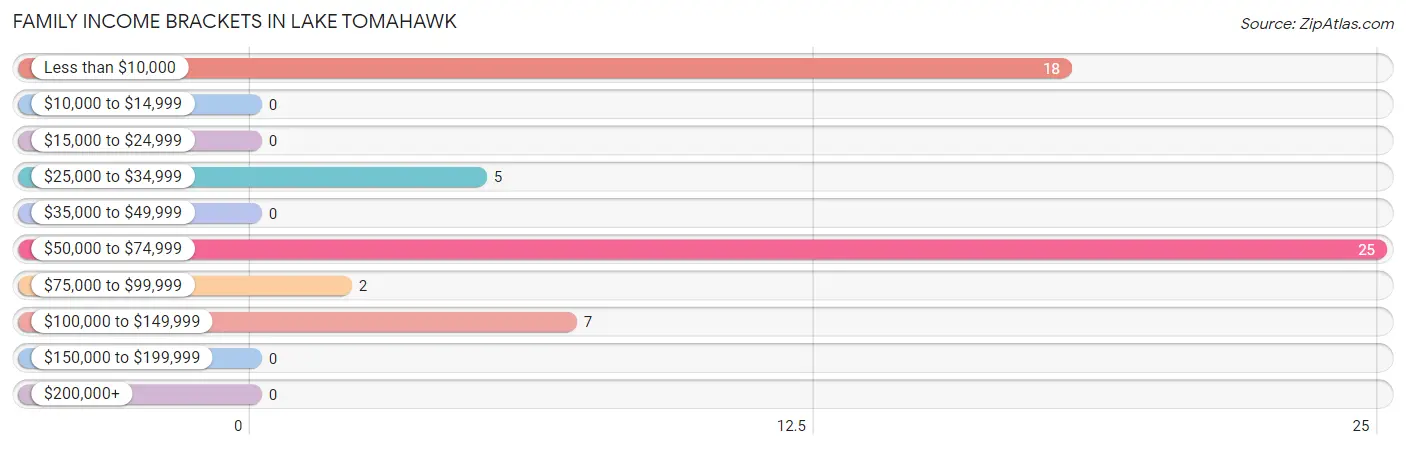
| Income Bracket | # Families | % Families |
| Less than $10,000 | 18 | 31.6% |
| $10,000 to $14,999 | 0 | 0.0% |
| $15,000 to $24,999 | 0 | 0.0% |
| $25,000 to $34,999 | 5 | 8.8% |
| $35,000 to $49,999 | 0 | 0.0% |
| $50,000 to $74,999 | 25 | 43.9% |
| $75,000 to $99,999 | 2 | 3.5% |
| $100,000 to $149,999 | 7 | 12.3% |
| $150,000 to $199,999 | 0 | 0.0% |
| $200,000+ | 0 | 0.0% |
Family Income by Famaliy Size in Lake Tomahawk
2-person families (53 | 93.0%) account for the highest median family income in Lake Tomahawk with $60,417 per family, while 2-person families (53 | 93.0%) have the highest median income of $30,208 per family member.
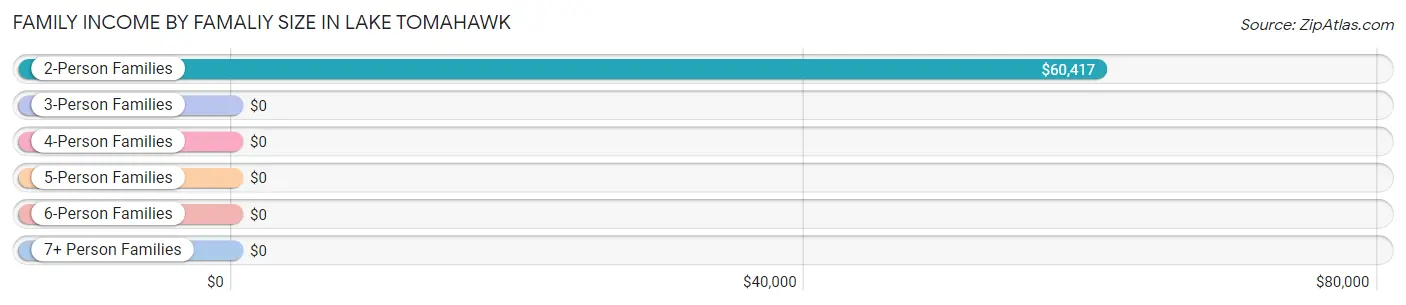
| Income Bracket | # Families | Median Income |
| 2-Person Families | 53 (93.0%) | $60,417 |
| 3-Person Families | 4 (7.0%) | $0 |
| 4-Person Families | 0 (0.0%) | $0 |
| 5-Person Families | 0 (0.0%) | $0 |
| 6-Person Families | 0 (0.0%) | $0 |
| 7+ Person Families | 0 (0.0%) | $0 |
| Total | 57 (100.0%) | $62,083 |
Family Income by Number of Earners in Lake Tomahawk
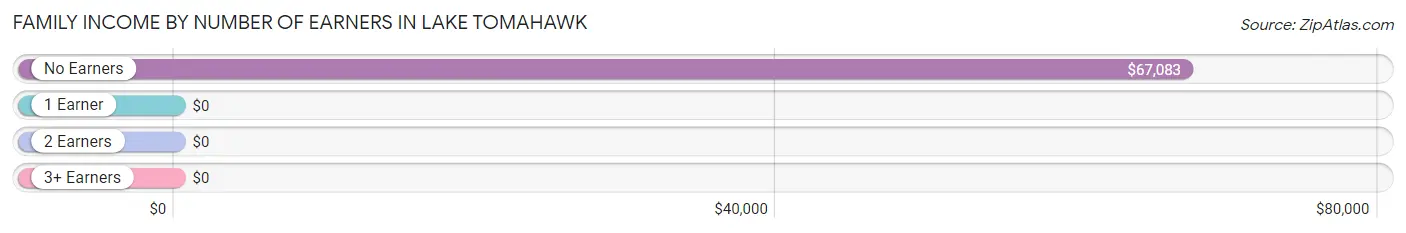
| Number of Earners | # Families | Median Income |
| No Earners | 11 (19.3%) | $67,083 |
| 1 Earner | 33 (57.9%) | $0 |
| 2 Earners | 13 (22.8%) | $0 |
| 3+ Earners | 0 (0.0%) | $0 |
| Total | 57 (100.0%) | $62,083 |
Household Income in Lake Tomahawk
Household Income Brackets in Lake Tomahawk
With 23 households falling in the category, the $50,000 to $74,999 income range is the most frequent in Lake Tomahawk, accounting for 25.6% of all households.
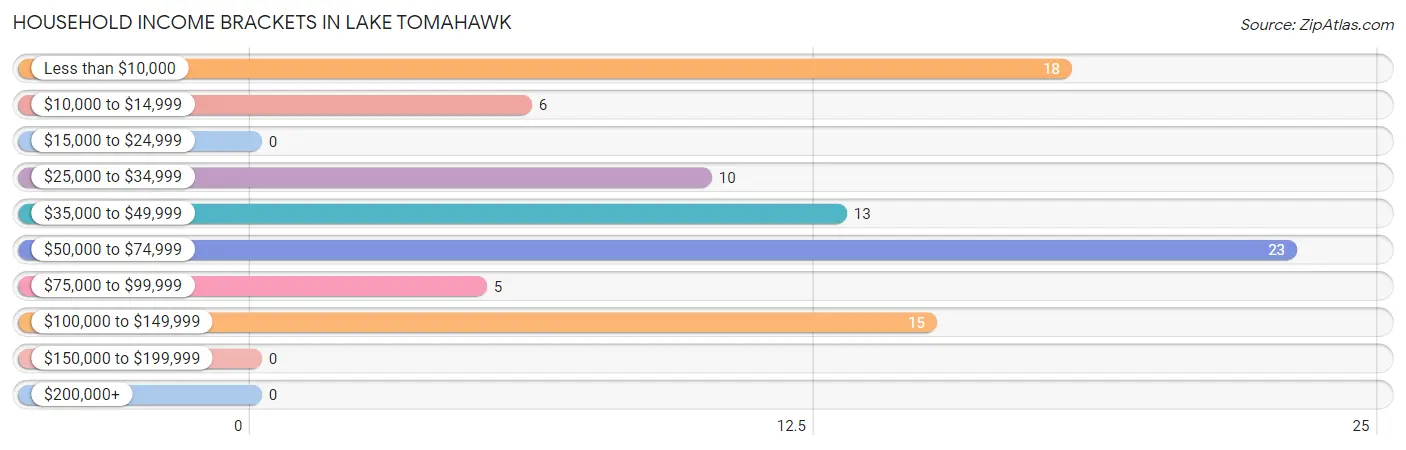
| Income Bracket | # Households | % Households |
| Less than $10,000 | 18 | 20.0% |
| $10,000 to $14,999 | 6 | 6.7% |
| $15,000 to $24,999 | 0 | 0.0% |
| $25,000 to $34,999 | 10 | 11.1% |
| $35,000 to $49,999 | 13 | 14.4% |
| $50,000 to $74,999 | 23 | 25.6% |
| $75,000 to $99,999 | 5 | 5.6% |
| $100,000 to $149,999 | 15 | 16.7% |
| $150,000 to $199,999 | 0 | 0.0% |
| $200,000+ | 0 | 0.0% |
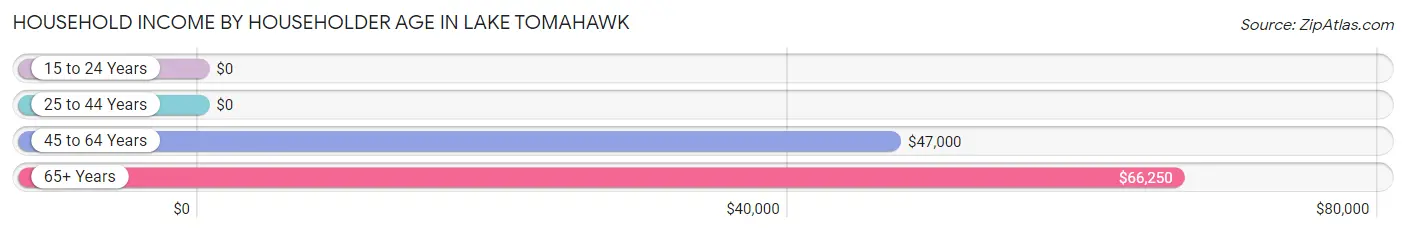
Household Income by Householder Age in Lake Tomahawk
The median household income in Lake Tomahawk is $47,000, with the highest median household income of $66,250 found in the 65+ years age bracket for the primary householder. A total of 29 households (32.2%) fall into this category.
| Income Bracket | # Households | Median Income |
| 15 to 24 Years | 0 (0.0%) | $0 |
| 25 to 44 Years | 39 (43.3%) | $0 |
| 45 to 64 Years | 22 (24.4%) | $47,000 |
| 65+ Years | 29 (32.2%) | $66,250 |
| Total | 90 (100.0%) | $47,000 |
Poverty in Lake Tomahawk
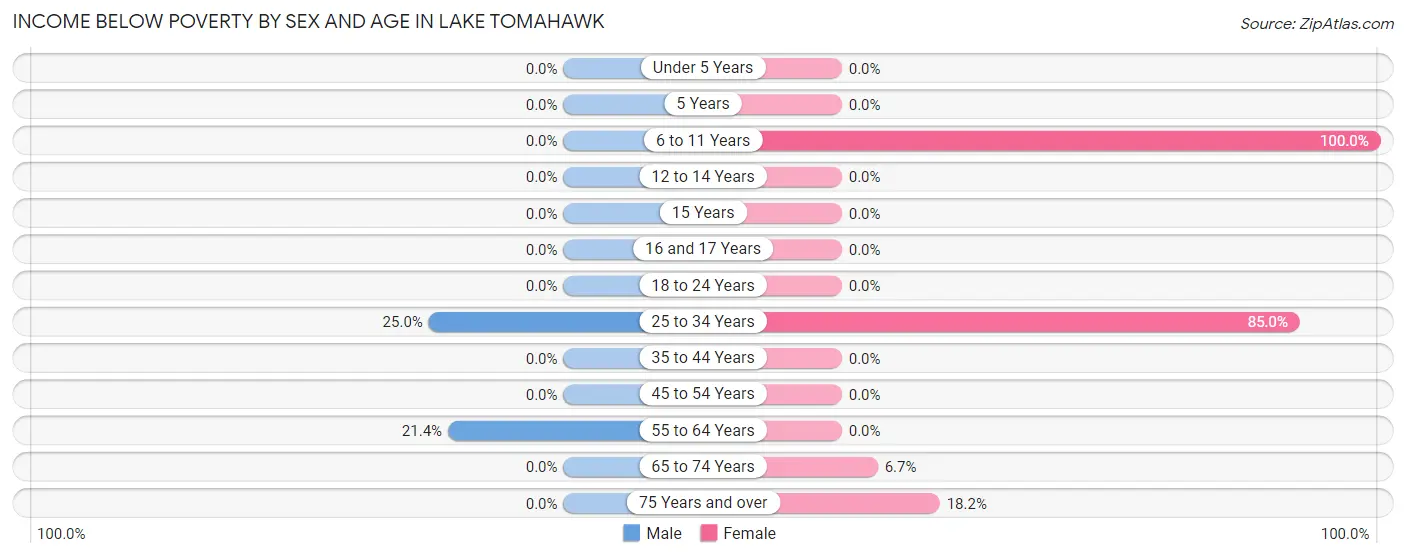
Income Below Poverty by Sex and Age in Lake Tomahawk
With 10.6% poverty level for males and 35.5% for females among the residents of Lake Tomahawk, 25 to 34 year old males and 6 to 11 year old females are the most vulnerable to poverty, with 4 males (25.0%) and 18 females (100.0%) in their respective age groups living below the poverty level.
| Age Bracket | Male | Female |
| Under 5 Years | 0 (0.0%) | 0 (0.0%) |
| 5 Years | 0 (0.0%) | 0 (0.0%) |
| 6 to 11 Years | 0 (0.0%) | 18 (100.0%) |
| 12 to 14 Years | 0 (0.0%) | 0 (0.0%) |
| 15 Years | 0 (0.0%) | 0 (0.0%) |
| 16 and 17 Years | 0 (0.0%) | 0 (0.0%) |
| 18 to 24 Years | 0 (0.0%) | 0 (0.0%) |
| 25 to 34 Years | 4 (25.0%) | 17 (85.0%) |
| 35 to 44 Years | 0 (0.0%) | 0 (0.0%) |
| 45 to 54 Years | 0 (0.0%) | 0 (0.0%) |
| 55 to 64 Years | 3 (21.4%) | 0 (0.0%) |
| 65 to 74 Years | 0 (0.0%) | 1 (6.7%) |
| 75 Years and over | 0 (0.0%) | 2 (18.2%) |
| Total | 7 (10.6%) | 38 (35.5%) |
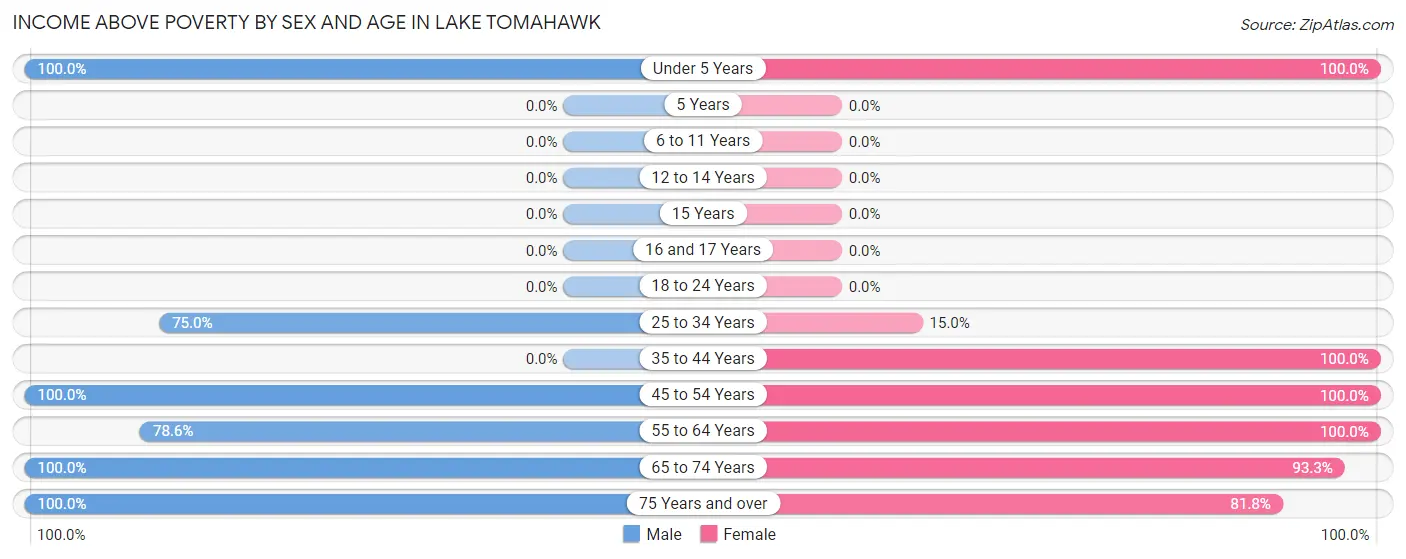
Income Above Poverty by Sex and Age in Lake Tomahawk
According to the poverty statistics in Lake Tomahawk, males aged under 5 years and females aged under 5 years are the age groups that are most secure financially, with 100.0% of males and 100.0% of females in these age groups living above the poverty line.
| Age Bracket | Male | Female |
| Under 5 Years | 9 (100.0%) | 6 (100.0%) |
| 5 Years | 0 (0.0%) | 0 (0.0%) |
| 6 to 11 Years | 0 (0.0%) | 0 (0.0%) |
| 12 to 14 Years | 0 (0.0%) | 0 (0.0%) |
| 15 Years | 0 (0.0%) | 0 (0.0%) |
| 16 and 17 Years | 0 (0.0%) | 0 (0.0%) |
| 18 to 24 Years | 0 (0.0%) | 0 (0.0%) |
| 25 to 34 Years | 12 (75.0%) | 3 (15.0%) |
| 35 to 44 Years | 0 (0.0%) | 18 (100.0%) |
| 45 to 54 Years | 5 (100.0%) | 10 (100.0%) |
| 55 to 64 Years | 11 (78.6%) | 9 (100.0%) |
| 65 to 74 Years | 6 (100.0%) | 14 (93.3%) |
| 75 Years and over | 16 (100.0%) | 9 (81.8%) |
| Total | 59 (89.4%) | 69 (64.5%) |
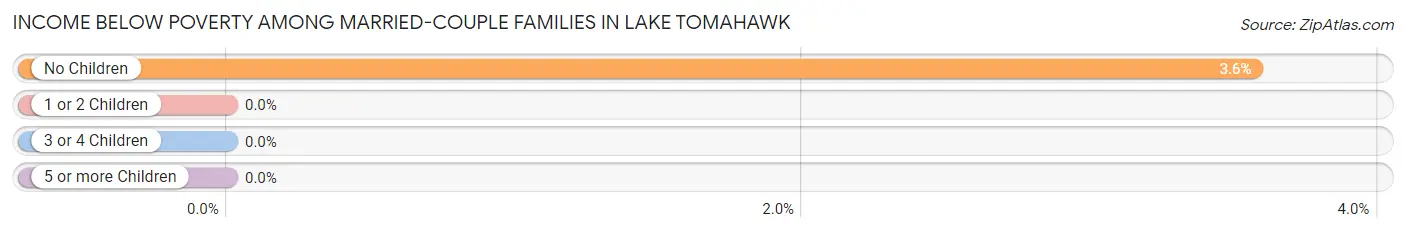
Income Below Poverty Among Married-Couple Families in Lake Tomahawk
The poverty statistics for married-couple families in Lake Tomahawk show that 3.1% or 1 of the total 32 families live below the poverty line. Families with no children have the highest poverty rate of 3.6%, comprising of 1 families. On the other hand, families with 1 or 2 children have the lowest poverty rate of 0.0%, which includes 0 families.
| Children | Above Poverty | Below Poverty |
| No Children | 27 (96.4%) | 1 (3.6%) |
| 1 or 2 Children | 4 (100.0%) | 0 (0.0%) |
| 3 or 4 Children | 0 (0.0%) | 0 (0.0%) |
| 5 or more Children | 0 (0.0%) | 0 (0.0%) |
| Total | 31 (96.9%) | 1 (3.1%) |
Income Below Poverty Among Single-Parent Households in Lake Tomahawk
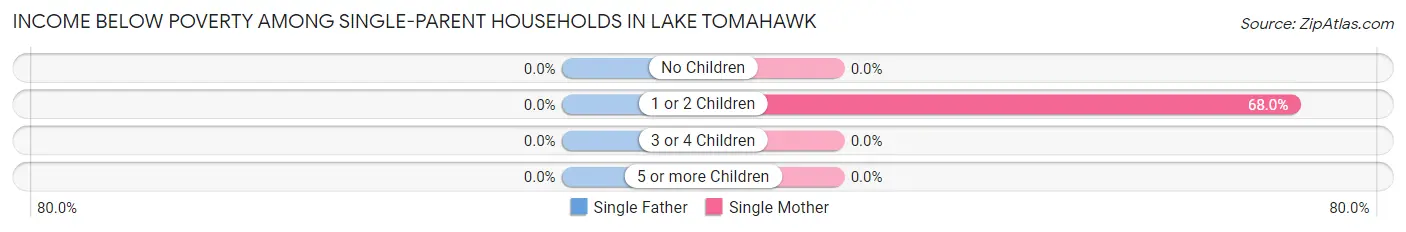
| Children | Single Father | Single Mother |
| No Children | 0 (0.0%) | 0 (0.0%) |
| 1 or 2 Children | 0 (0.0%) | 17 (68.0%) |
| 3 or 4 Children | 0 (0.0%) | 0 (0.0%) |
| 5 or more Children | 0 (0.0%) | 0 (0.0%) |
| Total | 0 (0.0%) | 17 (68.0%) |
Income Below Poverty Among Married-Couple vs Single-Parent Households in Lake Tomahawk
The poverty data for Lake Tomahawk shows that 1 of the married-couple family households (3.1%) and 17 of the single-parent households (68.0%) are living below the poverty level. Within the married-couple family households, those with no children have the highest poverty rate, with 1 households (3.6%) falling below the poverty line. Among the single-parent households, those with 1 or 2 children have the highest poverty rate, with 17 household (68.0%) living below poverty.
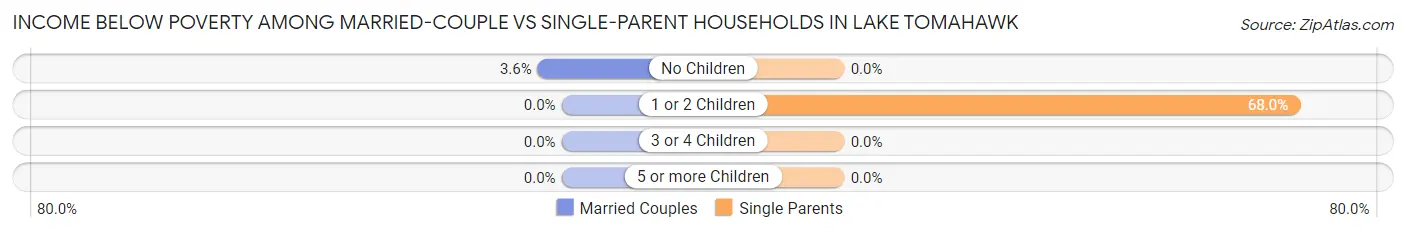
| Children | Married-Couple Families | Single-Parent Households |
| No Children | 1 (3.6%) | 0 (0.0%) |
| 1 or 2 Children | 0 (0.0%) | 17 (68.0%) |
| 3 or 4 Children | 0 (0.0%) | 0 (0.0%) |
| 5 or more Children | 0 (0.0%) | 0 (0.0%) |
| Total | 1 (3.1%) | 17 (68.0%) |
Race in Lake Tomahawk
The most populous races in Lake Tomahawk are White / Caucasian (162 | 93.6%), Hispanic or Latino (11 | 6.4%), and Two or more Races (6 | 3.5%).
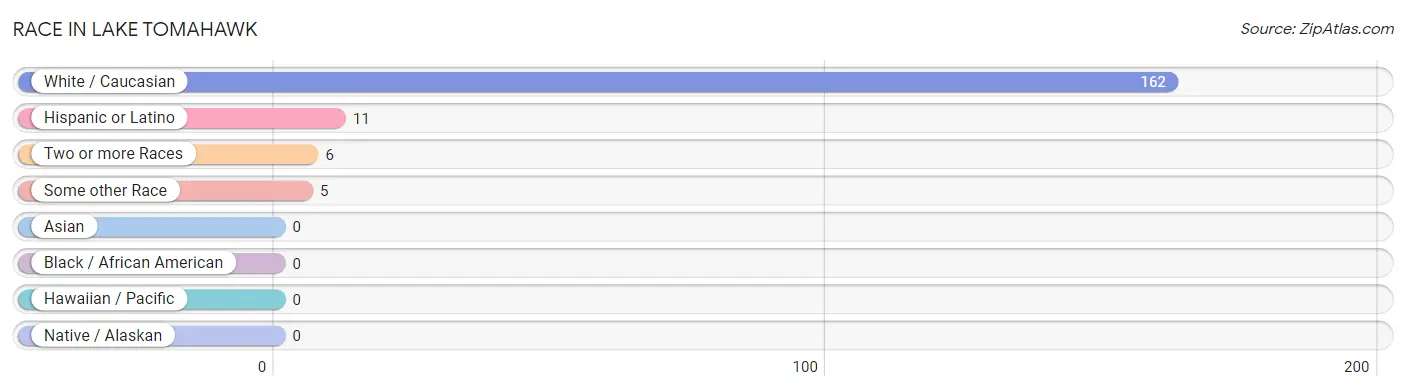
| Race | # Population | % Population |
| Asian | 0 | 0.0% |
| Black / African American | 0 | 0.0% |
| Hawaiian / Pacific | 0 | 0.0% |
| Hispanic or Latino | 11 | 6.4% |
| Native / Alaskan | 0 | 0.0% |
| White / Caucasian | 162 | 93.6% |
| Two or more Races | 6 | 3.5% |
| Some other Race | 5 | 2.9% |
| Total | 173 | 100.0% |
Ancestry in Lake Tomahawk
The most populous ancestries reported in Lake Tomahawk are German (55 | 31.8%), Polish (26 | 15.0%), Irish (18 | 10.4%), American (15 | 8.7%), and Austrian (13 | 7.5%), together accounting for 73.4% of all Lake Tomahawk residents.
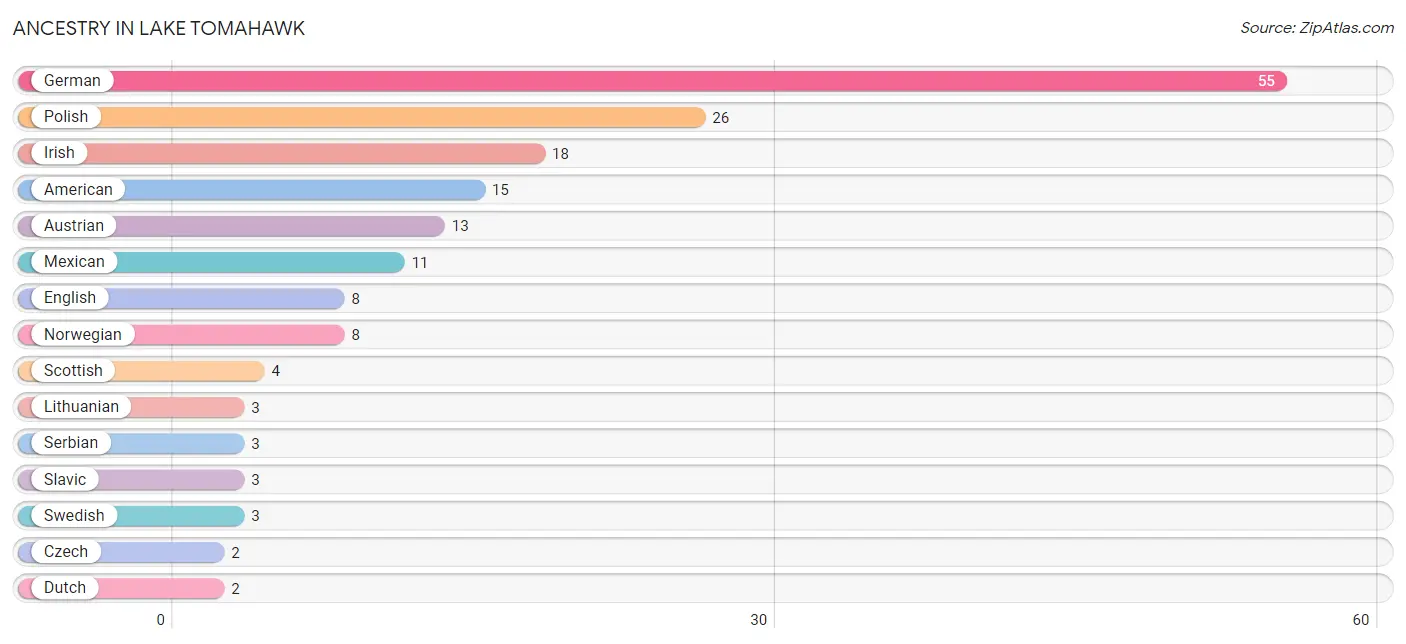
| Ancestry | # Population | % Population |
| American | 15 | 8.7% |
| Austrian | 13 | 7.5% |
| Czech | 2 | 1.2% |
| Dutch | 2 | 1.2% |
| English | 8 | 4.6% |
| German | 55 | 31.8% |
| Irish | 18 | 10.4% |
| Lithuanian | 3 | 1.7% |
| Mexican | 11 | 6.4% |
| Norwegian | 8 | 4.6% |
| Polish | 26 | 15.0% |
| Scotch-Irish | 2 | 1.2% |
| Scottish | 4 | 2.3% |
| Serbian | 3 | 1.7% |
| Slavic | 3 | 1.7% |
| Swedish | 3 | 1.7% | View All 16 Rows |
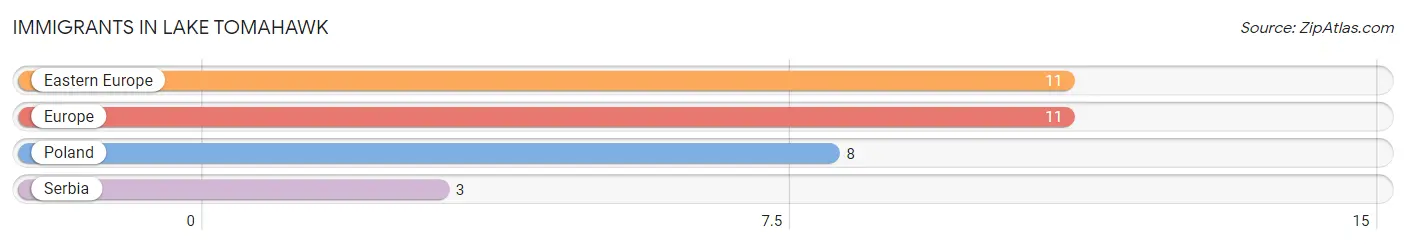
Immigrants in Lake Tomahawk
The most numerous immigrant groups reported in Lake Tomahawk came from Eastern Europe (11 | 6.4%), Europe (11 | 6.4%), Poland (8 | 4.6%), and Serbia (3 | 1.7%), together accounting for 19.1% of all Lake Tomahawk residents.
| Immigration Origin | # Population | % Population |
| Eastern Europe | 11 | 6.4% |
| Europe | 11 | 6.4% |
| Poland | 8 | 4.6% |
| Serbia | 3 | 1.7% | View All 4 Rows |
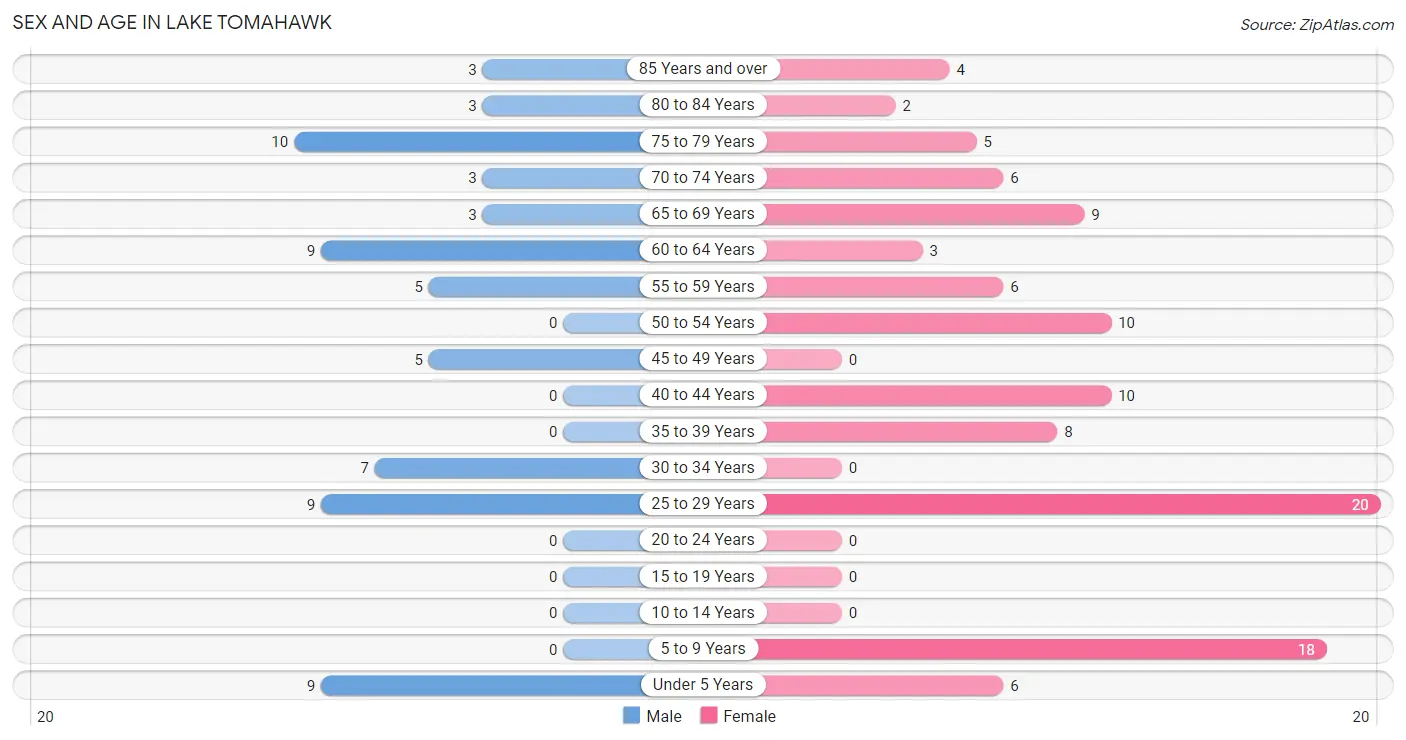
Sex and Age in Lake Tomahawk
Sex and Age in Lake Tomahawk
The most populous age groups in Lake Tomahawk are 75 to 79 Years (10 | 15.1%) for men and 25 to 29 Years (20 | 18.7%) for women.
| Age Bracket | Male | Female |
| Under 5 Years | 9 (13.6%) | 6 (5.6%) |
| 5 to 9 Years | 0 (0.0%) | 18 (16.8%) |
| 10 to 14 Years | 0 (0.0%) | 0 (0.0%) |
| 15 to 19 Years | 0 (0.0%) | 0 (0.0%) |
| 20 to 24 Years | 0 (0.0%) | 0 (0.0%) |
| 25 to 29 Years | 9 (13.6%) | 20 (18.7%) |
| 30 to 34 Years | 7 (10.6%) | 0 (0.0%) |
| 35 to 39 Years | 0 (0.0%) | 8 (7.5%) |
| 40 to 44 Years | 0 (0.0%) | 10 (9.3%) |
| 45 to 49 Years | 5 (7.6%) | 0 (0.0%) |
| 50 to 54 Years | 0 (0.0%) | 10 (9.3%) |
| 55 to 59 Years | 5 (7.6%) | 6 (5.6%) |
| 60 to 64 Years | 9 (13.6%) | 3 (2.8%) |
| 65 to 69 Years | 3 (4.5%) | 9 (8.4%) |
| 70 to 74 Years | 3 (4.5%) | 6 (5.6%) |
| 75 to 79 Years | 10 (15.1%) | 5 (4.7%) |
| 80 to 84 Years | 3 (4.5%) | 2 (1.9%) |
| 85 Years and over | 3 (4.5%) | 4 (3.7%) |
| Total | 66 (100.0%) | 107 (100.0%) |
Families and Households in Lake Tomahawk
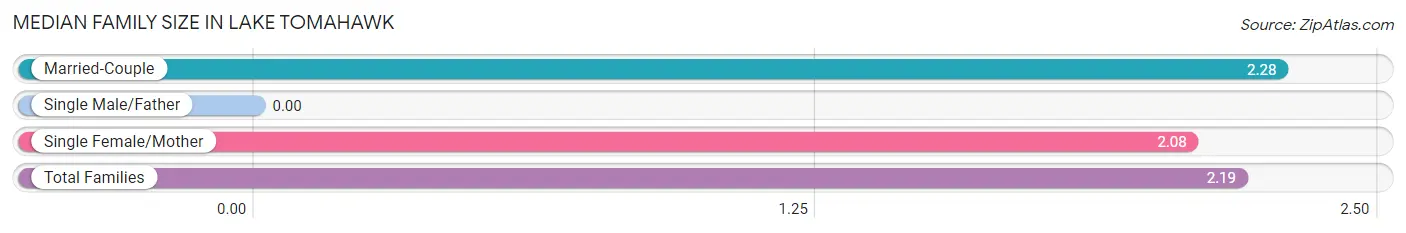
Median Family Size in Lake Tomahawk
| Family Type | # Families | Family Size |
| Married-Couple | 32 (56.1%) | 2.28 |
| Single Male/Father | 0 (0.0%) | - |
| Single Female/Mother | 25 (43.9%) | 2.08 |
| Total Families | 57 (100.0%) | 2.19 |
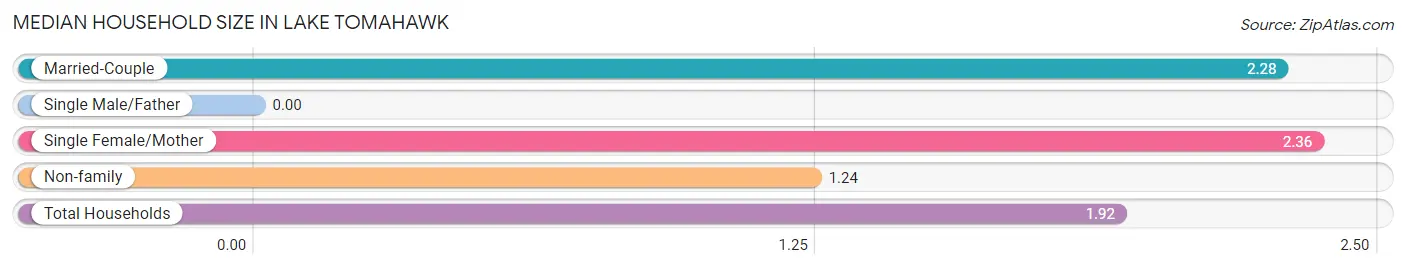
Median Household Size in Lake Tomahawk
| Household Type | # Households | Household Size |
| Married-Couple | 32 (35.6%) | 2.28 |
| Single Male/Father | 0 (0.0%) | - |
| Single Female/Mother | 25 (27.8%) | 2.36 |
| Non-family | 33 (36.7%) | 1.24 |
| Total Households | 90 (100.0%) | 1.92 |
Household Size by Marriage Status in Lake Tomahawk
Out of a total of 90 households in Lake Tomahawk, 57 (63.3%) are family households, while 33 (36.7%) are nonfamily households. The most numerous type of family households are 2-person households, comprising 45, and the most common type of nonfamily households are 1-person households, comprising 27.
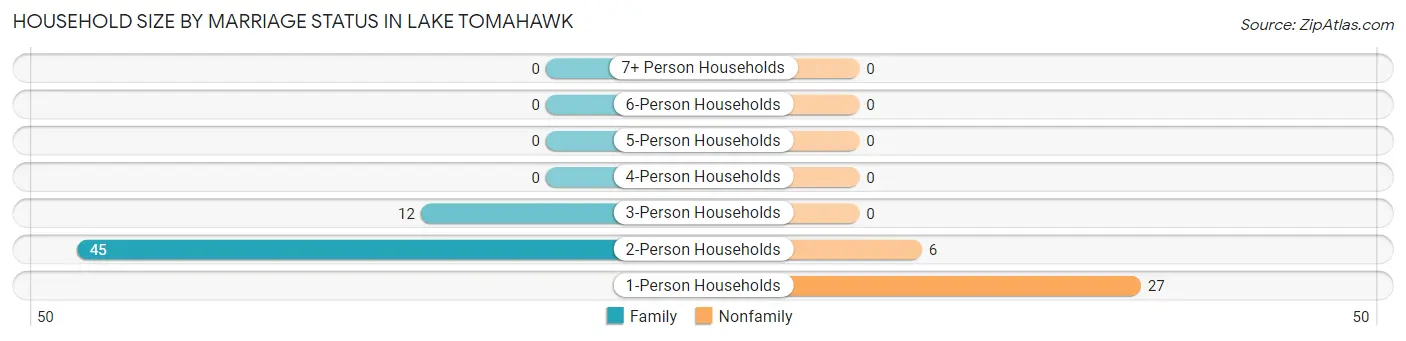
| Household Size | Family Households | Nonfamily Households |
| 1-Person Households | - | 27 (30.0%) |
| 2-Person Households | 45 (50.0%) | 6 (6.7%) |
| 3-Person Households | 12 (13.3%) | 0 (0.0%) |
| 4-Person Households | 0 (0.0%) | 0 (0.0%) |
| 5-Person Households | 0 (0.0%) | 0 (0.0%) |
| 6-Person Households | 0 (0.0%) | 0 (0.0%) |
| 7+ Person Households | 0 (0.0%) | 0 (0.0%) |
| Total | 57 (63.3%) | 33 (36.7%) |
Female Fertility in Lake Tomahawk
Fertility by Age in Lake Tomahawk
Average fertility rate in Lake Tomahawk is 105.0 births per 1,000 women. Women in the age bracket of 35 to 50 years have the highest fertility rate with 222.0 births per 1,000 women. Women in the age bracket of 35 to 50 years acount for 100.0% of all women with births.
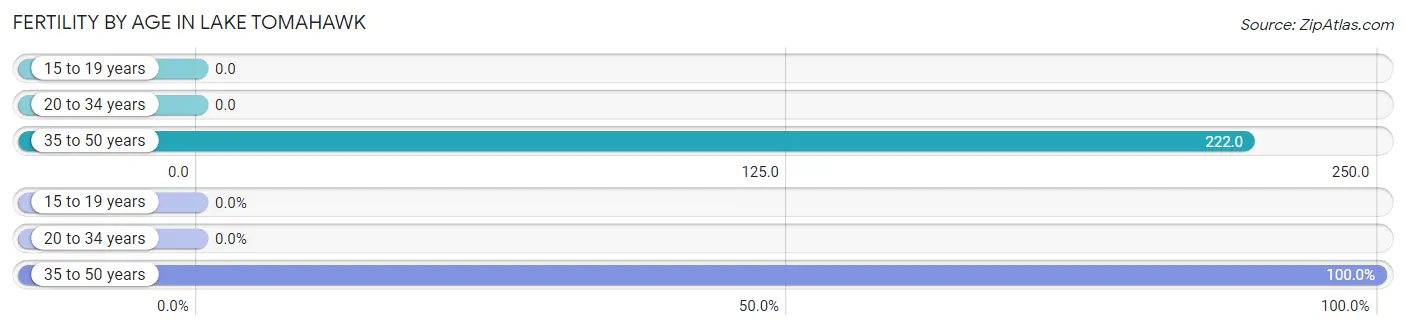
| Age Bracket | Women with Births | Births / 1,000 Women |
| 15 to 19 years | 0 (0.0%) | 0.0 |
| 20 to 34 years | 0 (0.0%) | 0.0 |
| 35 to 50 years | 4 (100.0%) | 222.0 |
| Total | 4 (100.0%) | 105.0 |
Fertility by Age by Marriage Status in Lake Tomahawk
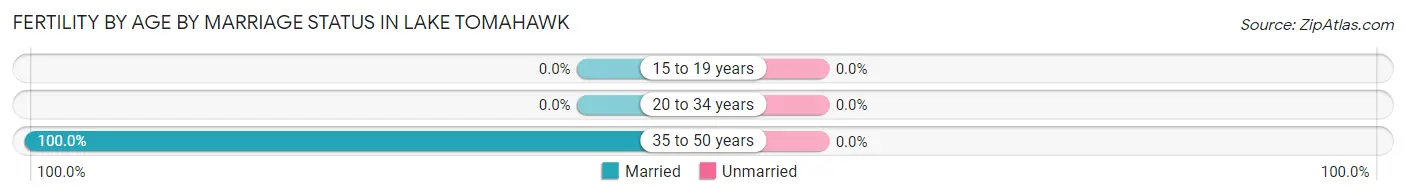
| Age Bracket | Married | Unmarried |
| 15 to 19 years | 0 (0.0%) | 0 (0.0%) |
| 20 to 34 years | 0 (0.0%) | 0 (0.0%) |
| 35 to 50 years | 4 (100.0%) | 0 (0.0%) |
| Total | 4 (100.0%) | 0 (0.0%) |
Fertility by Education in Lake Tomahawk
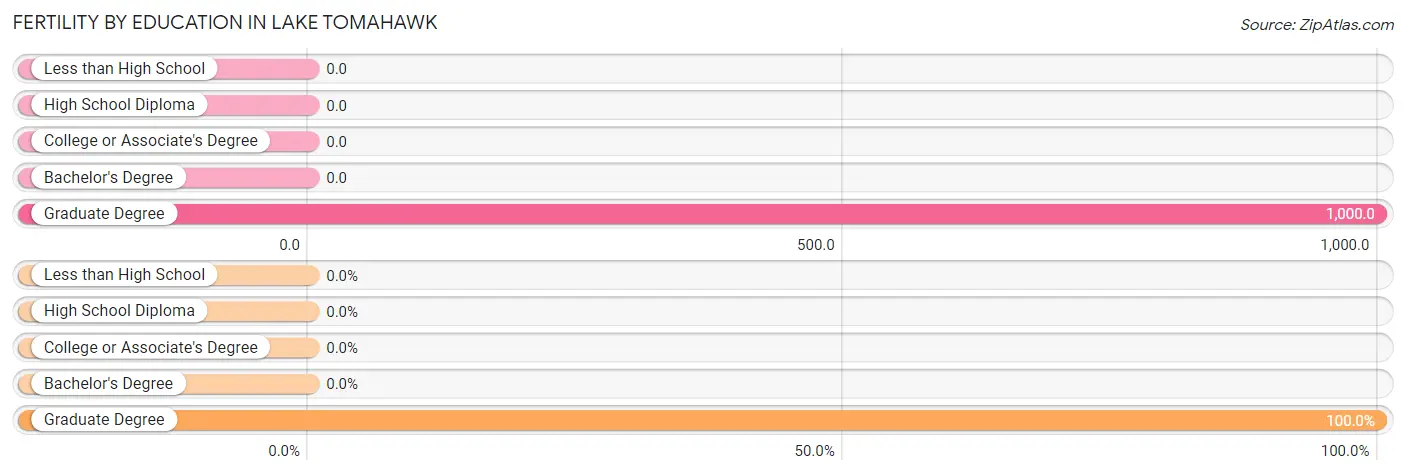
| Educational Attainment | Women with Births | Births / 1,000 Women |
| Less than High School | 0 (0.0%) | 0.0 |
| High School Diploma | 0 (0.0%) | 0.0 |
| College or Associate's Degree | 0 (0.0%) | 0.0 |
| Bachelor's Degree | 0 (0.0%) | 0.0 |
| Graduate Degree | 4 (100.0%) | 1,000.0 |
| Total | 4 (100.0%) | 105.0 |
Fertility by Education by Marriage Status in Lake Tomahawk
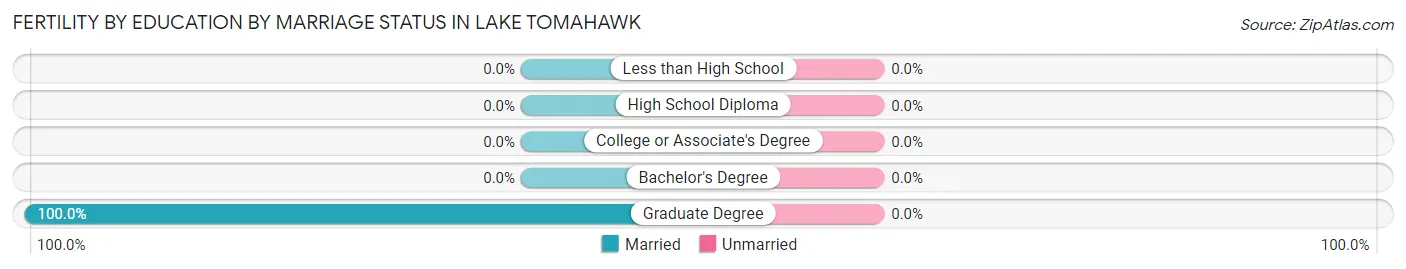
| Educational Attainment | Married | Unmarried |
| Less than High School | 0 (0.0%) | 0 (0.0%) |
| High School Diploma | 0 (0.0%) | 0 (0.0%) |
| College or Associate's Degree | 0 (0.0%) | 0 (0.0%) |
| Bachelor's Degree | 0 (0.0%) | 0 (0.0%) |
| Graduate Degree | 4 (100.0%) | 0 (0.0%) |
| Total | 4 (100.0%) | 0 (0.0%) |
Employment Characteristics in Lake Tomahawk
Employment by Class of Employer in Lake Tomahawk
Among the 85 employed individuals in Lake Tomahawk, private company employees (74 | 87.1%), not-for-profit organizations (6 | 7.1%), and local government employees (5 | 5.9%) make up the most common classes of employment.
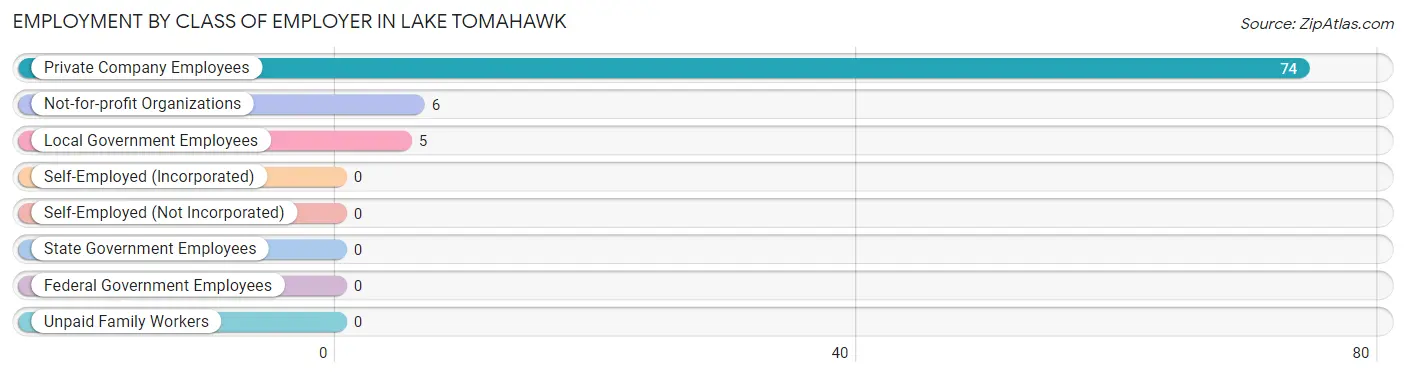
| Employer Class | # Employees | % Employees |
| Private Company Employees | 74 | 87.1% |
| Self-Employed (Incorporated) | 0 | 0.0% |
| Self-Employed (Not Incorporated) | 0 | 0.0% |
| Not-for-profit Organizations | 6 | 7.1% |
| Local Government Employees | 5 | 5.9% |
| State Government Employees | 0 | 0.0% |
| Federal Government Employees | 0 | 0.0% |
| Unpaid Family Workers | 0 | 0.0% |
| Total | 85 | 100.0% |
Employment Status by Age in Lake Tomahawk
According to the labor force statistics for Lake Tomahawk, out of the total population over 16 years of age (140), 65.7% or 92 individuals are in the labor force, with 7.6% or 7 of them unemployed. The age group with the highest labor force participation rate is 25 to 29 years, with 100.0% or 29 individuals in the labor force. Within the labor force, the 55 to 59 years age range has the highest percentage of unemployed individuals, with 27.3% or 3 of them being unemployed.
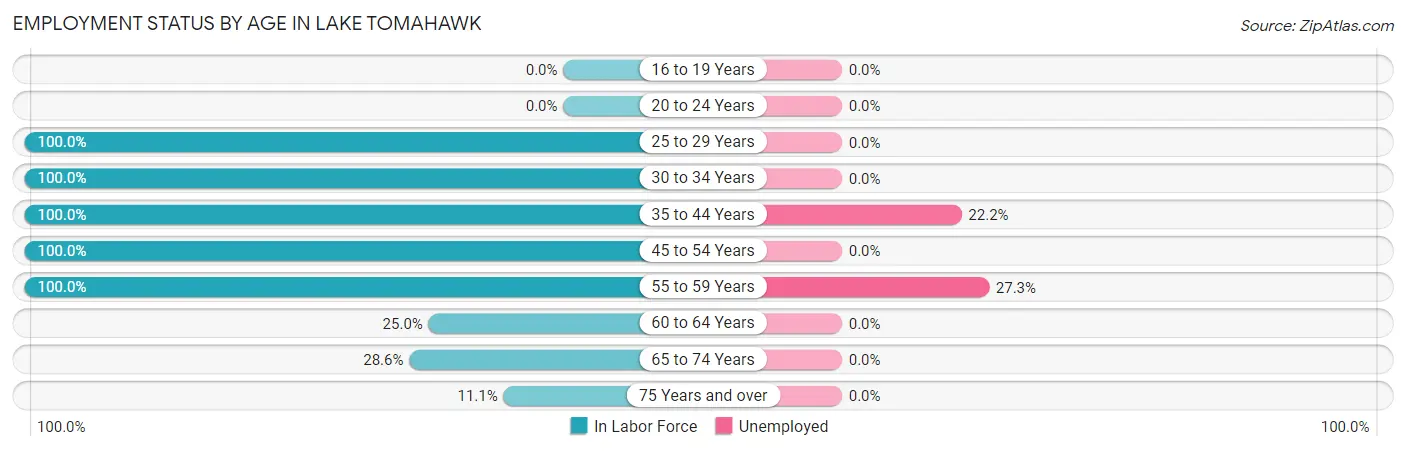
| Age Bracket | In Labor Force | Unemployed |
| 16 to 19 Years | 0 (0.0%) | 0 (0.0%) |
| 20 to 24 Years | 0 (0.0%) | 0 (0.0%) |
| 25 to 29 Years | 29 (100.0%) | 0 (0.0%) |
| 30 to 34 Years | 7 (100.0%) | 0 (0.0%) |
| 35 to 44 Years | 18 (100.0%) | 4 (22.2%) |
| 45 to 54 Years | 15 (100.0%) | 0 (0.0%) |
| 55 to 59 Years | 11 (100.0%) | 3 (27.3%) |
| 60 to 64 Years | 3 (25.0%) | 0 (0.0%) |
| 65 to 74 Years | 6 (28.6%) | 0 (0.0%) |
| 75 Years and over | 3 (11.1%) | 0 (0.0%) |
| Total | 92 (65.7%) | 7 (7.6%) |
Employment Status by Educational Attainment in Lake Tomahawk
According to labor force statistics for Lake Tomahawk, 90.2% of individuals (83) out of the total population between 25 and 64 years of age (92) are in the labor force, with 8.4% or 7 of them being unemployed. The group with the highest labor force participation rate are those with the educational attainment of college / associate degree, with 100.0% or 45 individuals in the labor force. Within the labor force, individuals with bachelor's degree or higher education have the highest percentage of unemployment, with 44.4% or 4 of them being unemployed.
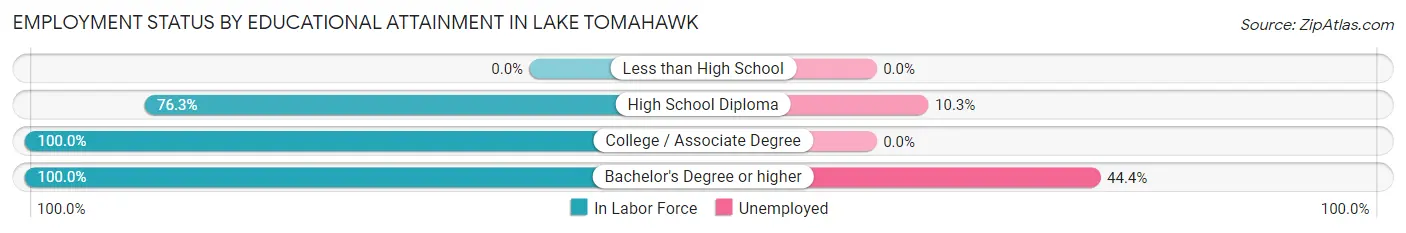
| Educational Attainment | In Labor Force | Unemployed |
| Less than High School | 0 (0.0%) | 0 (0.0%) |
| High School Diploma | 29 (76.3%) | 4 (10.3%) |
| College / Associate Degree | 45 (100.0%) | 0 (0.0%) |
| Bachelor's Degree or higher | 9 (100.0%) | 4 (44.4%) |
| Total | 83 (90.2%) | 8 (8.4%) |
Employment Occupations by Sex in Lake Tomahawk
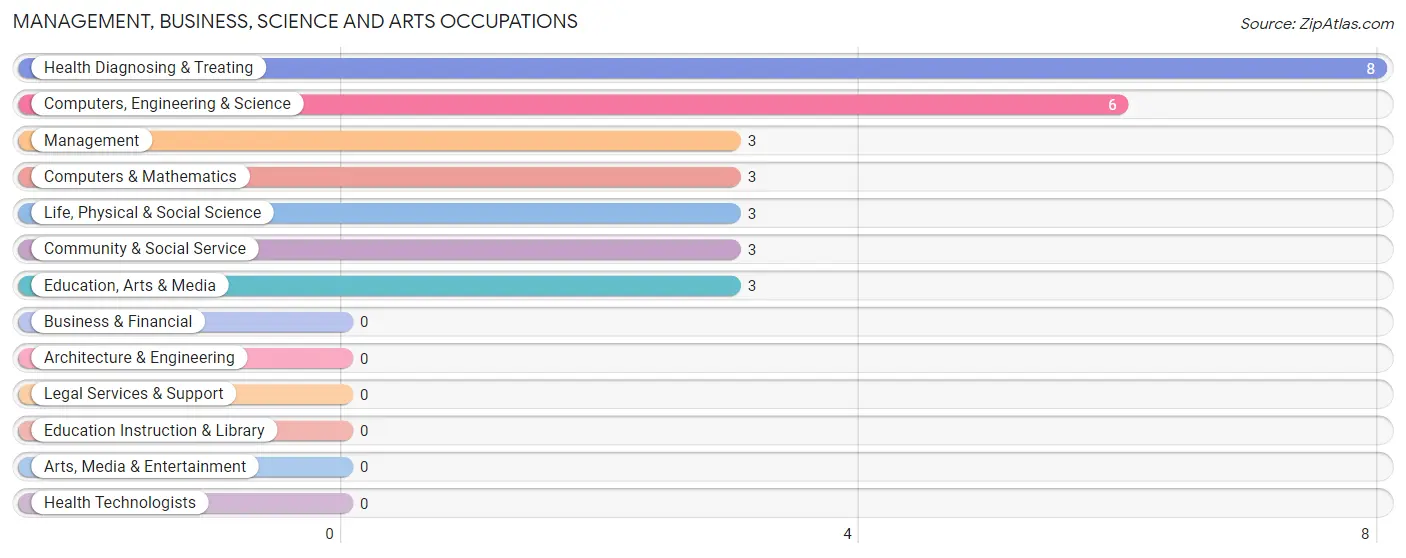
Management, Business, Science and Arts Occupations
The most common Management, Business, Science and Arts occupations in Lake Tomahawk are Health Diagnosing & Treating (8 | 9.4%), Computers, Engineering & Science (6 | 7.1%), Management (3 | 3.5%), Computers & Mathematics (3 | 3.5%), and Life, Physical & Social Science (3 | 3.5%).
Management, Business, Science and Arts Occupations by Sex
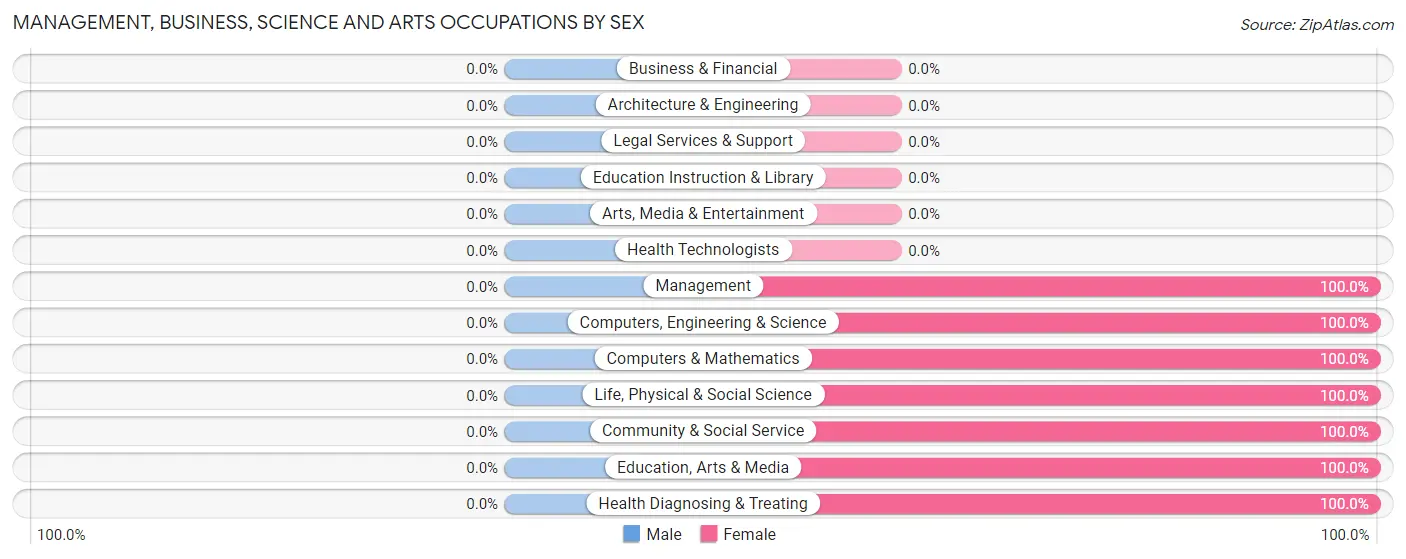
| Occupation | Male | Female |
| Management | 0 (0.0%) | 3 (100.0%) |
| Business & Financial | 0 (0.0%) | 0 (0.0%) |
| Computers, Engineering & Science | 0 (0.0%) | 6 (100.0%) |
| Computers & Mathematics | 0 (0.0%) | 3 (100.0%) |
| Architecture & Engineering | 0 (0.0%) | 0 (0.0%) |
| Life, Physical & Social Science | 0 (0.0%) | 3 (100.0%) |
| Community & Social Service | 0 (0.0%) | 3 (100.0%) |
| Education, Arts & Media | 0 (0.0%) | 3 (100.0%) |
| Legal Services & Support | 0 (0.0%) | 0 (0.0%) |
| Education Instruction & Library | 0 (0.0%) | 0 (0.0%) |
| Arts, Media & Entertainment | 0 (0.0%) | 0 (0.0%) |
| Health Diagnosing & Treating | 0 (0.0%) | 8 (100.0%) |
| Health Technologists | 0 (0.0%) | 0 (0.0%) |
| Total (Category) | 0 (0.0%) | 20 (100.0%) |
| Total (Overall) | 32 (37.7%) | 53 (62.4%) |
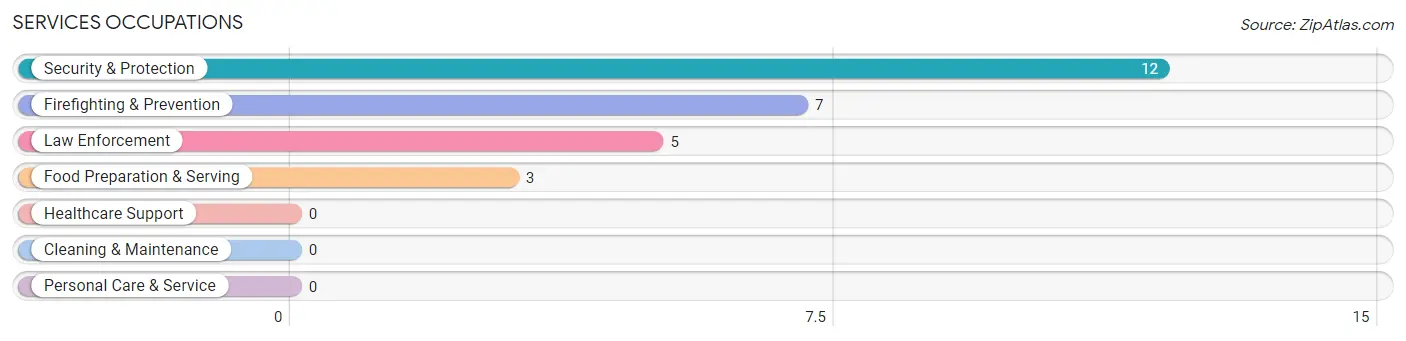
Services Occupations
The most common Services occupations in Lake Tomahawk are Security & Protection (12 | 14.1%), Firefighting & Prevention (7 | 8.2%), Law Enforcement (5 | 5.9%), and Food Preparation & Serving (3 | 3.5%).
Services Occupations by Sex
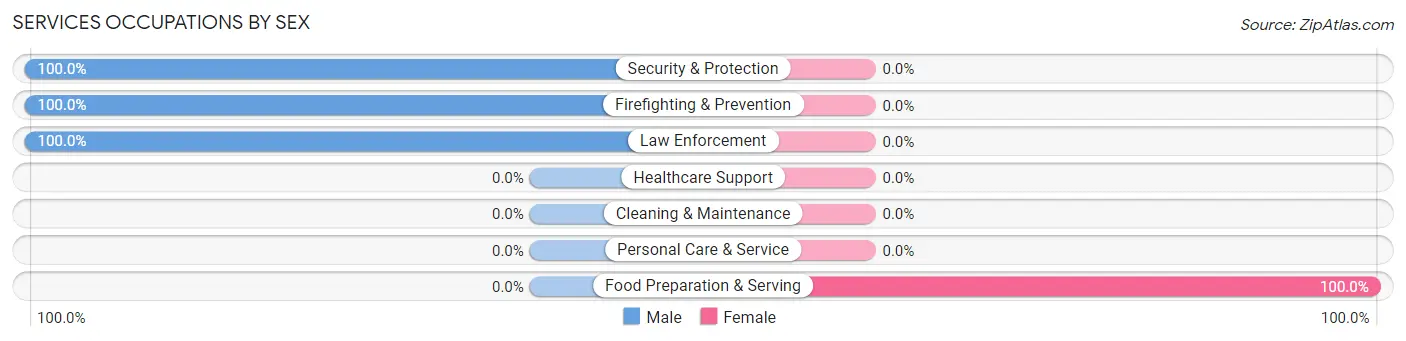
| Occupation | Male | Female |
| Healthcare Support | 0 (0.0%) | 0 (0.0%) |
| Security & Protection | 12 (100.0%) | 0 (0.0%) |
| Firefighting & Prevention | 7 (100.0%) | 0 (0.0%) |
| Law Enforcement | 5 (100.0%) | 0 (0.0%) |
| Food Preparation & Serving | 0 (0.0%) | 3 (100.0%) |
| Cleaning & Maintenance | 0 (0.0%) | 0 (0.0%) |
| Personal Care & Service | 0 (0.0%) | 0 (0.0%) |
| Total (Category) | 12 (80.0%) | 3 (20.0%) |
| Total (Overall) | 32 (37.7%) | 53 (62.4%) |
Sales and Office Occupations
The most common Sales and Office occupations in Lake Tomahawk are , and Office & Administration (30 | 35.3%).
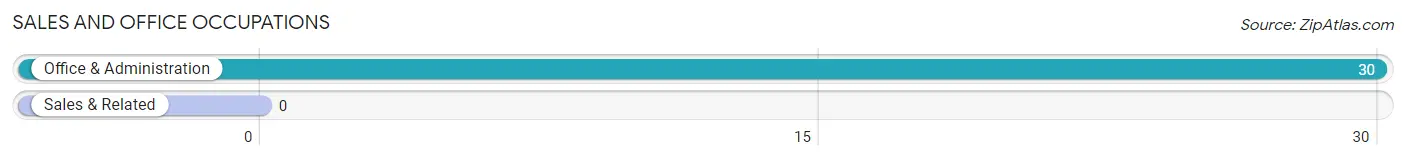
Sales and Office Occupations by Sex
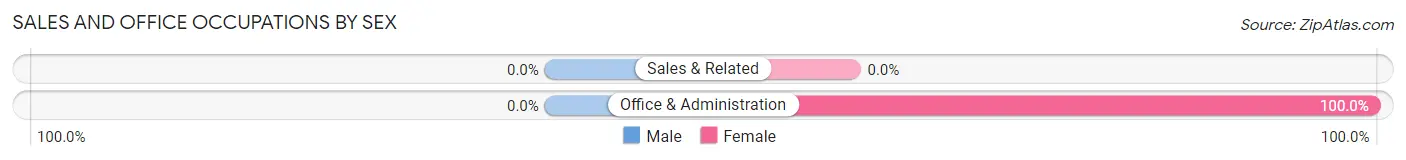
| Occupation | Male | Female |
| Sales & Related | 0 (0.0%) | 0 (0.0%) |
| Office & Administration | 0 (0.0%) | 30 (100.0%) |
| Total (Category) | 0 (0.0%) | 30 (100.0%) |
| Total (Overall) | 32 (37.7%) | 53 (62.4%) |
Natural Resources, Construction and Maintenance Occupations
The most common Natural Resources, Construction and Maintenance occupations in Lake Tomahawk are Installation, Maintenance & Repair (12 | 14.1%), and Construction & Extraction (2 | 2.4%).
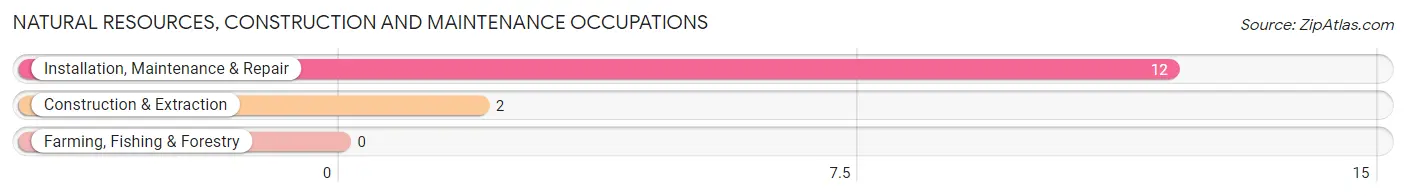
Natural Resources, Construction and Maintenance Occupations by Sex
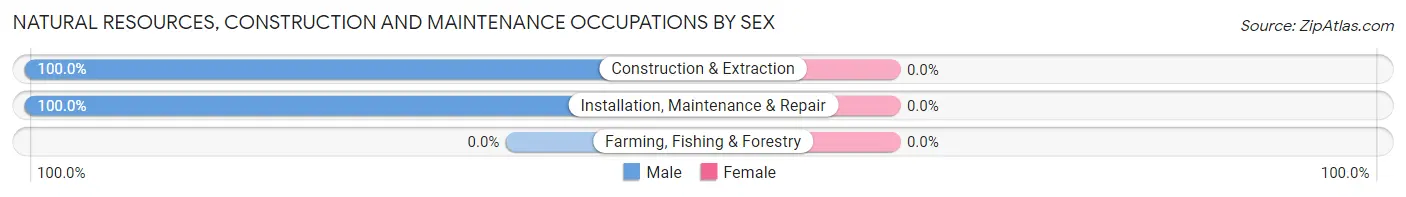
| Occupation | Male | Female |
| Farming, Fishing & Forestry | 0 (0.0%) | 0 (0.0%) |
| Construction & Extraction | 2 (100.0%) | 0 (0.0%) |
| Installation, Maintenance & Repair | 12 (100.0%) | 0 (0.0%) |
| Total (Category) | 14 (100.0%) | 0 (0.0%) |
| Total (Overall) | 32 (37.7%) | 53 (62.4%) |
Production, Transportation and Moving Occupations
The most common Production, Transportation and Moving occupations in Lake Tomahawk are , and Transportation (6 | 7.1%).
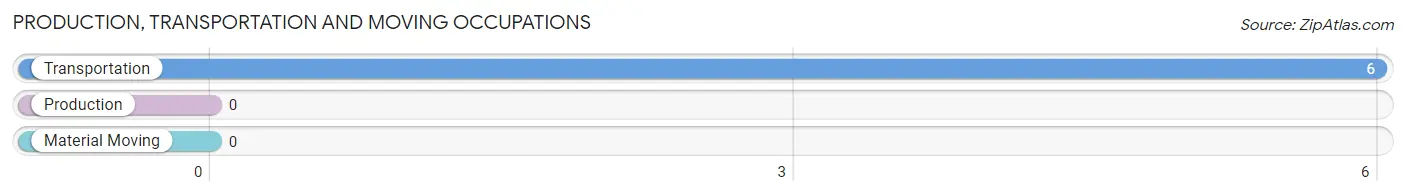
Production, Transportation and Moving Occupations by Sex
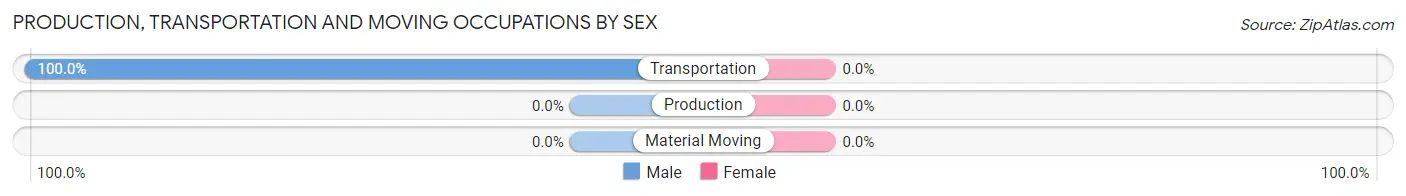
| Occupation | Male | Female |
| Production | 0 (0.0%) | 0 (0.0%) |
| Transportation | 6 (100.0%) | 0 (0.0%) |
| Material Moving | 0 (0.0%) | 0 (0.0%) |
| Total (Category) | 6 (100.0%) | 0 (0.0%) |
| Total (Overall) | 32 (37.7%) | 53 (62.4%) |
Employment Industries by Sex in Lake Tomahawk
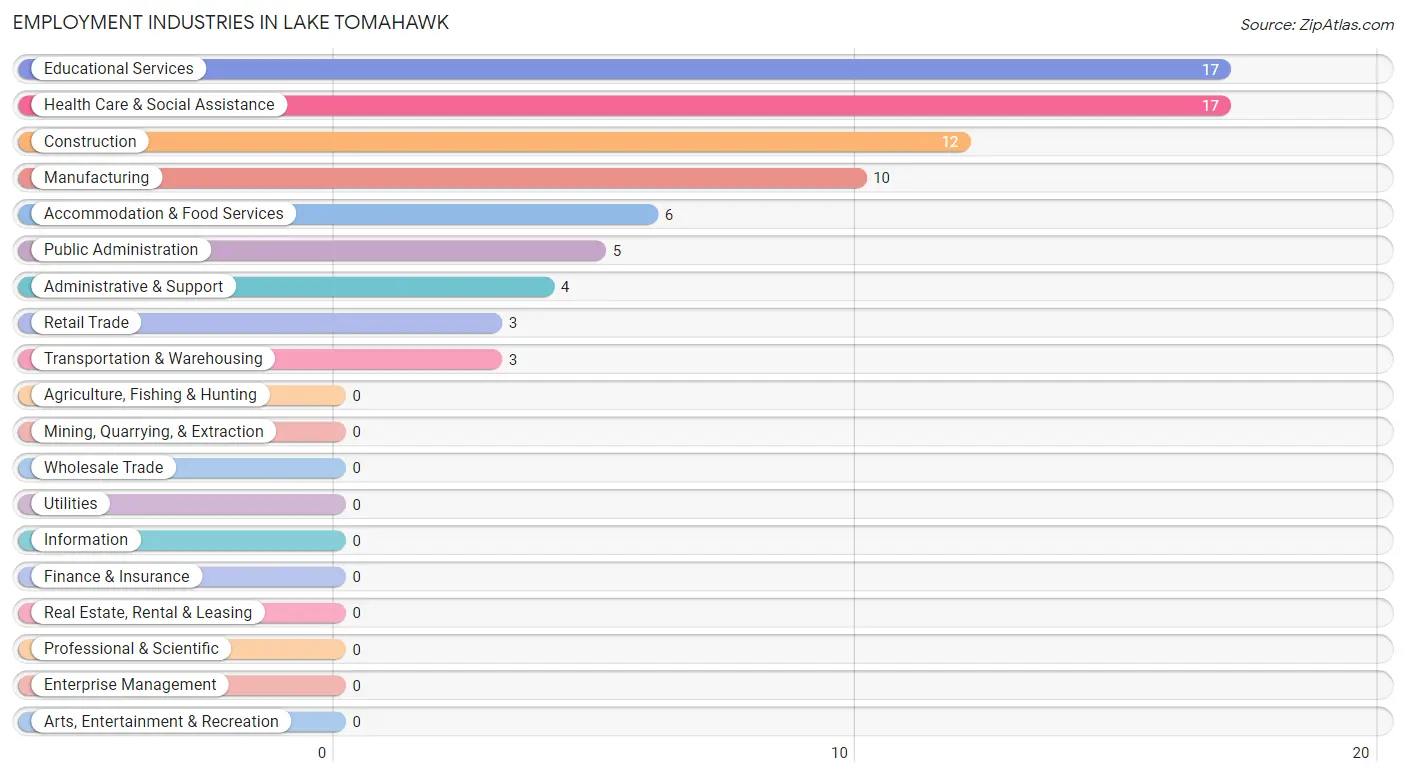
Employment Industries in Lake Tomahawk
The major employment industries in Lake Tomahawk include Educational Services (17 | 20.0%), Health Care & Social Assistance (17 | 20.0%), Construction (12 | 14.1%), Manufacturing (10 | 11.8%), and Accommodation & Food Services (6 | 7.1%).
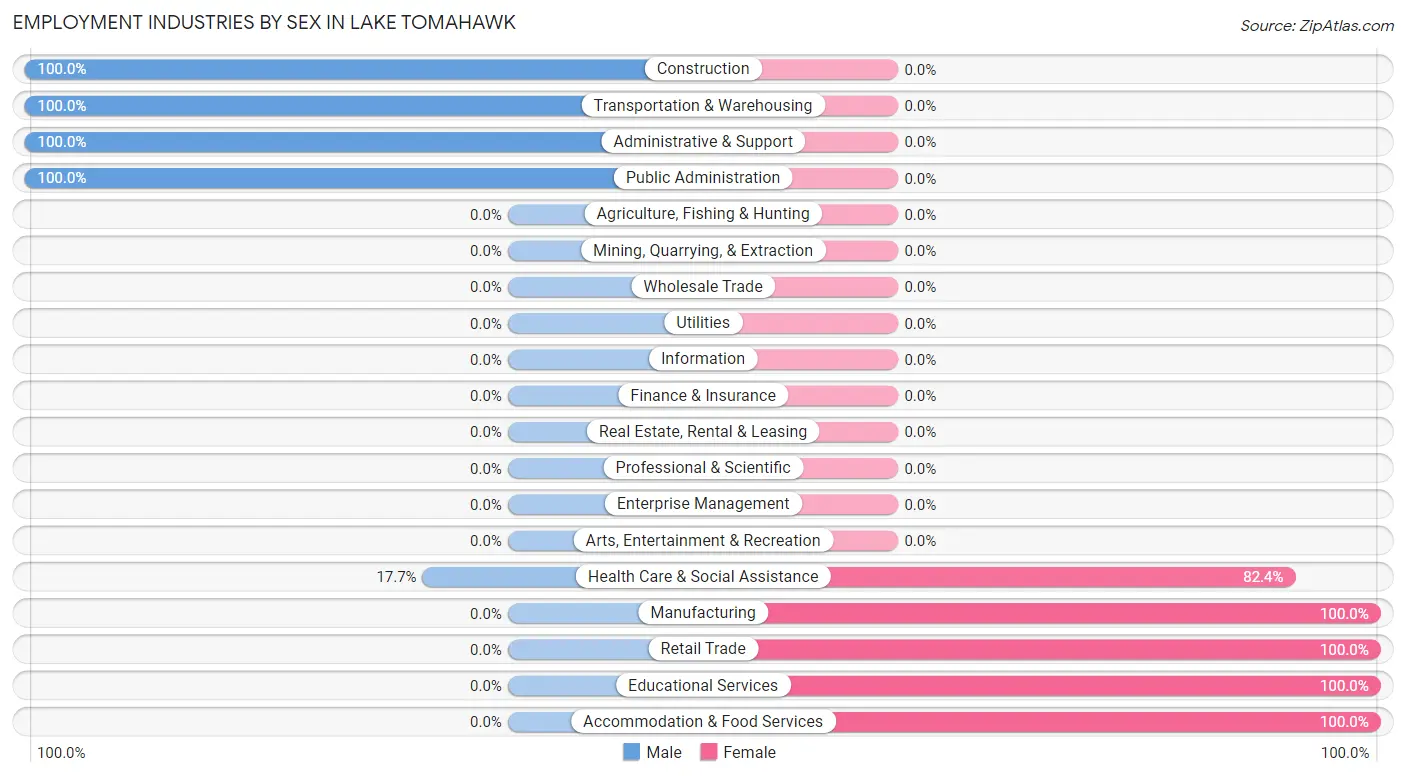
Employment Industries by Sex in Lake Tomahawk
The Lake Tomahawk industries that see more men than women are Construction (100.0%), Transportation & Warehousing (100.0%), and Administrative & Support (100.0%), whereas the industries that tend to have a higher number of women are Manufacturing (100.0%), Retail Trade (100.0%), and Educational Services (100.0%).
| Industry | Male | Female |
| Agriculture, Fishing & Hunting | 0 (0.0%) | 0 (0.0%) |
| Mining, Quarrying, & Extraction | 0 (0.0%) | 0 (0.0%) |
| Construction | 12 (100.0%) | 0 (0.0%) |
| Manufacturing | 0 (0.0%) | 10 (100.0%) |
| Wholesale Trade | 0 (0.0%) | 0 (0.0%) |
| Retail Trade | 0 (0.0%) | 3 (100.0%) |
| Transportation & Warehousing | 3 (100.0%) | 0 (0.0%) |
| Utilities | 0 (0.0%) | 0 (0.0%) |
| Information | 0 (0.0%) | 0 (0.0%) |
| Finance & Insurance | 0 (0.0%) | 0 (0.0%) |
| Real Estate, Rental & Leasing | 0 (0.0%) | 0 (0.0%) |
| Professional & Scientific | 0 (0.0%) | 0 (0.0%) |
| Enterprise Management | 0 (0.0%) | 0 (0.0%) |
| Administrative & Support | 4 (100.0%) | 0 (0.0%) |
| Educational Services | 0 (0.0%) | 17 (100.0%) |
| Health Care & Social Assistance | 3 (17.6%) | 14 (82.4%) |
| Arts, Entertainment & Recreation | 0 (0.0%) | 0 (0.0%) |
| Accommodation & Food Services | 0 (0.0%) | 6 (100.0%) |
| Public Administration | 5 (100.0%) | 0 (0.0%) |
| Total | 32 (37.7%) | 53 (62.4%) |
Education in Lake Tomahawk
School Enrollment in Lake Tomahawk
The most common levels of schooling among the 35 students in Lake Tomahawk are elementary school (18 | 51.4%), and college / undergraduate (17 | 48.6%).
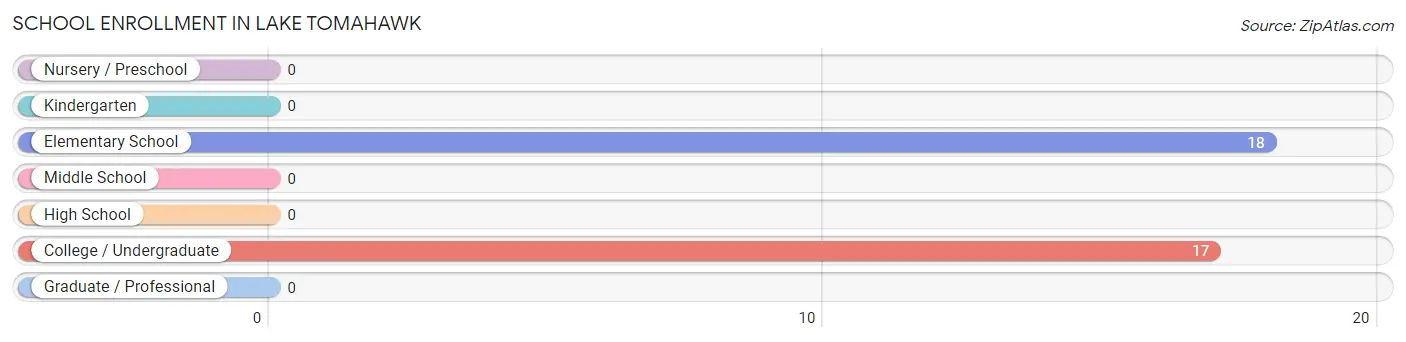
| School Level | # Students | % Students |
| Nursery / Preschool | 0 | 0.0% |
| Kindergarten | 0 | 0.0% |
| Elementary School | 18 | 51.4% |
| Middle School | 0 | 0.0% |
| High School | 0 | 0.0% |
| College / Undergraduate | 17 | 48.6% |
| Graduate / Professional | 0 | 0.0% |
| Total | 35 | 100.0% |
School Enrollment by Age by Funding Source in Lake Tomahawk
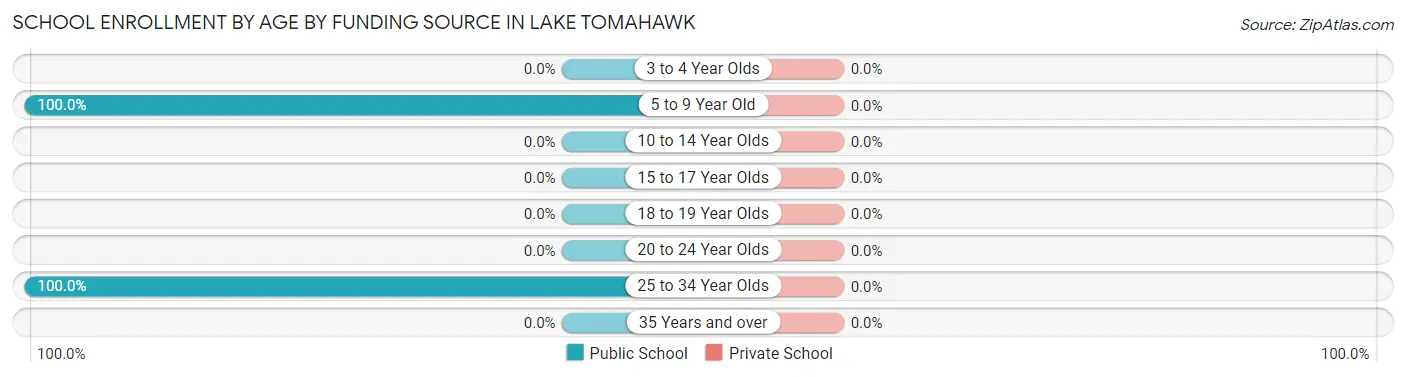
| Age Bracket | Public School | Private School |
| 3 to 4 Year Olds | 0 (0.0%) | 0 (0.0%) |
| 5 to 9 Year Old | 18 (100.0%) | 0 (0.0%) |
| 10 to 14 Year Olds | 0 (0.0%) | 0 (0.0%) |
| 15 to 17 Year Olds | 0 (0.0%) | 0 (0.0%) |
| 18 to 19 Year Olds | 0 (0.0%) | 0 (0.0%) |
| 20 to 24 Year Olds | 0 (0.0%) | 0 (0.0%) |
| 25 to 34 Year Olds | 17 (100.0%) | 0 (0.0%) |
| 35 Years and over | 0 (0.0%) | 0 (0.0%) |
| Total | 35 (100.0%) | 0 (0.0%) |
Educational Attainment by Field of Study in Lake Tomahawk
Science & technology (9 | 29.0%), business (9 | 29.0%), social sciences (5 | 16.1%), arts & humanities (5 | 16.1%), and psychology (3 | 9.7%) are the most common fields of study among 31 individuals in Lake Tomahawk who have obtained a bachelor's degree or higher.
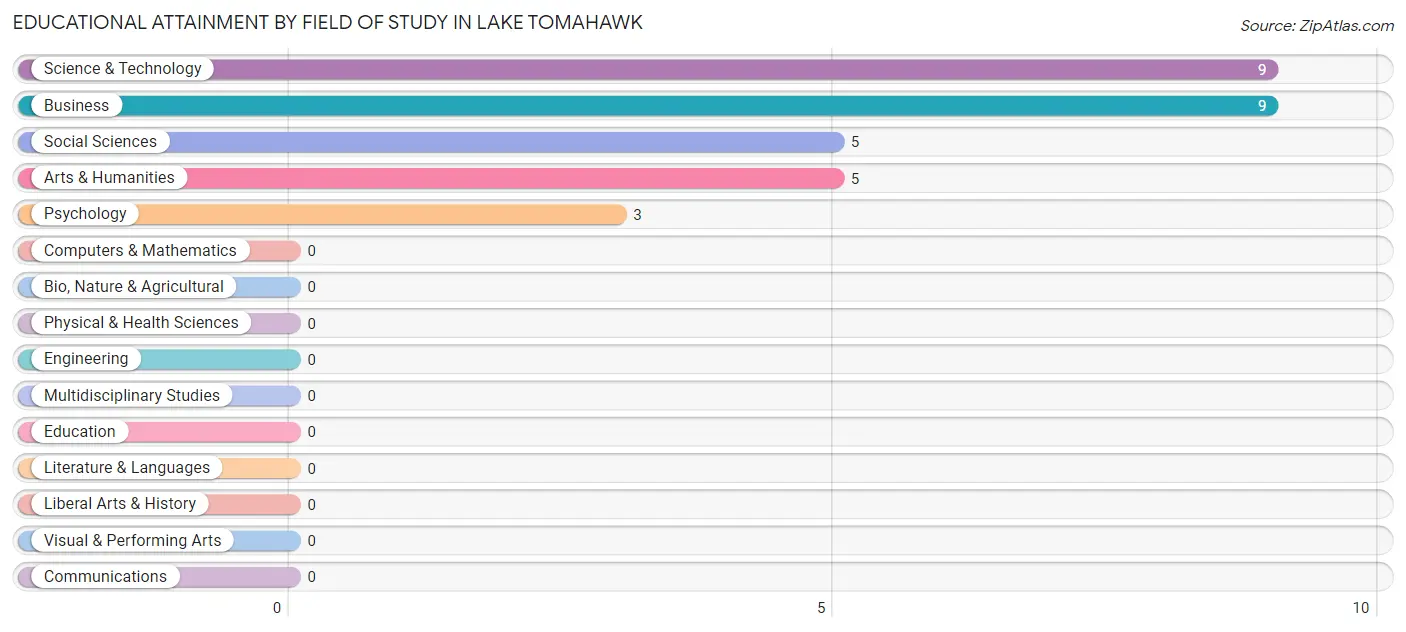
| Field of Study | # Graduates | % Graduates |
| Computers & Mathematics | 0 | 0.0% |
| Bio, Nature & Agricultural | 0 | 0.0% |
| Physical & Health Sciences | 0 | 0.0% |
| Psychology | 3 | 9.7% |
| Social Sciences | 5 | 16.1% |
| Engineering | 0 | 0.0% |
| Multidisciplinary Studies | 0 | 0.0% |
| Science & Technology | 9 | 29.0% |
| Business | 9 | 29.0% |
| Education | 0 | 0.0% |
| Literature & Languages | 0 | 0.0% |
| Liberal Arts & History | 0 | 0.0% |
| Visual & Performing Arts | 0 | 0.0% |
| Communications | 0 | 0.0% |
| Arts & Humanities | 5 | 16.1% |
| Total | 31 | 100.0% |
Transportation & Commute in Lake Tomahawk
Vehicle Availability by Sex in Lake Tomahawk
The most prevalent vehicle ownership categories in Lake Tomahawk are males with 2 vehicles (28, accounting for 87.5%) and females with 2 vehicles (40, making up 52.8%).
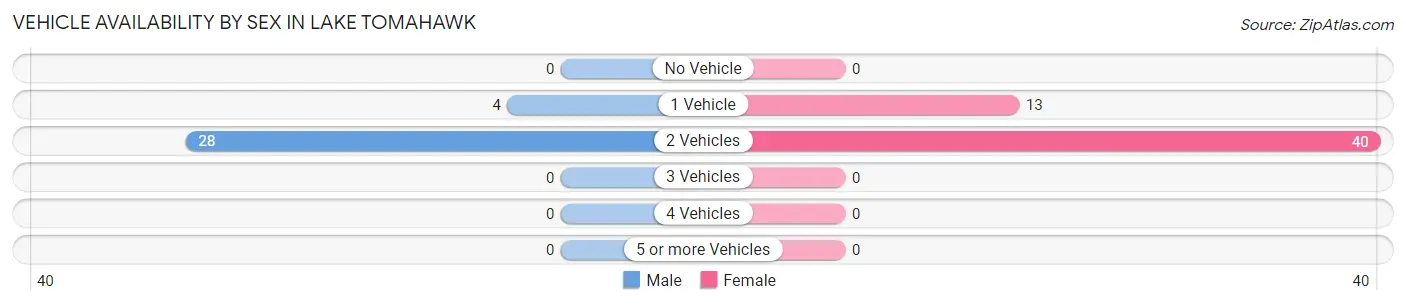
| Vehicles Available | Male | Female |
| No Vehicle | 0 (0.0%) | 0 (0.0%) |
| 1 Vehicle | 4 (12.5%) | 13 (24.5%) |
| 2 Vehicles | 28 (87.5%) | 40 (75.5%) |
| 3 Vehicles | 0 (0.0%) | 0 (0.0%) |
| 4 Vehicles | 0 (0.0%) | 0 (0.0%) |
| 5 or more Vehicles | 0 (0.0%) | 0 (0.0%) |
| Total | 32 (100.0%) | 53 (100.0%) |
Commute Time in Lake Tomahawk
The most frequently occuring commute durations in Lake Tomahawk are 20 to 24 minutes (23 commuters, 28.1%), 10 to 14 minutes (20 commuters, 24.4%), and 15 to 19 minutes (19 commuters, 23.2%).
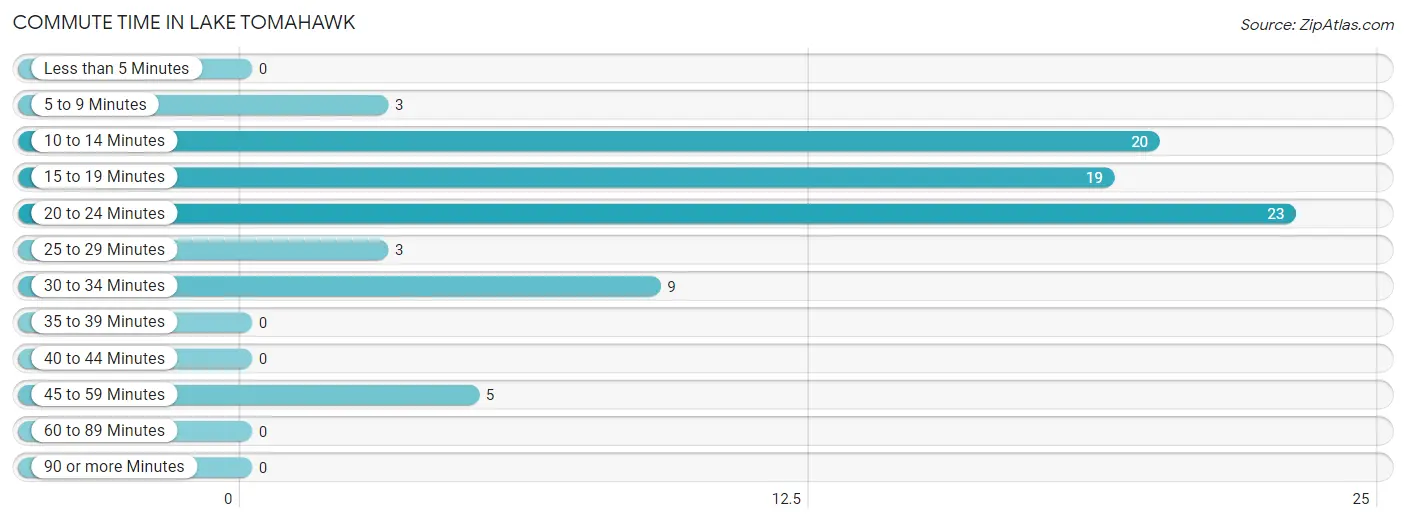
| Commute Time | # Commuters | % Commuters |
| Less than 5 Minutes | 0 | 0.0% |
| 5 to 9 Minutes | 3 | 3.7% |
| 10 to 14 Minutes | 20 | 24.4% |
| 15 to 19 Minutes | 19 | 23.2% |
| 20 to 24 Minutes | 23 | 28.1% |
| 25 to 29 Minutes | 3 | 3.7% |
| 30 to 34 Minutes | 9 | 11.0% |
| 35 to 39 Minutes | 0 | 0.0% |
| 40 to 44 Minutes | 0 | 0.0% |
| 45 to 59 Minutes | 5 | 6.1% |
| 60 to 89 Minutes | 0 | 0.0% |
| 90 or more Minutes | 0 | 0.0% |
Commute Time by Sex in Lake Tomahawk
The most common commute times in Lake Tomahawk are 20 to 24 minutes (9 commuters, 28.1%) for males and 10 to 14 minutes (17 commuters, 34.0%) for females.
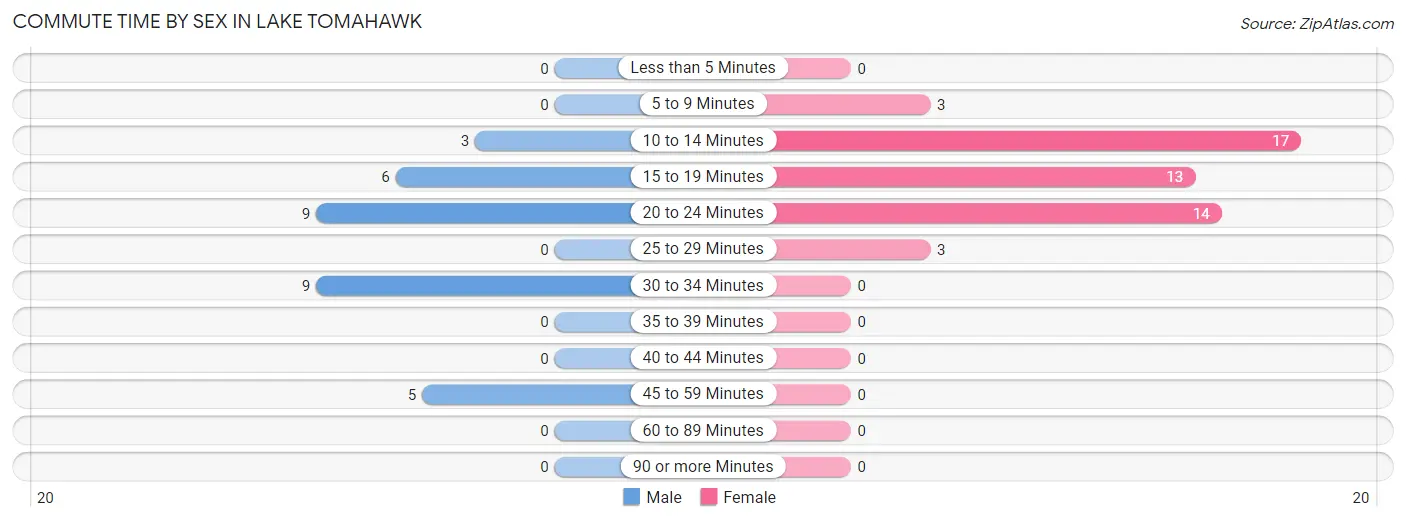
| Commute Time | Male | Female |
| Less than 5 Minutes | 0 (0.0%) | 0 (0.0%) |
| 5 to 9 Minutes | 0 (0.0%) | 3 (6.0%) |
| 10 to 14 Minutes | 3 (9.4%) | 17 (34.0%) |
| 15 to 19 Minutes | 6 (18.8%) | 13 (26.0%) |
| 20 to 24 Minutes | 9 (28.1%) | 14 (28.0%) |
| 25 to 29 Minutes | 0 (0.0%) | 3 (6.0%) |
| 30 to 34 Minutes | 9 (28.1%) | 0 (0.0%) |
| 35 to 39 Minutes | 0 (0.0%) | 0 (0.0%) |
| 40 to 44 Minutes | 0 (0.0%) | 0 (0.0%) |
| 45 to 59 Minutes | 5 (15.6%) | 0 (0.0%) |
| 60 to 89 Minutes | 0 (0.0%) | 0 (0.0%) |
| 90 or more Minutes | 0 (0.0%) | 0 (0.0%) |
Time of Departure to Work by Sex in Lake Tomahawk
The most frequent times of departure to work in Lake Tomahawk are 6:00 AM to 6:29 AM (10, 31.2%) for males and 8:00 AM to 8:29 AM (17, 34.0%) for females.
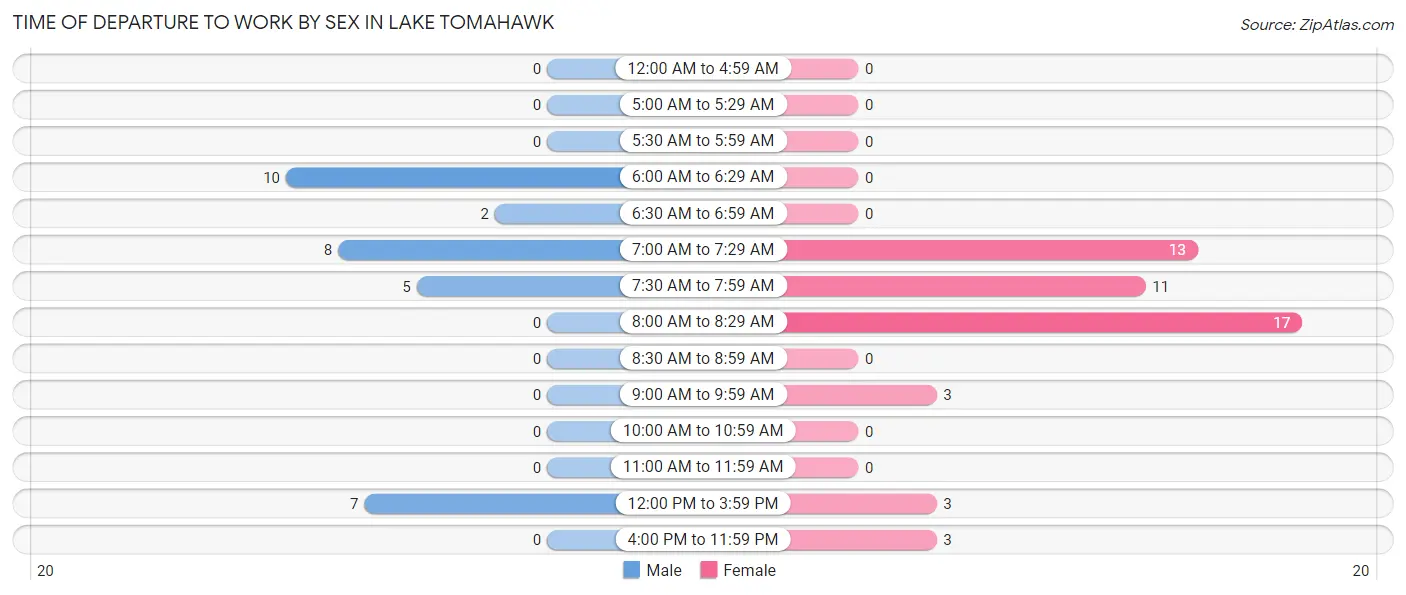
| Time of Departure | Male | Female |
| 12:00 AM to 4:59 AM | 0 (0.0%) | 0 (0.0%) |
| 5:00 AM to 5:29 AM | 0 (0.0%) | 0 (0.0%) |
| 5:30 AM to 5:59 AM | 0 (0.0%) | 0 (0.0%) |
| 6:00 AM to 6:29 AM | 10 (31.2%) | 0 (0.0%) |
| 6:30 AM to 6:59 AM | 2 (6.2%) | 0 (0.0%) |
| 7:00 AM to 7:29 AM | 8 (25.0%) | 13 (26.0%) |
| 7:30 AM to 7:59 AM | 5 (15.6%) | 11 (22.0%) |
| 8:00 AM to 8:29 AM | 0 (0.0%) | 17 (34.0%) |
| 8:30 AM to 8:59 AM | 0 (0.0%) | 0 (0.0%) |
| 9:00 AM to 9:59 AM | 0 (0.0%) | 3 (6.0%) |
| 10:00 AM to 10:59 AM | 0 (0.0%) | 0 (0.0%) |
| 11:00 AM to 11:59 AM | 0 (0.0%) | 0 (0.0%) |
| 12:00 PM to 3:59 PM | 7 (21.9%) | 3 (6.0%) |
| 4:00 PM to 11:59 PM | 0 (0.0%) | 3 (6.0%) |
| Total | 32 (100.0%) | 50 (100.0%) |
Housing Occupancy in Lake Tomahawk
Occupancy by Ownership in Lake Tomahawk
Of the total 90 dwellings in Lake Tomahawk, owner-occupied units account for 60 (66.7%), while renter-occupied units make up 30 (33.3%).
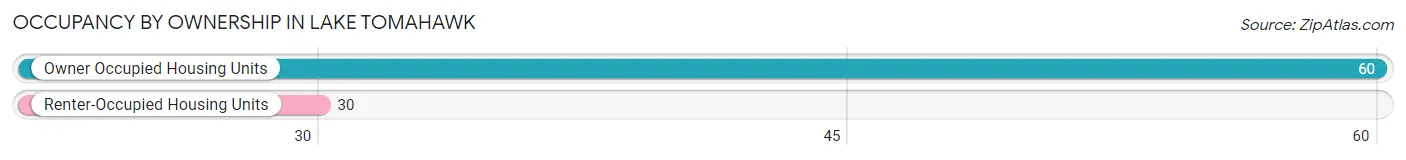
| Occupancy | # Housing Units | % Housing Units |
| Owner Occupied Housing Units | 60 | 66.7% |
| Renter-Occupied Housing Units | 30 | 33.3% |
| Total Occupied Housing Units | 90 | 100.0% |
Occupancy by Household Size in Lake Tomahawk
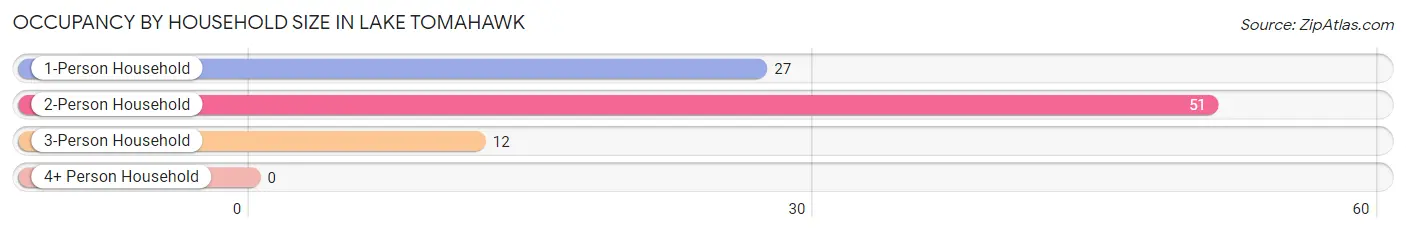
| Household Size | # Housing Units | % Housing Units |
| 1-Person Household | 27 | 30.0% |
| 2-Person Household | 51 | 56.7% |
| 3-Person Household | 12 | 13.3% |
| 4+ Person Household | 0 | 0.0% |
| Total Housing Units | 90 | 100.0% |
Occupancy by Ownership by Household Size in Lake Tomahawk
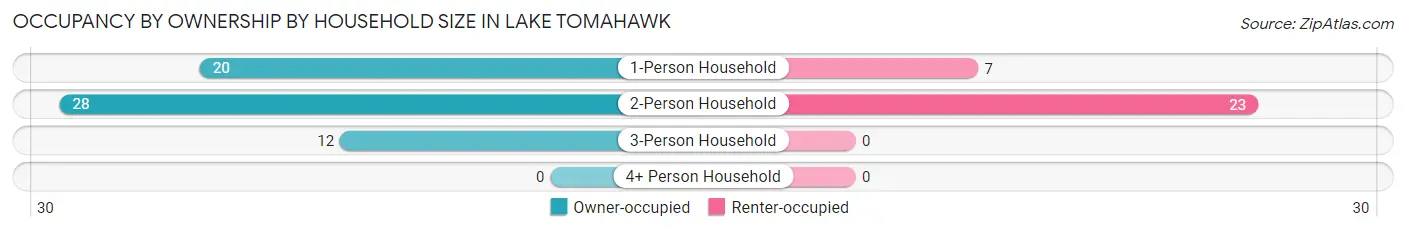
| Household Size | Owner-occupied | Renter-occupied |
| 1-Person Household | 20 (74.1%) | 7 (25.9%) |
| 2-Person Household | 28 (54.9%) | 23 (45.1%) |
| 3-Person Household | 12 (100.0%) | 0 (0.0%) |
| 4+ Person Household | 0 (0.0%) | 0 (0.0%) |
| Total Housing Units | 60 (66.7%) | 30 (33.3%) |
Occupancy by Educational Attainment in Lake Tomahawk
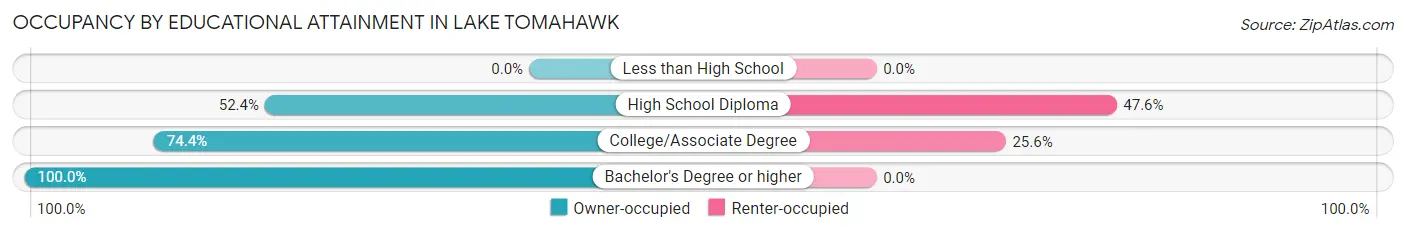
| Household Size | Owner-occupied | Renter-occupied |
| Less than High School | 0 (0.0%) | 0 (0.0%) |
| High School Diploma | 22 (52.4%) | 20 (47.6%) |
| College/Associate Degree | 29 (74.4%) | 10 (25.6%) |
| Bachelor's Degree or higher | 9 (100.0%) | 0 (0.0%) |
Occupancy by Age of Householder in Lake Tomahawk
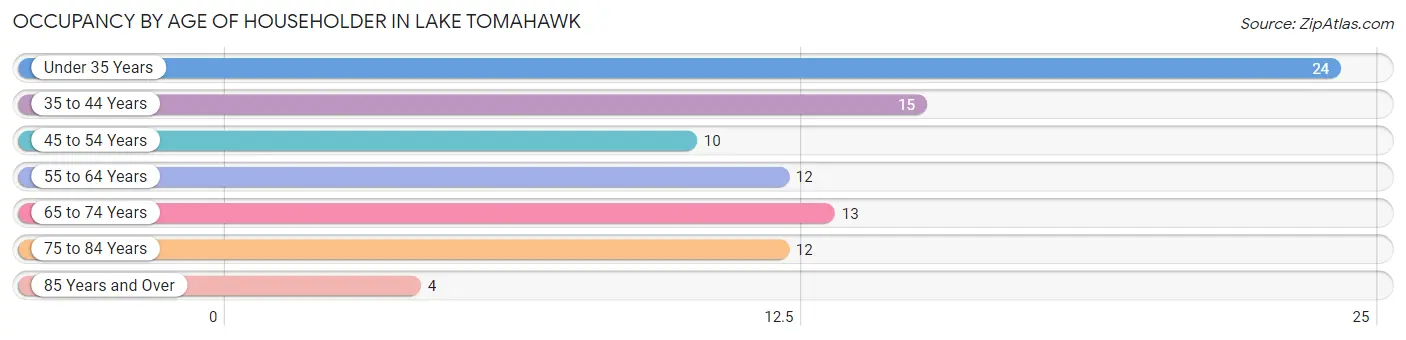
| Age Bracket | # Households | % Households |
| Under 35 Years | 24 | 26.7% |
| 35 to 44 Years | 15 | 16.7% |
| 45 to 54 Years | 10 | 11.1% |
| 55 to 64 Years | 12 | 13.3% |
| 65 to 74 Years | 13 | 14.4% |
| 75 to 84 Years | 12 | 13.3% |
| 85 Years and Over | 4 | 4.4% |
| Total | 90 | 100.0% |
Housing Finances in Lake Tomahawk
Median Income by Occupancy in Lake Tomahawk
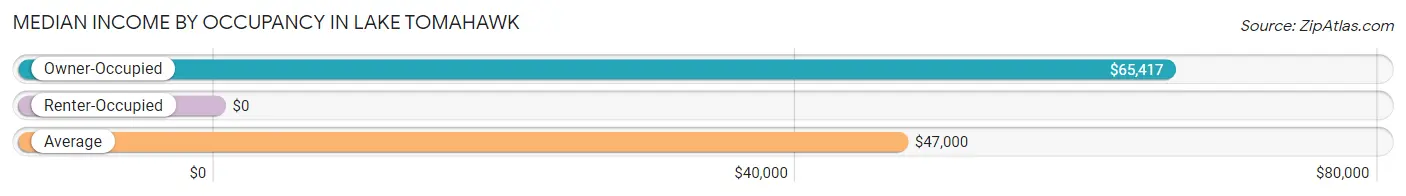
| Occupancy Type | # Households | Median Income |
| Owner-Occupied | 60 (66.7%) | $65,417 |
| Renter-Occupied | 30 (33.3%) | $0 |
| Average | 90 (100.0%) | $47,000 |
Occupancy by Householder Income Bracket in Lake Tomahawk
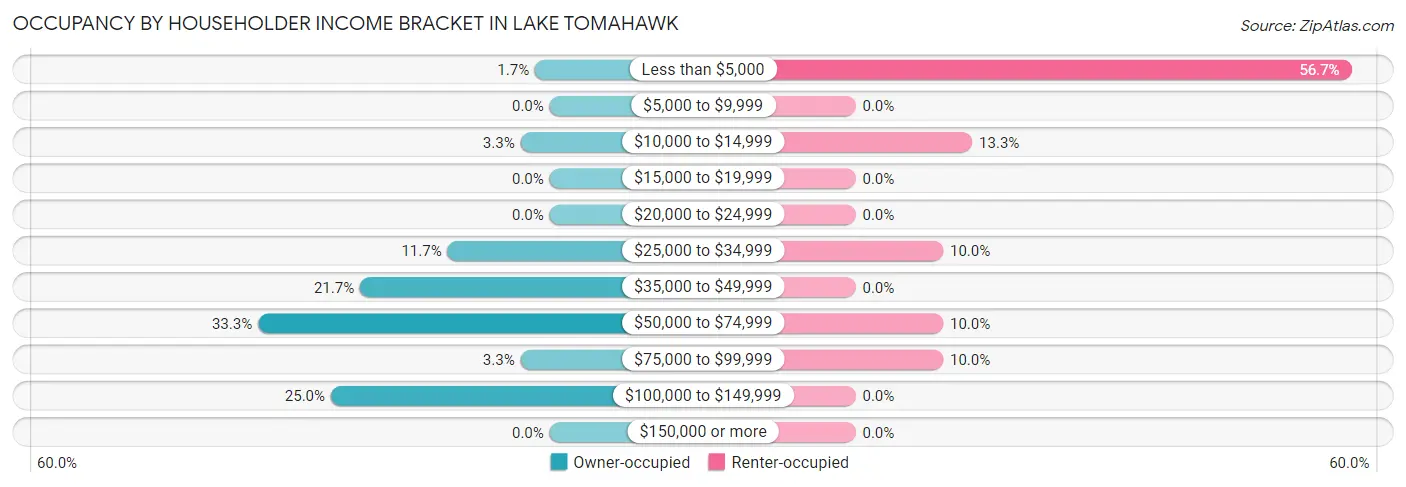
| Income Bracket | Owner-occupied | Renter-occupied |
| Less than $5,000 | 1 (1.7%) | 17 (56.7%) |
| $5,000 to $9,999 | 0 (0.0%) | 0 (0.0%) |
| $10,000 to $14,999 | 2 (3.3%) | 4 (13.3%) |
| $15,000 to $19,999 | 0 (0.0%) | 0 (0.0%) |
| $20,000 to $24,999 | 0 (0.0%) | 0 (0.0%) |
| $25,000 to $34,999 | 7 (11.7%) | 3 (10.0%) |
| $35,000 to $49,999 | 13 (21.7%) | 0 (0.0%) |
| $50,000 to $74,999 | 20 (33.3%) | 3 (10.0%) |
| $75,000 to $99,999 | 2 (3.3%) | 3 (10.0%) |
| $100,000 to $149,999 | 15 (25.0%) | 0 (0.0%) |
| $150,000 or more | 0 (0.0%) | 0 (0.0%) |
| Total | 60 (100.0%) | 30 (100.0%) |
Monthly Housing Cost Tiers in Lake Tomahawk
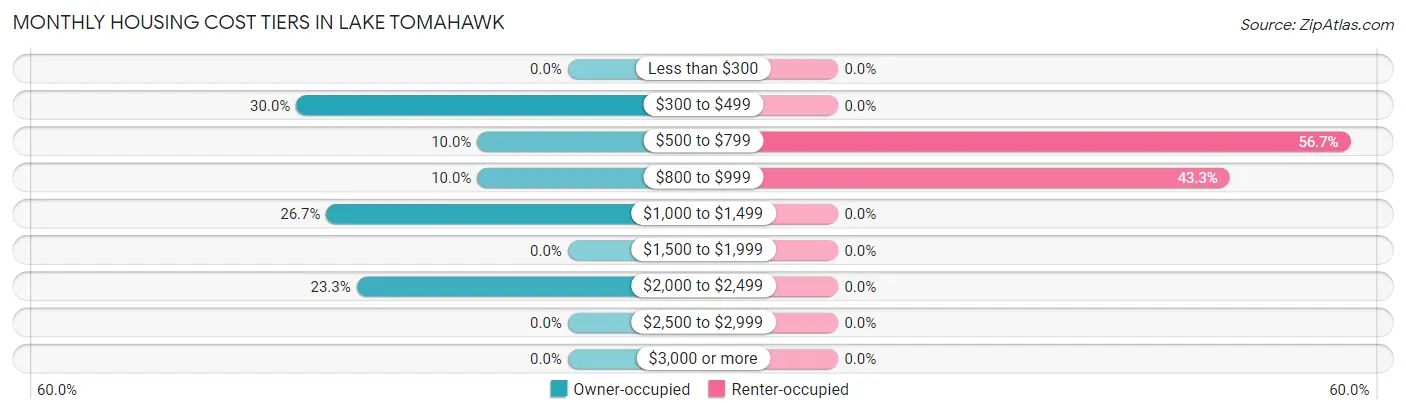
| Monthly Cost | Owner-occupied | Renter-occupied |
| Less than $300 | 0 (0.0%) | 0 (0.0%) |
| $300 to $499 | 18 (30.0%) | 0 (0.0%) |
| $500 to $799 | 6 (10.0%) | 17 (56.7%) |
| $800 to $999 | 6 (10.0%) | 13 (43.3%) |
| $1,000 to $1,499 | 16 (26.7%) | 0 (0.0%) |
| $1,500 to $1,999 | 0 (0.0%) | 0 (0.0%) |
| $2,000 to $2,499 | 14 (23.3%) | 0 (0.0%) |
| $2,500 to $2,999 | 0 (0.0%) | 0 (0.0%) |
| $3,000 or more | 0 (0.0%) | 0 (0.0%) |
| Total | 60 (100.0%) | 30 (100.0%) |
Physical Housing Characteristics in Lake Tomahawk
Housing Structures in Lake Tomahawk
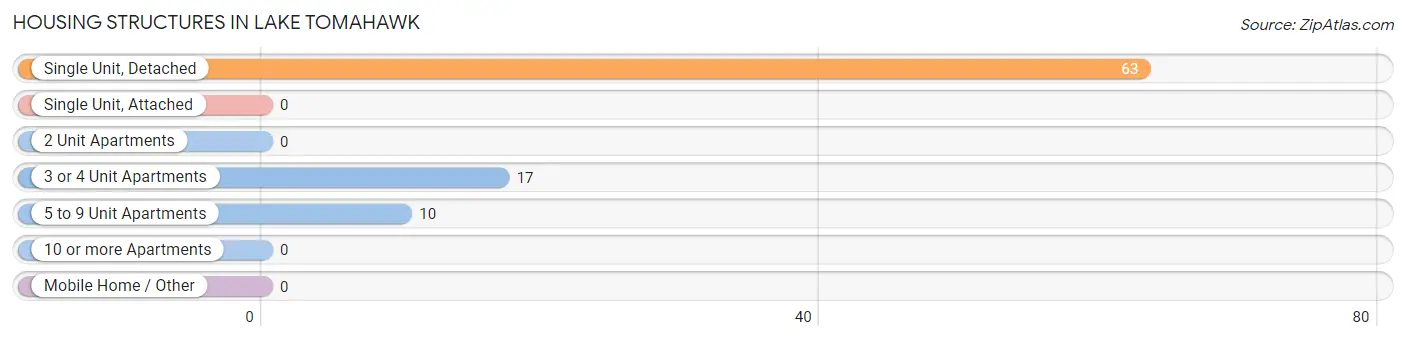
| Structure Type | # Housing Units | % Housing Units |
| Single Unit, Detached | 63 | 70.0% |
| Single Unit, Attached | 0 | 0.0% |
| 2 Unit Apartments | 0 | 0.0% |
| 3 or 4 Unit Apartments | 17 | 18.9% |
| 5 to 9 Unit Apartments | 10 | 11.1% |
| 10 or more Apartments | 0 | 0.0% |
| Mobile Home / Other | 0 | 0.0% |
| Total | 90 | 100.0% |
Housing Structures by Occupancy in Lake Tomahawk
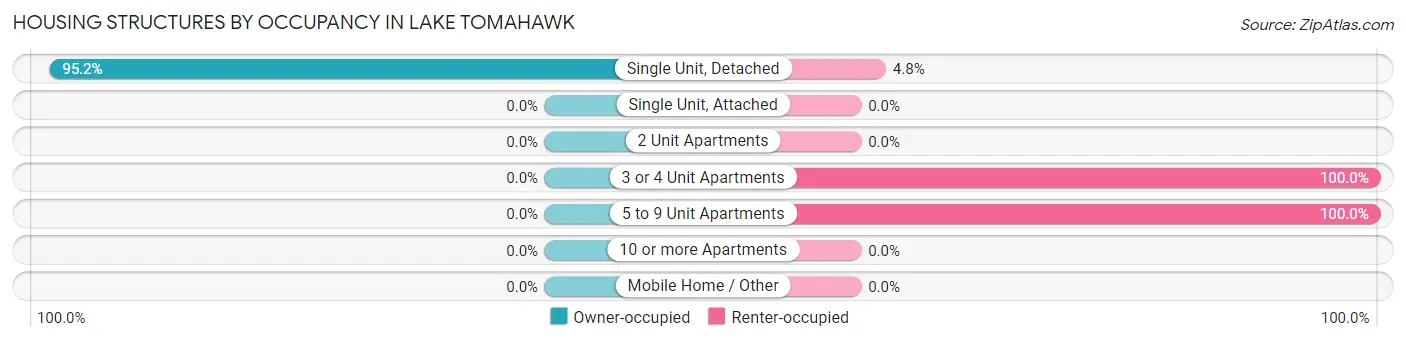
| Structure Type | Owner-occupied | Renter-occupied |
| Single Unit, Detached | 60 (95.2%) | 3 (4.8%) |
| Single Unit, Attached | 0 (0.0%) | 0 (0.0%) |
| 2 Unit Apartments | 0 (0.0%) | 0 (0.0%) |
| 3 or 4 Unit Apartments | 0 (0.0%) | 17 (100.0%) |
| 5 to 9 Unit Apartments | 0 (0.0%) | 10 (100.0%) |
| 10 or more Apartments | 0 (0.0%) | 0 (0.0%) |
| Mobile Home / Other | 0 (0.0%) | 0 (0.0%) |
| Total | 60 (66.7%) | 30 (33.3%) |
Housing Structures by Number of Rooms in Lake Tomahawk
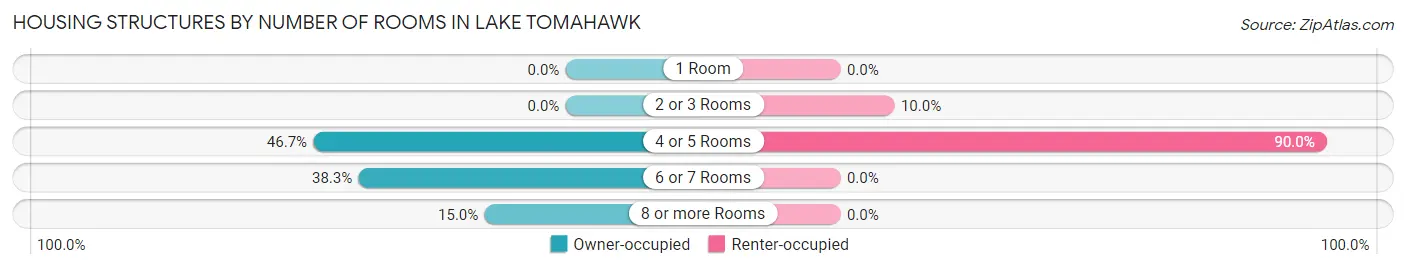
| Number of Rooms | Owner-occupied | Renter-occupied |
| 1 Room | 0 (0.0%) | 0 (0.0%) |
| 2 or 3 Rooms | 0 (0.0%) | 3 (10.0%) |
| 4 or 5 Rooms | 28 (46.7%) | 27 (90.0%) |
| 6 or 7 Rooms | 23 (38.3%) | 0 (0.0%) |
| 8 or more Rooms | 9 (15.0%) | 0 (0.0%) |
| Total | 60 (100.0%) | 30 (100.0%) |
Housing Structure by Heating Type in Lake Tomahawk
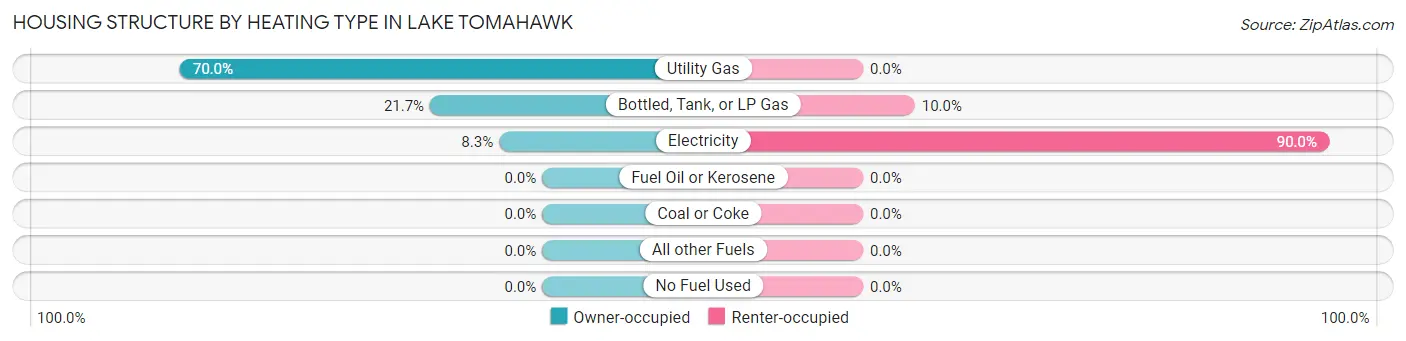
| Heating Type | Owner-occupied | Renter-occupied |
| Utility Gas | 42 (70.0%) | 0 (0.0%) |
| Bottled, Tank, or LP Gas | 13 (21.7%) | 3 (10.0%) |
| Electricity | 5 (8.3%) | 27 (90.0%) |
| Fuel Oil or Kerosene | 0 (0.0%) | 0 (0.0%) |
| Coal or Coke | 0 (0.0%) | 0 (0.0%) |
| All other Fuels | 0 (0.0%) | 0 (0.0%) |
| No Fuel Used | 0 (0.0%) | 0 (0.0%) |
| Total | 60 (100.0%) | 30 (100.0%) |
Household Vehicle Usage in Lake Tomahawk
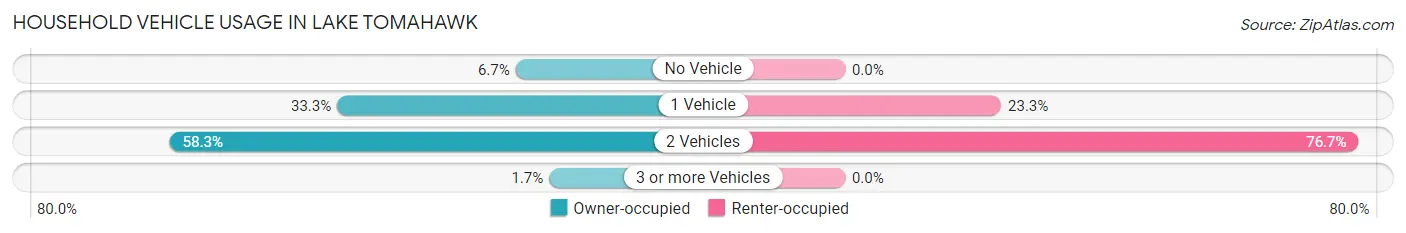
| Vehicles per Household | Owner-occupied | Renter-occupied |
| No Vehicle | 4 (6.7%) | 0 (0.0%) |
| 1 Vehicle | 20 (33.3%) | 7 (23.3%) |
| 2 Vehicles | 35 (58.3%) | 23 (76.7%) |
| 3 or more Vehicles | 1 (1.7%) | 0 (0.0%) |
| Total | 60 (100.0%) | 30 (100.0%) |
Real Estate & Mortgages in Lake Tomahawk
Real Estate and Mortgage Overview in Lake Tomahawk
| Characteristic | Without Mortgage | With Mortgage |
| Housing Units | 18 | 42 |
| Median Property Value | $207,100 | $179,500 |
| Median Household Income | $66,667 | $0 |
| Monthly Housing Costs | $440 | $0 |
| Real Estate Taxes | $1,929 | $0 |
Property Value by Mortgage Status in Lake Tomahawk
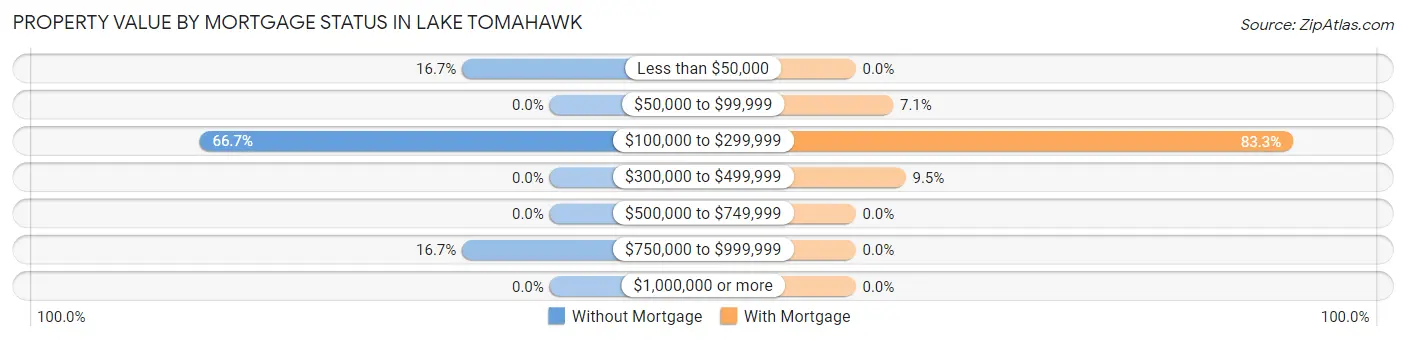
| Property Value | Without Mortgage | With Mortgage |
| Less than $50,000 | 3 (16.7%) | 0 (0.0%) |
| $50,000 to $99,999 | 0 (0.0%) | 3 (7.1%) |
| $100,000 to $299,999 | 12 (66.7%) | 35 (83.3%) |
| $300,000 to $499,999 | 0 (0.0%) | 4 (9.5%) |
| $500,000 to $749,999 | 0 (0.0%) | 0 (0.0%) |
| $750,000 to $999,999 | 3 (16.7%) | 0 (0.0%) |
| $1,000,000 or more | 0 (0.0%) | 0 (0.0%) |
| Total | 18 (100.0%) | 42 (100.0%) |
Household Income by Mortgage Status in Lake Tomahawk
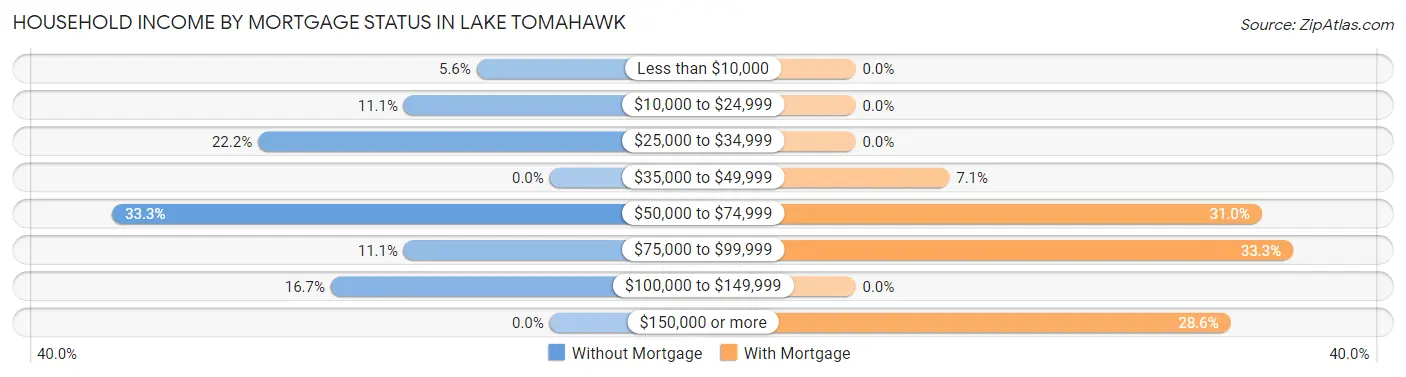
| Household Income | Without Mortgage | With Mortgage |
| Less than $10,000 | 1 (5.6%) | 0 (0.0%) |
| $10,000 to $24,999 | 2 (11.1%) | 0 (0.0%) |
| $25,000 to $34,999 | 4 (22.2%) | 0 (0.0%) |
| $35,000 to $49,999 | 0 (0.0%) | 3 (7.1%) |
| $50,000 to $74,999 | 6 (33.3%) | 13 (30.9%) |
| $75,000 to $99,999 | 2 (11.1%) | 14 (33.3%) |
| $100,000 to $149,999 | 3 (16.7%) | 0 (0.0%) |
| $150,000 or more | 0 (0.0%) | 12 (28.6%) |
| Total | 18 (100.0%) | 42 (100.0%) |
Property Value to Household Income Ratio in Lake Tomahawk
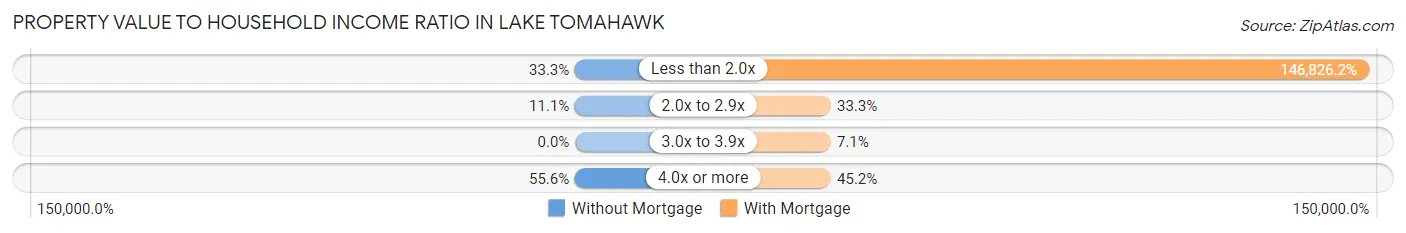
| Value-to-Income Ratio | Without Mortgage | With Mortgage |
| Less than 2.0x | 6 (33.3%) | 61,667 (146,826.2%) |
| 2.0x to 2.9x | 2 (11.1%) | 14 (33.3%) |
| 3.0x to 3.9x | 0 (0.0%) | 3 (7.1%) |
| 4.0x or more | 10 (55.6%) | 19 (45.2%) |
| Total | 18 (100.0%) | 42 (100.0%) |
Real Estate Taxes by Mortgage Status in Lake Tomahawk
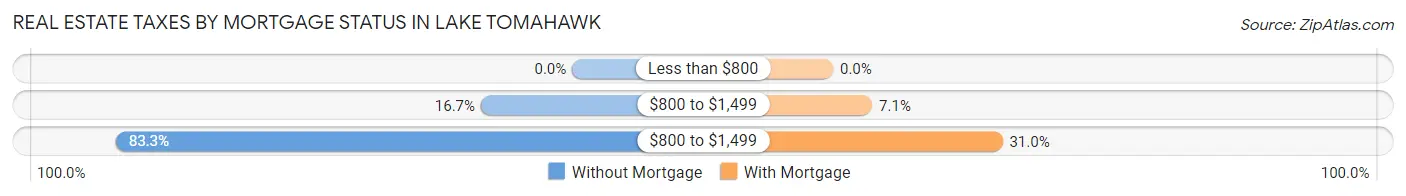
| Property Taxes | Without Mortgage | With Mortgage |
| Less than $800 | 0 (0.0%) | 0 (0.0%) |
| $800 to $1,499 | 3 (16.7%) | 3 (7.1%) |
| $800 to $1,499 | 15 (83.3%) | 13 (30.9%) |
| Total | 18 (100.0%) | 42 (100.0%) |
Health & Disability in Lake Tomahawk
Health Insurance Coverage by Age in Lake Tomahawk
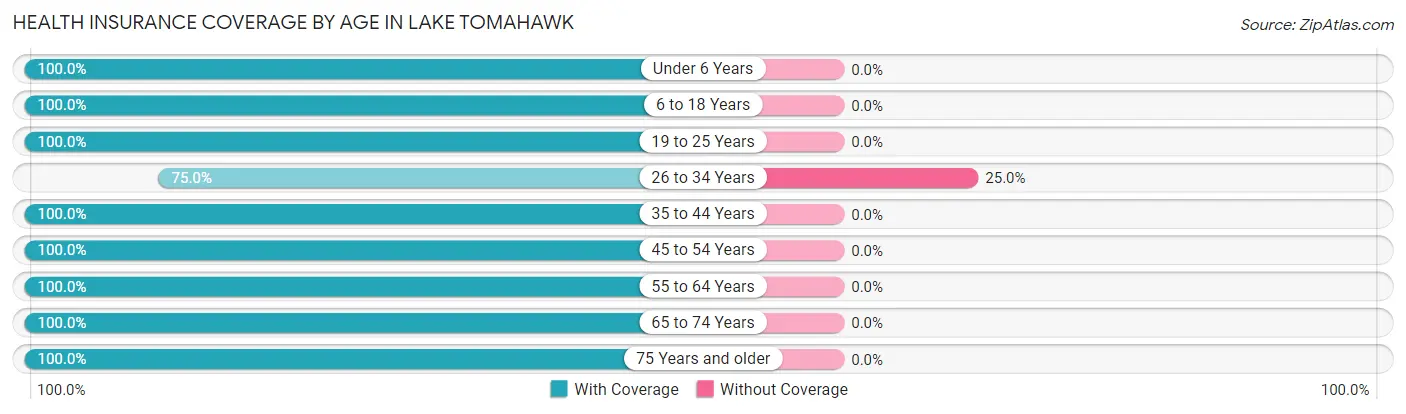
| Age Bracket | With Coverage | Without Coverage |
| Under 6 Years | 15 (100.0%) | 0 (0.0%) |
| 6 to 18 Years | 18 (100.0%) | 0 (0.0%) |
| 19 to 25 Years | 4 (100.0%) | 0 (0.0%) |
| 26 to 34 Years | 24 (75.0%) | 8 (25.0%) |
| 35 to 44 Years | 18 (100.0%) | 0 (0.0%) |
| 45 to 54 Years | 15 (100.0%) | 0 (0.0%) |
| 55 to 64 Years | 23 (100.0%) | 0 (0.0%) |
| 65 to 74 Years | 21 (100.0%) | 0 (0.0%) |
| 75 Years and older | 27 (100.0%) | 0 (0.0%) |
| Total | 165 (95.4%) | 8 (4.6%) |
Health Insurance Coverage by Citizenship Status in Lake Tomahawk
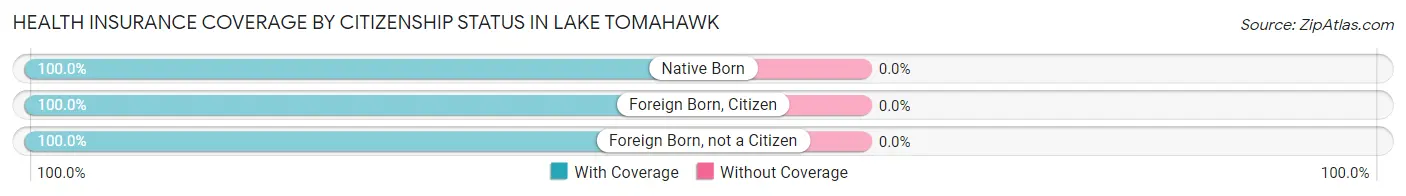
| Citizenship Status | With Coverage | Without Coverage |
| Native Born | 15 (100.0%) | 0 (0.0%) |
| Foreign Born, Citizen | 18 (100.0%) | 0 (0.0%) |
| Foreign Born, not a Citizen | 4 (100.0%) | 0 (0.0%) |
Health Insurance Coverage by Household Income in Lake Tomahawk
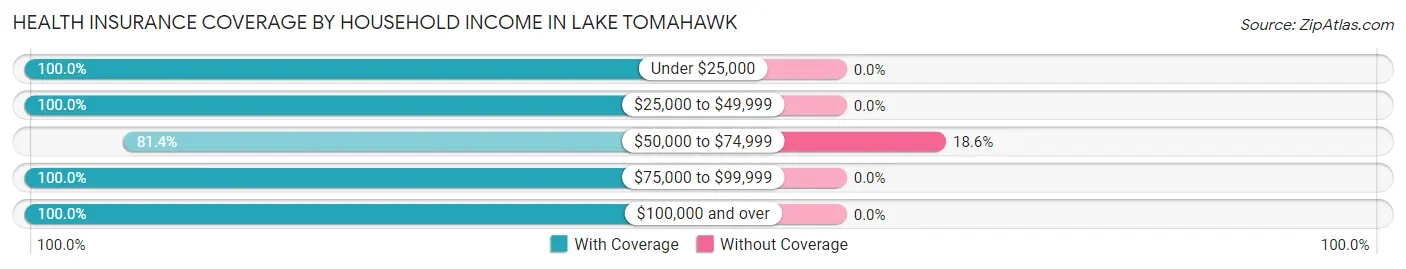
| Household Income | With Coverage | Without Coverage |
| Under $25,000 | 45 (100.0%) | 0 (0.0%) |
| $25,000 to $49,999 | 29 (100.0%) | 0 (0.0%) |
| $50,000 to $74,999 | 35 (81.4%) | 8 (18.6%) |
| $75,000 to $99,999 | 11 (100.0%) | 0 (0.0%) |
| $100,000 and over | 45 (100.0%) | 0 (0.0%) |
Public vs Private Health Insurance Coverage by Age in Lake Tomahawk
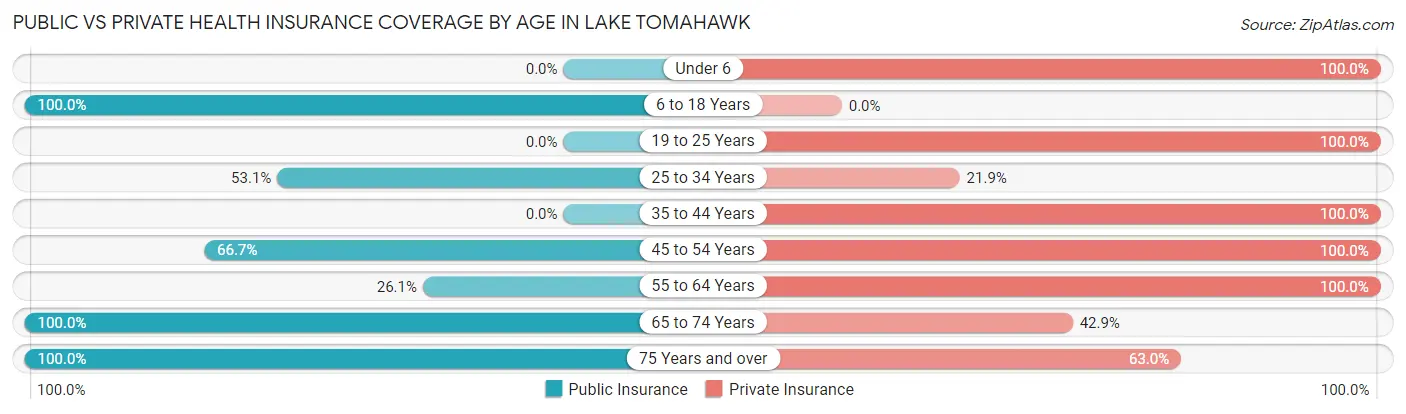
| Age Bracket | Public Insurance | Private Insurance |
| Under 6 | 0 (0.0%) | 15 (100.0%) |
| 6 to 18 Years | 18 (100.0%) | 0 (0.0%) |
| 19 to 25 Years | 0 (0.0%) | 4 (100.0%) |
| 25 to 34 Years | 17 (53.1%) | 7 (21.9%) |
| 35 to 44 Years | 0 (0.0%) | 18 (100.0%) |
| 45 to 54 Years | 10 (66.7%) | 15 (100.0%) |
| 55 to 64 Years | 6 (26.1%) | 23 (100.0%) |
| 65 to 74 Years | 21 (100.0%) | 9 (42.9%) |
| 75 Years and over | 27 (100.0%) | 17 (63.0%) |
| Total | 99 (57.2%) | 108 (62.4%) |
Disability Status by Sex by Age in Lake Tomahawk
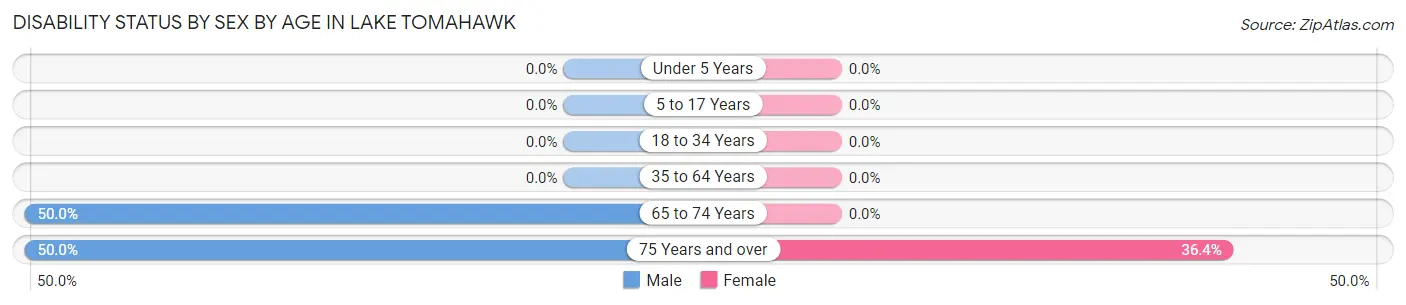
| Age Bracket | Male | Female |
| Under 5 Years | 0 (0.0%) | 0 (0.0%) |
| 5 to 17 Years | 0 (0.0%) | 0 (0.0%) |
| 18 to 34 Years | 0 (0.0%) | 0 (0.0%) |
| 35 to 64 Years | 0 (0.0%) | 0 (0.0%) |
| 65 to 74 Years | 3 (50.0%) | 0 (0.0%) |
| 75 Years and over | 8 (50.0%) | 4 (36.4%) |
Disability Class by Sex by Age in Lake Tomahawk
Disability Class: Hearing Difficulty
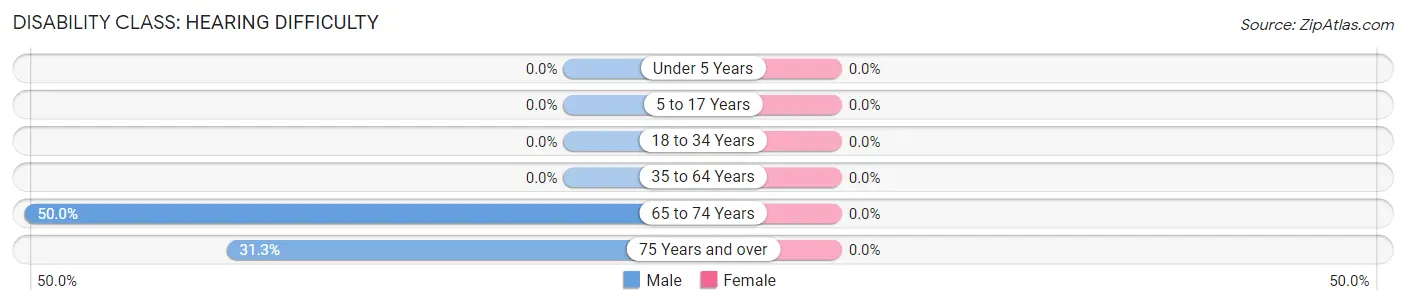
| Age Bracket | Male | Female |
| Under 5 Years | 0 (0.0%) | 0 (0.0%) |
| 5 to 17 Years | 0 (0.0%) | 0 (0.0%) |
| 18 to 34 Years | 0 (0.0%) | 0 (0.0%) |
| 35 to 64 Years | 0 (0.0%) | 0 (0.0%) |
| 65 to 74 Years | 3 (50.0%) | 0 (0.0%) |
| 75 Years and over | 5 (31.2%) | 0 (0.0%) |
Disability Class: Vision Difficulty
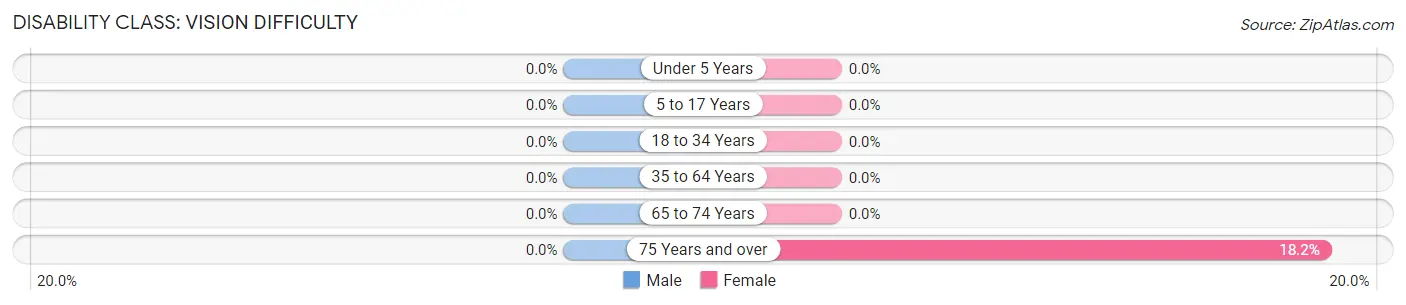
| Age Bracket | Male | Female |
| Under 5 Years | 0 (0.0%) | 0 (0.0%) |
| 5 to 17 Years | 0 (0.0%) | 0 (0.0%) |
| 18 to 34 Years | 0 (0.0%) | 0 (0.0%) |
| 35 to 64 Years | 0 (0.0%) | 0 (0.0%) |
| 65 to 74 Years | 0 (0.0%) | 0 (0.0%) |
| 75 Years and over | 0 (0.0%) | 2 (18.2%) |
Disability Class: Cognitive Difficulty
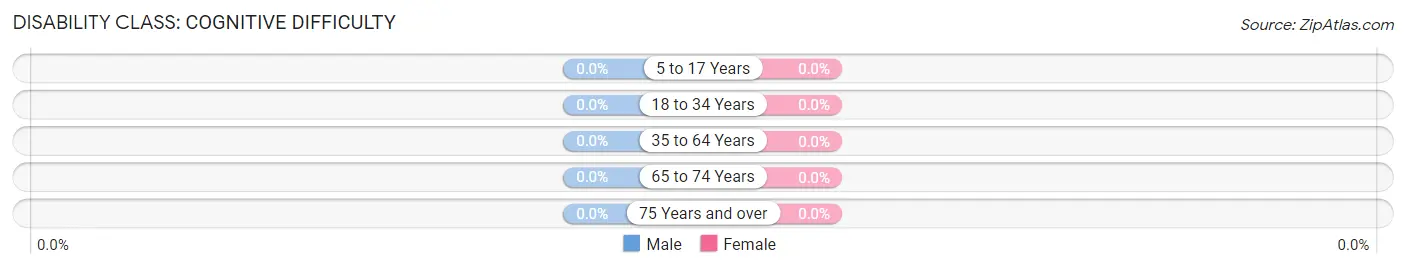
| Age Bracket | Male | Female |
| 5 to 17 Years | 0 (0.0%) | 0 (0.0%) |
| 18 to 34 Years | 0 (0.0%) | 0 (0.0%) |
| 35 to 64 Years | 0 (0.0%) | 0 (0.0%) |
| 65 to 74 Years | 0 (0.0%) | 0 (0.0%) |
| 75 Years and over | 0 (0.0%) | 0 (0.0%) |
Disability Class: Ambulatory Difficulty
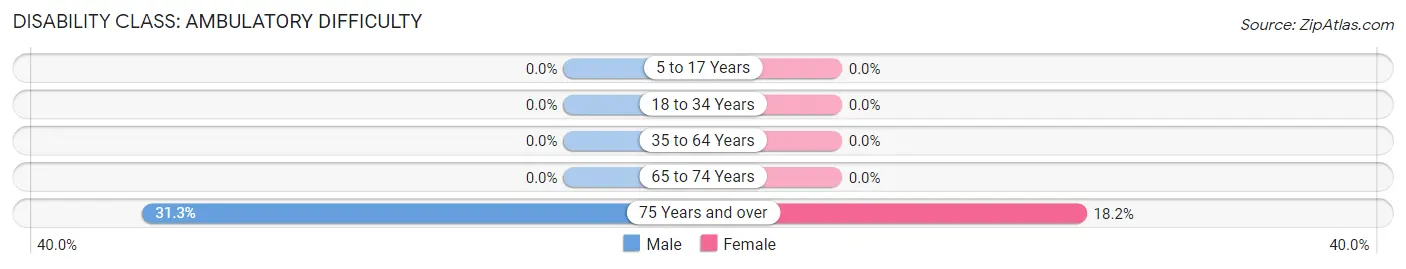
| Age Bracket | Male | Female |
| 5 to 17 Years | 0 (0.0%) | 0 (0.0%) |
| 18 to 34 Years | 0 (0.0%) | 0 (0.0%) |
| 35 to 64 Years | 0 (0.0%) | 0 (0.0%) |
| 65 to 74 Years | 0 (0.0%) | 0 (0.0%) |
| 75 Years and over | 5 (31.2%) | 2 (18.2%) |
Disability Class: Self-Care Difficulty
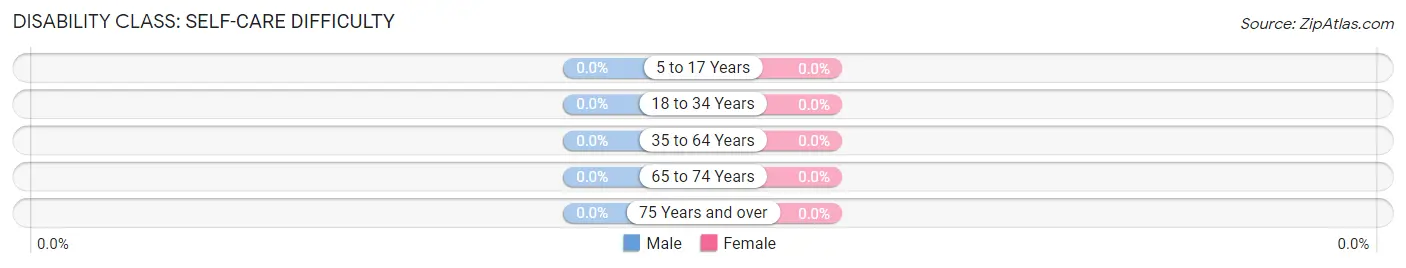
| Age Bracket | Male | Female |
| 5 to 17 Years | 0 (0.0%) | 0 (0.0%) |
| 18 to 34 Years | 0 (0.0%) | 0 (0.0%) |
| 35 to 64 Years | 0 (0.0%) | 0 (0.0%) |
| 65 to 74 Years | 0 (0.0%) | 0 (0.0%) |
| 75 Years and over | 0 (0.0%) | 0 (0.0%) |
Technology Access in Lake Tomahawk
Computing Device Access in Lake Tomahawk
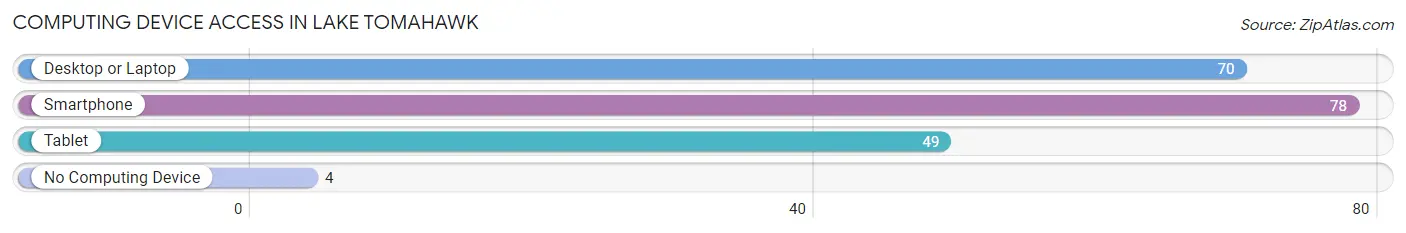
| Device Type | # Households | % Households |
| Desktop or Laptop | 70 | 77.8% |
| Smartphone | 78 | 86.7% |
| Tablet | 49 | 54.4% |
| No Computing Device | 4 | 4.4% |
| Total | 90 | 100.0% |
Internet Access in Lake Tomahawk
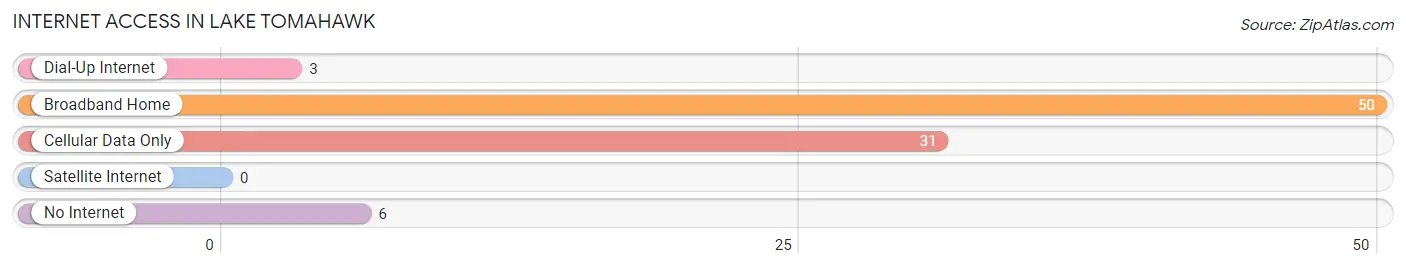
| Internet Type | # Households | % Households |
| Dial-Up Internet | 3 | 3.3% |
| Broadband Home | 50 | 55.6% |
| Cellular Data Only | 31 | 34.4% |
| Satellite Internet | 0 | 0.0% |
| No Internet | 6 | 6.7% |
| Total | 90 | 100.0% |
Lake Tomahawk Summary
Tomahawk, Wisconsin is a small town located in the northern part of the state, in Oneida County. It is situated on the shores of Lake Tomahawk, a large lake that is part of the Wisconsin River system. The town is home to a population of just over 2,000 people, and is known for its small-town charm and outdoor recreation opportunities.
History
Tomahawk was first settled in the late 1800s by a group of lumberjacks who were attracted to the area by the abundance of timber. The town was officially incorporated in 1891, and the first post office was established in 1892. The town was named after the nearby lake, which was named after the tomahawk-shaped rock formations that were found in the area.
In the early 1900s, the town began to grow and develop, with the construction of a railroad line and the establishment of a sawmill. The sawmill was the main source of employment for the town, and it provided lumber for the construction of homes and businesses.
The town continued to grow throughout the 20th century, and in the 1950s, the town was home to a thriving tourist industry. The lake was a popular destination for fishing and boating, and the town was home to several resorts and lodges.
Geography
Tomahawk is located in the northern part of Wisconsin, in Oneida County. It is situated on the shores of Lake Tomahawk, a large lake that is part of the Wisconsin River system. The town is surrounded by forests and lakes, and is home to several parks and recreational areas.
The town is located about 30 miles north of Wausau, and about 90 miles northwest of Green Bay. The nearest major airport is in Rhinelander, about 40 miles away.
Economy
Tomahawk’s economy is largely based on tourism and outdoor recreation. The town is home to several resorts and lodges, as well as a variety of outdoor activities such as fishing, boating, hunting, and camping. The town is also home to several small businesses, including restaurants, shops, and services.
The town is also home to several manufacturing companies, including a paper mill and a wood products plant. The paper mill is the largest employer in the town, and it provides jobs for over 500 people.
Demographics
As of the 2010 census, the population of Tomahawk was 2,068. The population is predominantly white (96.2%), with small percentages of Native American (1.2%), African American (0.7%), and Asian (0.5%) residents. The median household income is $41,944, and the median age is 44.
Tomahawk is a small town with a close-knit community. The town is home to several churches, and there are several community organizations and events throughout the year. The town is also home to a variety of outdoor activities, and it is a popular destination for tourists and outdoor enthusiasts.
Common Questions
What is Per Capita Income in Lake Tomahawk?
Per Capita income in Lake Tomahawk is $28,686.
What is the Median Family Income in Lake Tomahawk?
Median Family Income in Lake Tomahawk is $62,083.
What is the Median Household income in Lake Tomahawk?
Median Household Income in Lake Tomahawk is $47,000.
What is Inequality or Gini Index in Lake Tomahawk?
Inequality or Gini Index in Lake Tomahawk is 0.42.
What is the Total Population of Lake Tomahawk?
Total Population of Lake Tomahawk is 173.
What is the Total Male Population of Lake Tomahawk?
Total Male Population of Lake Tomahawk is 66.
What is the Total Female Population of Lake Tomahawk?
Total Female Population of Lake Tomahawk is 107.
What is the Ratio of Males per 100 Females in Lake Tomahawk?
There are 61.68 Males per 100 Females in Lake Tomahawk.
What is the Ratio of Females per 100 Males in Lake Tomahawk?
There are 162.12 Females per 100 Males in Lake Tomahawk.
What is the Median Population Age in Lake Tomahawk?
Median Population Age in Lake Tomahawk is 43.8 Years.
What is the Average Family Size in Lake Tomahawk
Average Family Size in Lake Tomahawk is 2.2 People.
What is the Average Household Size in Lake Tomahawk
Average Household Size in Lake Tomahawk is 1.9 People.
How Large is the Labor Force in Lake Tomahawk?
There are 92 People in the Labor Forcein in Lake Tomahawk.
What is the Percentage of People in the Labor Force in Lake Tomahawk?
65.7% of People are in the Labor Force in Lake Tomahawk.
What is the Unemployment Rate in Lake Tomahawk?
Unemployment Rate in Lake Tomahawk is 7.6%.