Walworth, WI Map & Demographics
Walworth Map
Walworth Overview
$29,501
PER CAPITA INCOME
$85,270
AVG FAMILY INCOME
$61,472
AVG HOUSEHOLD INCOME
40.2%
WAGE / INCOME GAP [ % ]
59.8¢/ $1
WAGE / INCOME GAP [ $ ]
0.45
INEQUALITY / GINI INDEX
2,778
TOTAL POPULATION
1,391
MALE POPULATION
1,387
FEMALE POPULATION
100.29
MALES / 100 FEMALES
99.71
FEMALES / 100 MALES
38.7
MEDIAN AGE
3.4
AVG FAMILY SIZE
2.7
AVG HOUSEHOLD SIZE
1,469
LABOR FORCE [ PEOPLE ]
70.0%
PERCENT IN LABOR FORCE
2.9%
UNEMPLOYMENT RATE
Walworth Zip Codes
Walworth Area Codes
Income in Walworth
Income Overview in Walworth
Per Capita Income in Walworth is $29,501, while median incomes of families and households are $85,270 and $61,472 respectively.
| Characteristic | Number | Measure |
| Per Capita Income | 2,778 | $29,501 |
| Median Family Income | 682 | $85,270 |
| Mean Family Income | 682 | $100,863 |
| Median Household Income | 1,021 | $61,472 |
| Mean Household Income | 1,021 | $85,830 |
| Income Deficit | 682 | $0 |
| Wage / Income Gap (%) | 2,778 | 40.22% |
| Wage / Income Gap ($) | 2,778 | 59.78¢ per $1 |
| Gini / Inequality Index | 2,778 | 0.45 |
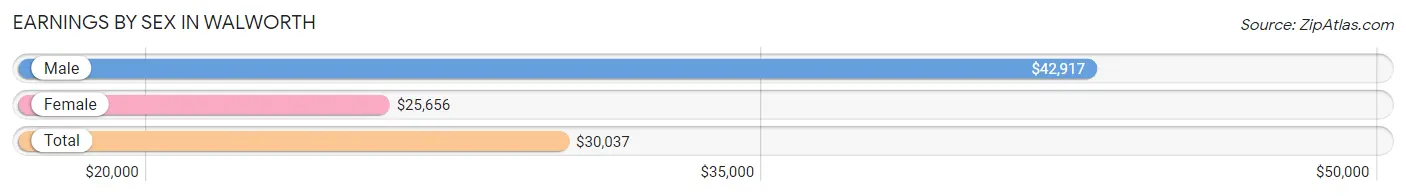
Earnings by Sex in Walworth
Average Earnings in Walworth are $30,037, $42,917 for men and $25,656 for women, a difference of 40.2%.
| Sex | Number | Average Earnings |
| Male | 755 (48.2%) | $42,917 |
| Female | 810 (51.8%) | $25,656 |
| Total | 1,565 (100.0%) | $30,037 |
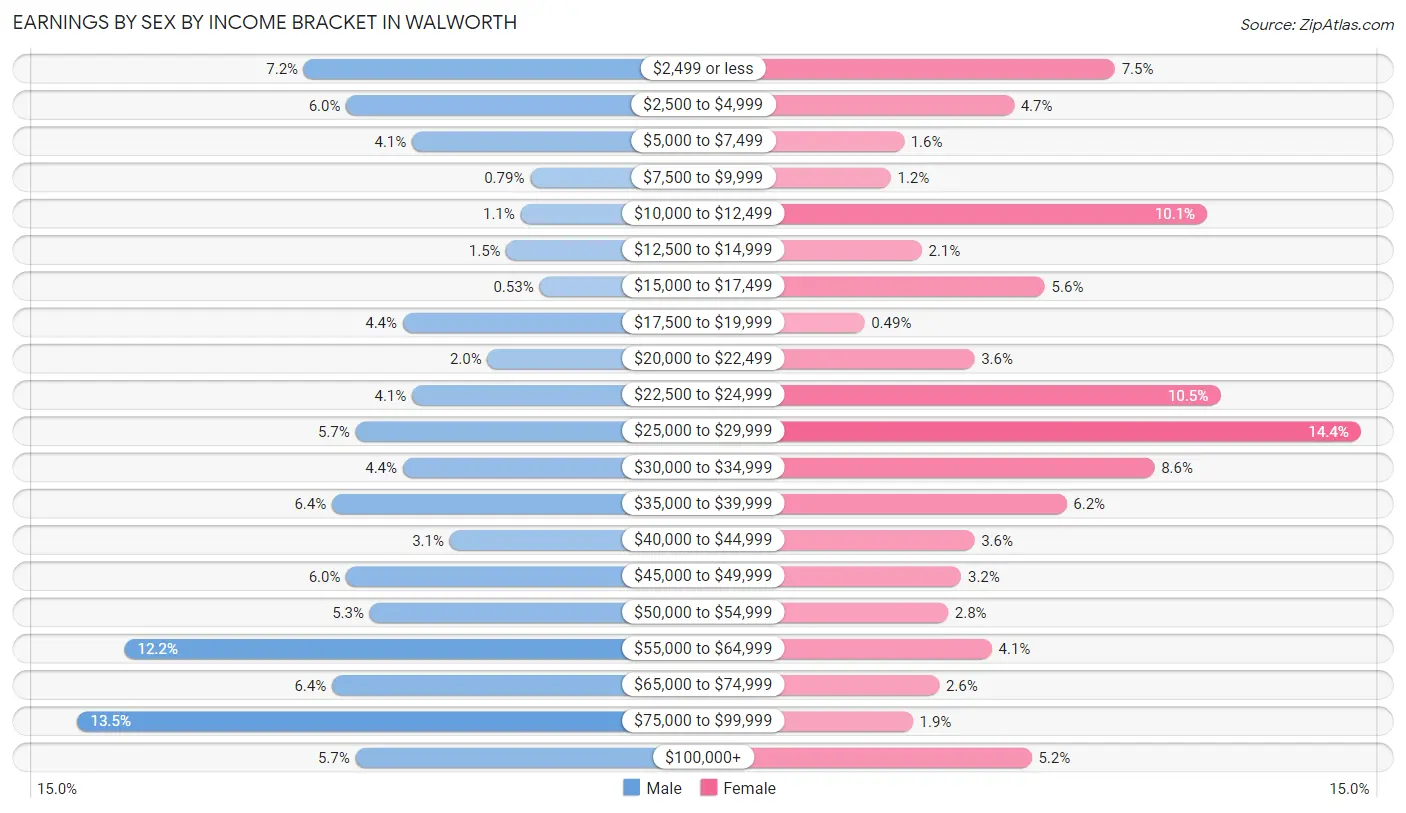
Earnings by Sex by Income Bracket in Walworth
The most common earnings brackets in Walworth are $75,000 to $99,999 for men (102 | 13.5%) and $25,000 to $29,999 for women (117 | 14.4%).
| Income | Male | Female |
| $2,499 or less | 54 (7.1%) | 61 (7.5%) |
| $2,500 to $4,999 | 45 (6.0%) | 38 (4.7%) |
| $5,000 to $7,499 | 31 (4.1%) | 13 (1.6%) |
| $7,500 to $9,999 | 6 (0.8%) | 10 (1.2%) |
| $10,000 to $12,499 | 8 (1.1%) | 82 (10.1%) |
| $12,500 to $14,999 | 11 (1.5%) | 17 (2.1%) |
| $15,000 to $17,499 | 4 (0.5%) | 45 (5.6%) |
| $17,500 to $19,999 | 33 (4.4%) | 4 (0.5%) |
| $20,000 to $22,499 | 15 (2.0%) | 29 (3.6%) |
| $22,500 to $24,999 | 31 (4.1%) | 85 (10.5%) |
| $25,000 to $29,999 | 43 (5.7%) | 117 (14.4%) |
| $30,000 to $34,999 | 33 (4.4%) | 70 (8.6%) |
| $35,000 to $39,999 | 48 (6.4%) | 50 (6.2%) |
| $40,000 to $44,999 | 23 (3.0%) | 29 (3.6%) |
| $45,000 to $49,999 | 45 (6.0%) | 26 (3.2%) |
| $50,000 to $54,999 | 40 (5.3%) | 23 (2.8%) |
| $55,000 to $64,999 | 92 (12.2%) | 33 (4.1%) |
| $65,000 to $74,999 | 48 (6.4%) | 21 (2.6%) |
| $75,000 to $99,999 | 102 (13.5%) | 15 (1.8%) |
| $100,000+ | 43 (5.7%) | 42 (5.2%) |
| Total | 755 (100.0%) | 810 (100.0%) |
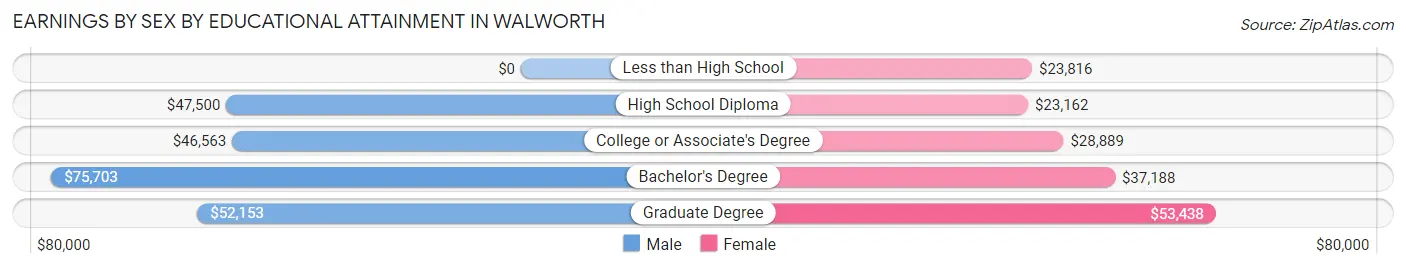
Earnings by Sex by Educational Attainment in Walworth
Average earnings in Walworth are $51,902 for men and $27,731 for women, a difference of 46.6%. Men with an educational attainment of bachelor's degree enjoy the highest average annual earnings of $75,703, while those with college or associate's degree education earn the least with $46,563. Women with an educational attainment of graduate degree earn the most with the average annual earnings of $53,438, while those with high school diploma education have the smallest earnings of $23,162.
| Educational Attainment | Male Income | Female Income |
| Less than High School | - | - |
| High School Diploma | $47,500 | $23,162 |
| College or Associate's Degree | $46,563 | $28,889 |
| Bachelor's Degree | $75,703 | $37,188 |
| Graduate Degree | $52,153 | $53,438 |
| Total | $51,902 | $27,731 |
Family Income in Walworth
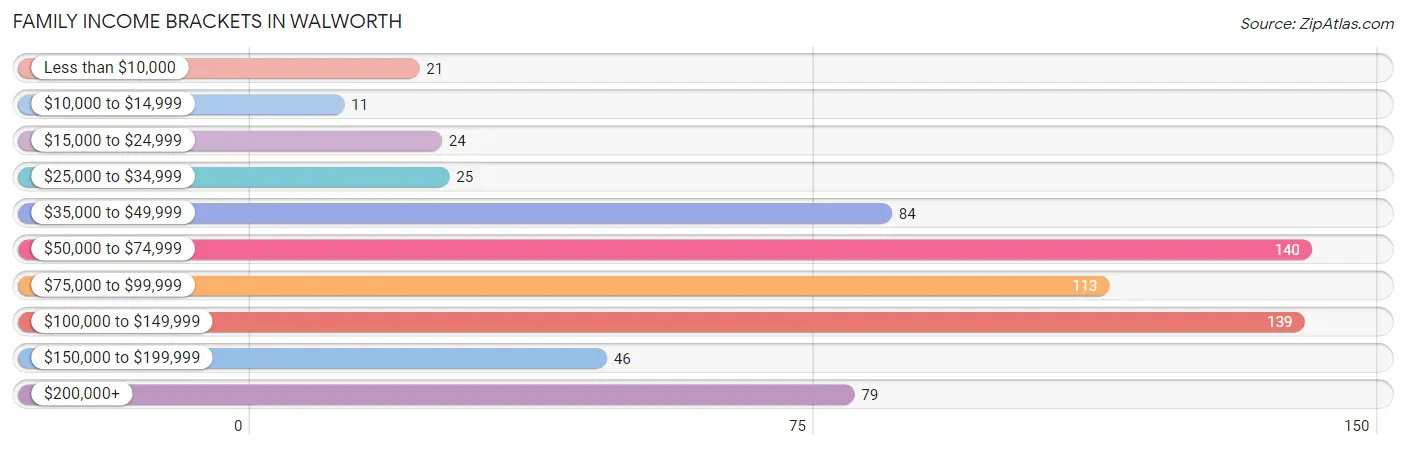
Family Income Brackets in Walworth
According to the Walworth family income data, there are 140 families falling into the $50,000 to $74,999 income range, which is the most common income bracket and makes up 20.5% of all families. Conversely, the $10,000 to $14,999 income bracket is the least frequent group with only 11 families (1.6%) belonging to this category.
| Income Bracket | # Families | % Families |
| Less than $10,000 | 21 | 3.1% |
| $10,000 to $14,999 | 11 | 1.6% |
| $15,000 to $24,999 | 24 | 3.5% |
| $25,000 to $34,999 | 25 | 3.7% |
| $35,000 to $49,999 | 84 | 12.3% |
| $50,000 to $74,999 | 140 | 20.5% |
| $75,000 to $99,999 | 113 | 16.6% |
| $100,000 to $149,999 | 139 | 20.4% |
| $150,000 to $199,999 | 46 | 6.7% |
| $200,000+ | 79 | 11.6% |
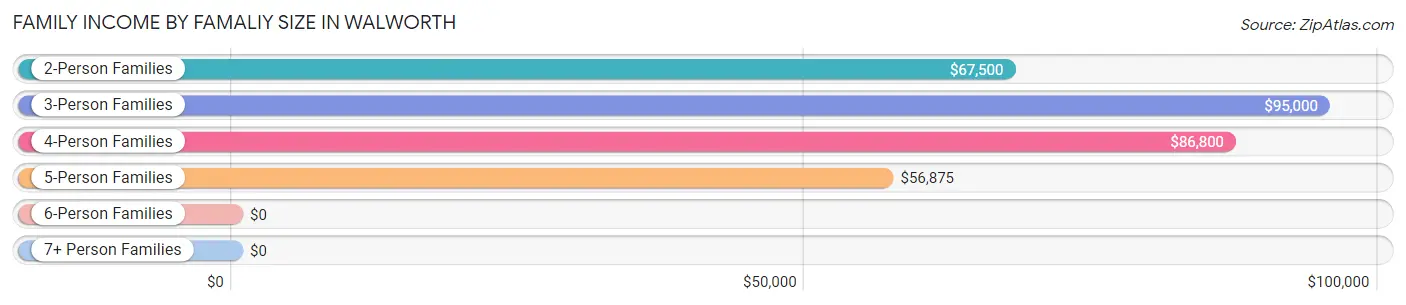
Family Income by Famaliy Size in Walworth
3-person families (158 | 23.2%) account for the highest median family income in Walworth with $95,000 per family, while 2-person families (270 | 39.6%) have the highest median income of $33,750 per family member.
| Income Bracket | # Families | Median Income |
| 2-Person Families | 270 (39.6%) | $67,500 |
| 3-Person Families | 158 (23.2%) | $95,000 |
| 4-Person Families | 122 (17.9%) | $86,800 |
| 5-Person Families | 49 (7.2%) | $56,875 |
| 6-Person Families | 79 (11.6%) | $0 |
| 7+ Person Families | 4 (0.6%) | $0 |
| Total | 682 (100.0%) | $85,270 |
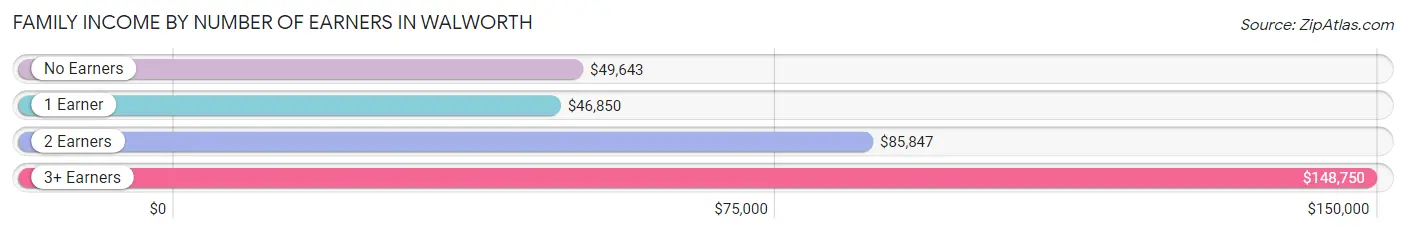
Family Income by Number of Earners in Walworth
The median family income in Walworth is $85,270, with families comprising 3+ earners (144) having the highest median family income of $148,750, while families with 1 earner (185) have the lowest median family income of $46,850, accounting for 21.1% and 27.1% of families, respectively.
| Number of Earners | # Families | Median Income |
| No Earners | 72 (10.6%) | $49,643 |
| 1 Earner | 185 (27.1%) | $46,850 |
| 2 Earners | 281 (41.2%) | $85,847 |
| 3+ Earners | 144 (21.1%) | $148,750 |
| Total | 682 (100.0%) | $85,270 |
Household Income in Walworth
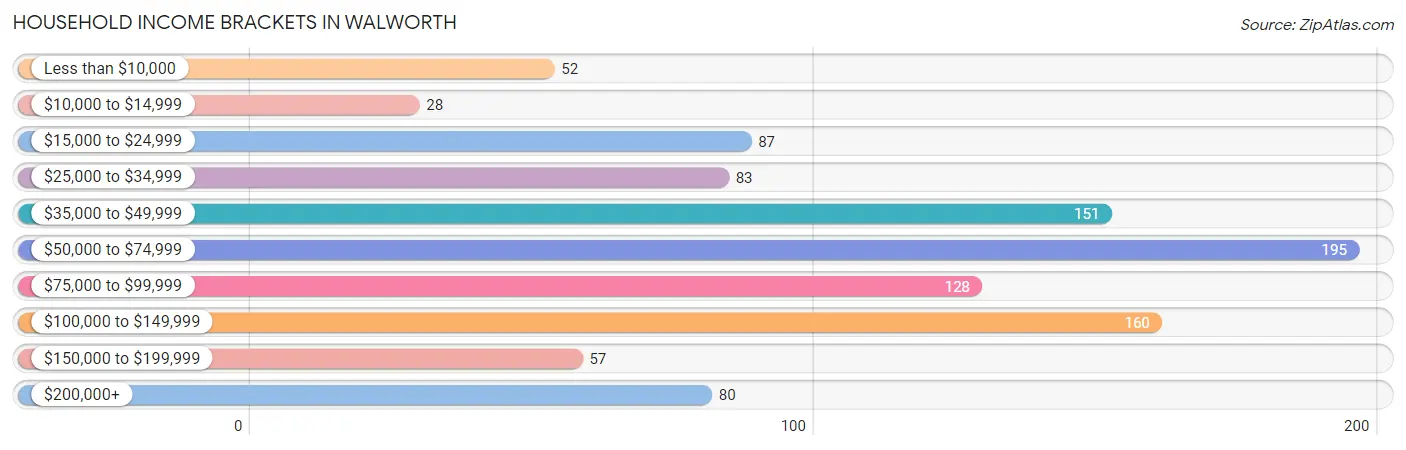
Household Income Brackets in Walworth
With 195 households falling in the category, the $50,000 to $74,999 income range is the most frequent in Walworth, accounting for 19.1% of all households. In contrast, only 28 households (2.7%) fall into the $10,000 to $14,999 income bracket, making it the least populous group.
| Income Bracket | # Households | % Households |
| Less than $10,000 | 52 | 5.1% |
| $10,000 to $14,999 | 28 | 2.7% |
| $15,000 to $24,999 | 87 | 8.5% |
| $25,000 to $34,999 | 83 | 8.1% |
| $35,000 to $49,999 | 151 | 14.8% |
| $50,000 to $74,999 | 195 | 19.1% |
| $75,000 to $99,999 | 128 | 12.5% |
| $100,000 to $149,999 | 160 | 15.7% |
| $150,000 to $199,999 | 57 | 5.6% |
| $200,000+ | 80 | 7.8% |
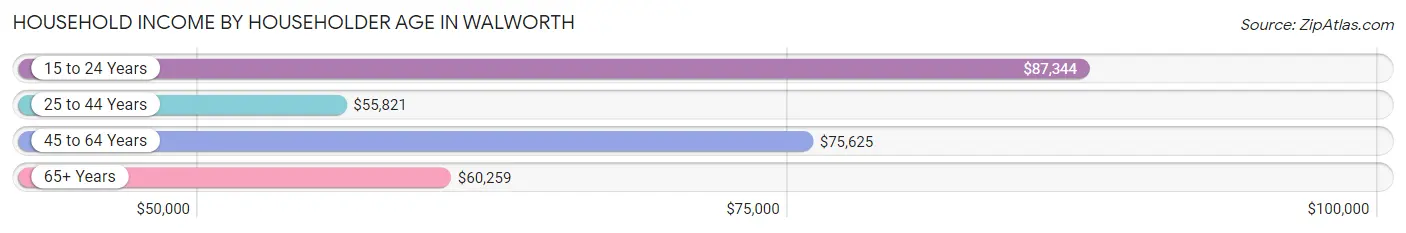
Household Income by Householder Age in Walworth
The median household income in Walworth is $61,472, with the highest median household income of $87,344 found in the 15 to 24 years age bracket for the primary householder. A total of 25 households (2.5%) fall into this category. Meanwhile, the 25 to 44 years age bracket for the primary householder has the lowest median household income of $55,821, with 261 households (25.6%) in this group.
| Income Bracket | # Households | Median Income |
| 15 to 24 Years | 25 (2.5%) | $87,344 |
| 25 to 44 Years | 261 (25.6%) | $55,821 |
| 45 to 64 Years | 457 (44.8%) | $75,625 |
| 65+ Years | 278 (27.2%) | $60,259 |
| Total | 1,021 (100.0%) | $61,472 |
Poverty in Walworth
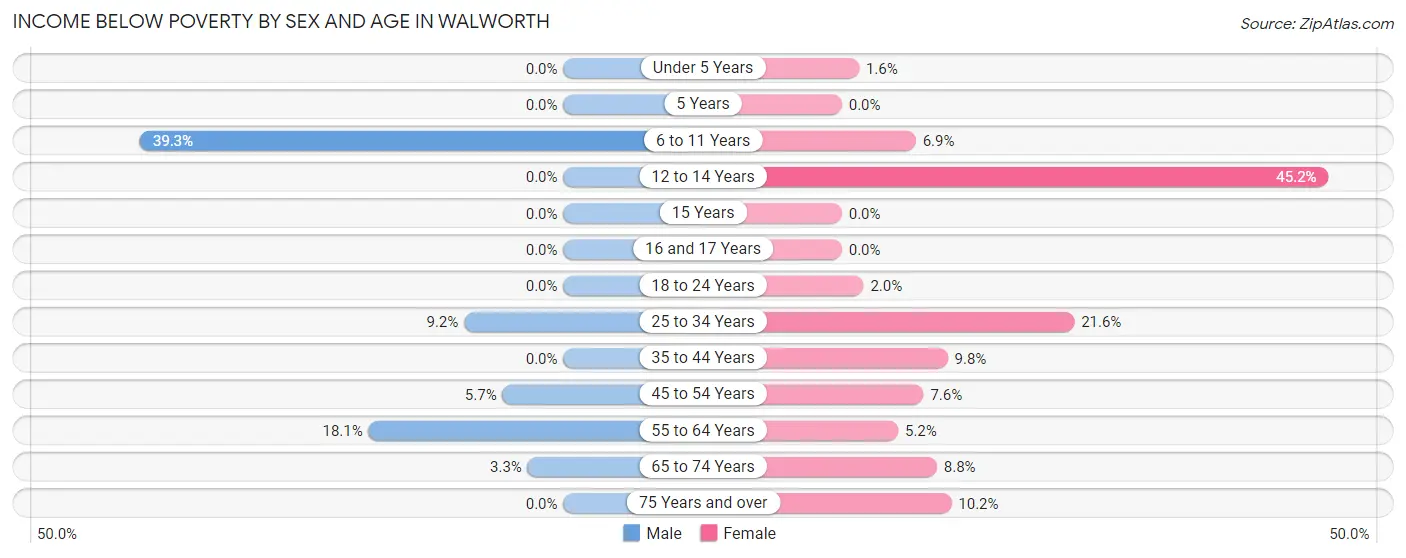
Income Below Poverty by Sex and Age in Walworth
With 10.0% poverty level for males and 8.4% for females among the residents of Walworth, 6 to 11 year old males and 12 to 14 year old females are the most vulnerable to poverty, with 79 males (39.3%) and 14 females (45.2%) in their respective age groups living below the poverty level.
| Age Bracket | Male | Female |
| Under 5 Years | 0 (0.0%) | 1 (1.6%) |
| 5 Years | 0 (0.0%) | 0 (0.0%) |
| 6 to 11 Years | 79 (39.3%) | 7 (6.9%) |
| 12 to 14 Years | 0 (0.0%) | 14 (45.2%) |
| 15 Years | 0 (0.0%) | 0 (0.0%) |
| 16 and 17 Years | 0 (0.0%) | 0 (0.0%) |
| 18 to 24 Years | 0 (0.0%) | 3 (2.0%) |
| 25 to 34 Years | 14 (9.2%) | 22 (21.6%) |
| 35 to 44 Years | 0 (0.0%) | 16 (9.8%) |
| 45 to 54 Years | 10 (5.7%) | 20 (7.6%) |
| 55 to 64 Years | 32 (18.1%) | 7 (5.2%) |
| 65 to 74 Years | 4 (3.3%) | 12 (8.8%) |
| 75 Years and over | 0 (0.0%) | 12 (10.2%) |
| Total | 139 (10.0%) | 114 (8.4%) |
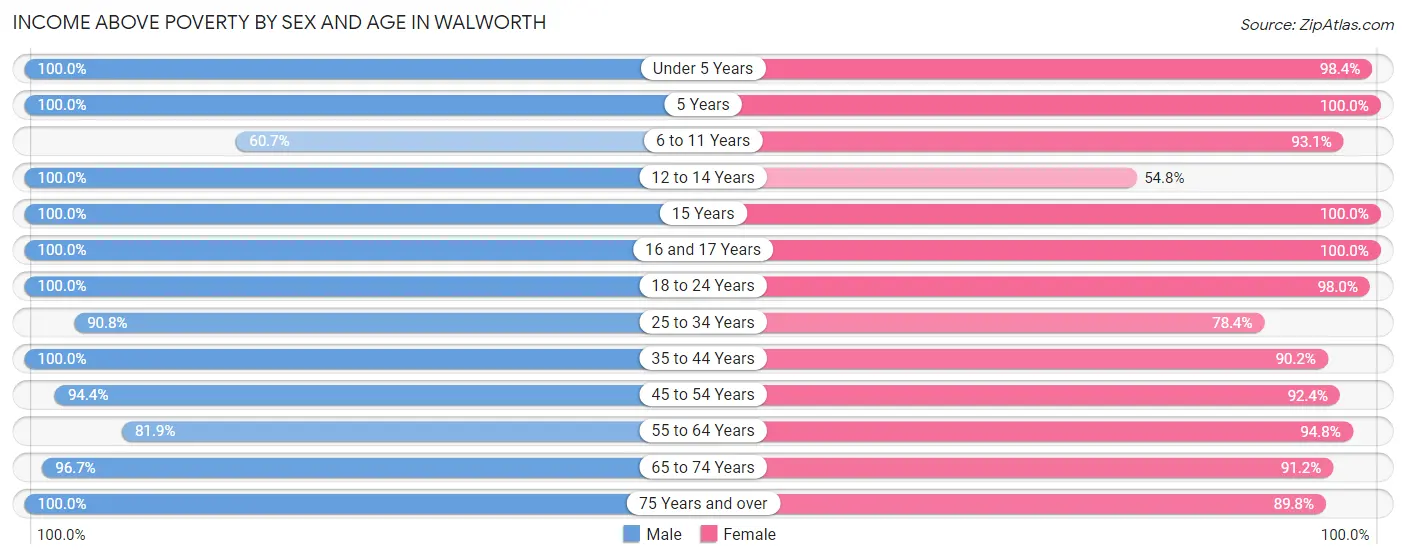
Income Above Poverty by Sex and Age in Walworth
According to the poverty statistics in Walworth, males aged under 5 years and females aged 5 years are the age groups that are most secure financially, with 100.0% of males and 100.0% of females in these age groups living above the poverty line.
| Age Bracket | Male | Female |
| Under 5 Years | 71 (100.0%) | 62 (98.4%) |
| 5 Years | 7 (100.0%) | 41 (100.0%) |
| 6 to 11 Years | 122 (60.7%) | 95 (93.1%) |
| 12 to 14 Years | 48 (100.0%) | 17 (54.8%) |
| 15 Years | 91 (100.0%) | 23 (100.0%) |
| 16 and 17 Years | 69 (100.0%) | 36 (100.0%) |
| 18 to 24 Years | 111 (100.0%) | 146 (98.0%) |
| 25 to 34 Years | 138 (90.8%) | 80 (78.4%) |
| 35 to 44 Years | 118 (100.0%) | 147 (90.2%) |
| 45 to 54 Years | 167 (94.4%) | 244 (92.4%) |
| 55 to 64 Years | 145 (81.9%) | 127 (94.8%) |
| 65 to 74 Years | 117 (96.7%) | 124 (91.2%) |
| 75 Years and over | 47 (100.0%) | 106 (89.8%) |
| Total | 1,251 (90.0%) | 1,248 (91.6%) |
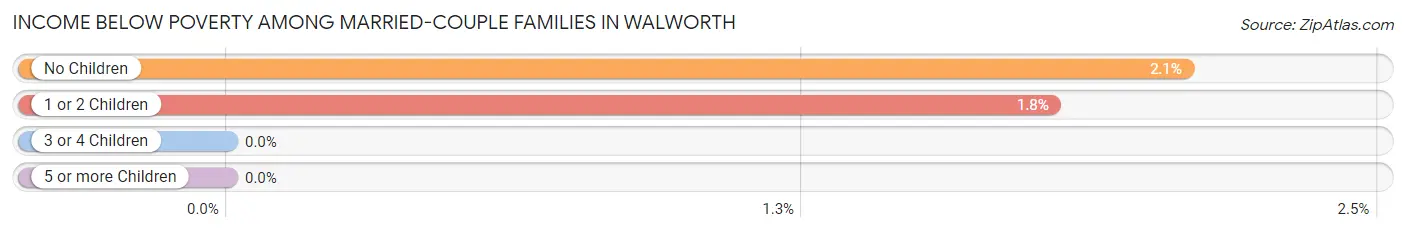
Income Below Poverty Among Married-Couple Families in Walworth
The poverty statistics for married-couple families in Walworth show that 1.7% or 9 of the total 517 families live below the poverty line. Families with no children have the highest poverty rate of 2.1%, comprising of 5 families. On the other hand, families with 3 or 4 children have the lowest poverty rate of 0.0%, which includes 0 families.
| Children | Above Poverty | Below Poverty |
| No Children | 235 (97.9%) | 5 (2.1%) |
| 1 or 2 Children | 220 (98.2%) | 4 (1.8%) |
| 3 or 4 Children | 53 (100.0%) | 0 (0.0%) |
| 5 or more Children | 0 (0.0%) | 0 (0.0%) |
| Total | 508 (98.3%) | 9 (1.7%) |
Income Below Poverty Among Single-Parent Households in Walworth
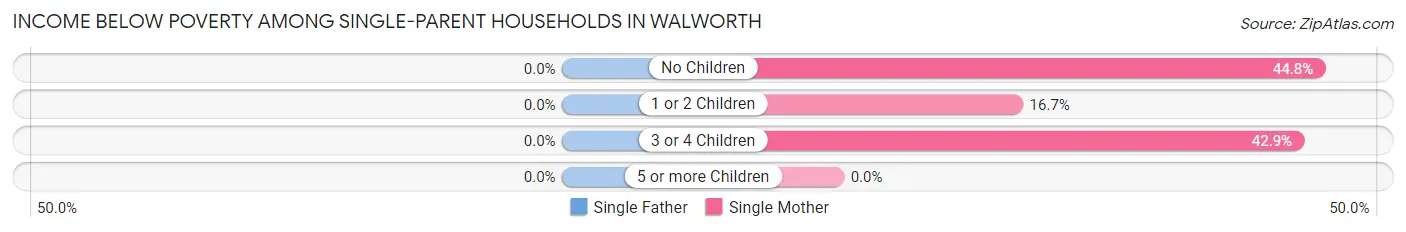
| Children | Single Father | Single Mother |
| No Children | 0 (0.0%) | 13 (44.8%) |
| 1 or 2 Children | 0 (0.0%) | 13 (16.7%) |
| 3 or 4 Children | 0 (0.0%) | 3 (42.9%) |
| 5 or more Children | 0 (0.0%) | 0 (0.0%) |
| Total | 0 (0.0%) | 29 (25.4%) |
Income Below Poverty Among Married-Couple vs Single-Parent Households in Walworth
The poverty data for Walworth shows that 9 of the married-couple family households (1.7%) and 29 of the single-parent households (17.6%) are living below the poverty level. Within the married-couple family households, those with no children have the highest poverty rate, with 5 households (2.1%) falling below the poverty line. Among the single-parent households, those with 3 or 4 children have the highest poverty rate, with 3 household (42.9%) living below poverty.
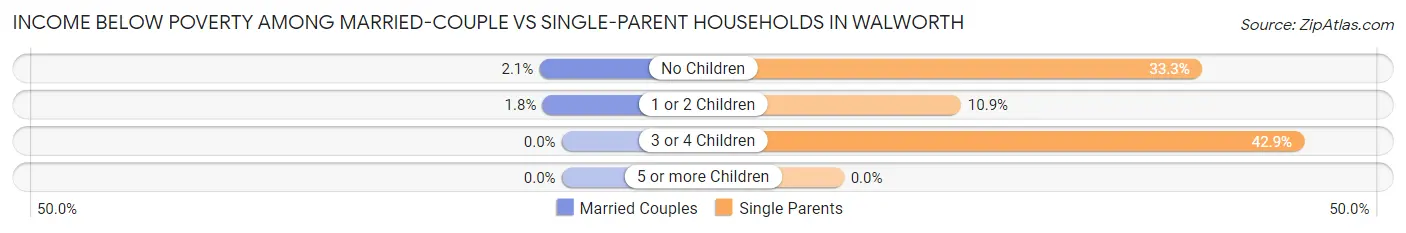
| Children | Married-Couple Families | Single-Parent Households |
| No Children | 5 (2.1%) | 13 (33.3%) |
| 1 or 2 Children | 4 (1.8%) | 13 (10.9%) |
| 3 or 4 Children | 0 (0.0%) | 3 (42.9%) |
| 5 or more Children | 0 (0.0%) | 0 (0.0%) |
| Total | 9 (1.7%) | 29 (17.6%) |
Race in Walworth
The most populous races in Walworth are White / Caucasian (2,233 | 80.4%), Hispanic or Latino (623 | 22.4%), and Two or more Races (269 | 9.7%).
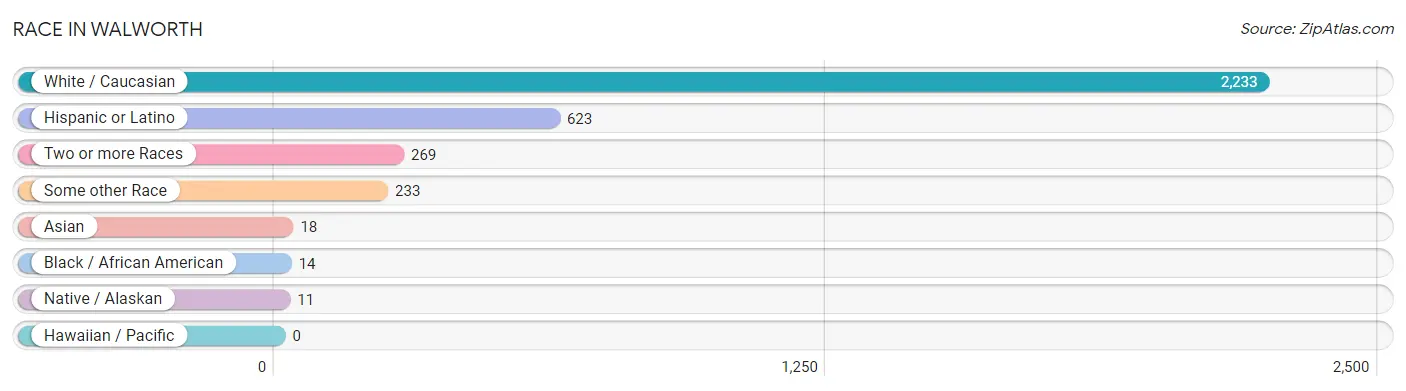
| Race | # Population | % Population |
| Asian | 18 | 0.6% |
| Black / African American | 14 | 0.5% |
| Hawaiian / Pacific | 0 | 0.0% |
| Hispanic or Latino | 623 | 22.4% |
| Native / Alaskan | 11 | 0.4% |
| White / Caucasian | 2,233 | 80.4% |
| Two or more Races | 269 | 9.7% |
| Some other Race | 233 | 8.4% |
| Total | 2,778 | 100.0% |
Ancestry in Walworth
The most populous ancestries reported in Walworth are German (785 | 28.3%), Mexican (605 | 21.8%), Irish (366 | 13.2%), English (308 | 11.1%), and Polish (121 | 4.4%), together accounting for 78.7% of all Walworth residents.
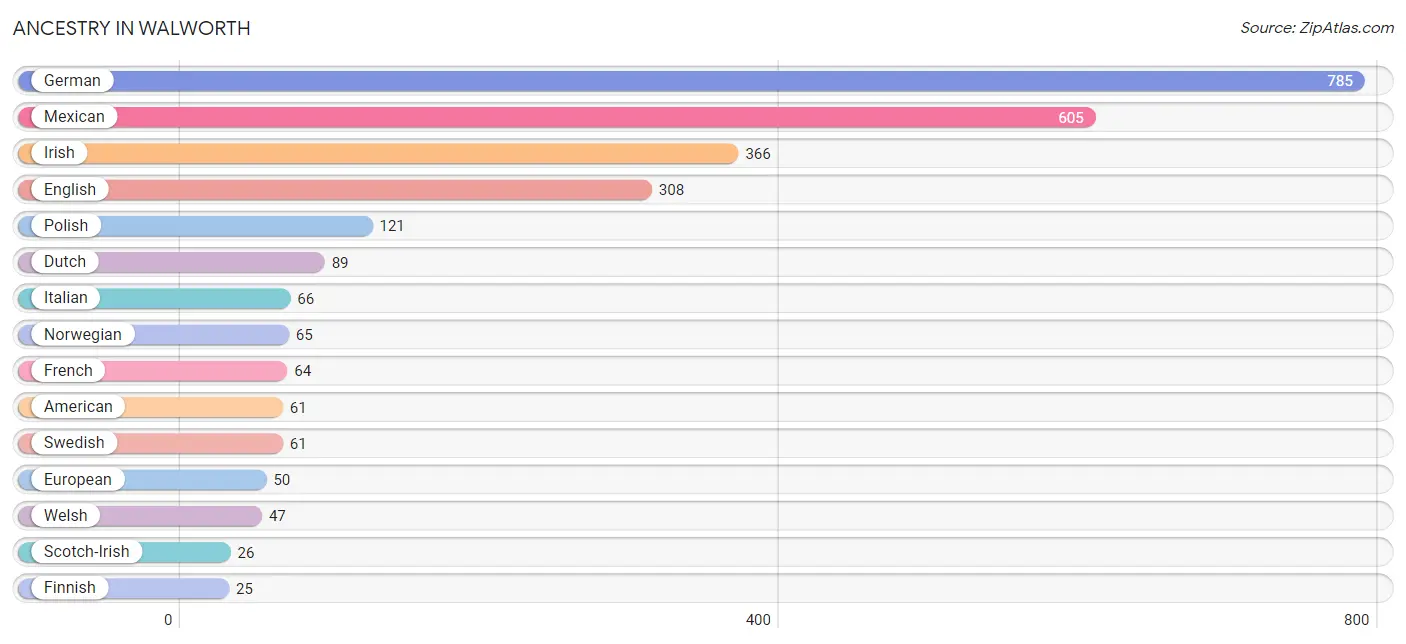
| Ancestry | # Population | % Population |
| American | 61 | 2.2% |
| British | 5 | 0.2% |
| Burmese | 11 | 0.4% |
| Carpatho Rusyn | 16 | 0.6% |
| Czech | 13 | 0.5% |
| Czechoslovakian | 5 | 0.2% |
| Danish | 16 | 0.6% |
| Dutch | 89 | 3.2% |
| English | 308 | 11.1% |
| European | 50 | 1.8% |
| Finnish | 25 | 0.9% |
| French | 64 | 2.3% |
| French Canadian | 7 | 0.3% |
| German | 785 | 28.3% |
| Greek | 10 | 0.4% |
| Indian (Asian) | 5 | 0.2% |
| Irish | 366 | 13.2% |
| Italian | 66 | 2.4% |
| Japanese | 13 | 0.5% |
| Mexican | 605 | 21.8% |
| Mexican American Indian | 11 | 0.4% |
| Northern European | 11 | 0.4% |
| Norwegian | 65 | 2.3% |
| Polish | 121 | 4.4% |
| Puerto Rican | 18 | 0.6% |
| Russian | 4 | 0.1% |
| Scandinavian | 4 | 0.1% |
| Scotch-Irish | 26 | 0.9% |
| Scottish | 22 | 0.8% |
| Slovene | 5 | 0.2% |
| Swedish | 61 | 2.2% |
| Swiss | 12 | 0.4% |
| Ukrainian | 22 | 0.8% |
| Welsh | 47 | 1.7% | View All 34 Rows |
Immigrants in Walworth
The most numerous immigrant groups reported in Walworth came from Central America (268 | 9.7%), Latin America (268 | 9.7%), Mexico (268 | 9.7%), Asia (18 | 0.6%), and Europe (16 | 0.6%), together accounting for 30.2% of all Walworth residents.
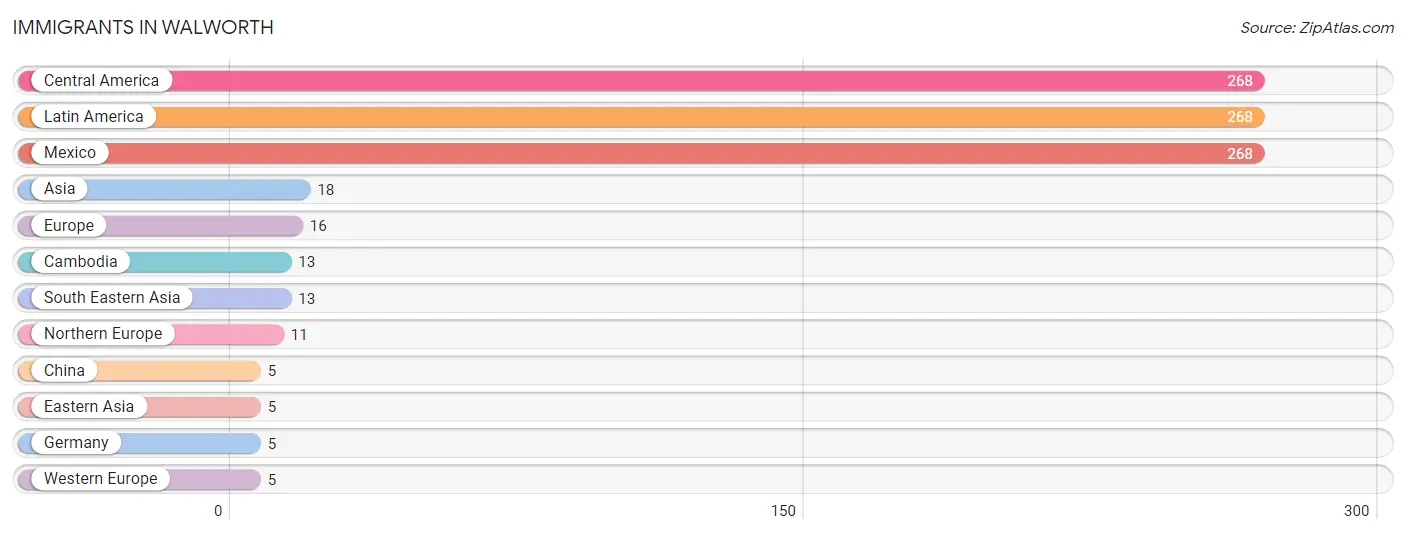
| Immigration Origin | # Population | % Population |
| Asia | 18 | 0.6% |
| Cambodia | 13 | 0.5% |
| Central America | 268 | 9.7% |
| China | 5 | 0.2% |
| Eastern Asia | 5 | 0.2% |
| Europe | 16 | 0.6% |
| Germany | 5 | 0.2% |
| Latin America | 268 | 9.7% |
| Mexico | 268 | 9.7% |
| Northern Europe | 11 | 0.4% |
| South Eastern Asia | 13 | 0.5% |
| Western Europe | 5 | 0.2% | View All 12 Rows |
Sex and Age in Walworth
Sex and Age in Walworth
The most populous age groups in Walworth are 15 to 19 Years (183 | 13.2%) for men and 45 to 49 Years (139 | 10.0%) for women.
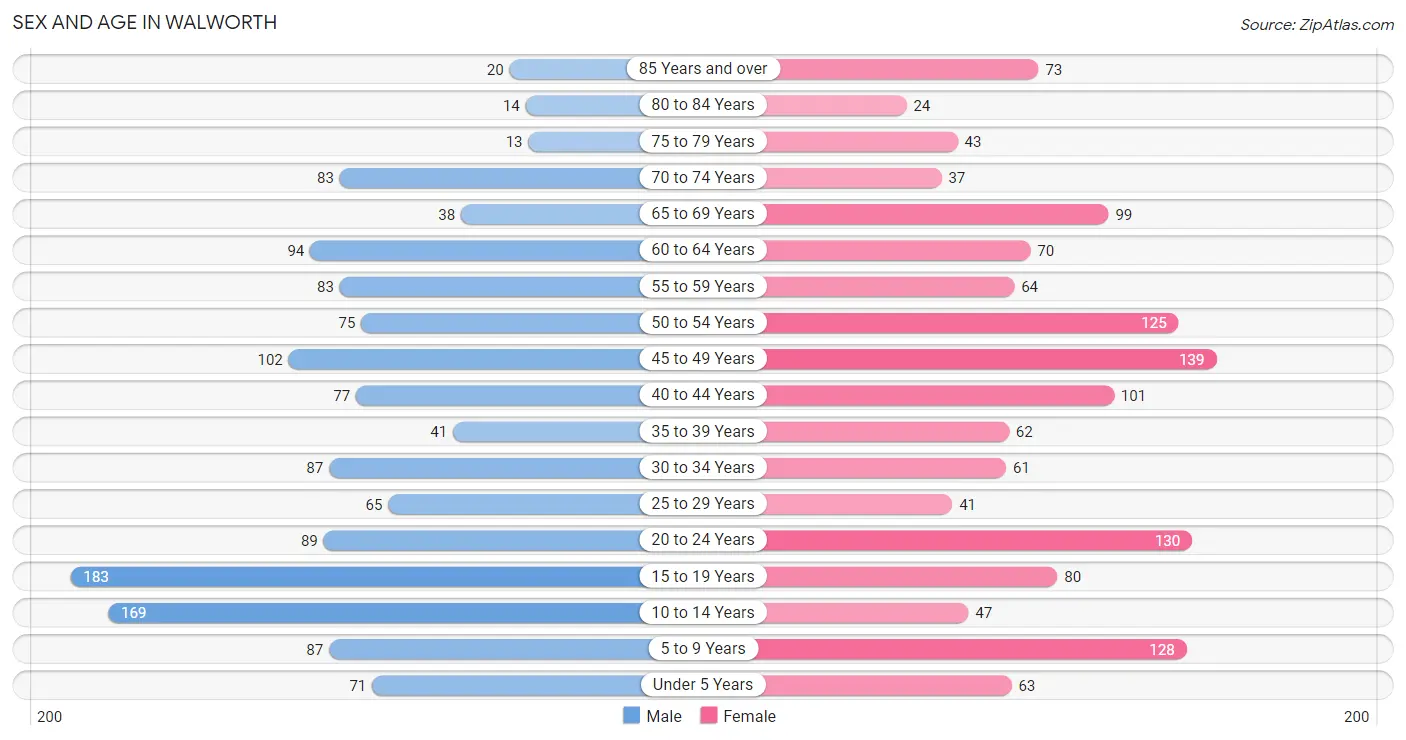
| Age Bracket | Male | Female |
| Under 5 Years | 71 (5.1%) | 63 (4.5%) |
| 5 to 9 Years | 87 (6.2%) | 128 (9.2%) |
| 10 to 14 Years | 169 (12.1%) | 47 (3.4%) |
| 15 to 19 Years | 183 (13.2%) | 80 (5.8%) |
| 20 to 24 Years | 89 (6.4%) | 130 (9.4%) |
| 25 to 29 Years | 65 (4.7%) | 41 (3.0%) |
| 30 to 34 Years | 87 (6.2%) | 61 (4.4%) |
| 35 to 39 Years | 41 (2.9%) | 62 (4.5%) |
| 40 to 44 Years | 77 (5.5%) | 101 (7.3%) |
| 45 to 49 Years | 102 (7.3%) | 139 (10.0%) |
| 50 to 54 Years | 75 (5.4%) | 125 (9.0%) |
| 55 to 59 Years | 83 (6.0%) | 64 (4.6%) |
| 60 to 64 Years | 94 (6.8%) | 70 (5.1%) |
| 65 to 69 Years | 38 (2.7%) | 99 (7.1%) |
| 70 to 74 Years | 83 (6.0%) | 37 (2.7%) |
| 75 to 79 Years | 13 (0.9%) | 43 (3.1%) |
| 80 to 84 Years | 14 (1.0%) | 24 (1.7%) |
| 85 Years and over | 20 (1.4%) | 73 (5.3%) |
| Total | 1,391 (100.0%) | 1,387 (100.0%) |
Families and Households in Walworth
Median Family Size in Walworth
The median family size in Walworth is 3.40 persons per family, with single female/mother families (114 | 16.7%) accounting for the largest median family size of 3.57 persons per family. On the other hand, single male/father families (51 | 7.5%) represent the smallest median family size with 2.43 persons per family.
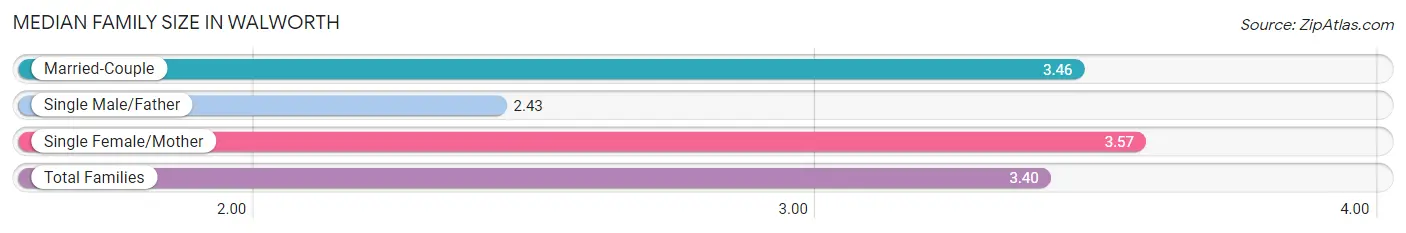
| Family Type | # Families | Family Size |
| Married-Couple | 517 (75.8%) | 3.46 |
| Single Male/Father | 51 (7.5%) | 2.43 |
| Single Female/Mother | 114 (16.7%) | 3.57 |
| Total Families | 682 (100.0%) | 3.40 |
Median Household Size in Walworth
The median household size in Walworth is 2.69 persons per household, with single female/mother households (114 | 11.2%) accounting for the largest median household size of 3.67 persons per household. non-family households (339 | 33.2%) represent the smallest median household size with 1.09 persons per household.
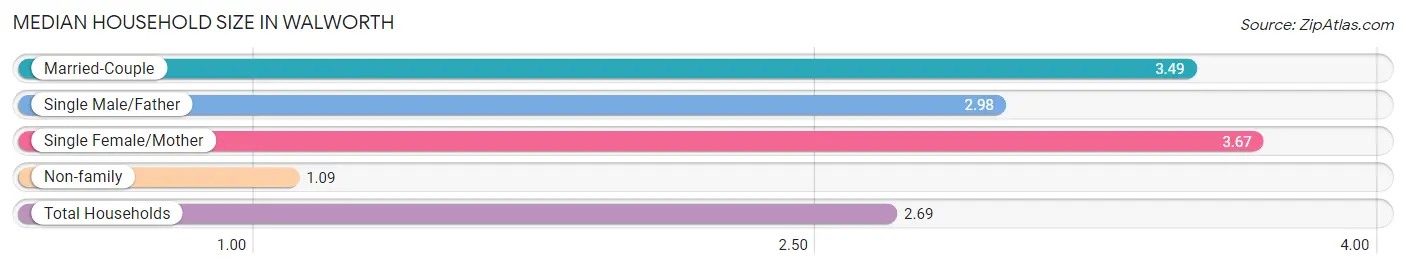
| Household Type | # Households | Household Size |
| Married-Couple | 517 (50.6%) | 3.49 |
| Single Male/Father | 51 (5.0%) | 2.98 |
| Single Female/Mother | 114 (11.2%) | 3.67 |
| Non-family | 339 (33.2%) | 1.09 |
| Total Households | 1,021 (100.0%) | 2.69 |
Household Size by Marriage Status in Walworth
Out of a total of 1,021 households in Walworth, 682 (66.8%) are family households, while 339 (33.2%) are nonfamily households. The most numerous type of family households are 2-person households, comprising 235, and the most common type of nonfamily households are 1-person households, comprising 309.
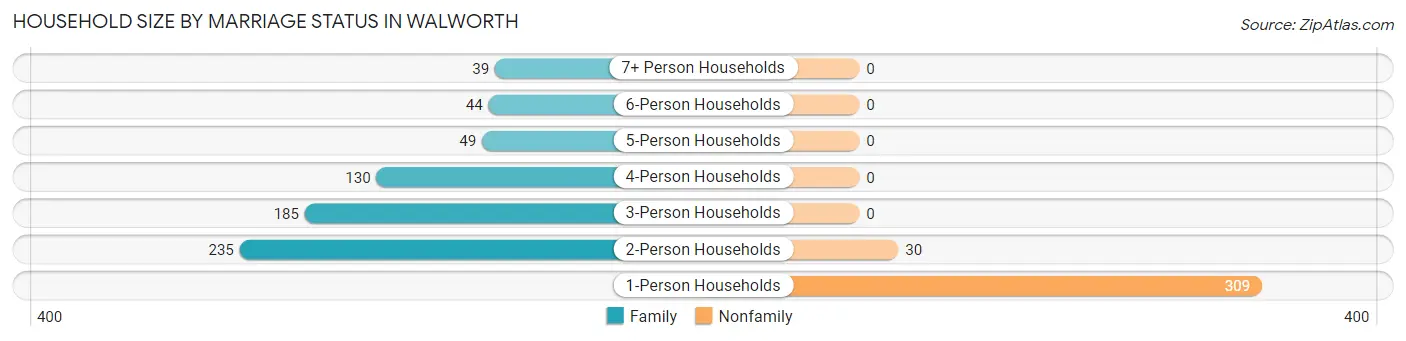
| Household Size | Family Households | Nonfamily Households |
| 1-Person Households | - | 309 (30.3%) |
| 2-Person Households | 235 (23.0%) | 30 (2.9%) |
| 3-Person Households | 185 (18.1%) | 0 (0.0%) |
| 4-Person Households | 130 (12.7%) | 0 (0.0%) |
| 5-Person Households | 49 (4.8%) | 0 (0.0%) |
| 6-Person Households | 44 (4.3%) | 0 (0.0%) |
| 7+ Person Households | 39 (3.8%) | 0 (0.0%) |
| Total | 682 (66.8%) | 339 (33.2%) |
Female Fertility in Walworth
Fertility by Age in Walworth
Average fertility rate in Walworth is 40.0 births per 1,000 women. Women in the age bracket of 20 to 34 years have the highest fertility rate with 108.0 births per 1,000 women. Women in the age bracket of 20 to 34 years acount for 100.0% of all women with births.
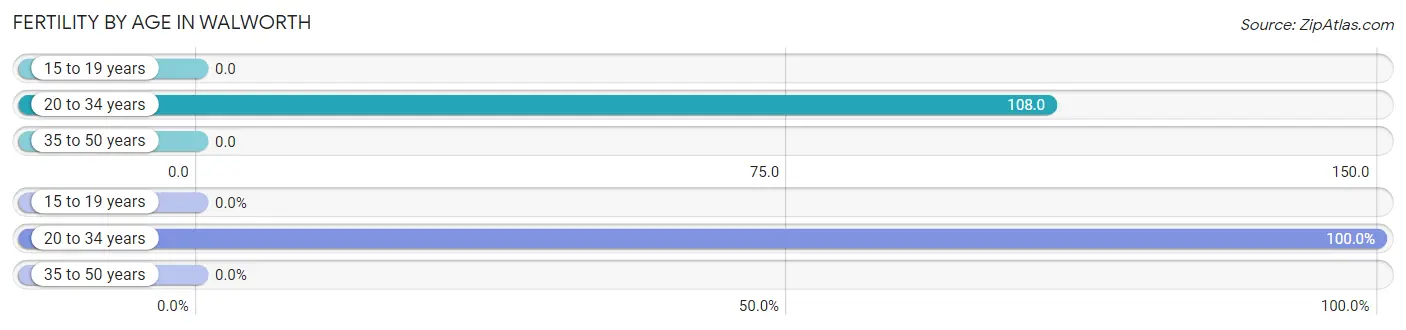
| Age Bracket | Women with Births | Births / 1,000 Women |
| 15 to 19 years | 0 (0.0%) | 0.0 |
| 20 to 34 years | 25 (100.0%) | 108.0 |
| 35 to 50 years | 0 (0.0%) | 0.0 |
| Total | 25 (100.0%) | 40.0 |
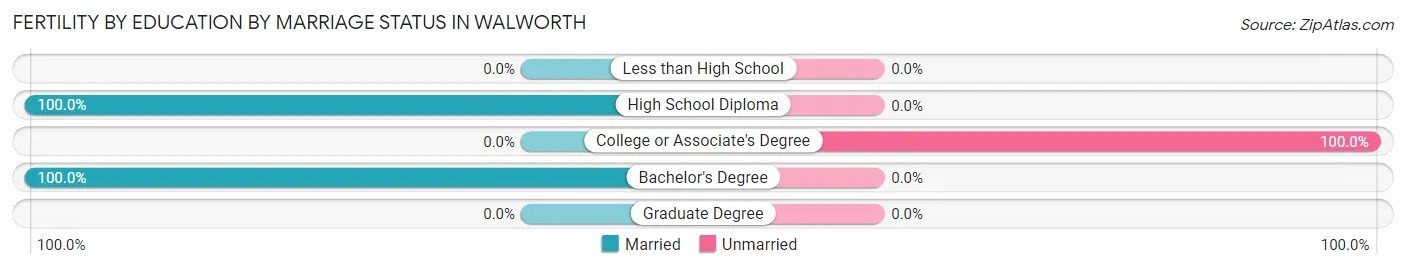
Fertility by Age by Marriage Status in Walworth
84.0% of women with births (25) in Walworth are married. The highest percentage of unmarried women with births falls into 20 to 34 years age bracket with 16.0% of them unmarried at the time of birth, while the lowest percentage of unmarried women with births belong to 20 to 34 years age bracket with 16.0% of them unmarried.
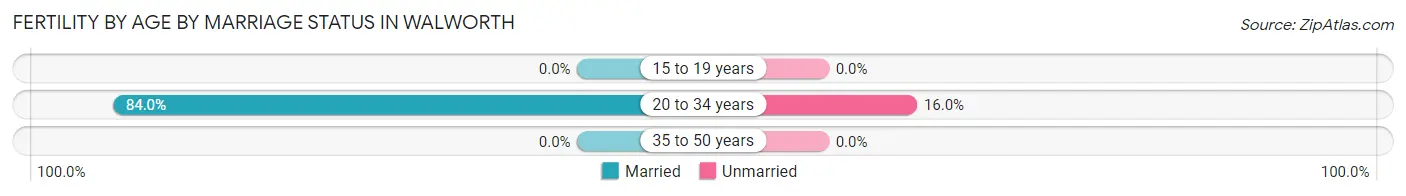
| Age Bracket | Married | Unmarried |
| 15 to 19 years | 0 (0.0%) | 0 (0.0%) |
| 20 to 34 years | 21 (84.0%) | 4 (16.0%) |
| 35 to 50 years | 0 (0.0%) | 0 (0.0%) |
| Total | 21 (84.0%) | 4 (16.0%) |
Fertility by Education in Walworth
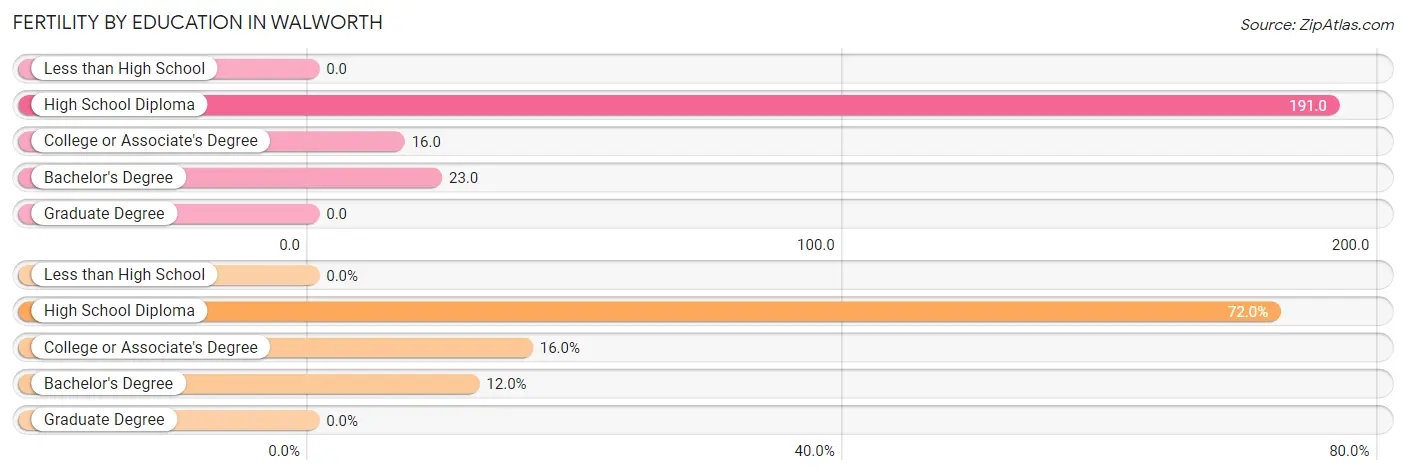
| Educational Attainment | Women with Births | Births / 1,000 Women |
| Less than High School | 0 (0.0%) | 0.0 |
| High School Diploma | 18 (72.0%) | 191.0 |
| College or Associate's Degree | 4 (16.0%) | 16.0 |
| Bachelor's Degree | 3 (12.0%) | 23.0 |
| Graduate Degree | 0 (0.0%) | 0.0 |
| Total | 25 (100.0%) | 40.0 |
Fertility by Education by Marriage Status in Walworth
16.0% of women with births in Walworth are unmarried. Women with the educational attainment of high school diploma are most likely to be married with 100.0% of them married at childbirth, while women with the educational attainment of college or associate's degree are least likely to be married with 100.0% of them unmarried at childbirth.
| Educational Attainment | Married | Unmarried |
| Less than High School | 0 (0.0%) | 0 (0.0%) |
| High School Diploma | 18 (100.0%) | 0 (0.0%) |
| College or Associate's Degree | 0 (0.0%) | 4 (100.0%) |
| Bachelor's Degree | 3 (100.0%) | 0 (0.0%) |
| Graduate Degree | 0 (0.0%) | 0 (0.0%) |
| Total | 21 (84.0%) | 4 (16.0%) |
Employment Characteristics in Walworth
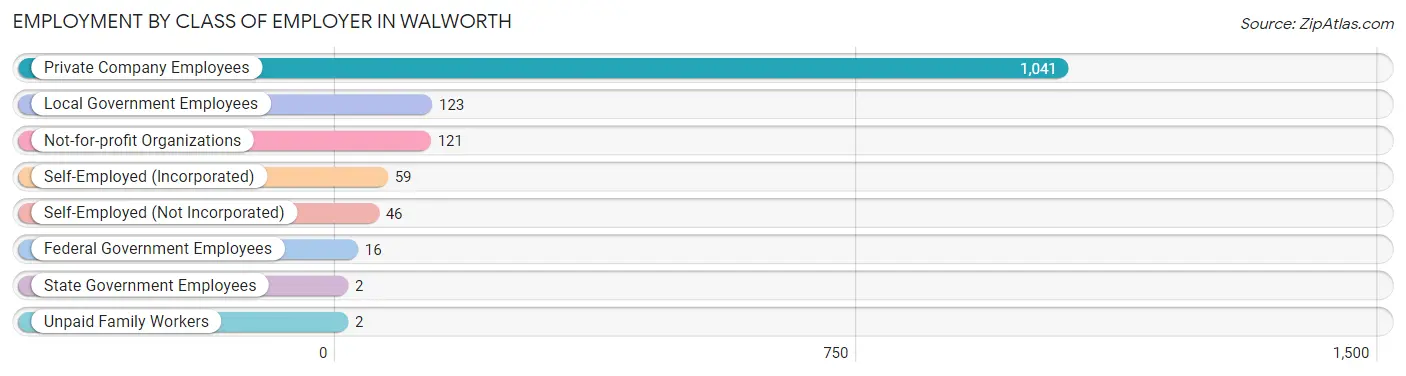
Employment by Class of Employer in Walworth
Among the 1,410 employed individuals in Walworth, private company employees (1,041 | 73.8%), local government employees (123 | 8.7%), and not-for-profit organizations (121 | 8.6%) make up the most common classes of employment.
| Employer Class | # Employees | % Employees |
| Private Company Employees | 1,041 | 73.8% |
| Self-Employed (Incorporated) | 59 | 4.2% |
| Self-Employed (Not Incorporated) | 46 | 3.3% |
| Not-for-profit Organizations | 121 | 8.6% |
| Local Government Employees | 123 | 8.7% |
| State Government Employees | 2 | 0.1% |
| Federal Government Employees | 16 | 1.1% |
| Unpaid Family Workers | 2 | 0.1% |
| Total | 1,410 | 100.0% |
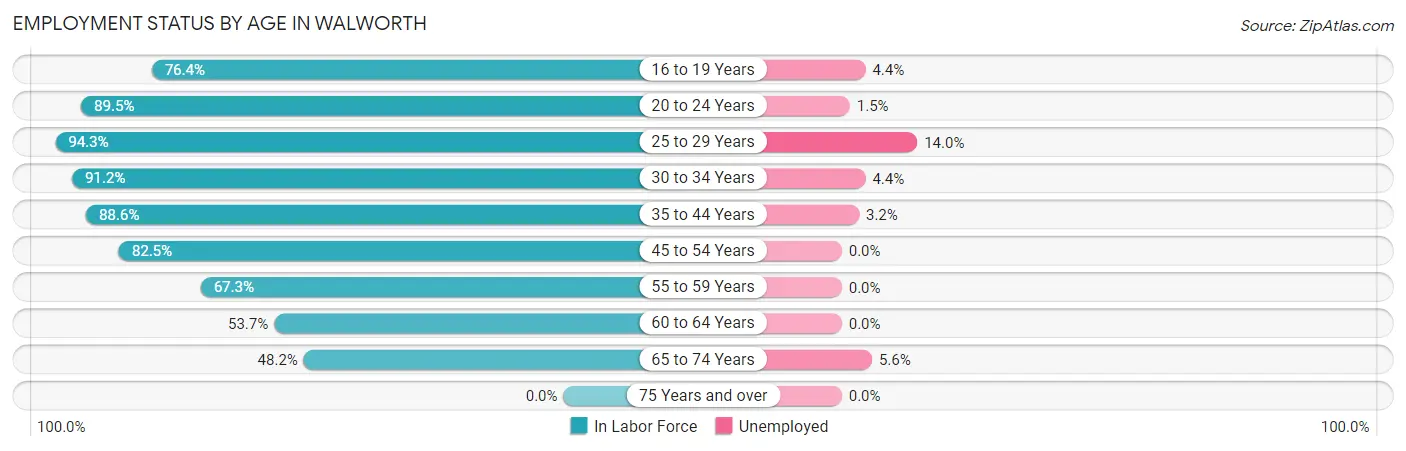
Employment Status by Age in Walworth
According to the labor force statistics for Walworth, out of the total population over 16 years of age (2,098), 70.0% or 1,469 individuals are in the labor force, with 2.9% or 43 of them unemployed. The age group with the highest labor force participation rate is 25 to 29 years, with 94.3% or 100 individuals in the labor force. Within the labor force, the 25 to 29 years age range has the highest percentage of unemployed individuals, with 14.0% or 14 of them being unemployed.
| Age Bracket | In Labor Force | Unemployed |
| 16 to 19 Years | 113 (76.4%) | 5 (4.4%) |
| 20 to 24 Years | 196 (89.5%) | 3 (1.5%) |
| 25 to 29 Years | 100 (94.3%) | 14 (14.0%) |
| 30 to 34 Years | 135 (91.2%) | 6 (4.4%) |
| 35 to 44 Years | 249 (88.6%) | 8 (3.2%) |
| 45 to 54 Years | 364 (82.5%) | 0 (0.0%) |
| 55 to 59 Years | 99 (67.3%) | 0 (0.0%) |
| 60 to 64 Years | 88 (53.7%) | 0 (0.0%) |
| 65 to 74 Years | 124 (48.2%) | 7 (5.6%) |
| 75 Years and over | 0 (0.0%) | 0 (0.0%) |
| Total | 1,469 (70.0%) | 43 (2.9%) |
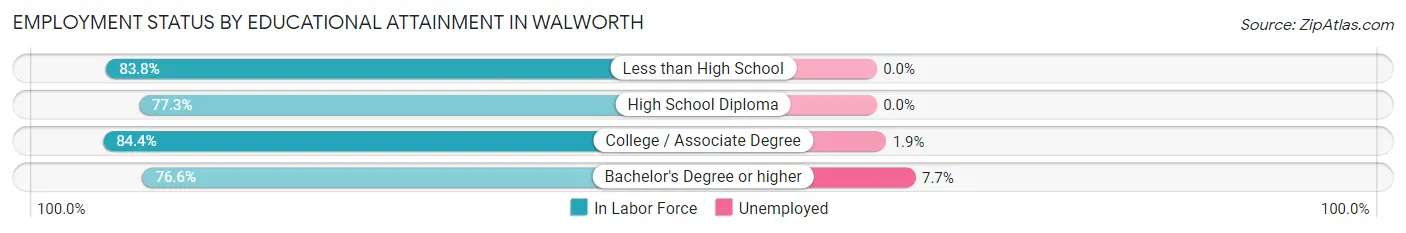
Employment Status by Educational Attainment in Walworth
According to labor force statistics for Walworth, 80.4% of individuals (1,035) out of the total population between 25 and 64 years of age (1,287) are in the labor force, with 2.7% or 28 of them being unemployed. The group with the highest labor force participation rate are those with the educational attainment of college / associate degree, with 84.4% or 412 individuals in the labor force. Within the labor force, individuals with bachelor's degree or higher education have the highest percentage of unemployment, with 7.7% or 20 of them being unemployed.
| Educational Attainment | In Labor Force | Unemployed |
| Less than High School | 98 (83.8%) | 0 (0.0%) |
| High School Diploma | 266 (77.3%) | 0 (0.0%) |
| College / Associate Degree | 412 (84.4%) | 9 (1.9%) |
| Bachelor's Degree or higher | 259 (76.6%) | 26 (7.7%) |
| Total | 1,035 (80.4%) | 35 (2.7%) |
Employment Occupations by Sex in Walworth
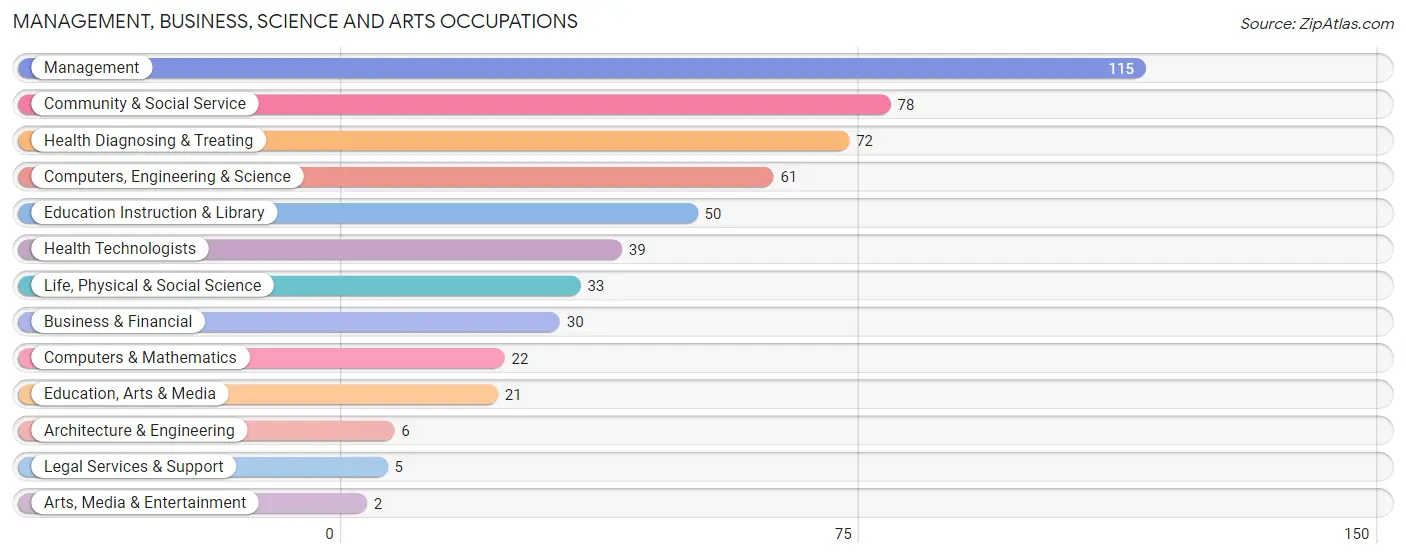
Management, Business, Science and Arts Occupations
The most common Management, Business, Science and Arts occupations in Walworth are Management (115 | 8.1%), Community & Social Service (78 | 5.5%), Health Diagnosing & Treating (72 | 5.1%), Computers, Engineering & Science (61 | 4.3%), and Education Instruction & Library (50 | 3.5%).
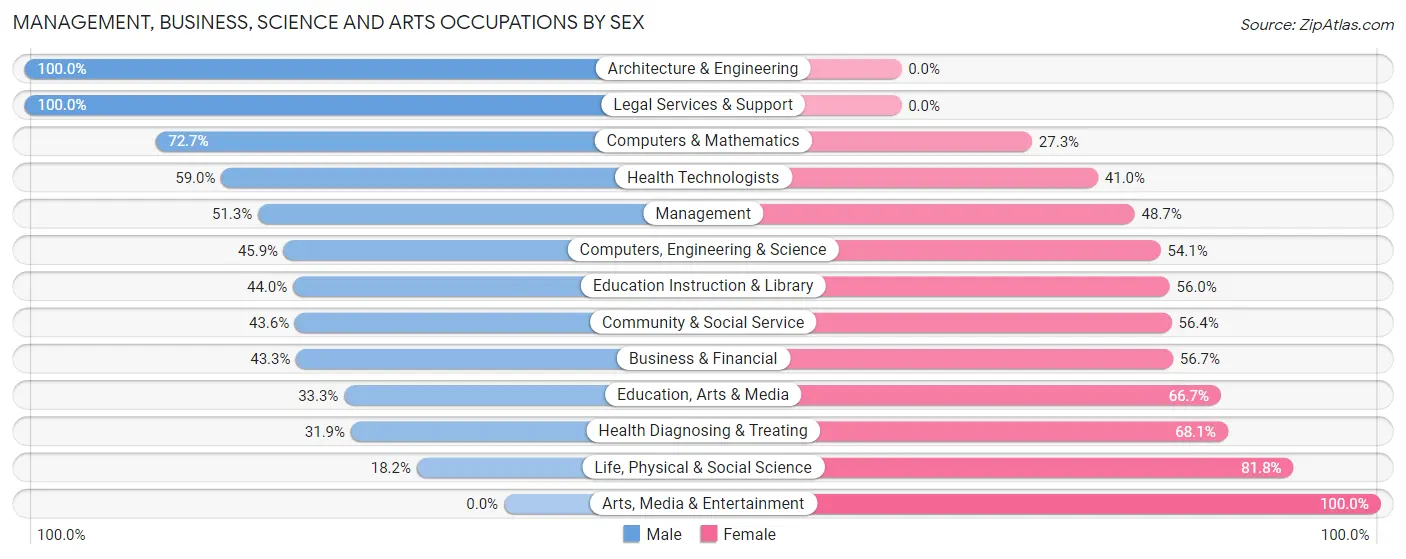
Management, Business, Science and Arts Occupations by Sex
Within the Management, Business, Science and Arts occupations in Walworth, the most male-oriented occupations are Architecture & Engineering (100.0%), Legal Services & Support (100.0%), and Computers & Mathematics (72.7%), while the most female-oriented occupations are Arts, Media & Entertainment (100.0%), Life, Physical & Social Science (81.8%), and Health Diagnosing & Treating (68.1%).
| Occupation | Male | Female |
| Management | 59 (51.3%) | 56 (48.7%) |
| Business & Financial | 13 (43.3%) | 17 (56.7%) |
| Computers, Engineering & Science | 28 (45.9%) | 33 (54.1%) |
| Computers & Mathematics | 16 (72.7%) | 6 (27.3%) |
| Architecture & Engineering | 6 (100.0%) | 0 (0.0%) |
| Life, Physical & Social Science | 6 (18.2%) | 27 (81.8%) |
| Community & Social Service | 34 (43.6%) | 44 (56.4%) |
| Education, Arts & Media | 7 (33.3%) | 14 (66.7%) |
| Legal Services & Support | 5 (100.0%) | 0 (0.0%) |
| Education Instruction & Library | 22 (44.0%) | 28 (56.0%) |
| Arts, Media & Entertainment | 0 (0.0%) | 2 (100.0%) |
| Health Diagnosing & Treating | 23 (31.9%) | 49 (68.1%) |
| Health Technologists | 23 (59.0%) | 16 (41.0%) |
| Total (Category) | 157 (44.1%) | 199 (55.9%) |
| Total (Overall) | 678 (47.6%) | 747 (52.4%) |
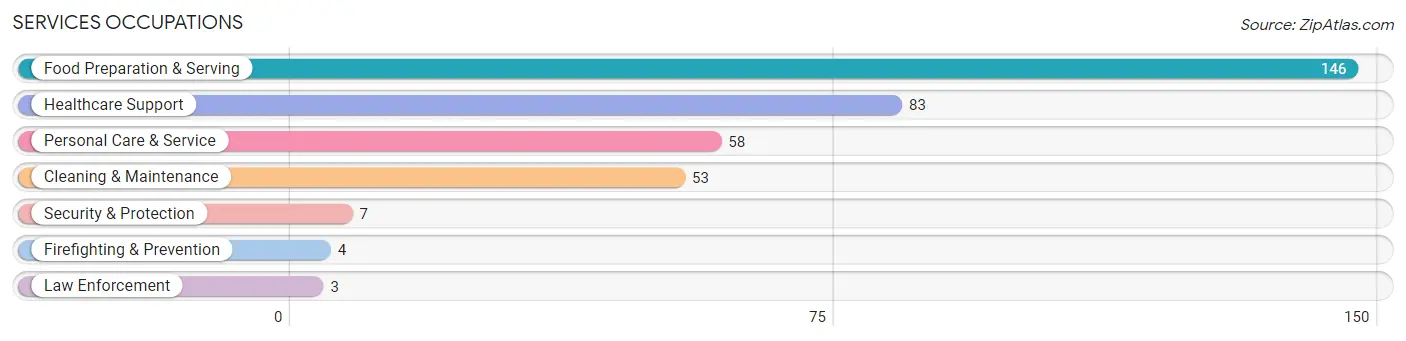
Services Occupations
The most common Services occupations in Walworth are Food Preparation & Serving (146 | 10.2%), Healthcare Support (83 | 5.8%), Personal Care & Service (58 | 4.1%), Cleaning & Maintenance (53 | 3.7%), and Security & Protection (7 | 0.5%).
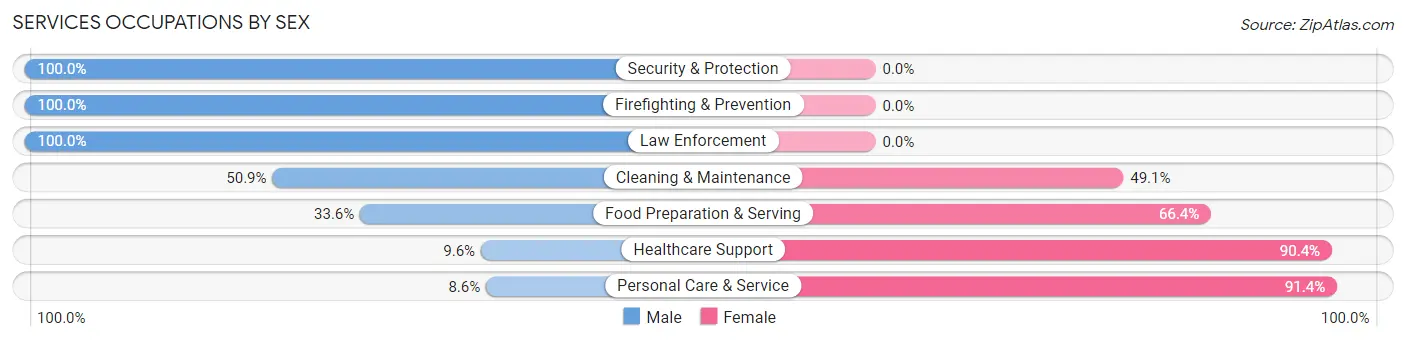
Services Occupations by Sex
Within the Services occupations in Walworth, the most male-oriented occupations are Security & Protection (100.0%), Firefighting & Prevention (100.0%), and Law Enforcement (100.0%), while the most female-oriented occupations are Personal Care & Service (91.4%), Healthcare Support (90.4%), and Food Preparation & Serving (66.4%).
| Occupation | Male | Female |
| Healthcare Support | 8 (9.6%) | 75 (90.4%) |
| Security & Protection | 7 (100.0%) | 0 (0.0%) |
| Firefighting & Prevention | 4 (100.0%) | 0 (0.0%) |
| Law Enforcement | 3 (100.0%) | 0 (0.0%) |
| Food Preparation & Serving | 49 (33.6%) | 97 (66.4%) |
| Cleaning & Maintenance | 27 (50.9%) | 26 (49.1%) |
| Personal Care & Service | 5 (8.6%) | 53 (91.4%) |
| Total (Category) | 96 (27.7%) | 251 (72.3%) |
| Total (Overall) | 678 (47.6%) | 747 (52.4%) |
Sales and Office Occupations
The most common Sales and Office occupations in Walworth are Office & Administration (173 | 12.1%), and Sales & Related (58 | 4.1%).
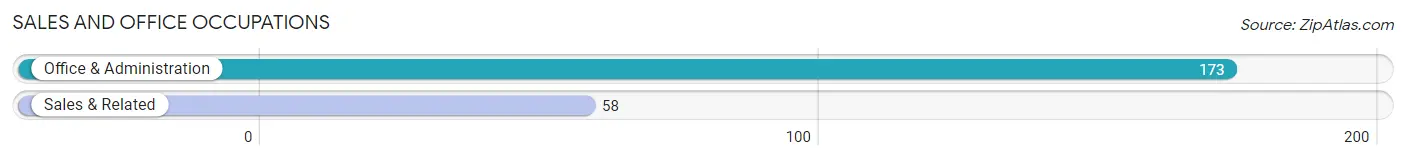
Sales and Office Occupations by Sex

| Occupation | Male | Female |
| Sales & Related | 32 (55.2%) | 26 (44.8%) |
| Office & Administration | 25 (14.4%) | 148 (85.6%) |
| Total (Category) | 57 (24.7%) | 174 (75.3%) |
| Total (Overall) | 678 (47.6%) | 747 (52.4%) |
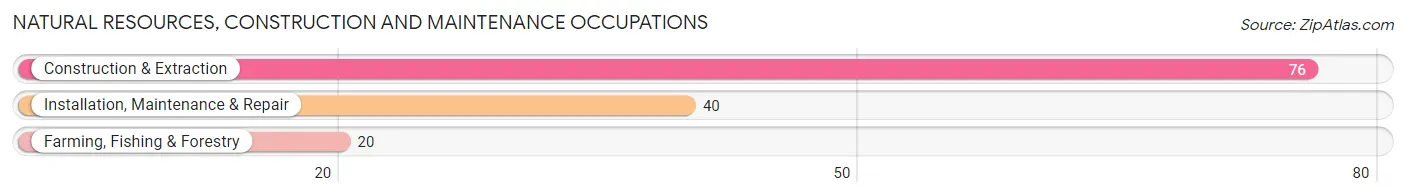
Natural Resources, Construction and Maintenance Occupations
The most common Natural Resources, Construction and Maintenance occupations in Walworth are Construction & Extraction (76 | 5.3%), Installation, Maintenance & Repair (40 | 2.8%), and Farming, Fishing & Forestry (20 | 1.4%).
Natural Resources, Construction and Maintenance Occupations by Sex
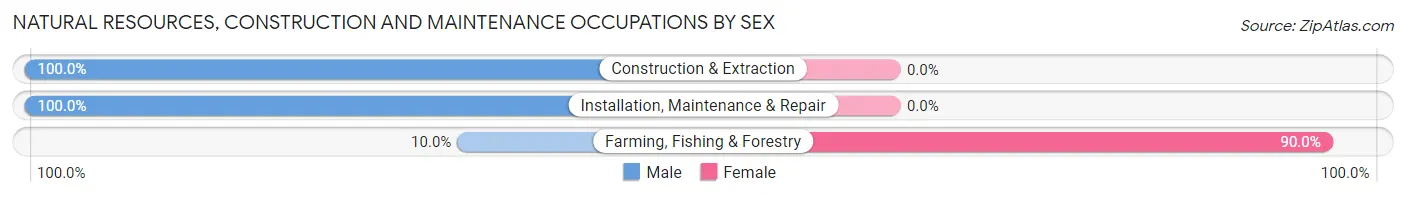
| Occupation | Male | Female |
| Farming, Fishing & Forestry | 2 (10.0%) | 18 (90.0%) |
| Construction & Extraction | 76 (100.0%) | 0 (0.0%) |
| Installation, Maintenance & Repair | 40 (100.0%) | 0 (0.0%) |
| Total (Category) | 118 (86.8%) | 18 (13.2%) |
| Total (Overall) | 678 (47.6%) | 747 (52.4%) |
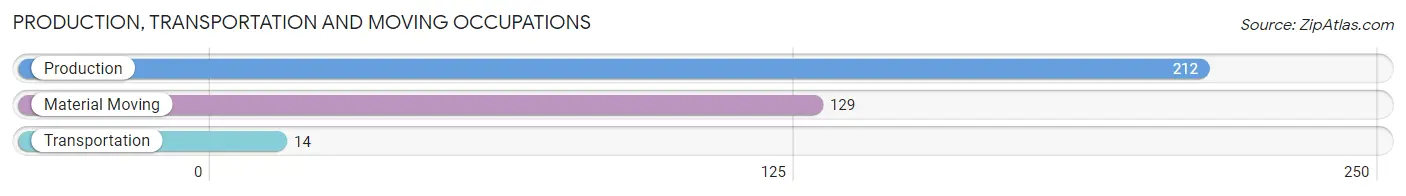
Production, Transportation and Moving Occupations
The most common Production, Transportation and Moving occupations in Walworth are Production (212 | 14.9%), Material Moving (129 | 9.0%), and Transportation (14 | 1.0%).
Production, Transportation and Moving Occupations by Sex
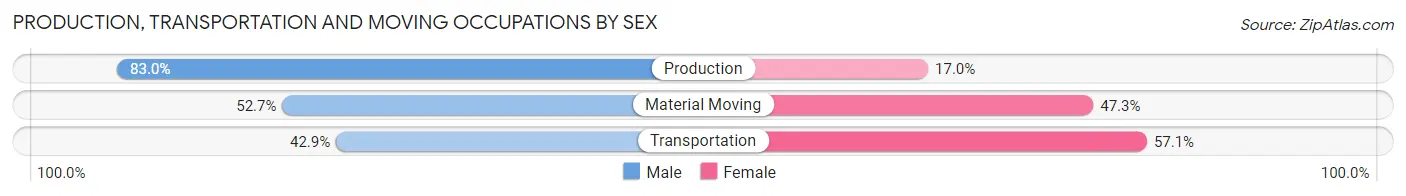
| Occupation | Male | Female |
| Production | 176 (83.0%) | 36 (17.0%) |
| Transportation | 6 (42.9%) | 8 (57.1%) |
| Material Moving | 68 (52.7%) | 61 (47.3%) |
| Total (Category) | 250 (70.4%) | 105 (29.6%) |
| Total (Overall) | 678 (47.6%) | 747 (52.4%) |
Employment Industries by Sex in Walworth
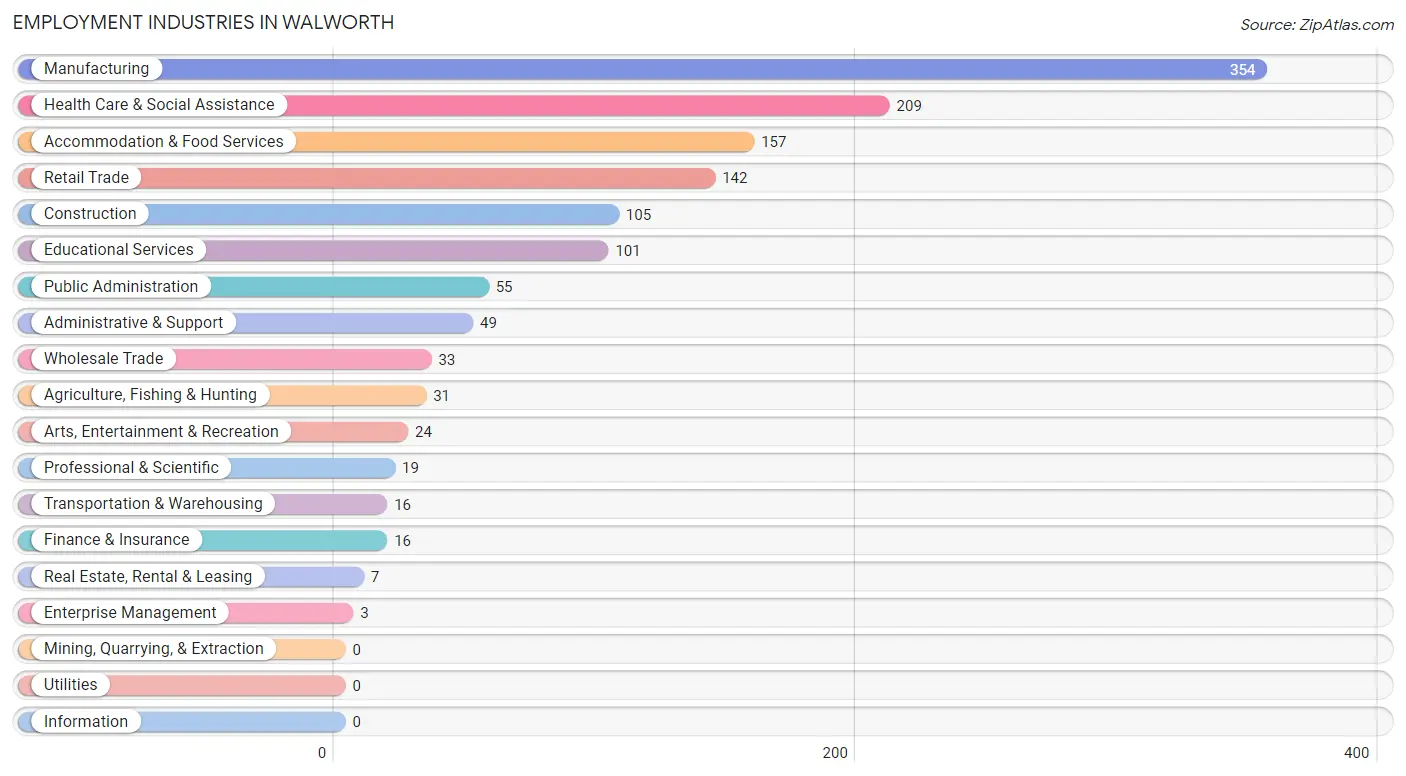
Employment Industries in Walworth
The major employment industries in Walworth include Manufacturing (354 | 24.8%), Health Care & Social Assistance (209 | 14.7%), Accommodation & Food Services (157 | 11.0%), Retail Trade (142 | 10.0%), and Construction (105 | 7.4%).
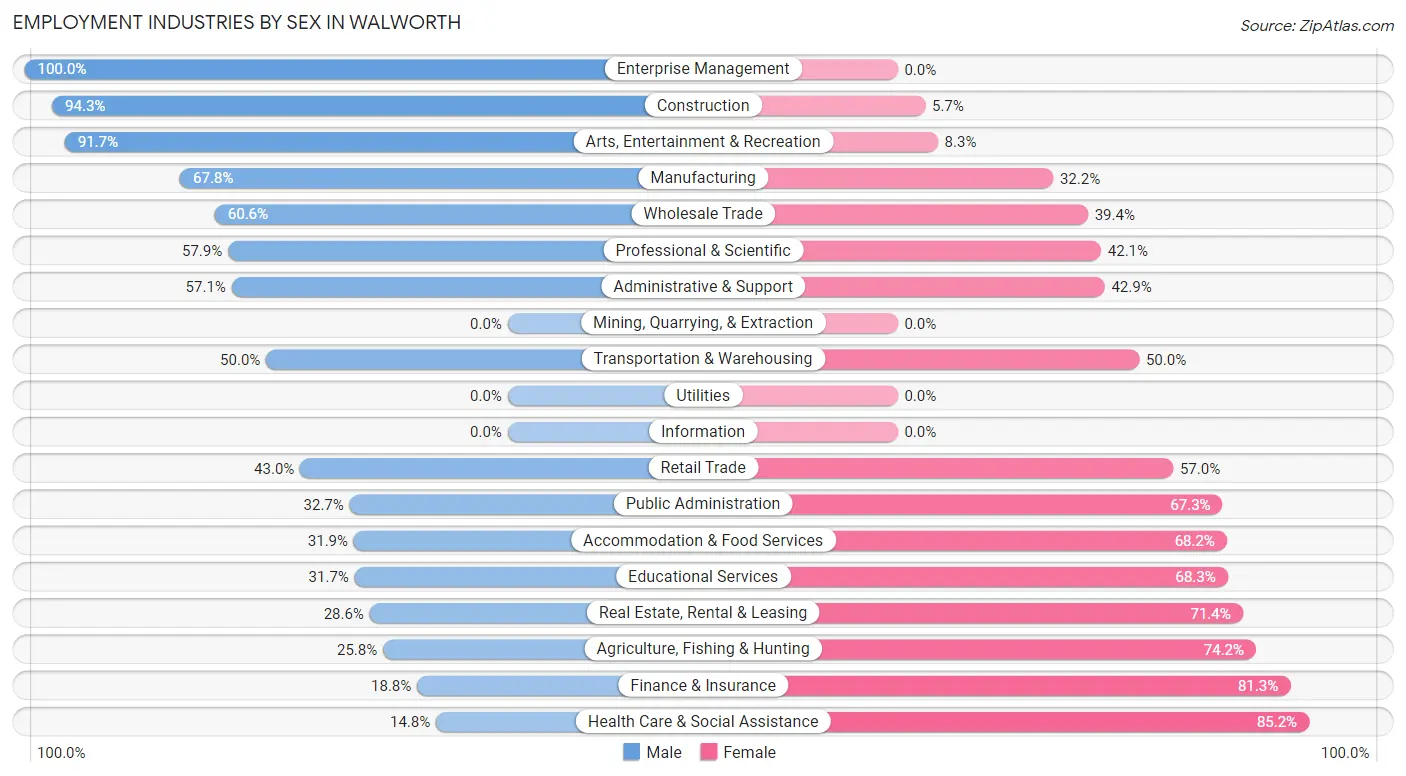
Employment Industries by Sex in Walworth
The Walworth industries that see more men than women are Enterprise Management (100.0%), Construction (94.3%), and Arts, Entertainment & Recreation (91.7%), whereas the industries that tend to have a higher number of women are Health Care & Social Assistance (85.2%), Finance & Insurance (81.2%), and Agriculture, Fishing & Hunting (74.2%).
| Industry | Male | Female |
| Agriculture, Fishing & Hunting | 8 (25.8%) | 23 (74.2%) |
| Mining, Quarrying, & Extraction | 0 (0.0%) | 0 (0.0%) |
| Construction | 99 (94.3%) | 6 (5.7%) |
| Manufacturing | 240 (67.8%) | 114 (32.2%) |
| Wholesale Trade | 20 (60.6%) | 13 (39.4%) |
| Retail Trade | 61 (43.0%) | 81 (57.0%) |
| Transportation & Warehousing | 8 (50.0%) | 8 (50.0%) |
| Utilities | 0 (0.0%) | 0 (0.0%) |
| Information | 0 (0.0%) | 0 (0.0%) |
| Finance & Insurance | 3 (18.8%) | 13 (81.2%) |
| Real Estate, Rental & Leasing | 2 (28.6%) | 5 (71.4%) |
| Professional & Scientific | 11 (57.9%) | 8 (42.1%) |
| Enterprise Management | 3 (100.0%) | 0 (0.0%) |
| Administrative & Support | 28 (57.1%) | 21 (42.9%) |
| Educational Services | 32 (31.7%) | 69 (68.3%) |
| Health Care & Social Assistance | 31 (14.8%) | 178 (85.2%) |
| Arts, Entertainment & Recreation | 22 (91.7%) | 2 (8.3%) |
| Accommodation & Food Services | 50 (31.9%) | 107 (68.1%) |
| Public Administration | 18 (32.7%) | 37 (67.3%) |
| Total | 678 (47.6%) | 747 (52.4%) |
Education in Walworth
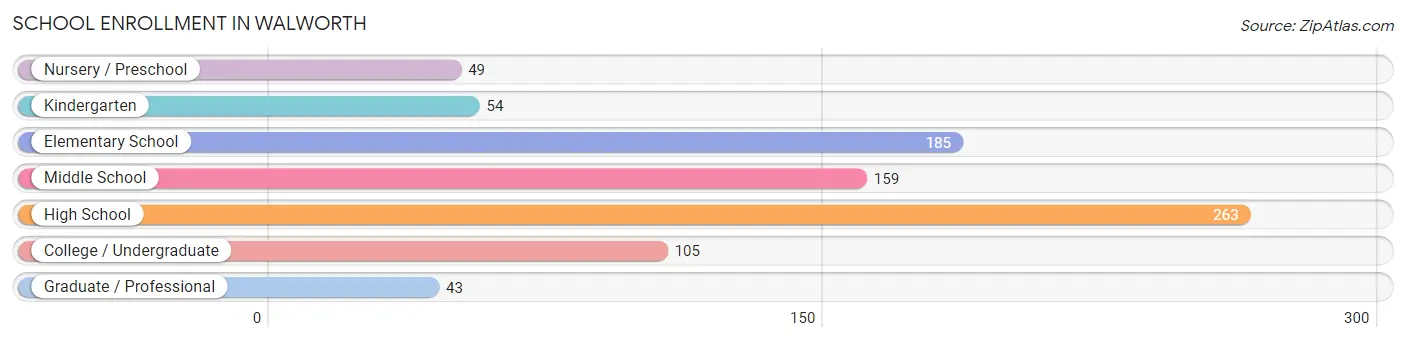
School Enrollment in Walworth
The most common levels of schooling among the 858 students in Walworth are high school (263 | 30.6%), elementary school (185 | 21.6%), and middle school (159 | 18.5%).
| School Level | # Students | % Students |
| Nursery / Preschool | 49 | 5.7% |
| Kindergarten | 54 | 6.3% |
| Elementary School | 185 | 21.6% |
| Middle School | 159 | 18.5% |
| High School | 263 | 30.6% |
| College / Undergraduate | 105 | 12.2% |
| Graduate / Professional | 43 | 5.0% |
| Total | 858 | 100.0% |
School Enrollment by Age by Funding Source in Walworth
Out of a total of 858 students who are enrolled in schools in Walworth, 195 (22.7%) attend a private institution, while the remaining 663 (77.3%) are enrolled in public schools. The age group of 20 to 24 year olds has the highest likelihood of being enrolled in private schools, with 70 (60.9% in the age bracket) enrolled. Conversely, the age group of 18 to 19 year olds has the lowest likelihood of being enrolled in a private school, with 34 (100.0% in the age bracket) attending a public institution.
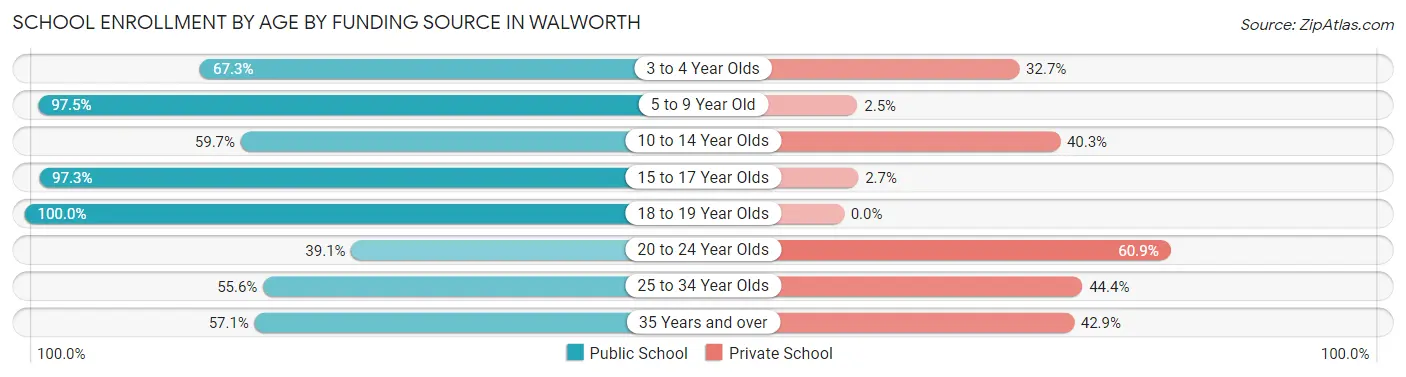
| Age Bracket | Public School | Private School |
| 3 to 4 Year Olds | 35 (67.3%) | 17 (32.7%) |
| 5 to 9 Year Old | 192 (97.5%) | 5 (2.5%) |
| 10 to 14 Year Olds | 129 (59.7%) | 87 (40.3%) |
| 15 to 17 Year Olds | 215 (97.3%) | 6 (2.7%) |
| 18 to 19 Year Olds | 34 (100.0%) | 0 (0.0%) |
| 20 to 24 Year Olds | 45 (39.1%) | 70 (60.9%) |
| 25 to 34 Year Olds | 5 (55.6%) | 4 (44.4%) |
| 35 Years and over | 8 (57.1%) | 6 (42.9%) |
| Total | 663 (77.3%) | 195 (22.7%) |
Educational Attainment by Field of Study in Walworth
Education (90 | 19.4%), liberal arts & history (57 | 12.3%), social sciences (54 | 11.6%), literature & languages (54 | 11.6%), and engineering (43 | 9.2%) are the most common fields of study among 465 individuals in Walworth who have obtained a bachelor's degree or higher.
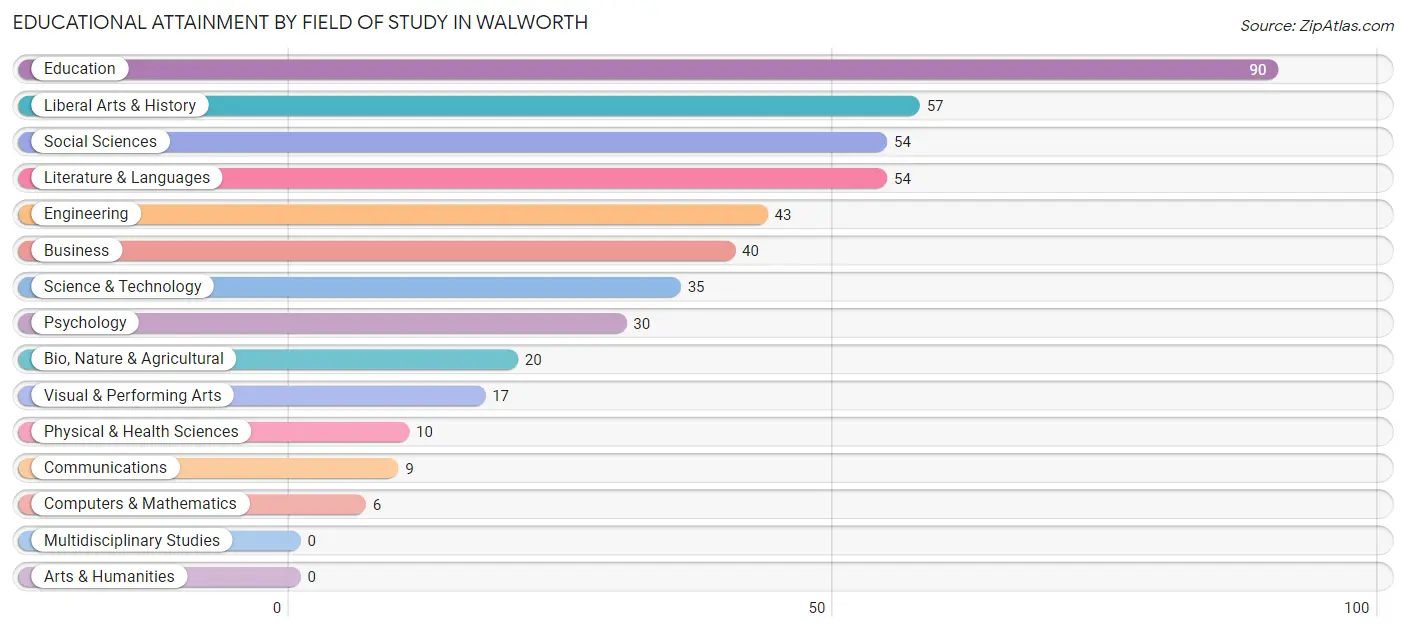
| Field of Study | # Graduates | % Graduates |
| Computers & Mathematics | 6 | 1.3% |
| Bio, Nature & Agricultural | 20 | 4.3% |
| Physical & Health Sciences | 10 | 2.1% |
| Psychology | 30 | 6.5% |
| Social Sciences | 54 | 11.6% |
| Engineering | 43 | 9.2% |
| Multidisciplinary Studies | 0 | 0.0% |
| Science & Technology | 35 | 7.5% |
| Business | 40 | 8.6% |
| Education | 90 | 19.4% |
| Literature & Languages | 54 | 11.6% |
| Liberal Arts & History | 57 | 12.3% |
| Visual & Performing Arts | 17 | 3.7% |
| Communications | 9 | 1.9% |
| Arts & Humanities | 0 | 0.0% |
| Total | 465 | 100.0% |
Transportation & Commute in Walworth
Vehicle Availability by Sex in Walworth
The most prevalent vehicle ownership categories in Walworth are males with 2 vehicles (339, accounting for 50.9%) and females with 2 vehicles (270, making up 45.6%).
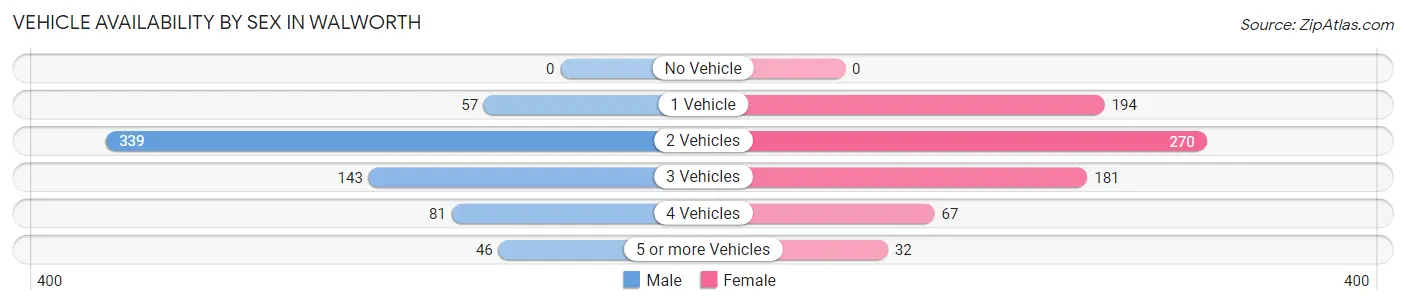
| Vehicles Available | Male | Female |
| No Vehicle | 0 (0.0%) | 0 (0.0%) |
| 1 Vehicle | 57 (8.6%) | 194 (26.1%) |
| 2 Vehicles | 339 (50.9%) | 270 (36.3%) |
| 3 Vehicles | 143 (21.5%) | 181 (24.3%) |
| 4 Vehicles | 81 (12.2%) | 67 (9.0%) |
| 5 or more Vehicles | 46 (6.9%) | 32 (4.3%) |
| Total | 666 (100.0%) | 744 (100.0%) |
Commute Time in Walworth
The most frequently occuring commute durations in Walworth are 15 to 19 minutes (267 commuters, 19.7%), 20 to 24 minutes (199 commuters, 14.7%), and 5 to 9 minutes (165 commuters, 12.2%).
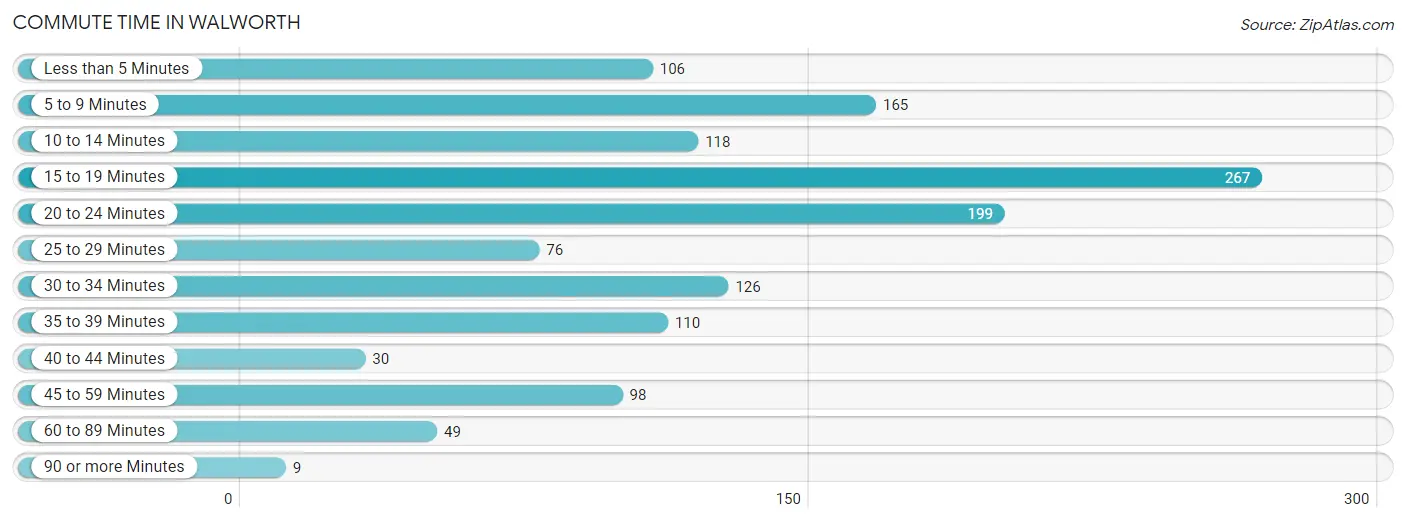
| Commute Time | # Commuters | % Commuters |
| Less than 5 Minutes | 106 | 7.8% |
| 5 to 9 Minutes | 165 | 12.2% |
| 10 to 14 Minutes | 118 | 8.7% |
| 15 to 19 Minutes | 267 | 19.7% |
| 20 to 24 Minutes | 199 | 14.7% |
| 25 to 29 Minutes | 76 | 5.6% |
| 30 to 34 Minutes | 126 | 9.3% |
| 35 to 39 Minutes | 110 | 8.1% |
| 40 to 44 Minutes | 30 | 2.2% |
| 45 to 59 Minutes | 98 | 7.2% |
| 60 to 89 Minutes | 49 | 3.6% |
| 90 or more Minutes | 9 | 0.7% |
Commute Time by Sex in Walworth
The most common commute times in Walworth are 15 to 19 minutes (111 commuters, 17.1%) for males and 15 to 19 minutes (156 commuters, 22.2%) for females.
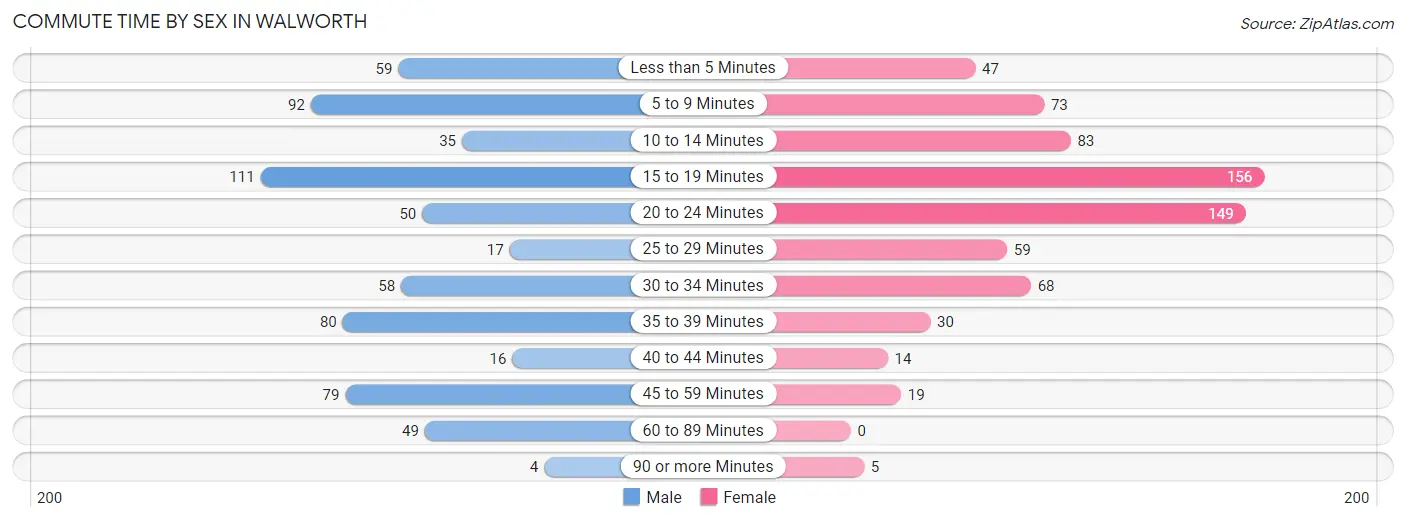
| Commute Time | Male | Female |
| Less than 5 Minutes | 59 (9.1%) | 47 (6.7%) |
| 5 to 9 Minutes | 92 (14.1%) | 73 (10.4%) |
| 10 to 14 Minutes | 35 (5.4%) | 83 (11.8%) |
| 15 to 19 Minutes | 111 (17.1%) | 156 (22.2%) |
| 20 to 24 Minutes | 50 (7.7%) | 149 (21.2%) |
| 25 to 29 Minutes | 17 (2.6%) | 59 (8.4%) |
| 30 to 34 Minutes | 58 (8.9%) | 68 (9.7%) |
| 35 to 39 Minutes | 80 (12.3%) | 30 (4.3%) |
| 40 to 44 Minutes | 16 (2.5%) | 14 (2.0%) |
| 45 to 59 Minutes | 79 (12.1%) | 19 (2.7%) |
| 60 to 89 Minutes | 49 (7.5%) | 0 (0.0%) |
| 90 or more Minutes | 4 (0.6%) | 5 (0.7%) |
Time of Departure to Work by Sex in Walworth
The most frequent times of departure to work in Walworth are 12:00 AM to 4:59 AM (110, 16.9%) for males and 12:00 AM to 4:59 AM (93, 13.2%) for females.
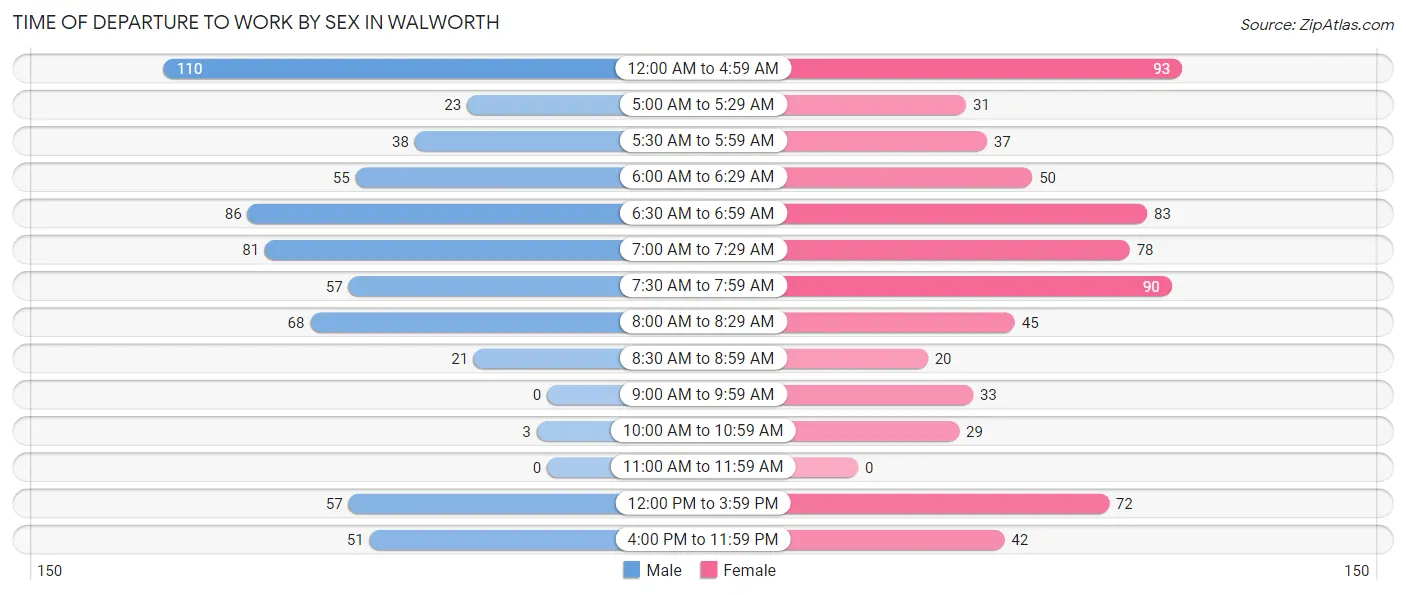
| Time of Departure | Male | Female |
| 12:00 AM to 4:59 AM | 110 (16.9%) | 93 (13.2%) |
| 5:00 AM to 5:29 AM | 23 (3.5%) | 31 (4.4%) |
| 5:30 AM to 5:59 AM | 38 (5.9%) | 37 (5.3%) |
| 6:00 AM to 6:29 AM | 55 (8.5%) | 50 (7.1%) |
| 6:30 AM to 6:59 AM | 86 (13.2%) | 83 (11.8%) |
| 7:00 AM to 7:29 AM | 81 (12.5%) | 78 (11.1%) |
| 7:30 AM to 7:59 AM | 57 (8.8%) | 90 (12.8%) |
| 8:00 AM to 8:29 AM | 68 (10.5%) | 45 (6.4%) |
| 8:30 AM to 8:59 AM | 21 (3.2%) | 20 (2.8%) |
| 9:00 AM to 9:59 AM | 0 (0.0%) | 33 (4.7%) |
| 10:00 AM to 10:59 AM | 3 (0.5%) | 29 (4.1%) |
| 11:00 AM to 11:59 AM | 0 (0.0%) | 0 (0.0%) |
| 12:00 PM to 3:59 PM | 57 (8.8%) | 72 (10.2%) |
| 4:00 PM to 11:59 PM | 51 (7.9%) | 42 (6.0%) |
| Total | 650 (100.0%) | 703 (100.0%) |
Housing Occupancy in Walworth
Occupancy by Ownership in Walworth
Of the total 1,021 dwellings in Walworth, owner-occupied units account for 588 (57.6%), while renter-occupied units make up 433 (42.4%).
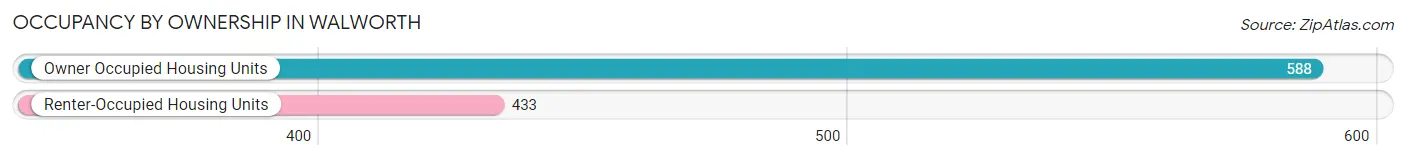
| Occupancy | # Housing Units | % Housing Units |
| Owner Occupied Housing Units | 588 | 57.6% |
| Renter-Occupied Housing Units | 433 | 42.4% |
| Total Occupied Housing Units | 1,021 | 100.0% |
Occupancy by Household Size in Walworth
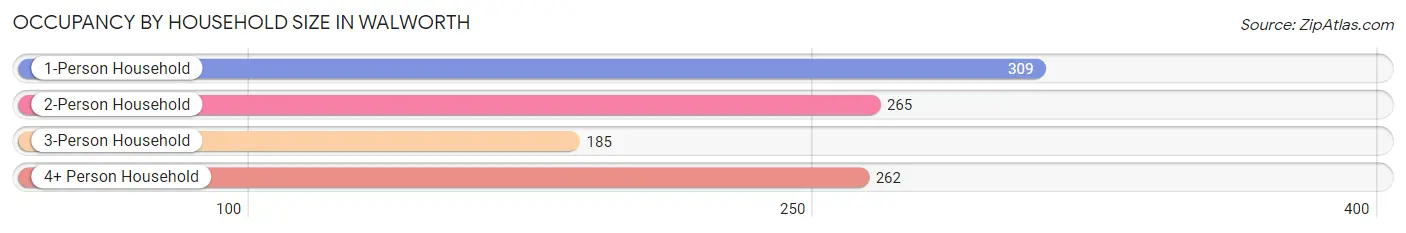
| Household Size | # Housing Units | % Housing Units |
| 1-Person Household | 309 | 30.3% |
| 2-Person Household | 265 | 26.0% |
| 3-Person Household | 185 | 18.1% |
| 4+ Person Household | 262 | 25.7% |
| Total Housing Units | 1,021 | 100.0% |
Occupancy by Ownership by Household Size in Walworth
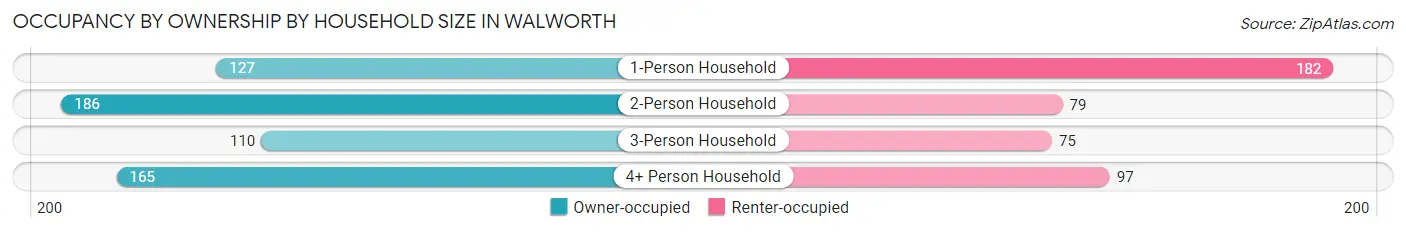
| Household Size | Owner-occupied | Renter-occupied |
| 1-Person Household | 127 (41.1%) | 182 (58.9%) |
| 2-Person Household | 186 (70.2%) | 79 (29.8%) |
| 3-Person Household | 110 (59.5%) | 75 (40.5%) |
| 4+ Person Household | 165 (63.0%) | 97 (37.0%) |
| Total Housing Units | 588 (57.6%) | 433 (42.4%) |
Occupancy by Educational Attainment in Walworth
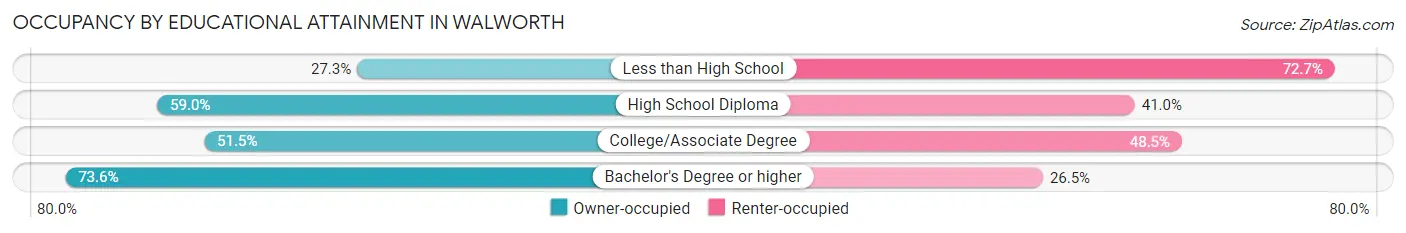
| Household Size | Owner-occupied | Renter-occupied |
| Less than High School | 15 (27.3%) | 40 (72.7%) |
| High School Diploma | 174 (59.0%) | 121 (41.0%) |
| College/Associate Degree | 221 (51.5%) | 208 (48.5%) |
| Bachelor's Degree or higher | 178 (73.6%) | 64 (26.5%) |
Occupancy by Age of Householder in Walworth
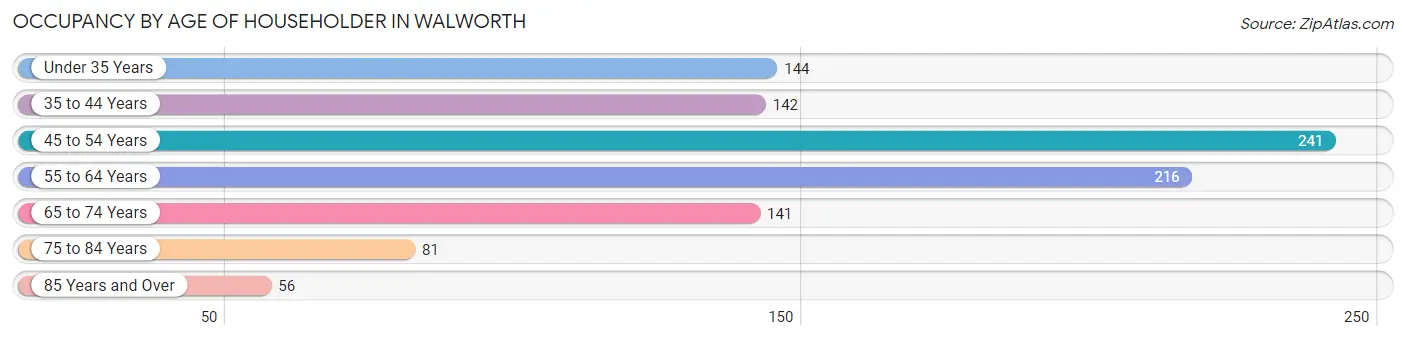
| Age Bracket | # Households | % Households |
| Under 35 Years | 144 | 14.1% |
| 35 to 44 Years | 142 | 13.9% |
| 45 to 54 Years | 241 | 23.6% |
| 55 to 64 Years | 216 | 21.2% |
| 65 to 74 Years | 141 | 13.8% |
| 75 to 84 Years | 81 | 7.9% |
| 85 Years and Over | 56 | 5.5% |
| Total | 1,021 | 100.0% |
Housing Finances in Walworth
Median Income by Occupancy in Walworth
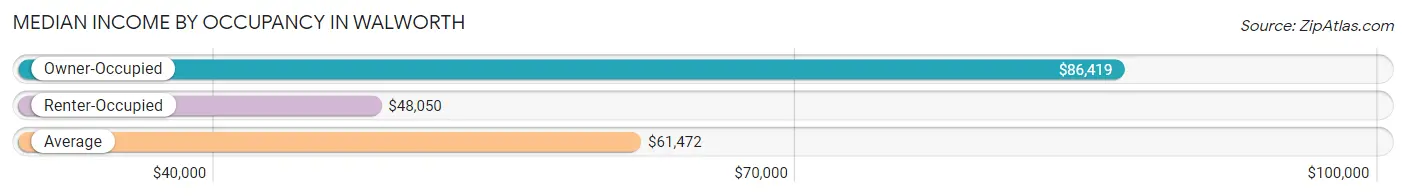
| Occupancy Type | # Households | Median Income |
| Owner-Occupied | 588 (57.6%) | $86,419 |
| Renter-Occupied | 433 (42.4%) | $48,050 |
| Average | 1,021 (100.0%) | $61,472 |
Occupancy by Householder Income Bracket in Walworth
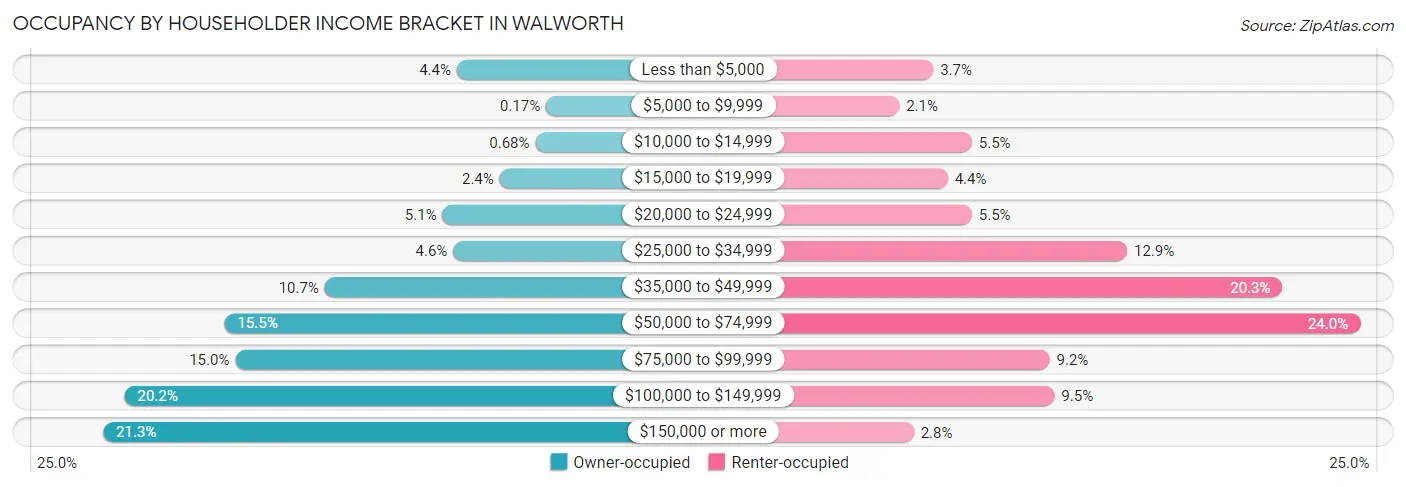
| Income Bracket | Owner-occupied | Renter-occupied |
| Less than $5,000 | 26 (4.4%) | 16 (3.7%) |
| $5,000 to $9,999 | 1 (0.2%) | 9 (2.1%) |
| $10,000 to $14,999 | 4 (0.7%) | 24 (5.5%) |
| $15,000 to $19,999 | 14 (2.4%) | 19 (4.4%) |
| $20,000 to $24,999 | 30 (5.1%) | 24 (5.5%) |
| $25,000 to $34,999 | 27 (4.6%) | 56 (12.9%) |
| $35,000 to $49,999 | 63 (10.7%) | 88 (20.3%) |
| $50,000 to $74,999 | 91 (15.5%) | 104 (24.0%) |
| $75,000 to $99,999 | 88 (15.0%) | 40 (9.2%) |
| $100,000 to $149,999 | 119 (20.2%) | 41 (9.5%) |
| $150,000 or more | 125 (21.3%) | 12 (2.8%) |
| Total | 588 (100.0%) | 433 (100.0%) |
Monthly Housing Cost Tiers in Walworth
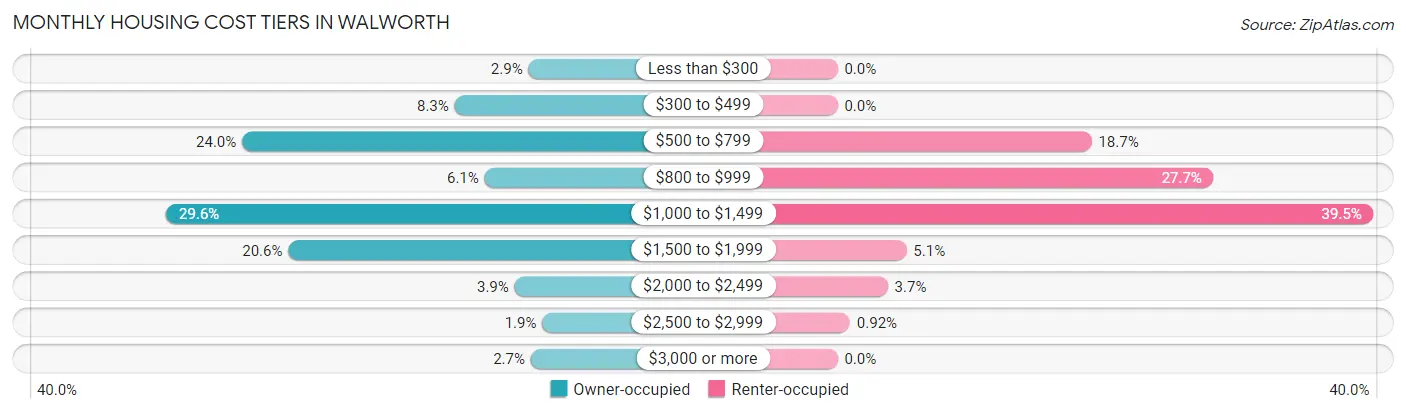
| Monthly Cost | Owner-occupied | Renter-occupied |
| Less than $300 | 17 (2.9%) | 0 (0.0%) |
| $300 to $499 | 49 (8.3%) | 0 (0.0%) |
| $500 to $799 | 141 (24.0%) | 81 (18.7%) |
| $800 to $999 | 36 (6.1%) | 120 (27.7%) |
| $1,000 to $1,499 | 174 (29.6%) | 171 (39.5%) |
| $1,500 to $1,999 | 121 (20.6%) | 22 (5.1%) |
| $2,000 to $2,499 | 23 (3.9%) | 16 (3.7%) |
| $2,500 to $2,999 | 11 (1.9%) | 4 (0.9%) |
| $3,000 or more | 16 (2.7%) | 0 (0.0%) |
| Total | 588 (100.0%) | 433 (100.0%) |
Physical Housing Characteristics in Walworth
Housing Structures in Walworth
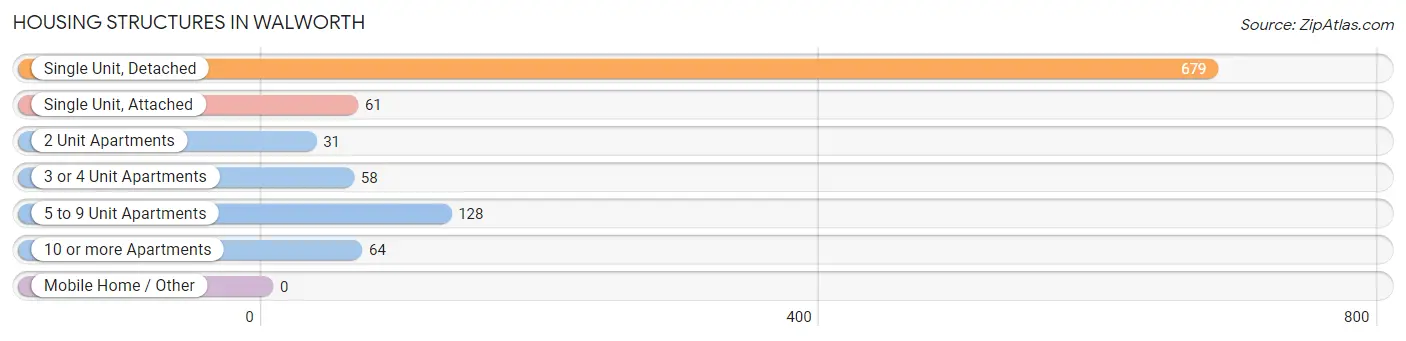
| Structure Type | # Housing Units | % Housing Units |
| Single Unit, Detached | 679 | 66.5% |
| Single Unit, Attached | 61 | 6.0% |
| 2 Unit Apartments | 31 | 3.0% |
| 3 or 4 Unit Apartments | 58 | 5.7% |
| 5 to 9 Unit Apartments | 128 | 12.5% |
| 10 or more Apartments | 64 | 6.3% |
| Mobile Home / Other | 0 | 0.0% |
| Total | 1,021 | 100.0% |
Housing Structures by Occupancy in Walworth
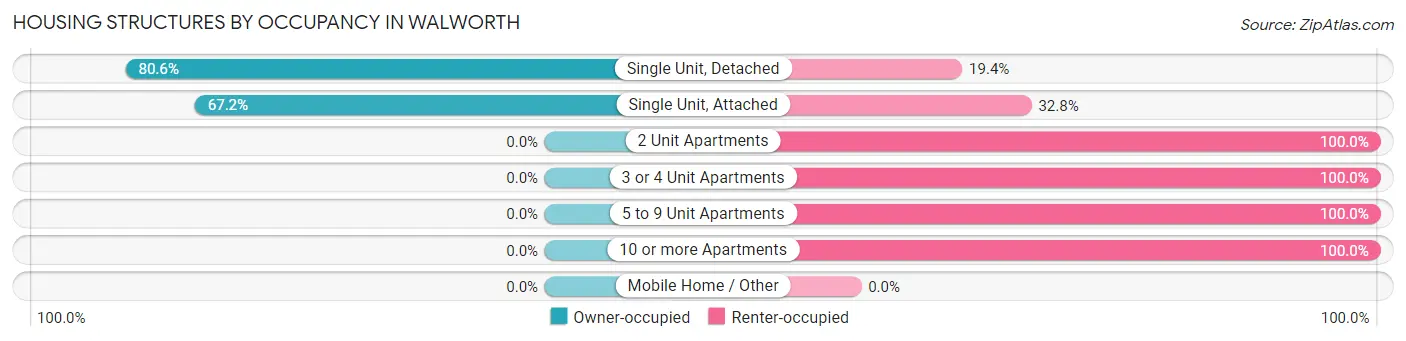
| Structure Type | Owner-occupied | Renter-occupied |
| Single Unit, Detached | 547 (80.6%) | 132 (19.4%) |
| Single Unit, Attached | 41 (67.2%) | 20 (32.8%) |
| 2 Unit Apartments | 0 (0.0%) | 31 (100.0%) |
| 3 or 4 Unit Apartments | 0 (0.0%) | 58 (100.0%) |
| 5 to 9 Unit Apartments | 0 (0.0%) | 128 (100.0%) |
| 10 or more Apartments | 0 (0.0%) | 64 (100.0%) |
| Mobile Home / Other | 0 (0.0%) | 0 (0.0%) |
| Total | 588 (57.6%) | 433 (42.4%) |
Housing Structures by Number of Rooms in Walworth
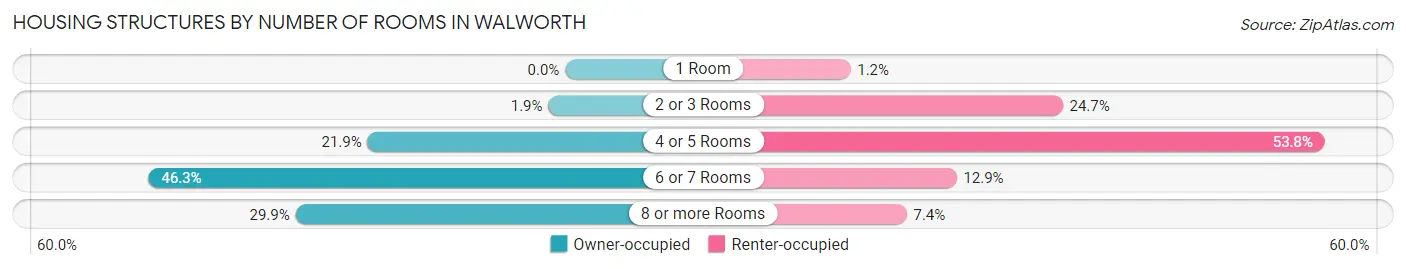
| Number of Rooms | Owner-occupied | Renter-occupied |
| 1 Room | 0 (0.0%) | 5 (1.1%) |
| 2 or 3 Rooms | 11 (1.9%) | 107 (24.7%) |
| 4 or 5 Rooms | 129 (21.9%) | 233 (53.8%) |
| 6 or 7 Rooms | 272 (46.3%) | 56 (12.9%) |
| 8 or more Rooms | 176 (29.9%) | 32 (7.4%) |
| Total | 588 (100.0%) | 433 (100.0%) |
Housing Structure by Heating Type in Walworth
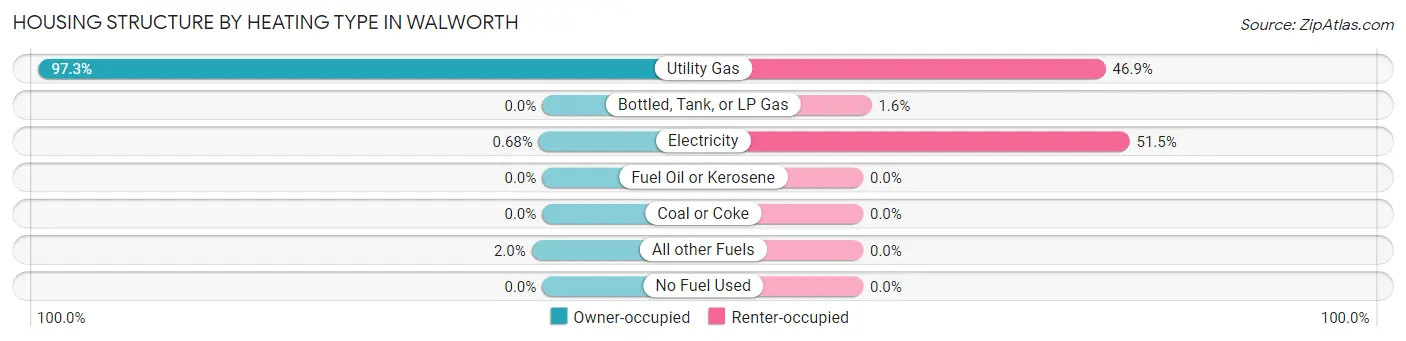
| Heating Type | Owner-occupied | Renter-occupied |
| Utility Gas | 572 (97.3%) | 203 (46.9%) |
| Bottled, Tank, or LP Gas | 0 (0.0%) | 7 (1.6%) |
| Electricity | 4 (0.7%) | 223 (51.5%) |
| Fuel Oil or Kerosene | 0 (0.0%) | 0 (0.0%) |
| Coal or Coke | 0 (0.0%) | 0 (0.0%) |
| All other Fuels | 12 (2.0%) | 0 (0.0%) |
| No Fuel Used | 0 (0.0%) | 0 (0.0%) |
| Total | 588 (100.0%) | 433 (100.0%) |
Household Vehicle Usage in Walworth
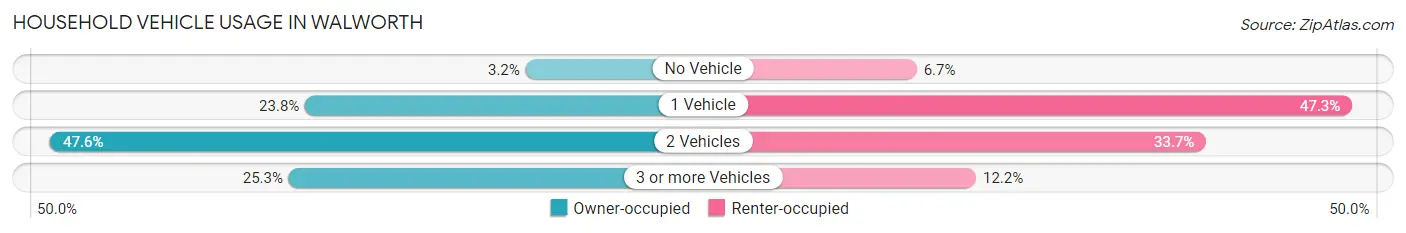
| Vehicles per Household | Owner-occupied | Renter-occupied |
| No Vehicle | 19 (3.2%) | 29 (6.7%) |
| 1 Vehicle | 140 (23.8%) | 205 (47.3%) |
| 2 Vehicles | 280 (47.6%) | 146 (33.7%) |
| 3 or more Vehicles | 149 (25.3%) | 53 (12.2%) |
| Total | 588 (100.0%) | 433 (100.0%) |
Real Estate & Mortgages in Walworth
Real Estate and Mortgage Overview in Walworth
| Characteristic | Without Mortgage | With Mortgage |
| Housing Units | 238 | 350 |
| Median Property Value | $221,700 | $227,700 |
| Median Household Income | $60,714 | $68 |
| Monthly Housing Costs | $624 | $16 |
| Real Estate Taxes | $2,923 | $0 |
Property Value by Mortgage Status in Walworth
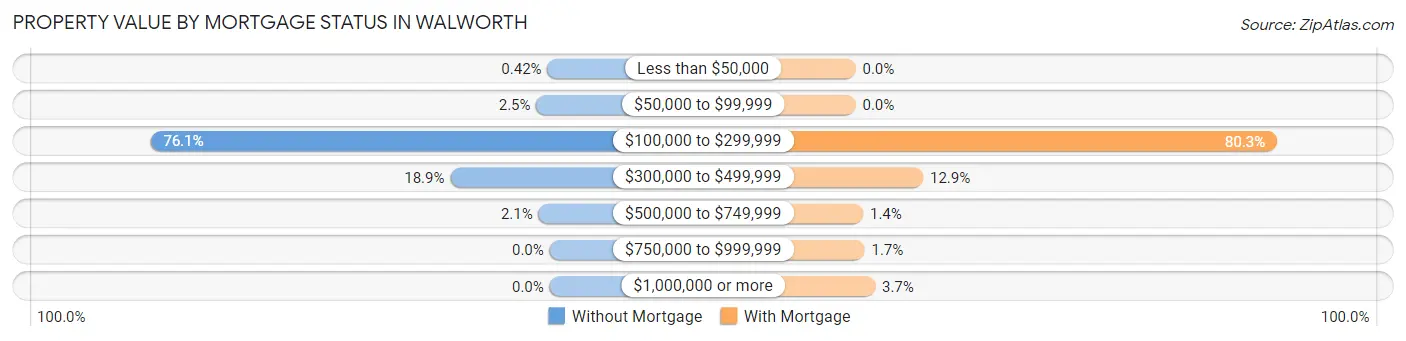
| Property Value | Without Mortgage | With Mortgage |
| Less than $50,000 | 1 (0.4%) | 0 (0.0%) |
| $50,000 to $99,999 | 6 (2.5%) | 0 (0.0%) |
| $100,000 to $299,999 | 181 (76.0%) | 281 (80.3%) |
| $300,000 to $499,999 | 45 (18.9%) | 45 (12.9%) |
| $500,000 to $749,999 | 5 (2.1%) | 5 (1.4%) |
| $750,000 to $999,999 | 0 (0.0%) | 6 (1.7%) |
| $1,000,000 or more | 0 (0.0%) | 13 (3.7%) |
| Total | 238 (100.0%) | 350 (100.0%) |
Household Income by Mortgage Status in Walworth
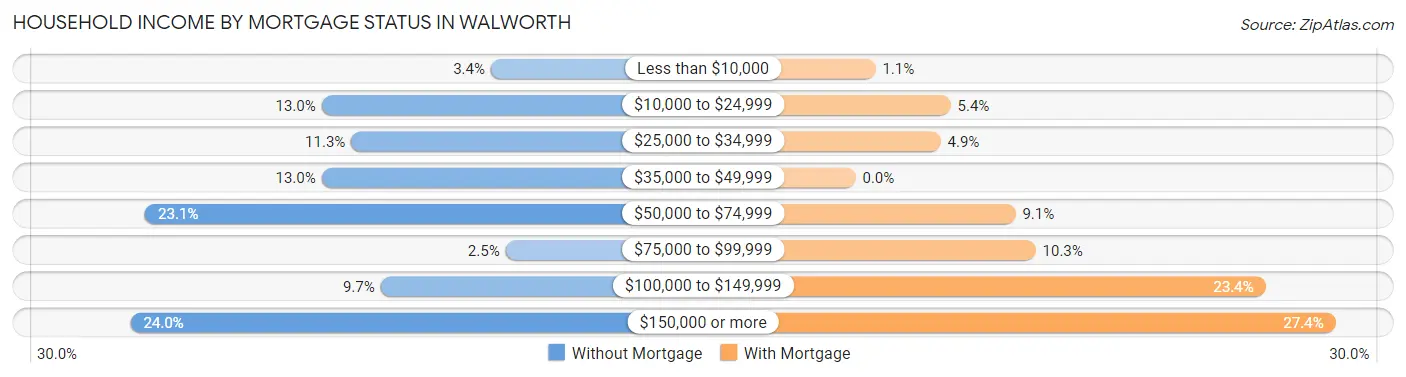
| Household Income | Without Mortgage | With Mortgage |
| Less than $10,000 | 8 (3.4%) | 4 (1.1%) |
| $10,000 to $24,999 | 31 (13.0%) | 19 (5.4%) |
| $25,000 to $34,999 | 27 (11.3%) | 17 (4.9%) |
| $35,000 to $49,999 | 31 (13.0%) | 0 (0.0%) |
| $50,000 to $74,999 | 55 (23.1%) | 32 (9.1%) |
| $75,000 to $99,999 | 6 (2.5%) | 36 (10.3%) |
| $100,000 to $149,999 | 23 (9.7%) | 82 (23.4%) |
| $150,000 or more | 57 (23.9%) | 96 (27.4%) |
| Total | 238 (100.0%) | 350 (100.0%) |
Property Value to Household Income Ratio in Walworth
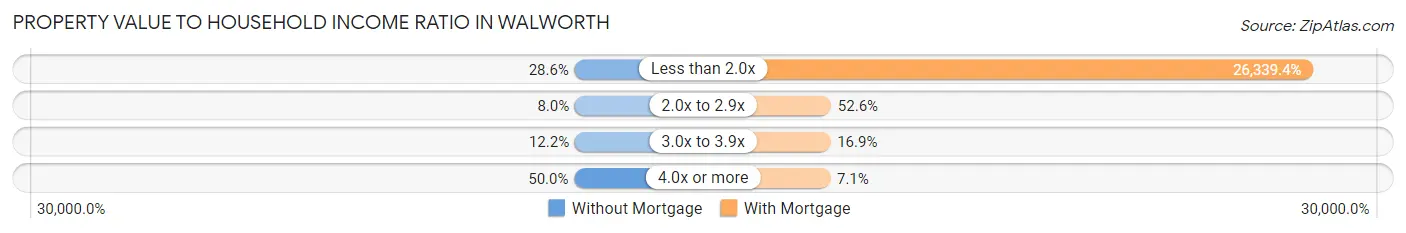
| Value-to-Income Ratio | Without Mortgage | With Mortgage |
| Less than 2.0x | 68 (28.6%) | 92,188 (26,339.4%) |
| 2.0x to 2.9x | 19 (8.0%) | 184 (52.6%) |
| 3.0x to 3.9x | 29 (12.2%) | 59 (16.9%) |
| 4.0x or more | 119 (50.0%) | 25 (7.1%) |
| Total | 238 (100.0%) | 350 (100.0%) |
Real Estate Taxes by Mortgage Status in Walworth
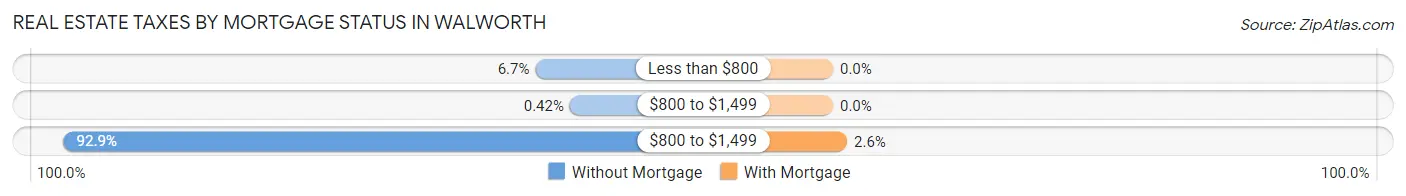
| Property Taxes | Without Mortgage | With Mortgage |
| Less than $800 | 16 (6.7%) | 0 (0.0%) |
| $800 to $1,499 | 1 (0.4%) | 0 (0.0%) |
| $800 to $1,499 | 221 (92.9%) | 9 (2.6%) |
| Total | 238 (100.0%) | 350 (100.0%) |
Health & Disability in Walworth
Health Insurance Coverage by Age in Walworth
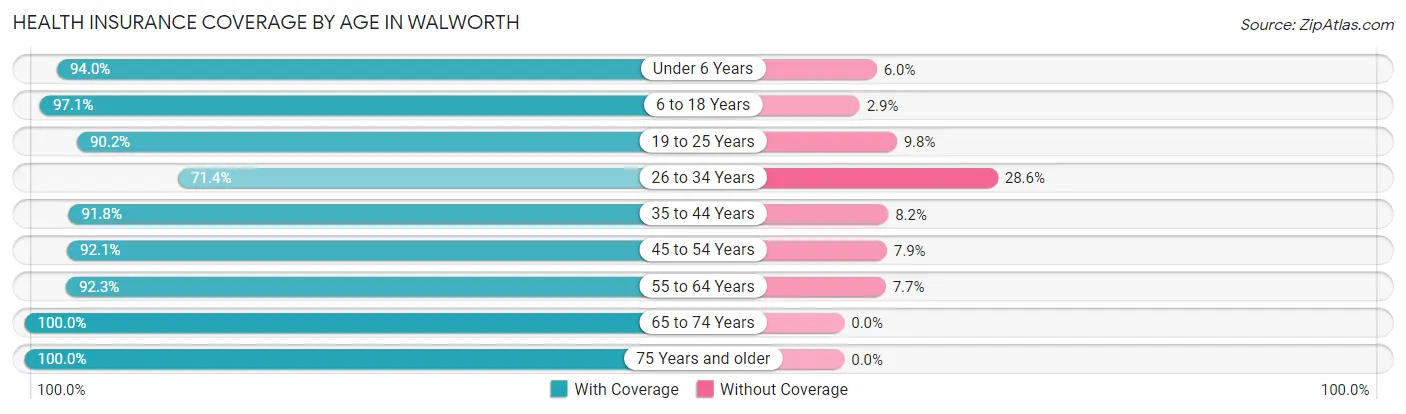
| Age Bracket | With Coverage | Without Coverage |
| Under 6 Years | 171 (94.0%) | 11 (6.0%) |
| 6 to 18 Years | 607 (97.1%) | 18 (2.9%) |
| 19 to 25 Years | 231 (90.2%) | 25 (9.8%) |
| 26 to 34 Years | 167 (71.4%) | 67 (28.6%) |
| 35 to 44 Years | 258 (91.8%) | 23 (8.2%) |
| 45 to 54 Years | 406 (92.1%) | 35 (7.9%) |
| 55 to 64 Years | 287 (92.3%) | 24 (7.7%) |
| 65 to 74 Years | 257 (100.0%) | 0 (0.0%) |
| 75 Years and older | 165 (100.0%) | 0 (0.0%) |
| Total | 2,549 (92.6%) | 203 (7.4%) |
Health Insurance Coverage by Citizenship Status in Walworth
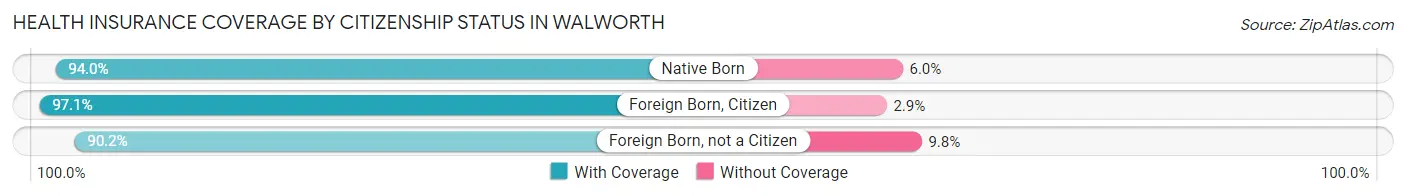
| Citizenship Status | With Coverage | Without Coverage |
| Native Born | 171 (94.0%) | 11 (6.0%) |
| Foreign Born, Citizen | 607 (97.1%) | 18 (2.9%) |
| Foreign Born, not a Citizen | 231 (90.2%) | 25 (9.8%) |
Health Insurance Coverage by Household Income in Walworth
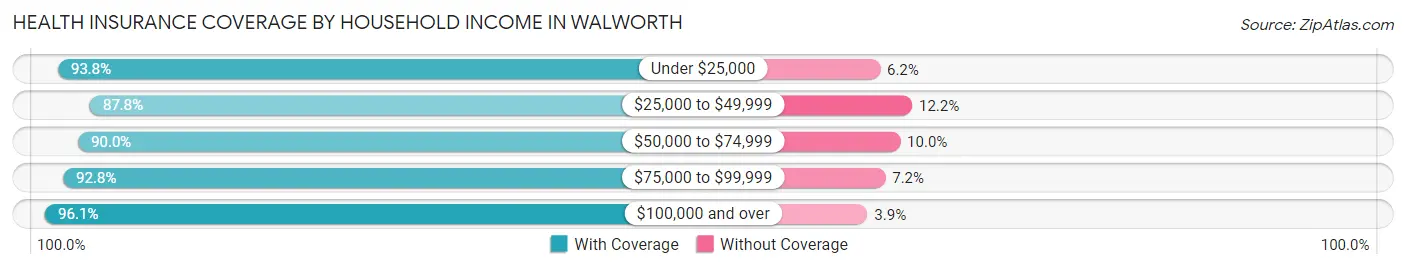
| Household Income | With Coverage | Without Coverage |
| Under $25,000 | 301 (93.8%) | 20 (6.2%) |
| $25,000 to $49,999 | 438 (87.8%) | 61 (12.2%) |
| $50,000 to $74,999 | 468 (90.0%) | 52 (10.0%) |
| $75,000 to $99,999 | 412 (92.8%) | 32 (7.2%) |
| $100,000 and over | 922 (96.1%) | 37 (3.9%) |
Public vs Private Health Insurance Coverage by Age in Walworth
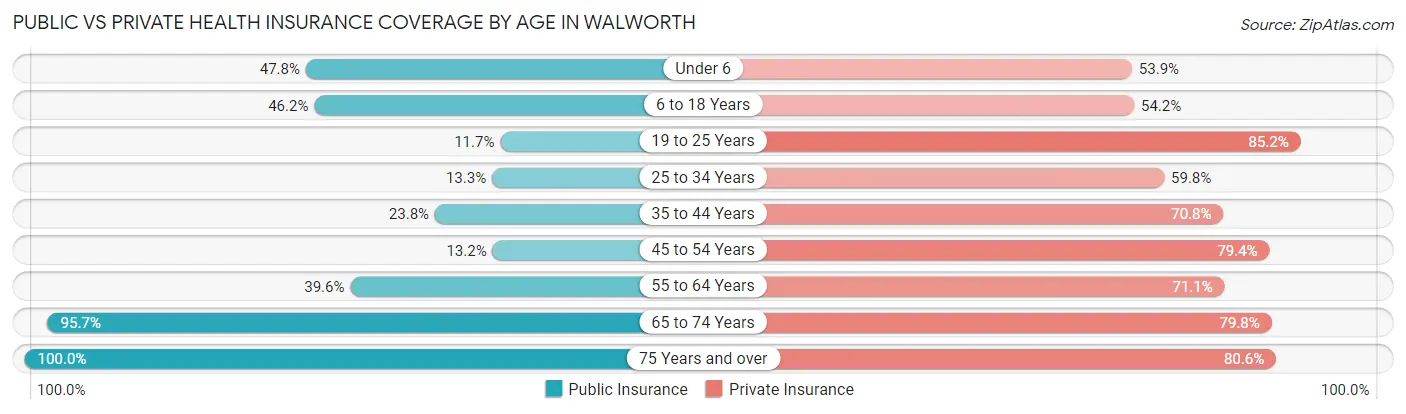
| Age Bracket | Public Insurance | Private Insurance |
| Under 6 | 87 (47.8%) | 98 (53.8%) |
| 6 to 18 Years | 289 (46.2%) | 339 (54.2%) |
| 19 to 25 Years | 30 (11.7%) | 218 (85.2%) |
| 25 to 34 Years | 31 (13.3%) | 140 (59.8%) |
| 35 to 44 Years | 67 (23.8%) | 199 (70.8%) |
| 45 to 54 Years | 58 (13.2%) | 350 (79.4%) |
| 55 to 64 Years | 123 (39.6%) | 221 (71.1%) |
| 65 to 74 Years | 246 (95.7%) | 205 (79.8%) |
| 75 Years and over | 165 (100.0%) | 133 (80.6%) |
| Total | 1,096 (39.8%) | 1,903 (69.2%) |
Disability Status by Sex by Age in Walworth
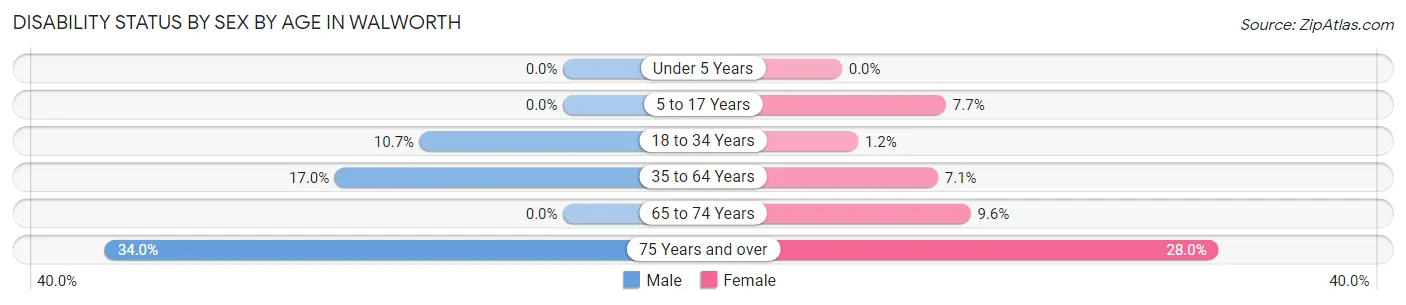
| Age Bracket | Male | Female |
| Under 5 Years | 0 (0.0%) | 0 (0.0%) |
| 5 to 17 Years | 0 (0.0%) | 18 (7.7%) |
| 18 to 34 Years | 28 (10.6%) | 3 (1.2%) |
| 35 to 64 Years | 80 (17.0%) | 40 (7.1%) |
| 65 to 74 Years | 0 (0.0%) | 13 (9.6%) |
| 75 Years and over | 16 (34.0%) | 33 (28.0%) |
Disability Class by Sex by Age in Walworth
Disability Class: Hearing Difficulty
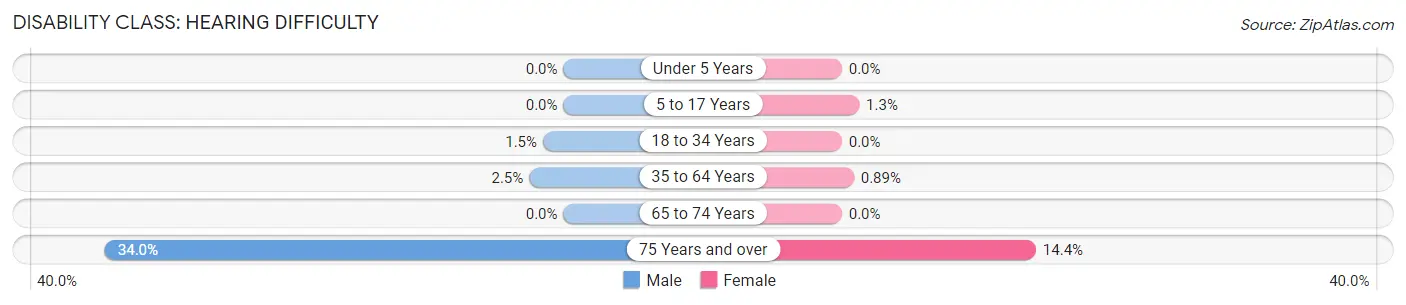
| Age Bracket | Male | Female |
| Under 5 Years | 0 (0.0%) | 0 (0.0%) |
| 5 to 17 Years | 0 (0.0%) | 3 (1.3%) |
| 18 to 34 Years | 4 (1.5%) | 0 (0.0%) |
| 35 to 64 Years | 12 (2.5%) | 5 (0.9%) |
| 65 to 74 Years | 0 (0.0%) | 0 (0.0%) |
| 75 Years and over | 16 (34.0%) | 17 (14.4%) |
Disability Class: Vision Difficulty
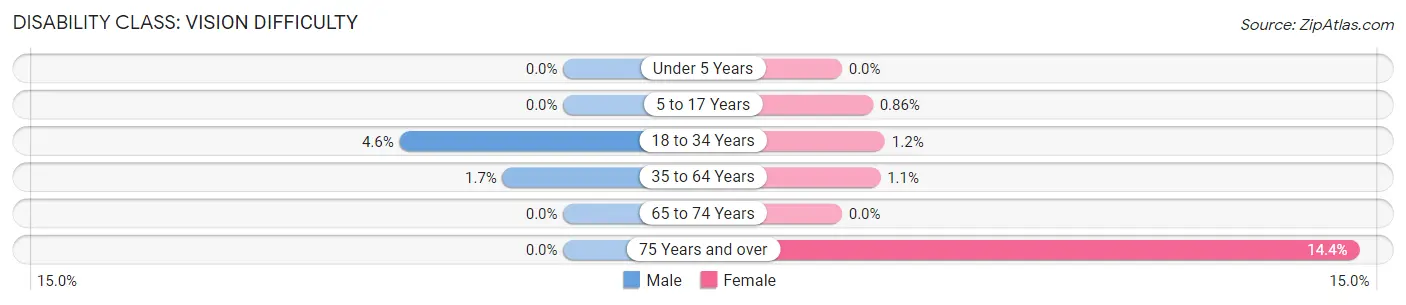
| Age Bracket | Male | Female |
| Under 5 Years | 0 (0.0%) | 0 (0.0%) |
| 5 to 17 Years | 0 (0.0%) | 2 (0.9%) |
| 18 to 34 Years | 12 (4.6%) | 3 (1.2%) |
| 35 to 64 Years | 8 (1.7%) | 6 (1.1%) |
| 65 to 74 Years | 0 (0.0%) | 0 (0.0%) |
| 75 Years and over | 0 (0.0%) | 17 (14.4%) |
Disability Class: Cognitive Difficulty
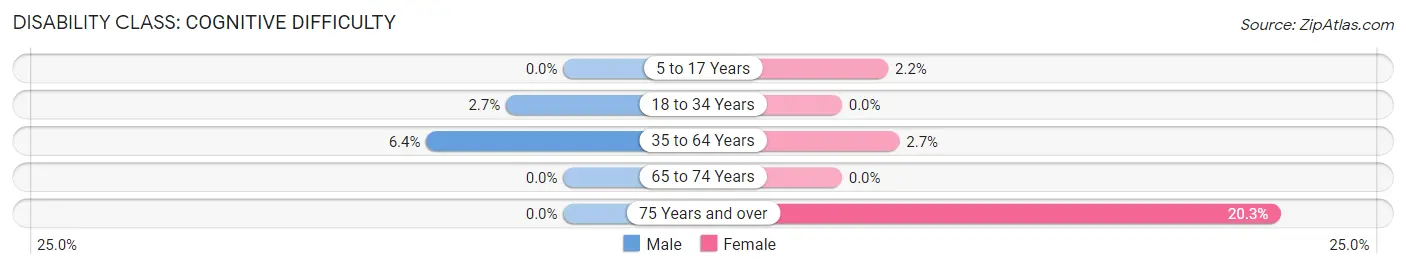
| Age Bracket | Male | Female |
| 5 to 17 Years | 0 (0.0%) | 5 (2.1%) |
| 18 to 34 Years | 7 (2.7%) | 0 (0.0%) |
| 35 to 64 Years | 30 (6.4%) | 15 (2.7%) |
| 65 to 74 Years | 0 (0.0%) | 0 (0.0%) |
| 75 Years and over | 0 (0.0%) | 24 (20.3%) |
Disability Class: Ambulatory Difficulty
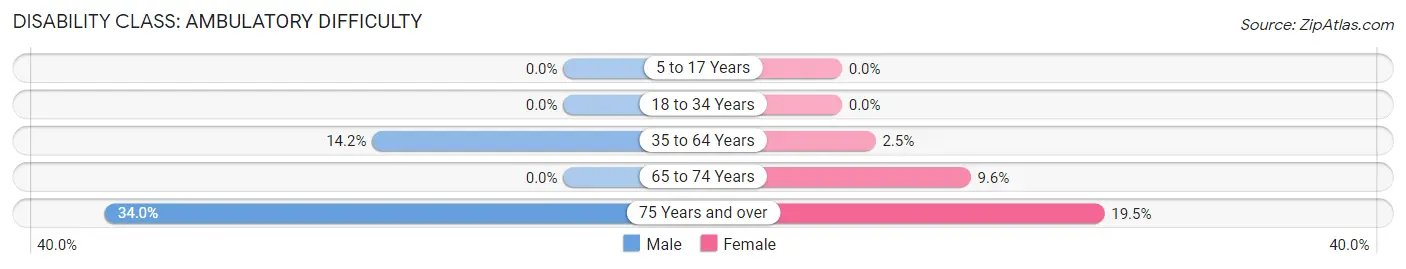
| Age Bracket | Male | Female |
| 5 to 17 Years | 0 (0.0%) | 0 (0.0%) |
| 18 to 34 Years | 0 (0.0%) | 0 (0.0%) |
| 35 to 64 Years | 67 (14.2%) | 14 (2.5%) |
| 65 to 74 Years | 0 (0.0%) | 13 (9.6%) |
| 75 Years and over | 16 (34.0%) | 23 (19.5%) |
Disability Class: Self-Care Difficulty
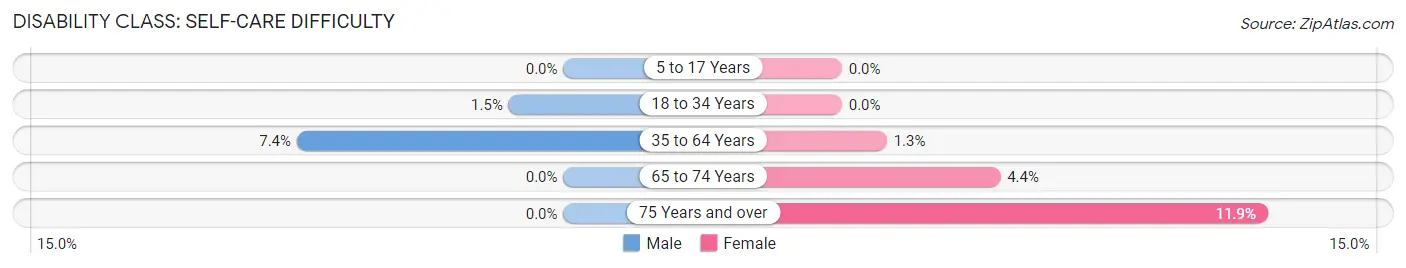
| Age Bracket | Male | Female |
| 5 to 17 Years | 0 (0.0%) | 0 (0.0%) |
| 18 to 34 Years | 4 (1.5%) | 0 (0.0%) |
| 35 to 64 Years | 35 (7.4%) | 7 (1.3%) |
| 65 to 74 Years | 0 (0.0%) | 6 (4.4%) |
| 75 Years and over | 0 (0.0%) | 14 (11.9%) |
Technology Access in Walworth
Computing Device Access in Walworth
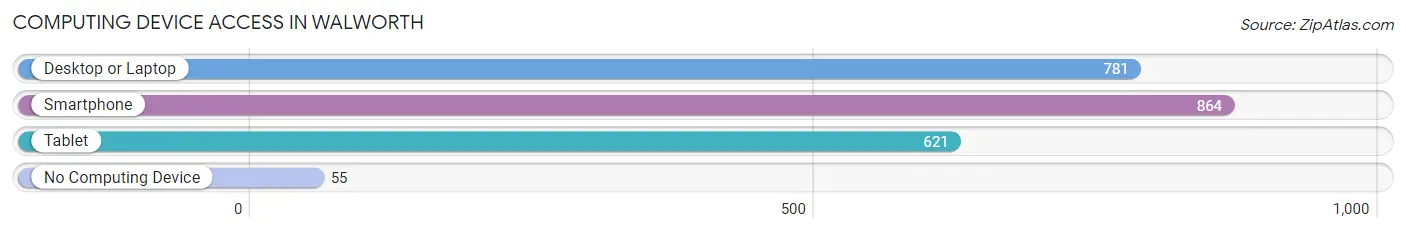
| Device Type | # Households | % Households |
| Desktop or Laptop | 781 | 76.5% |
| Smartphone | 864 | 84.6% |
| Tablet | 621 | 60.8% |
| No Computing Device | 55 | 5.4% |
| Total | 1,021 | 100.0% |
Internet Access in Walworth
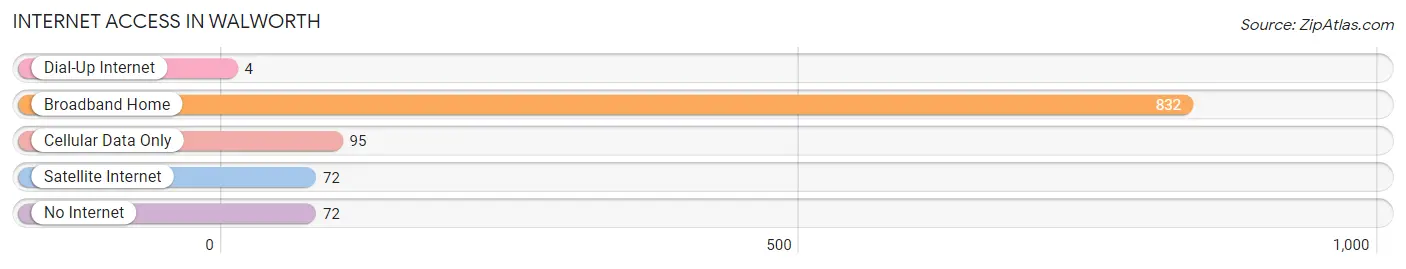
| Internet Type | # Households | % Households |
| Dial-Up Internet | 4 | 0.4% |
| Broadband Home | 832 | 81.5% |
| Cellular Data Only | 95 | 9.3% |
| Satellite Internet | 72 | 7.0% |
| No Internet | 72 | 7.0% |
| Total | 1,021 | 100.0% |
Walworth Summary
Walworth, Wisconsin is a small village located in Walworth County, Wisconsin. It is situated on the banks of the Fox River, about 25 miles southwest of Milwaukee. The village has a population of 1,845 as of the 2010 census.
History
Walworth was first settled in 1836 by a group of settlers from New York. The village was named after the county, which was named after Reuben Walworth, a prominent lawyer and judge in New York. The village was incorporated in 1846.
In the late 19th century, Walworth was a popular tourist destination due to its proximity to Lake Geneva. The village was home to several resorts, including the Walworth Hotel, which was built in 1876. The hotel was destroyed by fire in 1891.
In the early 20th century, Walworth was a popular destination for wealthy Chicagoans looking to escape the city. The village was home to several large estates, including the estate of John D. Rockefeller, which was built in 1906.
Geography
Walworth is located in southeastern Wisconsin, about 25 miles southwest of Milwaukee. The village is situated on the banks of the Fox River, which flows through the village. The village is surrounded by rolling hills and farmland.
The village has a total area of 1.2 square miles, all of which is land. The village is located in the Central Plain physiographic region.
Economy
The economy of Walworth is largely based on agriculture and tourism. The village is home to several farms, which produce a variety of crops, including corn, soybeans, and wheat. The village is also home to several wineries, which produce a variety of wines.
The village is also a popular tourist destination due to its proximity to Lake Geneva. The village is home to several resorts, including the Grand Geneva Resort & Spa, which is located on the banks of the Fox River. The village is also home to several antique shops, art galleries, and restaurants.
Demographics
As of the 2010 census, the village had a population of 1,845. The racial makeup of the village was 95.3% White, 0.7% African American, 0.3% Native American, 0.7% Asian, 0.1% Pacific Islander, 1.2% from other races, and 1.7% from two or more races. Hispanic or Latino of any race were 3.2% of the population.
The median income for a household in the village was $50,938, and the median income for a family was $60,000. The per capita income for the village was $25,938. About 4.3% of families and 5.7% of the population were below the poverty line, including 8.3% of those under age 18 and 4.2% of those age 65 or over.
Common Questions
What is Per Capita Income in Walworth?
Per Capita income in Walworth is $29,501.
What is the Median Family Income in Walworth?
Median Family Income in Walworth is $85,270.
What is the Median Household income in Walworth?
Median Household Income in Walworth is $61,472.
What is Income or Wage Gap in Walworth?
Income or Wage Gap in Walworth is 40.2%.
Women in Walworth earn 59.8 cents for every dollar earned by a man.
What is Inequality or Gini Index in Walworth?
Inequality or Gini Index in Walworth is 0.45.
What is the Total Population of Walworth?
Total Population of Walworth is 2,778.
What is the Total Male Population of Walworth?
Total Male Population of Walworth is 1,391.
What is the Total Female Population of Walworth?
Total Female Population of Walworth is 1,387.
What is the Ratio of Males per 100 Females in Walworth?
There are 100.29 Males per 100 Females in Walworth.
What is the Ratio of Females per 100 Males in Walworth?
There are 99.71 Females per 100 Males in Walworth.
What is the Median Population Age in Walworth?
Median Population Age in Walworth is 38.7 Years.
What is the Average Family Size in Walworth
Average Family Size in Walworth is 3.4 People.
What is the Average Household Size in Walworth
Average Household Size in Walworth is 2.7 People.
How Large is the Labor Force in Walworth?
There are 1,469 People in the Labor Forcein in Walworth.
What is the Percentage of People in the Labor Force in Walworth?
70.0% of People are in the Labor Force in Walworth.
What is the Unemployment Rate in Walworth?
Unemployment Rate in Walworth is 2.9%.