Tainter Lake, WI Map & Demographics
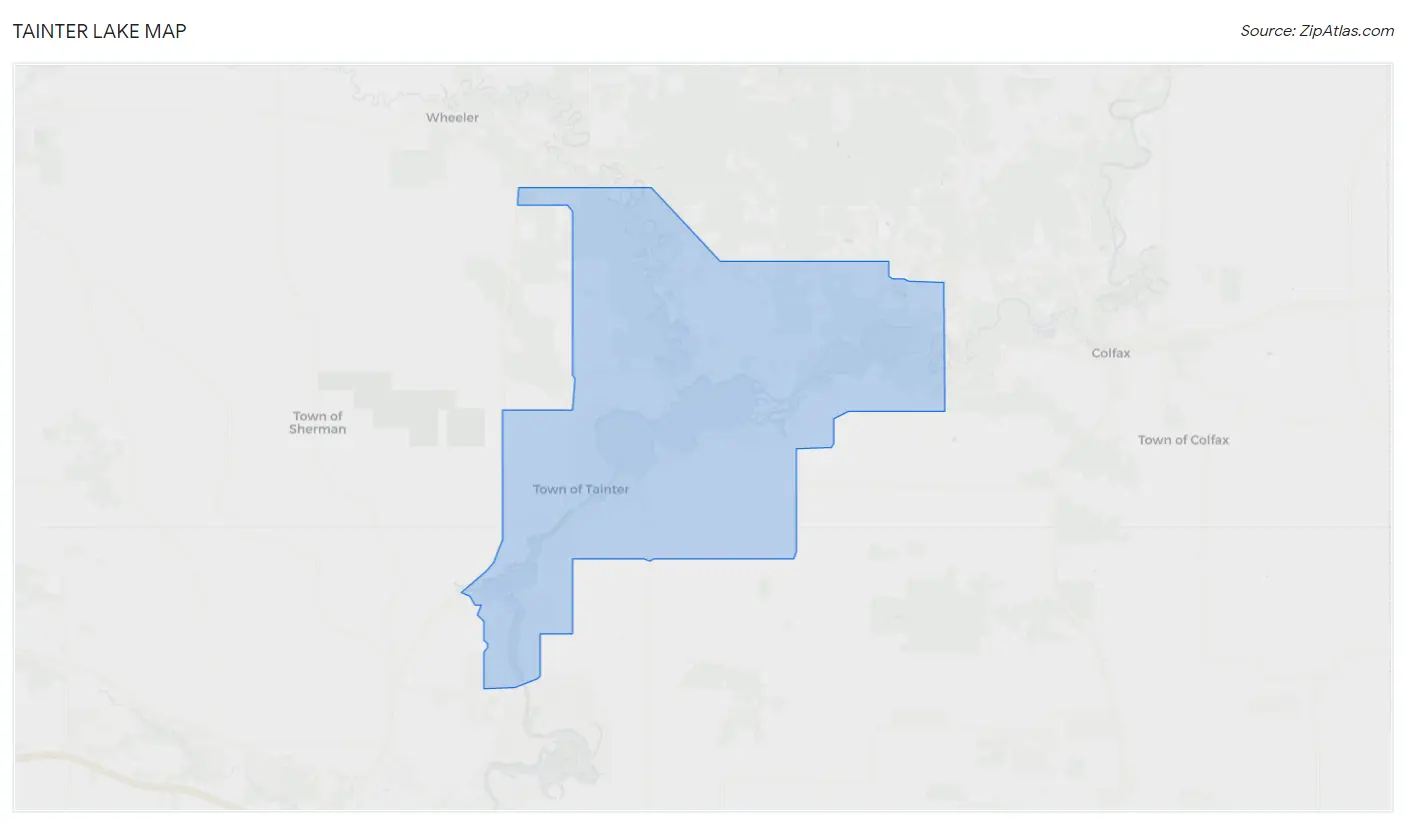
Tainter Lake Map
Tainter Lake Overview
$46,139
PER CAPITA INCOME
$113,000
AVG FAMILY INCOME
$101,691
AVG HOUSEHOLD INCOME
31.6%
WAGE / INCOME GAP [ % ]
68.4¢/ $1
WAGE / INCOME GAP [ $ ]
$7,225
FAMILY INCOME DEFICIT
0.43
INEQUALITY / GINI INDEX
2,789
TOTAL POPULATION
1,604
MALE POPULATION
1,185
FEMALE POPULATION
135.36
MALES / 100 FEMALES
73.88
FEMALES / 100 MALES
38.9
MEDIAN AGE
3.4
AVG FAMILY SIZE
2.7
AVG HOUSEHOLD SIZE
1,442
LABOR FORCE [ PEOPLE ]
69.8%
PERCENT IN LABOR FORCE
4.6%
UNEMPLOYMENT RATE
Income in Tainter Lake
Income Overview in Tainter Lake
Per Capita Income in Tainter Lake is $46,139, while median incomes of families and households are $113,000 and $101,691 respectively.
| Characteristic | Number | Measure |
| Per Capita Income | 2,789 | $46,139 |
| Median Family Income | 716 | $113,000 |
| Mean Family Income | 716 | $145,422 |
| Median Household Income | 1,023 | $101,691 |
| Mean Household Income | 1,023 | $122,494 |
| Income Deficit | 716 | $7,225 |
| Wage / Income Gap (%) | 2,789 | 31.62% |
| Wage / Income Gap ($) | 2,789 | 68.38¢ per $1 |
| Gini / Inequality Index | 2,789 | 0.43 |
Earnings by Sex in Tainter Lake
Average Earnings in Tainter Lake are $47,773, $58,494 for men and $40,000 for women, a difference of 31.6%.
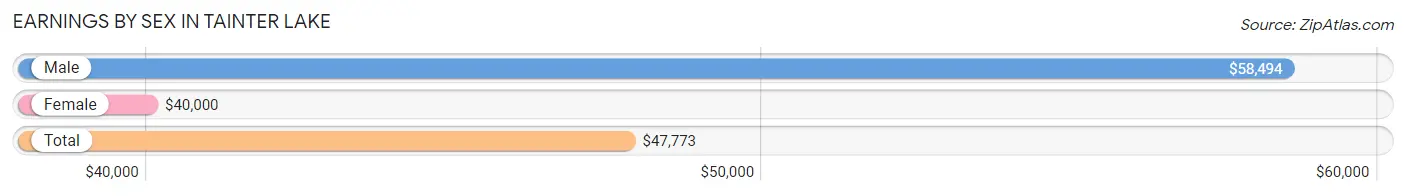
| Sex | Number | Average Earnings |
| Male | 859 (57.9%) | $58,494 |
| Female | 624 (42.1%) | $40,000 |
| Total | 1,483 (100.0%) | $47,773 |
Earnings by Sex by Income Bracket in Tainter Lake
The most common earnings brackets in Tainter Lake are $100,000+ for men (167 | 19.4%) and $2,499 or less for women (80 | 12.8%).
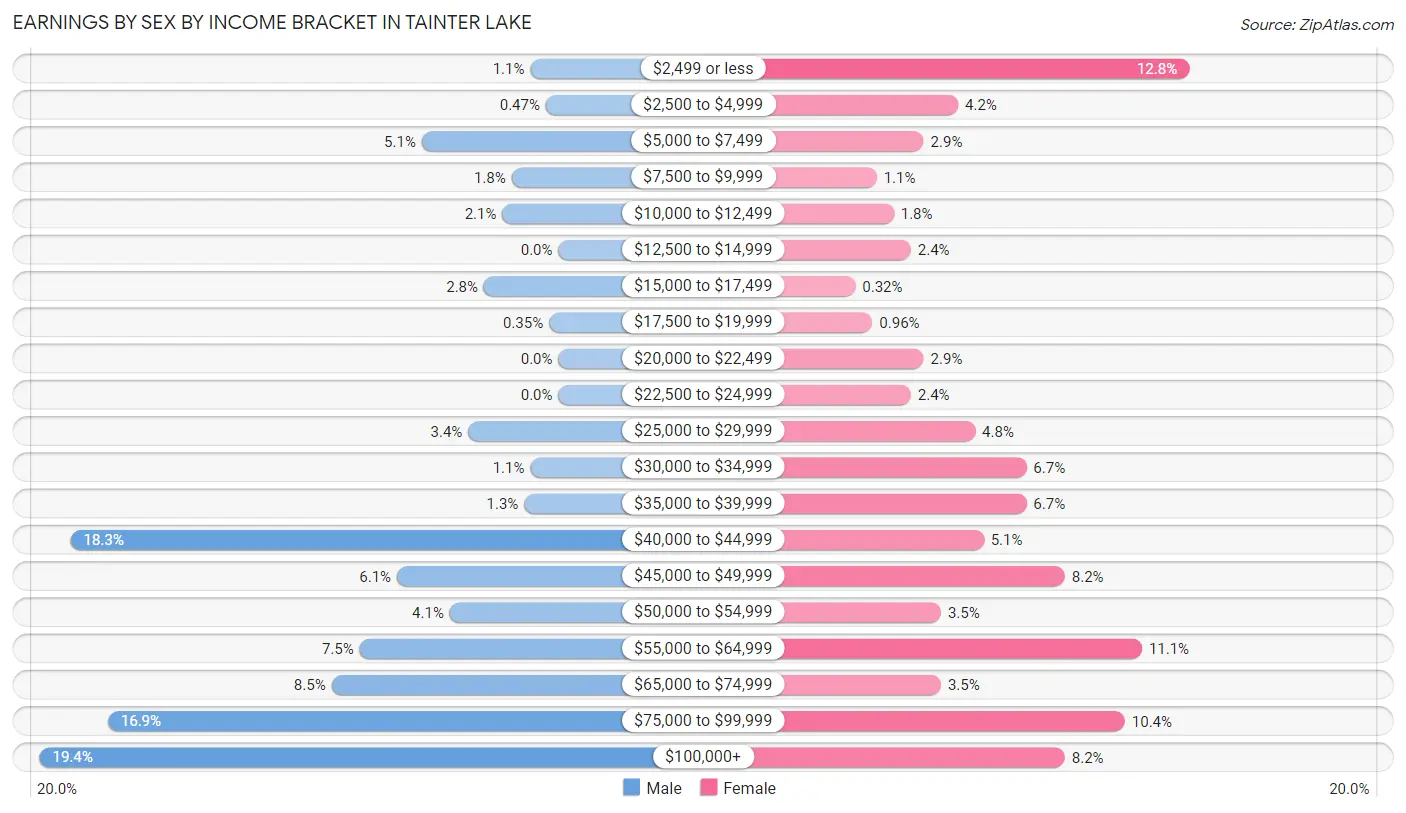
| Income | Male | Female |
| $2,499 or less | 9 (1.1%) | 80 (12.8%) |
| $2,500 to $4,999 | 4 (0.5%) | 26 (4.2%) |
| $5,000 to $7,499 | 44 (5.1%) | 18 (2.9%) |
| $7,500 to $9,999 | 15 (1.8%) | 7 (1.1%) |
| $10,000 to $12,499 | 18 (2.1%) | 11 (1.8%) |
| $12,500 to $14,999 | 0 (0.0%) | 15 (2.4%) |
| $15,000 to $17,499 | 24 (2.8%) | 2 (0.3%) |
| $17,500 to $19,999 | 3 (0.4%) | 6 (1.0%) |
| $20,000 to $22,499 | 0 (0.0%) | 18 (2.9%) |
| $22,500 to $24,999 | 0 (0.0%) | 15 (2.4%) |
| $25,000 to $29,999 | 29 (3.4%) | 30 (4.8%) |
| $30,000 to $34,999 | 9 (1.1%) | 42 (6.7%) |
| $35,000 to $39,999 | 11 (1.3%) | 42 (6.7%) |
| $40,000 to $44,999 | 157 (18.3%) | 32 (5.1%) |
| $45,000 to $49,999 | 52 (6.0%) | 51 (8.2%) |
| $50,000 to $54,999 | 35 (4.1%) | 22 (3.5%) |
| $55,000 to $64,999 | 64 (7.4%) | 69 (11.1%) |
| $65,000 to $74,999 | 73 (8.5%) | 22 (3.5%) |
| $75,000 to $99,999 | 145 (16.9%) | 65 (10.4%) |
| $100,000+ | 167 (19.4%) | 51 (8.2%) |
| Total | 859 (100.0%) | 624 (100.0%) |
Earnings by Sex by Educational Attainment in Tainter Lake
Average earnings in Tainter Lake are $64,167 for men and $41,786 for women, a difference of 34.9%. Men with an educational attainment of graduate degree enjoy the highest average annual earnings of $115,417, while those with college or associate's degree education earn the least with $51,136. Women with an educational attainment of graduate degree earn the most with the average annual earnings of $75,750, while those with college or associate's degree education have the smallest earnings of $31,842.
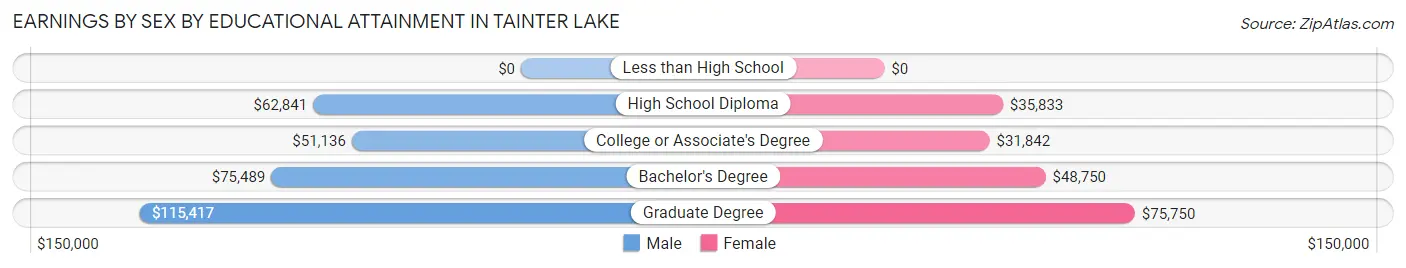
| Educational Attainment | Male Income | Female Income |
| Less than High School | - | - |
| High School Diploma | $62,841 | $35,833 |
| College or Associate's Degree | $51,136 | $31,842 |
| Bachelor's Degree | $75,489 | $48,750 |
| Graduate Degree | $115,417 | $75,750 |
| Total | $64,167 | $41,786 |
Family Income in Tainter Lake
Family Income Brackets in Tainter Lake
According to the Tainter Lake family income data, there are 245 families falling into the $100,000 to $149,999 income range, which is the most common income bracket and makes up 34.2% of all families. Conversely, the $10,000 to $14,999 income bracket is the least frequent group with only 4 families (0.6%) belonging to this category.
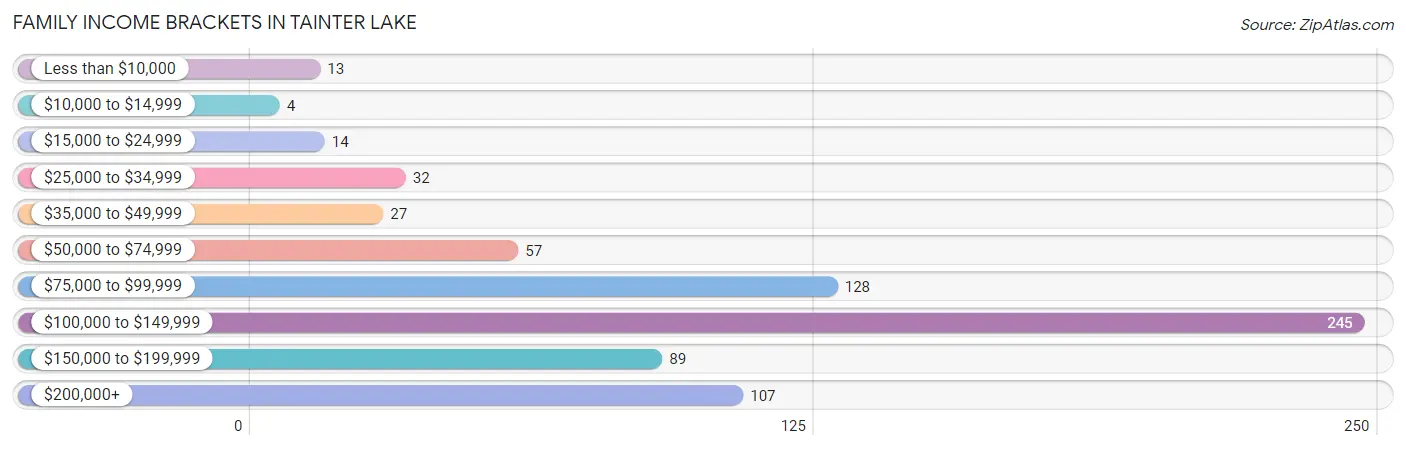
| Income Bracket | # Families | % Families |
| Less than $10,000 | 13 | 1.8% |
| $10,000 to $14,999 | 4 | 0.6% |
| $15,000 to $24,999 | 14 | 2.0% |
| $25,000 to $34,999 | 32 | 4.5% |
| $35,000 to $49,999 | 27 | 3.8% |
| $50,000 to $74,999 | 57 | 8.0% |
| $75,000 to $99,999 | 128 | 17.9% |
| $100,000 to $149,999 | 245 | 34.2% |
| $150,000 to $199,999 | 89 | 12.4% |
| $200,000+ | 107 | 14.9% |
Family Income by Famaliy Size in Tainter Lake
3-person families (127 | 17.7%) account for the highest median family income in Tainter Lake with $149,688 per family, while 2-person families (407 | 56.8%) have the highest median income of $51,193 per family member.
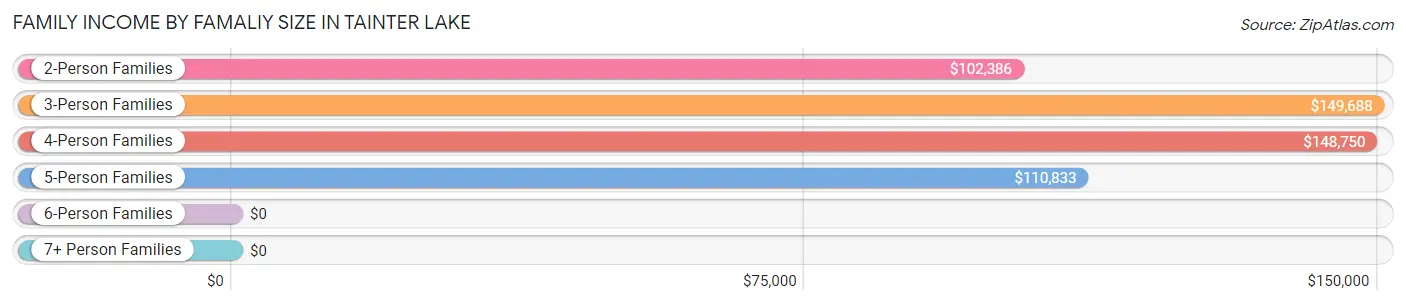
| Income Bracket | # Families | Median Income |
| 2-Person Families | 407 (56.8%) | $102,386 |
| 3-Person Families | 127 (17.7%) | $149,688 |
| 4-Person Families | 89 (12.4%) | $148,750 |
| 5-Person Families | 52 (7.3%) | $110,833 |
| 6-Person Families | 11 (1.5%) | $0 |
| 7+ Person Families | 30 (4.2%) | $0 |
| Total | 716 (100.0%) | $113,000 |
Family Income by Number of Earners in Tainter Lake
The median family income in Tainter Lake is $113,000, with families comprising 3+ earners (80) having the highest median family income of $154,500, while families with no earners (118) have the lowest median family income of $82,917, accounting for 11.2% and 16.5% of families, respectively.
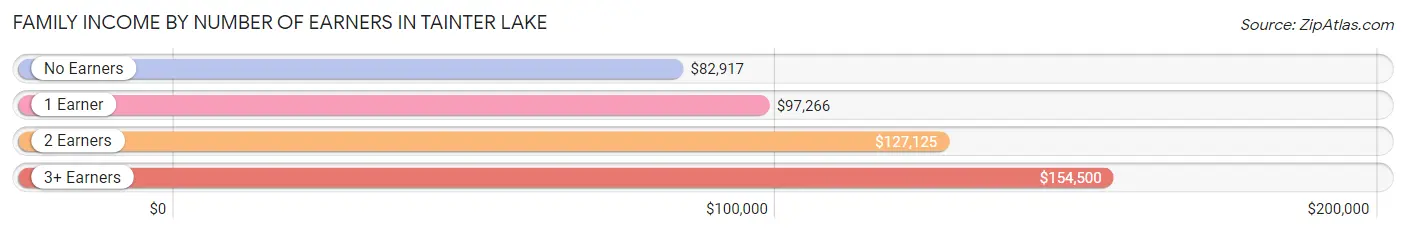
| Number of Earners | # Families | Median Income |
| No Earners | 118 (16.5%) | $82,917 |
| 1 Earner | 171 (23.9%) | $97,266 |
| 2 Earners | 347 (48.5%) | $127,125 |
| 3+ Earners | 80 (11.2%) | $154,500 |
| Total | 716 (100.0%) | $113,000 |
Household Income in Tainter Lake
Household Income Brackets in Tainter Lake
With 304 households falling in the category, the $100,000 to $149,999 income range is the most frequent in Tainter Lake, accounting for 29.7% of all households. In contrast, only 14 households (1.4%) fall into the less than $10,000 income bracket, making it the least populous group.
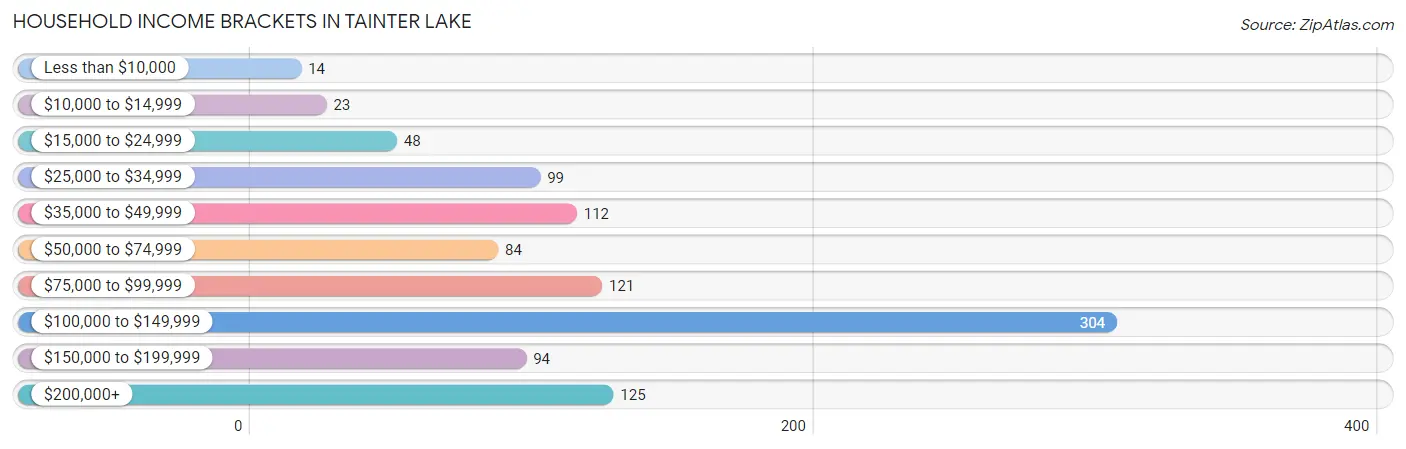
| Income Bracket | # Households | % Households |
| Less than $10,000 | 14 | 1.4% |
| $10,000 to $14,999 | 23 | 2.2% |
| $15,000 to $24,999 | 48 | 4.7% |
| $25,000 to $34,999 | 99 | 9.7% |
| $35,000 to $49,999 | 112 | 10.9% |
| $50,000 to $74,999 | 84 | 8.2% |
| $75,000 to $99,999 | 121 | 11.8% |
| $100,000 to $149,999 | 304 | 29.7% |
| $150,000 to $199,999 | 94 | 9.2% |
| $200,000+ | 125 | 12.2% |
Household Income by Householder Age in Tainter Lake
The median household income in Tainter Lake is $101,691, with the highest median household income of $111,042 found in the 25 to 44 years age bracket for the primary householder. A total of 295 households (28.8%) fall into this category. Meanwhile, the 15 to 24 years age bracket for the primary householder has the lowest median household income of $44,286, with 16 households (1.6%) in this group.
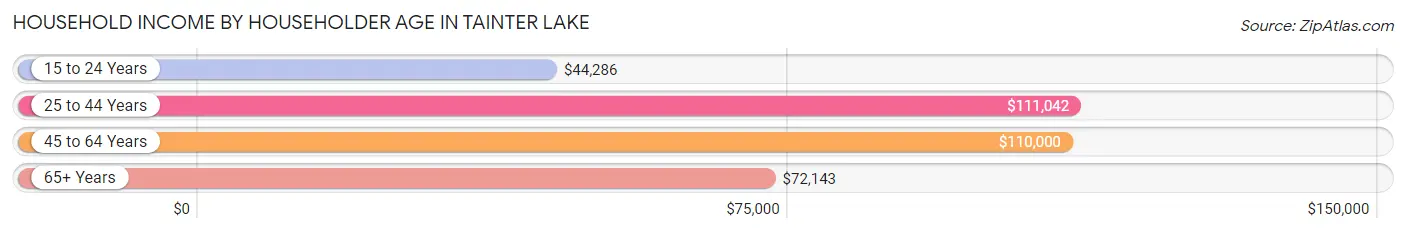
| Income Bracket | # Households | Median Income |
| 15 to 24 Years | 16 (1.6%) | $44,286 |
| 25 to 44 Years | 295 (28.8%) | $111,042 |
| 45 to 64 Years | 402 (39.3%) | $110,000 |
| 65+ Years | 310 (30.3%) | $72,143 |
| Total | 1,023 (100.0%) | $101,691 |
Poverty in Tainter Lake
Income Below Poverty by Sex and Age in Tainter Lake
With 5.6% poverty level for males and 6.3% for females among the residents of Tainter Lake, 15 year old males and 16 and 17 year old females are the most vulnerable to poverty, with 5 males (100.0%) and 5 females (33.3%) in their respective age groups living below the poverty level.
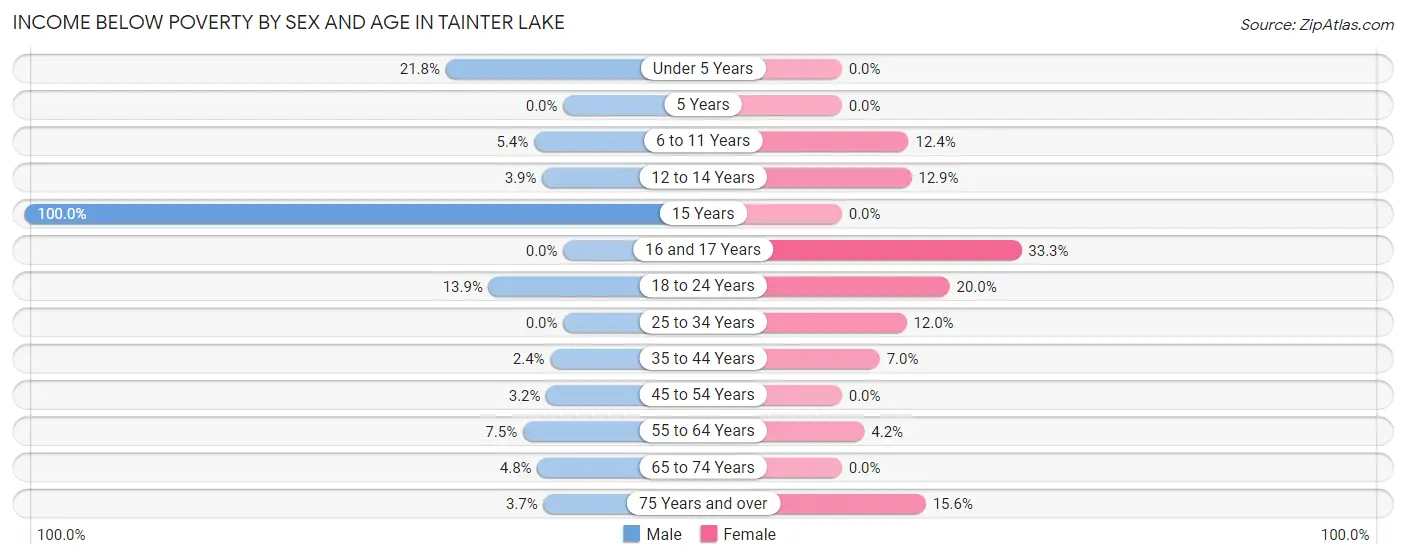
| Age Bracket | Male | Female |
| Under 5 Years | 24 (21.8%) | 0 (0.0%) |
| 5 Years | 0 (0.0%) | 0 (0.0%) |
| 6 to 11 Years | 7 (5.4%) | 14 (12.4%) |
| 12 to 14 Years | 6 (3.9%) | 4 (12.9%) |
| 15 Years | 5 (100.0%) | 0 (0.0%) |
| 16 and 17 Years | 0 (0.0%) | 5 (33.3%) |
| 18 to 24 Years | 9 (13.9%) | 7 (20.0%) |
| 25 to 34 Years | 0 (0.0%) | 6 (12.0%) |
| 35 to 44 Years | 4 (2.4%) | 19 (7.0%) |
| 45 to 54 Years | 7 (3.2%) | 0 (0.0%) |
| 55 to 64 Years | 14 (7.5%) | 8 (4.2%) |
| 65 to 74 Years | 9 (4.8%) | 0 (0.0%) |
| 75 Years and over | 4 (3.7%) | 12 (15.6%) |
| Total | 89 (5.6%) | 75 (6.3%) |
Income Above Poverty by Sex and Age in Tainter Lake
According to the poverty statistics in Tainter Lake, males aged 5 years and females aged under 5 years are the age groups that are most secure financially, with 100.0% of males and 100.0% of females in these age groups living above the poverty line.
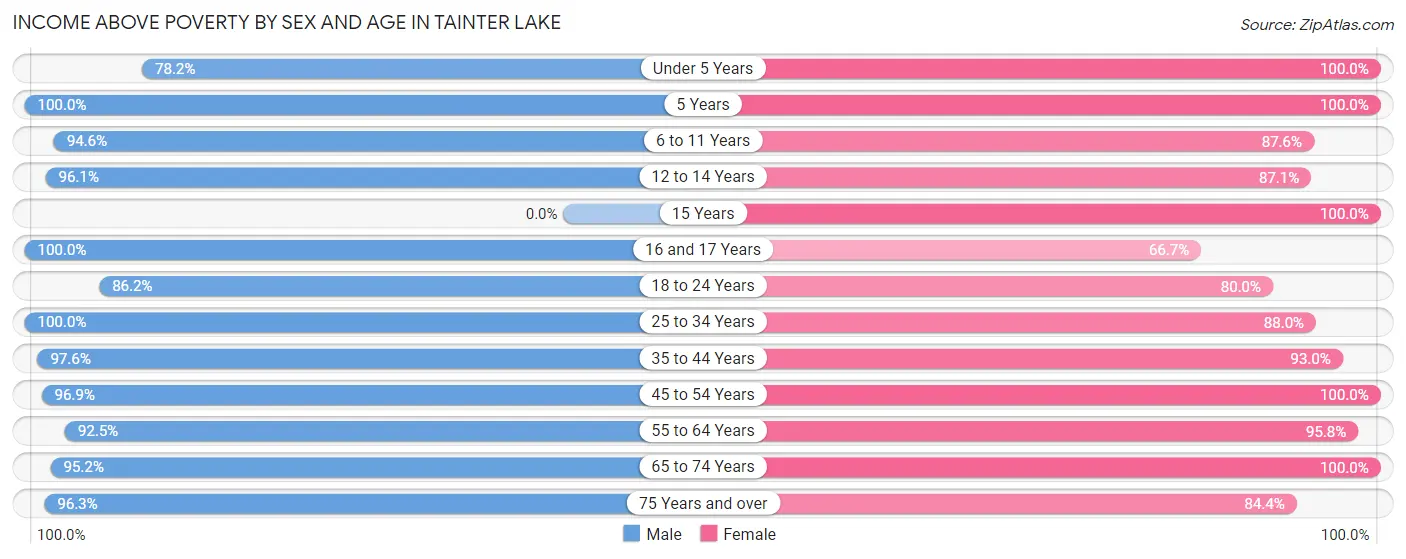
| Age Bracket | Male | Female |
| Under 5 Years | 86 (78.2%) | 87 (100.0%) |
| 5 Years | 32 (100.0%) | 8 (100.0%) |
| 6 to 11 Years | 122 (94.6%) | 99 (87.6%) |
| 12 to 14 Years | 148 (96.1%) | 27 (87.1%) |
| 15 Years | 0 (0.0%) | 49 (100.0%) |
| 16 and 17 Years | 53 (100.0%) | 10 (66.7%) |
| 18 to 24 Years | 56 (86.2%) | 28 (80.0%) |
| 25 to 34 Years | 179 (100.0%) | 44 (88.0%) |
| 35 to 44 Years | 163 (97.6%) | 251 (93.0%) |
| 45 to 54 Years | 215 (96.9%) | 119 (100.0%) |
| 55 to 64 Years | 173 (92.5%) | 183 (95.8%) |
| 65 to 74 Years | 178 (95.2%) | 140 (100.0%) |
| 75 Years and over | 105 (96.3%) | 65 (84.4%) |
| Total | 1,510 (94.4%) | 1,110 (93.7%) |
Income Below Poverty Among Married-Couple Families in Tainter Lake
The poverty statistics for married-couple families in Tainter Lake show that 3.3% or 21 of the total 643 families live below the poverty line. Families with 3 or 4 children have the highest poverty rate of 10.3%, comprising of 4 families. On the other hand, families with 5 or more children have the lowest poverty rate of 0.0%, which includes 0 families.
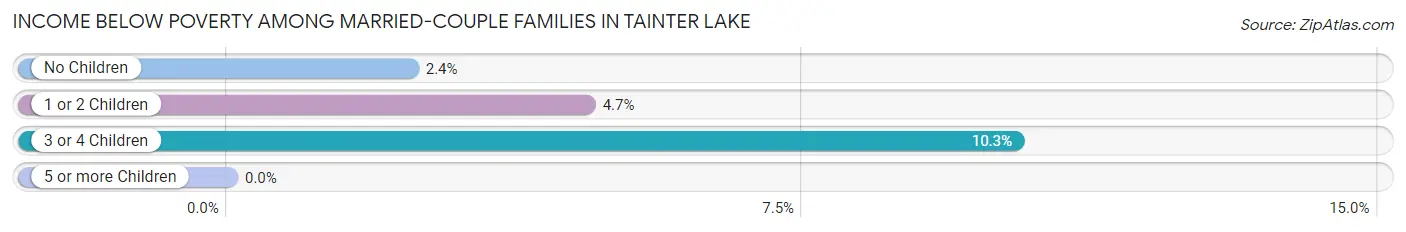
| Children | Above Poverty | Below Poverty |
| No Children | 414 (97.6%) | 10 (2.4%) |
| 1 or 2 Children | 143 (95.3%) | 7 (4.7%) |
| 3 or 4 Children | 35 (89.7%) | 4 (10.3%) |
| 5 or more Children | 30 (100.0%) | 0 (0.0%) |
| Total | 622 (96.7%) | 21 (3.3%) |
Income Below Poverty Among Single-Parent Households in Tainter Lake
| Children | Single Father | Single Mother |
| No Children | 0 (0.0%) | 0 (0.0%) |
| 1 or 2 Children | 0 (0.0%) | 15 (75.0%) |
| 3 or 4 Children | 0 (0.0%) | 0 (0.0%) |
| 5 or more Children | 0 (0.0%) | 0 (0.0%) |
| Total | 0 (0.0%) | 15 (53.6%) |
Income Below Poverty Among Married-Couple vs Single-Parent Households in Tainter Lake
The poverty data for Tainter Lake shows that 21 of the married-couple family households (3.3%) and 15 of the single-parent households (20.5%) are living below the poverty level. Within the married-couple family households, those with 3 or 4 children have the highest poverty rate, with 4 households (10.3%) falling below the poverty line. Among the single-parent households, those with 1 or 2 children have the highest poverty rate, with 15 household (57.7%) living below poverty.
| Children | Married-Couple Families | Single-Parent Households |
| No Children | 10 (2.4%) | 0 (0.0%) |
| 1 or 2 Children | 7 (4.7%) | 15 (57.7%) |
| 3 or 4 Children | 4 (10.3%) | 0 (0.0%) |
| 5 or more Children | 0 (0.0%) | 0 (0.0%) |
| Total | 21 (3.3%) | 15 (20.5%) |
Race in Tainter Lake
The most populous races in Tainter Lake are White / Caucasian (2,646 | 94.9%), Hispanic or Latino (98 | 3.5%), and Two or more Races (88 | 3.2%).
| Race | # Population | % Population |
| Asian | 24 | 0.9% |
| Black / African American | 0 | 0.0% |
| Hawaiian / Pacific | 0 | 0.0% |
| Hispanic or Latino | 98 | 3.5% |
| Native / Alaskan | 0 | 0.0% |
| White / Caucasian | 2,646 | 94.9% |
| Two or more Races | 88 | 3.2% |
| Some other Race | 31 | 1.1% |
| Total | 2,789 | 100.0% |
Ancestry in Tainter Lake
The most populous ancestries reported in Tainter Lake are German (1,519 | 54.5%), Norwegian (618 | 22.2%), Irish (423 | 15.2%), English (418 | 15.0%), and Polish (127 | 4.5%), together accounting for 111.3% of all Tainter Lake residents.
| Ancestry | # Population | % Population |
| Alsatian | 5 | 0.2% |
| American | 97 | 3.5% |
| Austrian | 17 | 0.6% |
| Bangladeshi | 20 | 0.7% |
| Belgian | 2 | 0.1% |
| British | 8 | 0.3% |
| Central American | 58 | 2.1% |
| Cree | 4 | 0.1% |
| Czech | 15 | 0.5% |
| Czechoslovakian | 1 | 0.0% |
| Danish | 21 | 0.7% |
| Dutch | 11 | 0.4% |
| Eastern European | 2 | 0.1% |
| English | 418 | 15.0% |
| European | 28 | 1.0% |
| Finnish | 13 | 0.5% |
| French | 81 | 2.9% |
| French Canadian | 39 | 1.4% |
| German | 1,519 | 54.5% |
| Greek | 5 | 0.2% |
| Icelander | 1 | 0.0% |
| Iranian | 4 | 0.1% |
| Irish | 423 | 15.2% |
| Italian | 75 | 2.7% |
| Korean | 4 | 0.1% |
| Mexican | 31 | 1.1% |
| Nicaraguan | 26 | 0.9% |
| Norwegian | 618 | 22.2% |
| Panamanian | 32 | 1.1% |
| Polish | 127 | 4.5% |
| Portuguese | 3 | 0.1% |
| Scandinavian | 85 | 3.0% |
| Scotch-Irish | 8 | 0.3% |
| Scottish | 11 | 0.4% |
| Slovene | 3 | 0.1% |
| Spaniard | 6 | 0.2% |
| Swedish | 103 | 3.7% |
| Swiss | 10 | 0.4% | View All 38 Rows |
Immigrants in Tainter Lake
The most numerous immigrant groups reported in Tainter Lake came from Central America (33 | 1.2%), Latin America (33 | 1.2%), Nicaragua (26 | 0.9%), Europe (22 | 0.8%), and Western Europe (15 | 0.5%), together accounting for 4.6% of all Tainter Lake residents.
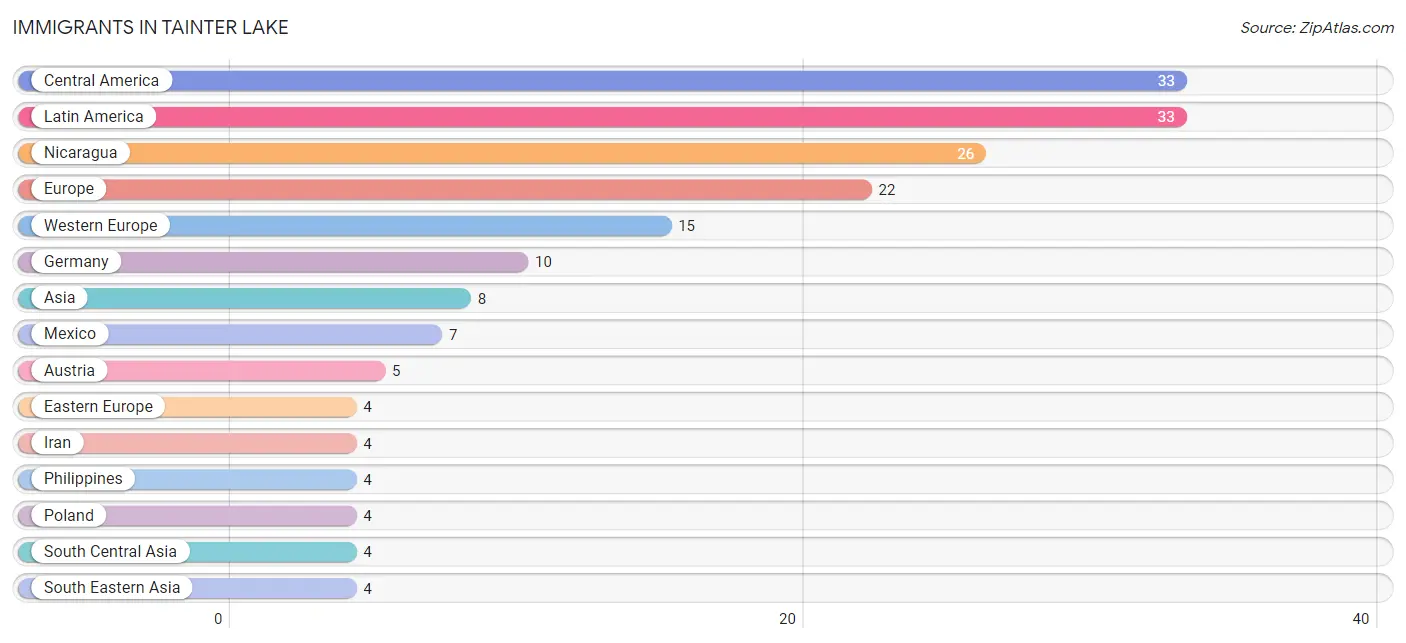
| Immigration Origin | # Population | % Population |
| Asia | 8 | 0.3% |
| Austria | 5 | 0.2% |
| Central America | 33 | 1.2% |
| Eastern Europe | 4 | 0.1% |
| Europe | 22 | 0.8% |
| Germany | 10 | 0.4% |
| Iran | 4 | 0.1% |
| Latin America | 33 | 1.2% |
| Mexico | 7 | 0.3% |
| Nicaragua | 26 | 0.9% |
| Northern Europe | 3 | 0.1% |
| Philippines | 4 | 0.1% |
| Poland | 4 | 0.1% |
| South Central Asia | 4 | 0.1% |
| South Eastern Asia | 4 | 0.1% |
| Western Europe | 15 | 0.5% | View All 16 Rows |
Sex and Age in Tainter Lake
Sex and Age in Tainter Lake
The most populous age groups in Tainter Lake are 10 to 14 Years (230 | 14.3%) for men and 35 to 39 Years (201 | 17.0%) for women.
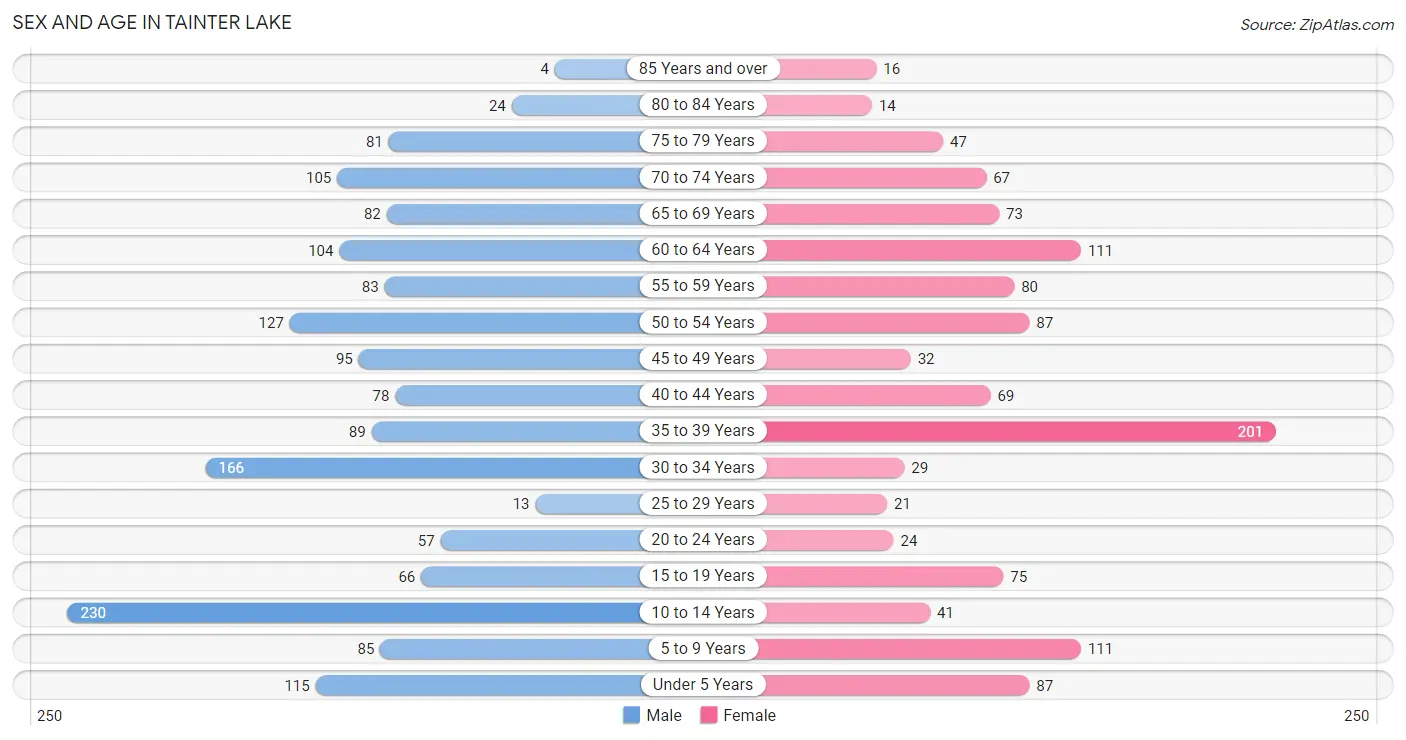
| Age Bracket | Male | Female |
| Under 5 Years | 115 (7.2%) | 87 (7.3%) |
| 5 to 9 Years | 85 (5.3%) | 111 (9.4%) |
| 10 to 14 Years | 230 (14.3%) | 41 (3.5%) |
| 15 to 19 Years | 66 (4.1%) | 75 (6.3%) |
| 20 to 24 Years | 57 (3.5%) | 24 (2.0%) |
| 25 to 29 Years | 13 (0.8%) | 21 (1.8%) |
| 30 to 34 Years | 166 (10.3%) | 29 (2.5%) |
| 35 to 39 Years | 89 (5.6%) | 201 (17.0%) |
| 40 to 44 Years | 78 (4.9%) | 69 (5.8%) |
| 45 to 49 Years | 95 (5.9%) | 32 (2.7%) |
| 50 to 54 Years | 127 (7.9%) | 87 (7.3%) |
| 55 to 59 Years | 83 (5.2%) | 80 (6.8%) |
| 60 to 64 Years | 104 (6.5%) | 111 (9.4%) |
| 65 to 69 Years | 82 (5.1%) | 73 (6.2%) |
| 70 to 74 Years | 105 (6.6%) | 67 (5.7%) |
| 75 to 79 Years | 81 (5.1%) | 47 (4.0%) |
| 80 to 84 Years | 24 (1.5%) | 14 (1.2%) |
| 85 Years and over | 4 (0.3%) | 16 (1.3%) |
| Total | 1,604 (100.0%) | 1,185 (100.0%) |
Families and Households in Tainter Lake
Median Family Size in Tainter Lake
The median family size in Tainter Lake is 3.35 persons per family, with single male/father families (45 | 6.3%) accounting for the largest median family size of 3.49 persons per family. On the other hand, single female/mother families (28 | 3.9%) represent the smallest median family size with 2.32 persons per family.
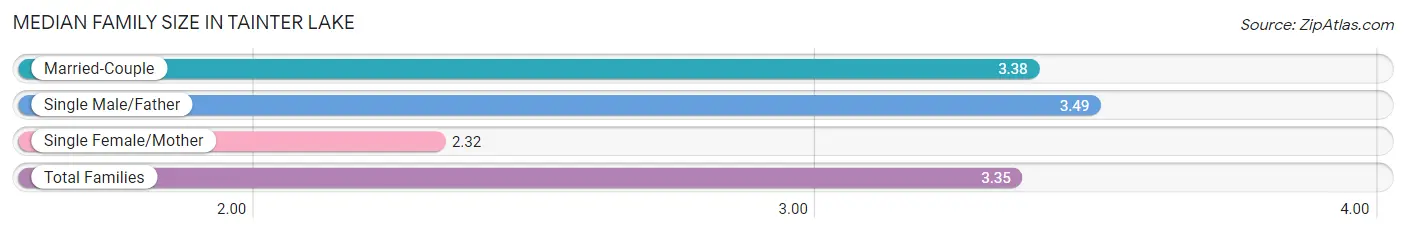
| Family Type | # Families | Family Size |
| Married-Couple | 643 (89.8%) | 3.38 |
| Single Male/Father | 45 (6.3%) | 3.49 |
| Single Female/Mother | 28 (3.9%) | 2.32 |
| Total Families | 716 (100.0%) | 3.35 |
Median Household Size in Tainter Lake
The median household size in Tainter Lake is 2.72 persons per household, with single male/father households (45 | 4.4%) accounting for the largest median household size of 4 persons per household. non-family households (307 | 30.0%) represent the smallest median household size with 1.15 persons per household.
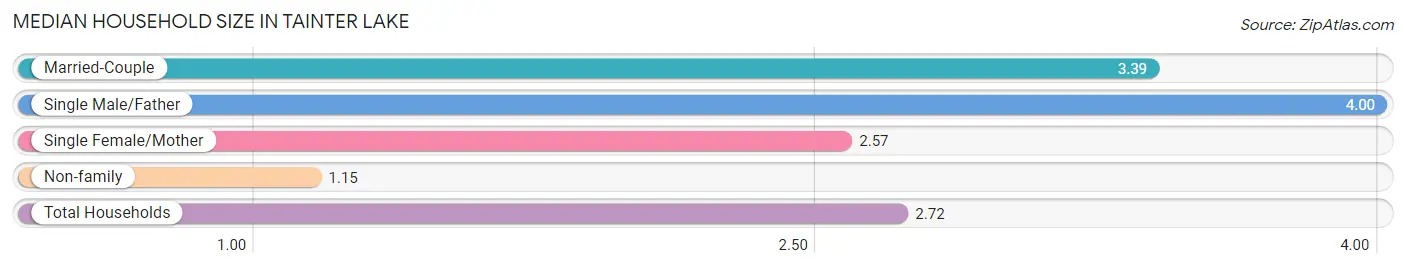
| Household Type | # Households | Household Size |
| Married-Couple | 643 (62.8%) | 3.39 |
| Single Male/Father | 45 (4.4%) | 4.00 |
| Single Female/Mother | 28 (2.7%) | 2.57 |
| Non-family | 307 (30.0%) | 1.15 |
| Total Households | 1,023 (100.0%) | 2.72 |
Household Size by Marriage Status in Tainter Lake
Out of a total of 1,023 households in Tainter Lake, 716 (70.0%) are family households, while 307 (30.0%) are nonfamily households. The most numerous type of family households are 2-person households, comprising 402, and the most common type of nonfamily households are 1-person households, comprising 266.
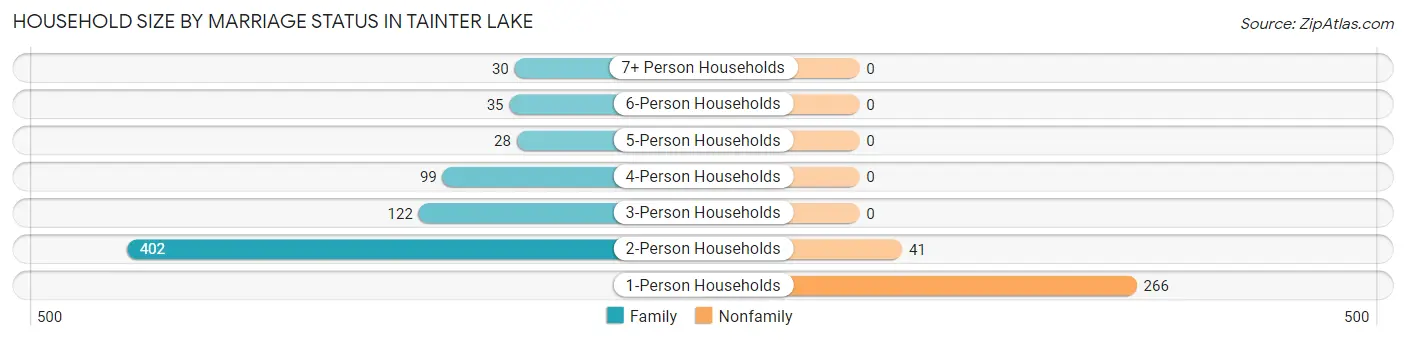
| Household Size | Family Households | Nonfamily Households |
| 1-Person Households | - | 266 (26.0%) |
| 2-Person Households | 402 (39.3%) | 41 (4.0%) |
| 3-Person Households | 122 (11.9%) | 0 (0.0%) |
| 4-Person Households | 99 (9.7%) | 0 (0.0%) |
| 5-Person Households | 28 (2.7%) | 0 (0.0%) |
| 6-Person Households | 35 (3.4%) | 0 (0.0%) |
| 7+ Person Households | 30 (2.9%) | 0 (0.0%) |
| Total | 716 (70.0%) | 307 (30.0%) |
Female Fertility in Tainter Lake
Fertility by Age in Tainter Lake
Average fertility rate in Tainter Lake is 15.0 births per 1,000 women. Women in the age bracket of 20 to 34 years have the highest fertility rate with 95.0 births per 1,000 women. Women in the age bracket of 20 to 34 years acount for 100.0% of all women with births.
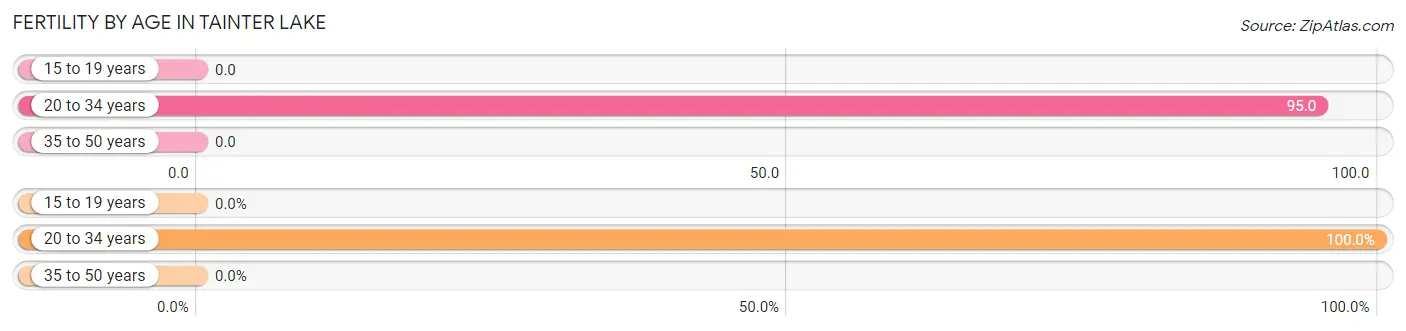
| Age Bracket | Women with Births | Births / 1,000 Women |
| 15 to 19 years | 0 (0.0%) | 0.0 |
| 20 to 34 years | 7 (100.0%) | 95.0 |
| 35 to 50 years | 0 (0.0%) | 0.0 |
| Total | 7 (100.0%) | 15.0 |
Fertility by Age by Marriage Status in Tainter Lake
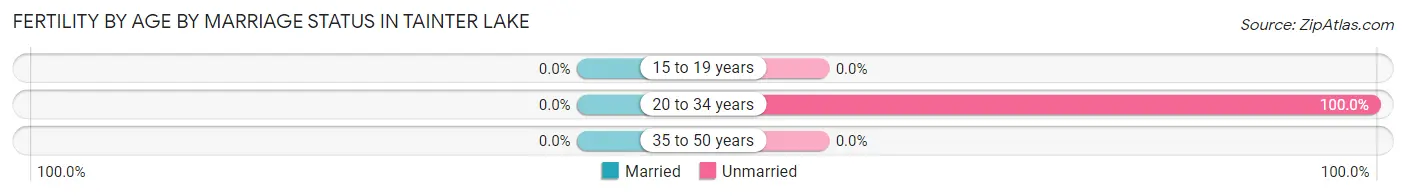
| Age Bracket | Married | Unmarried |
| 15 to 19 years | 0 (0.0%) | 0 (0.0%) |
| 20 to 34 years | 0 (0.0%) | 7 (100.0%) |
| 35 to 50 years | 0 (0.0%) | 0 (0.0%) |
| Total | 0 (0.0%) | 7 (100.0%) |
Fertility by Education in Tainter Lake
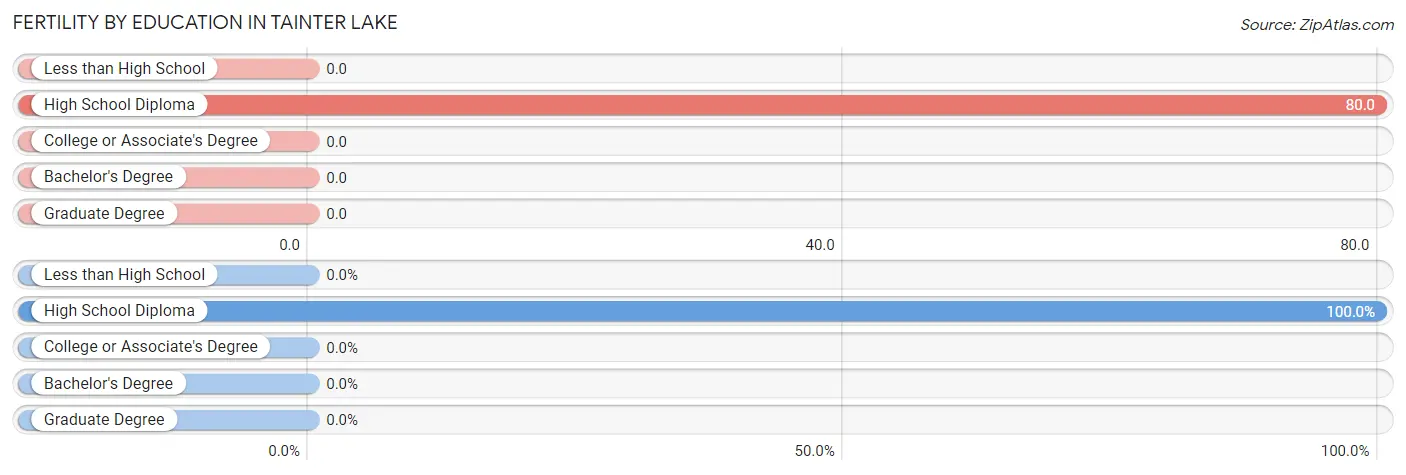
| Educational Attainment | Women with Births | Births / 1,000 Women |
| Less than High School | 0 (0.0%) | 0.0 |
| High School Diploma | 7 (100.0%) | 80.0 |
| College or Associate's Degree | 0 (0.0%) | 0.0 |
| Bachelor's Degree | 0 (0.0%) | 0.0 |
| Graduate Degree | 0 (0.0%) | 0.0 |
| Total | 7 (100.0%) | 15.0 |
Fertility by Education by Marriage Status in Tainter Lake
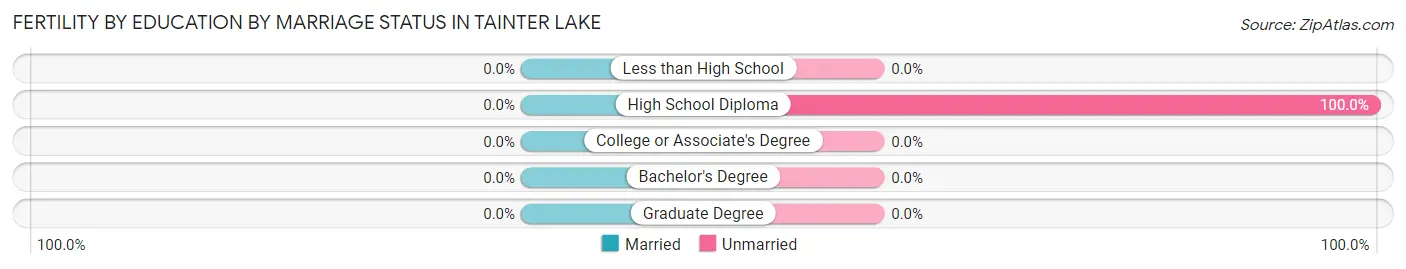
| Educational Attainment | Married | Unmarried |
| Less than High School | 0 (0.0%) | 0 (0.0%) |
| High School Diploma | 0 (0.0%) | 7 (100.0%) |
| College or Associate's Degree | 0 (0.0%) | 0 (0.0%) |
| Bachelor's Degree | 0 (0.0%) | 0 (0.0%) |
| Graduate Degree | 0 (0.0%) | 0 (0.0%) |
| Total | 0 (0.0%) | 7 (100.0%) |
Employment Characteristics in Tainter Lake
Employment by Class of Employer in Tainter Lake
Among the 1,375 employed individuals in Tainter Lake, private company employees (825 | 60.0%), not-for-profit organizations (176 | 12.8%), and state government employees (107 | 7.8%) make up the most common classes of employment.
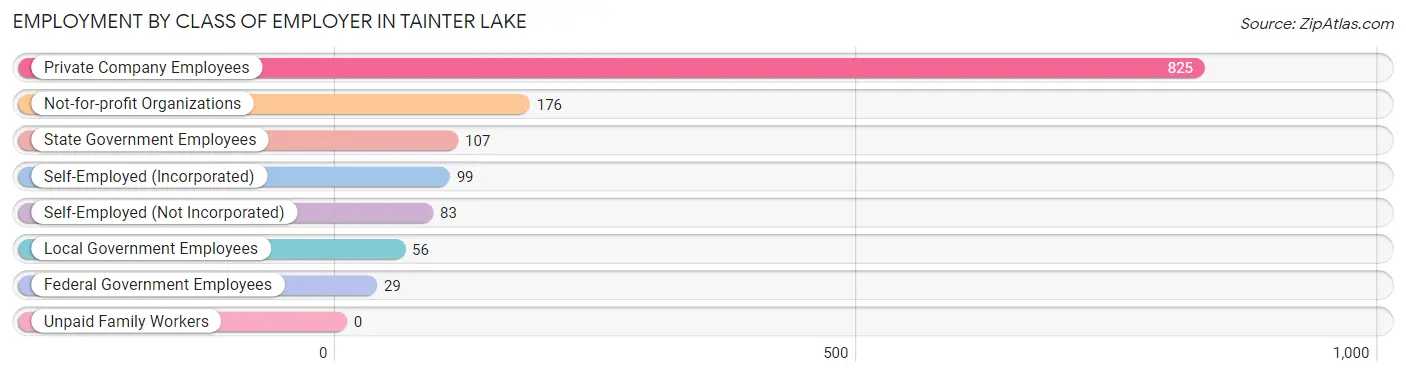
| Employer Class | # Employees | % Employees |
| Private Company Employees | 825 | 60.0% |
| Self-Employed (Incorporated) | 99 | 7.2% |
| Self-Employed (Not Incorporated) | 83 | 6.0% |
| Not-for-profit Organizations | 176 | 12.8% |
| Local Government Employees | 56 | 4.1% |
| State Government Employees | 107 | 7.8% |
| Federal Government Employees | 29 | 2.1% |
| Unpaid Family Workers | 0 | 0.0% |
| Total | 1,375 | 100.0% |
Employment Status by Age in Tainter Lake
According to the labor force statistics for Tainter Lake, out of the total population over 16 years of age (2,066), 69.8% or 1,442 individuals are in the labor force, with 4.6% or 66 of them unemployed. The age group with the highest labor force participation rate is 20 to 24 years, with 100.0% or 81 individuals in the labor force. Within the labor force, the 20 to 24 years age range has the highest percentage of unemployed individuals, with 29.6% or 24 of them being unemployed.
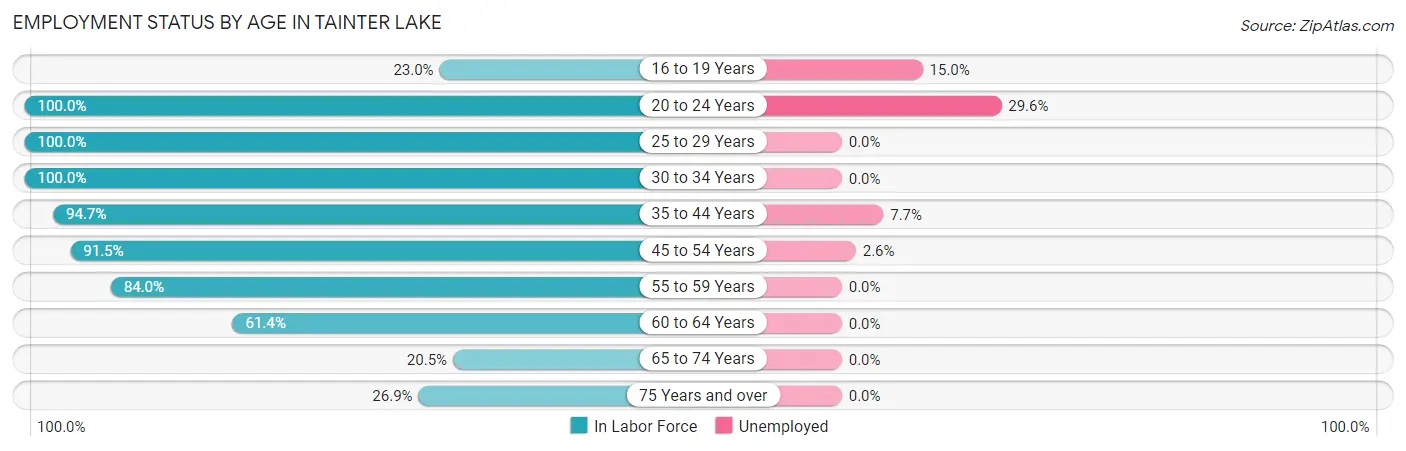
| Age Bracket | In Labor Force | Unemployed |
| 16 to 19 Years | 20 (23.0%) | 3 (15.0%) |
| 20 to 24 Years | 81 (100.0%) | 24 (29.6%) |
| 25 to 29 Years | 34 (100.0%) | 0 (0.0%) |
| 30 to 34 Years | 195 (100.0%) | 0 (0.0%) |
| 35 to 44 Years | 414 (94.7%) | 32 (7.7%) |
| 45 to 54 Years | 312 (91.5%) | 8 (2.6%) |
| 55 to 59 Years | 137 (84.0%) | 0 (0.0%) |
| 60 to 64 Years | 132 (61.4%) | 0 (0.0%) |
| 65 to 74 Years | 67 (20.5%) | 0 (0.0%) |
| 75 Years and over | 50 (26.9%) | 0 (0.0%) |
| Total | 1,442 (69.8%) | 66 (4.6%) |
Employment Status by Educational Attainment in Tainter Lake
According to labor force statistics for Tainter Lake, 88.4% of individuals (1,224) out of the total population between 25 and 64 years of age (1,385) are in the labor force, with 3.3% or 40 of them being unemployed. The group with the highest labor force participation rate are those with the educational attainment of bachelor's degree or higher, with 91.1% or 500 individuals in the labor force. Within the labor force, individuals with high school diploma education have the highest percentage of unemployment, with 8.5% or 19 of them being unemployed.
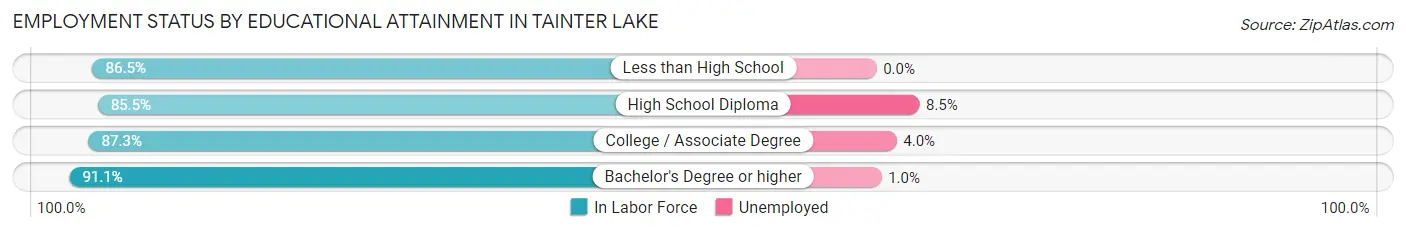
| Educational Attainment | In Labor Force | Unemployed |
| Less than High School | 96 (86.5%) | 0 (0.0%) |
| High School Diploma | 224 (85.5%) | 22 (8.5%) |
| College / Associate Degree | 404 (87.3%) | 19 (4.0%) |
| Bachelor's Degree or higher | 500 (91.1%) | 5 (1.0%) |
| Total | 1,224 (88.4%) | 46 (3.3%) |
Employment Occupations by Sex in Tainter Lake
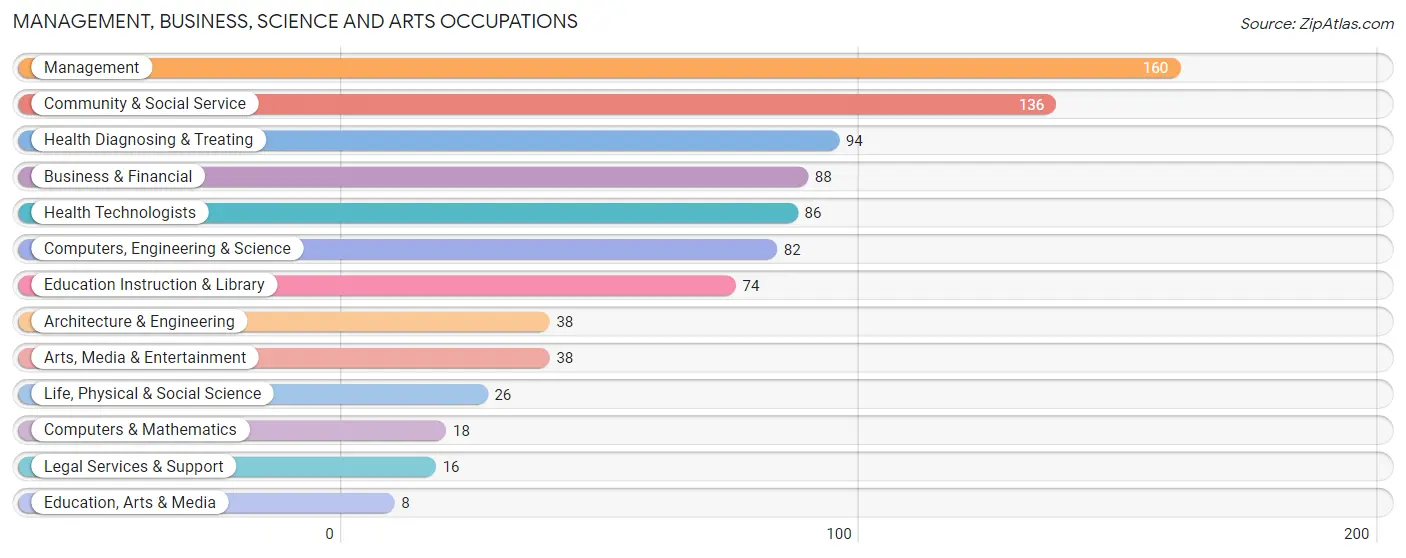
Management, Business, Science and Arts Occupations
The most common Management, Business, Science and Arts occupations in Tainter Lake are Management (160 | 11.6%), Community & Social Service (136 | 9.9%), Health Diagnosing & Treating (94 | 6.8%), Business & Financial (88 | 6.4%), and Health Technologists (86 | 6.2%).
Management, Business, Science and Arts Occupations by Sex
Within the Management, Business, Science and Arts occupations in Tainter Lake, the most male-oriented occupations are Architecture & Engineering (100.0%), Life, Physical & Social Science (100.0%), and Computers, Engineering & Science (89.0%), while the most female-oriented occupations are Education, Arts & Media (100.0%), Business & Financial (73.9%), and Health Diagnosing & Treating (67.0%).
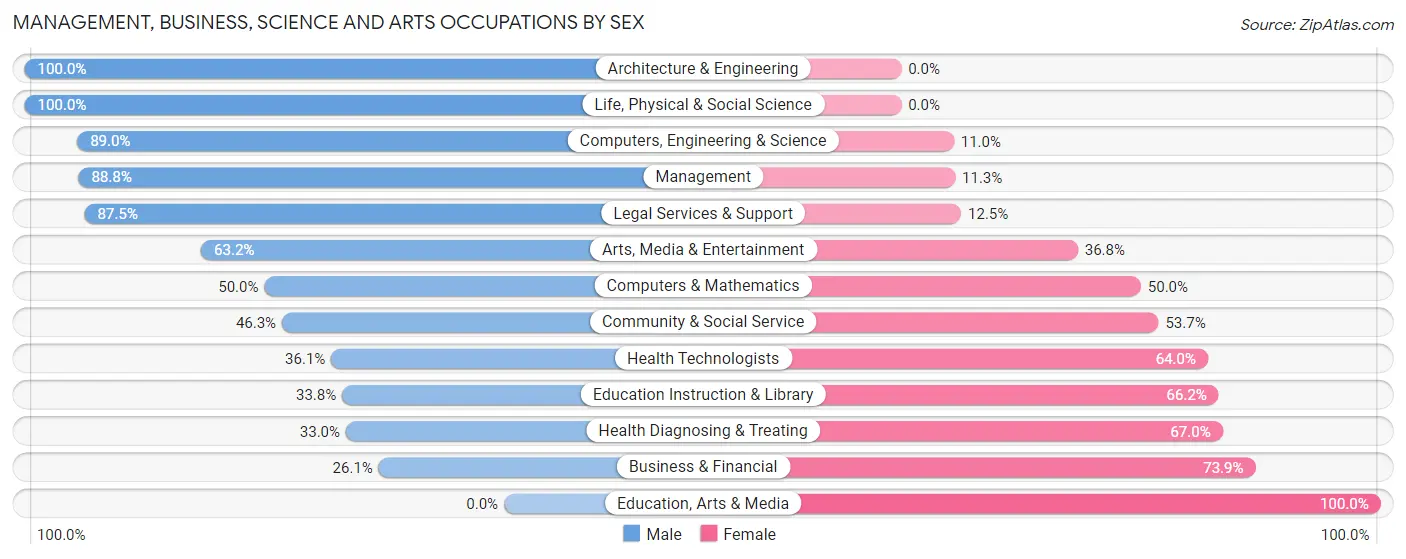
| Occupation | Male | Female |
| Management | 142 (88.7%) | 18 (11.3%) |
| Business & Financial | 23 (26.1%) | 65 (73.9%) |
| Computers, Engineering & Science | 73 (89.0%) | 9 (11.0%) |
| Computers & Mathematics | 9 (50.0%) | 9 (50.0%) |
| Architecture & Engineering | 38 (100.0%) | 0 (0.0%) |
| Life, Physical & Social Science | 26 (100.0%) | 0 (0.0%) |
| Community & Social Service | 63 (46.3%) | 73 (53.7%) |
| Education, Arts & Media | 0 (0.0%) | 8 (100.0%) |
| Legal Services & Support | 14 (87.5%) | 2 (12.5%) |
| Education Instruction & Library | 25 (33.8%) | 49 (66.2%) |
| Arts, Media & Entertainment | 24 (63.2%) | 14 (36.8%) |
| Health Diagnosing & Treating | 31 (33.0%) | 63 (67.0%) |
| Health Technologists | 31 (36.0%) | 55 (63.9%) |
| Total (Category) | 332 (59.3%) | 228 (40.7%) |
| Total (Overall) | 791 (57.5%) | 584 (42.5%) |
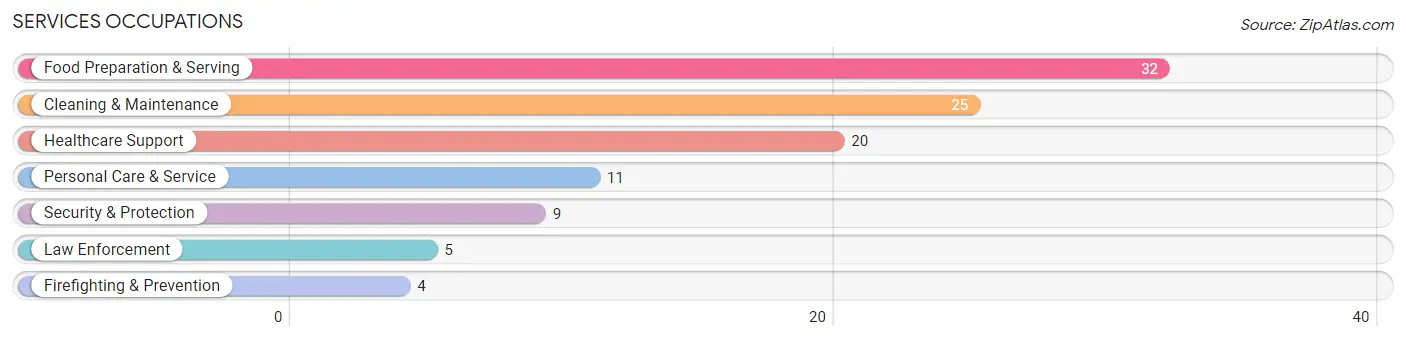
Services Occupations
The most common Services occupations in Tainter Lake are Food Preparation & Serving (32 | 2.3%), Cleaning & Maintenance (25 | 1.8%), Healthcare Support (20 | 1.5%), Personal Care & Service (11 | 0.8%), and Security & Protection (9 | 0.6%).
Services Occupations by Sex
Within the Services occupations in Tainter Lake, the most male-oriented occupations are Security & Protection (100.0%), Firefighting & Prevention (100.0%), and Law Enforcement (100.0%), while the most female-oriented occupations are Healthcare Support (100.0%), Cleaning & Maintenance (60.0%), and Food Preparation & Serving (59.4%).
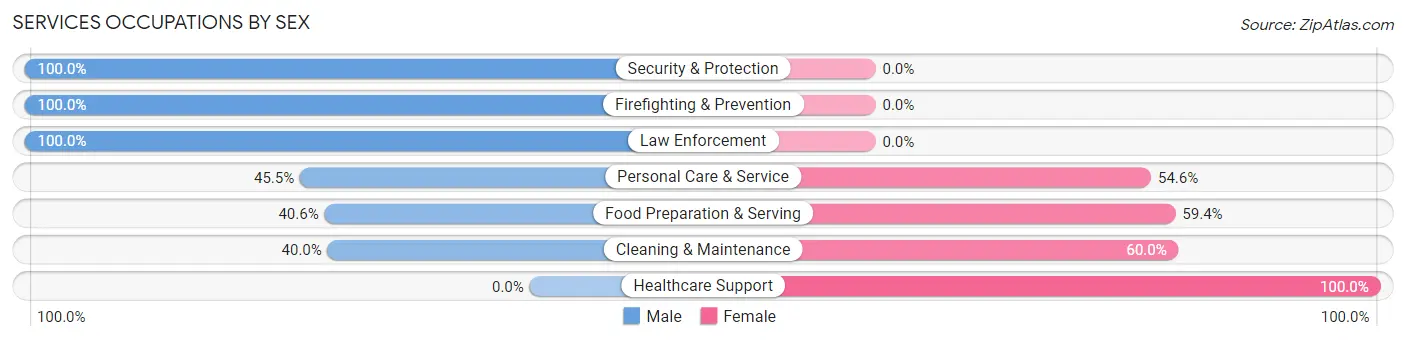
| Occupation | Male | Female |
| Healthcare Support | 0 (0.0%) | 20 (100.0%) |
| Security & Protection | 9 (100.0%) | 0 (0.0%) |
| Firefighting & Prevention | 4 (100.0%) | 0 (0.0%) |
| Law Enforcement | 5 (100.0%) | 0 (0.0%) |
| Food Preparation & Serving | 13 (40.6%) | 19 (59.4%) |
| Cleaning & Maintenance | 10 (40.0%) | 15 (60.0%) |
| Personal Care & Service | 5 (45.5%) | 6 (54.5%) |
| Total (Category) | 37 (38.1%) | 60 (61.9%) |
| Total (Overall) | 791 (57.5%) | 584 (42.5%) |
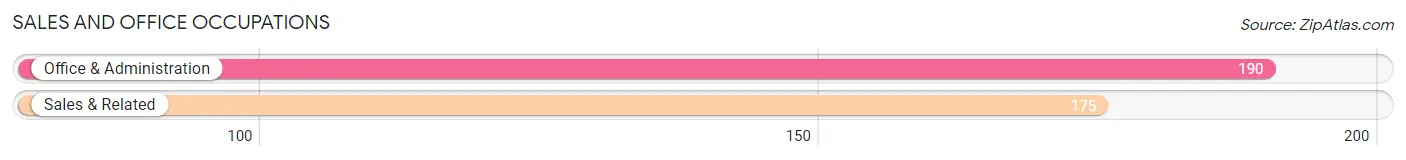
Sales and Office Occupations
The most common Sales and Office occupations in Tainter Lake are Office & Administration (190 | 13.8%), and Sales & Related (175 | 12.7%).
Sales and Office Occupations by Sex
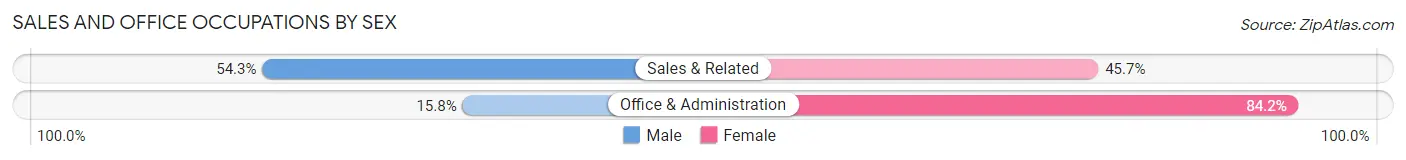
| Occupation | Male | Female |
| Sales & Related | 95 (54.3%) | 80 (45.7%) |
| Office & Administration | 30 (15.8%) | 160 (84.2%) |
| Total (Category) | 125 (34.3%) | 240 (65.7%) |
| Total (Overall) | 791 (57.5%) | 584 (42.5%) |
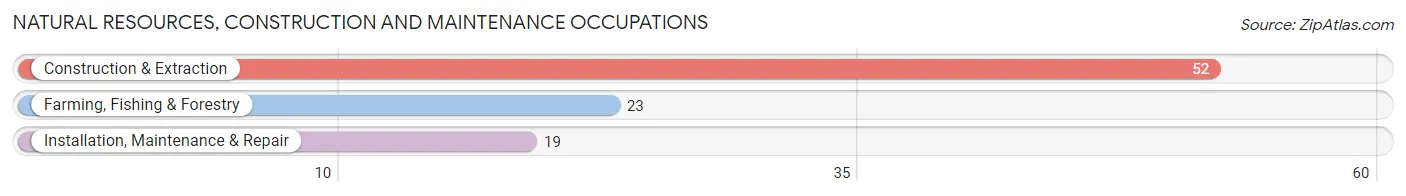
Natural Resources, Construction and Maintenance Occupations
The most common Natural Resources, Construction and Maintenance occupations in Tainter Lake are Construction & Extraction (52 | 3.8%), Farming, Fishing & Forestry (23 | 1.7%), and Installation, Maintenance & Repair (19 | 1.4%).
Natural Resources, Construction and Maintenance Occupations by Sex
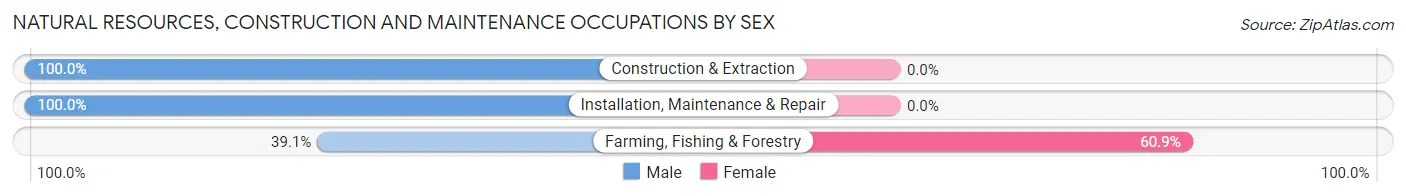
| Occupation | Male | Female |
| Farming, Fishing & Forestry | 9 (39.1%) | 14 (60.9%) |
| Construction & Extraction | 52 (100.0%) | 0 (0.0%) |
| Installation, Maintenance & Repair | 19 (100.0%) | 0 (0.0%) |
| Total (Category) | 80 (85.1%) | 14 (14.9%) |
| Total (Overall) | 791 (57.5%) | 584 (42.5%) |
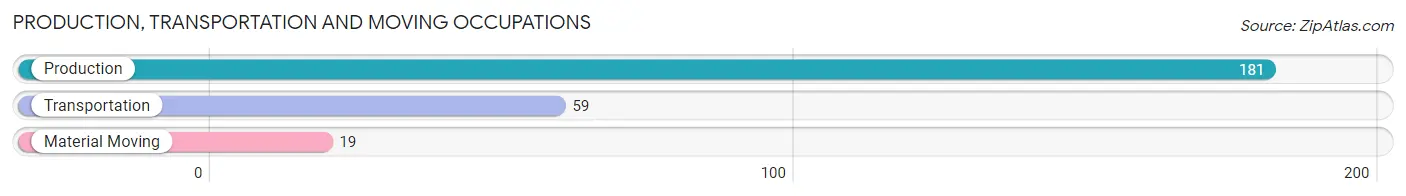
Production, Transportation and Moving Occupations
The most common Production, Transportation and Moving occupations in Tainter Lake are Production (181 | 13.2%), Transportation (59 | 4.3%), and Material Moving (19 | 1.4%).
Production, Transportation and Moving Occupations by Sex
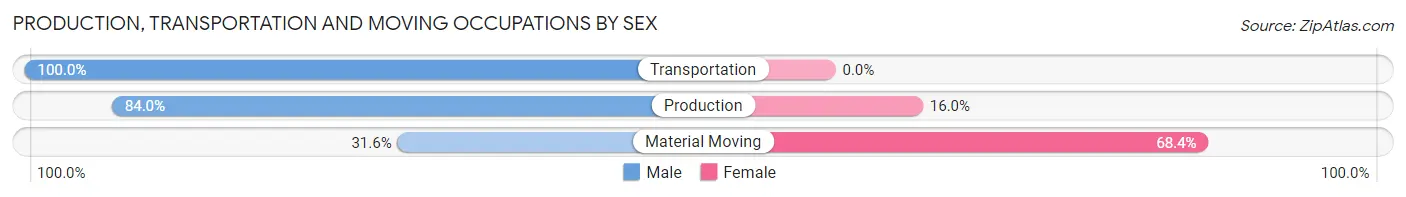
| Occupation | Male | Female |
| Production | 152 (84.0%) | 29 (16.0%) |
| Transportation | 59 (100.0%) | 0 (0.0%) |
| Material Moving | 6 (31.6%) | 13 (68.4%) |
| Total (Category) | 217 (83.8%) | 42 (16.2%) |
| Total (Overall) | 791 (57.5%) | 584 (42.5%) |
Employment Industries by Sex in Tainter Lake
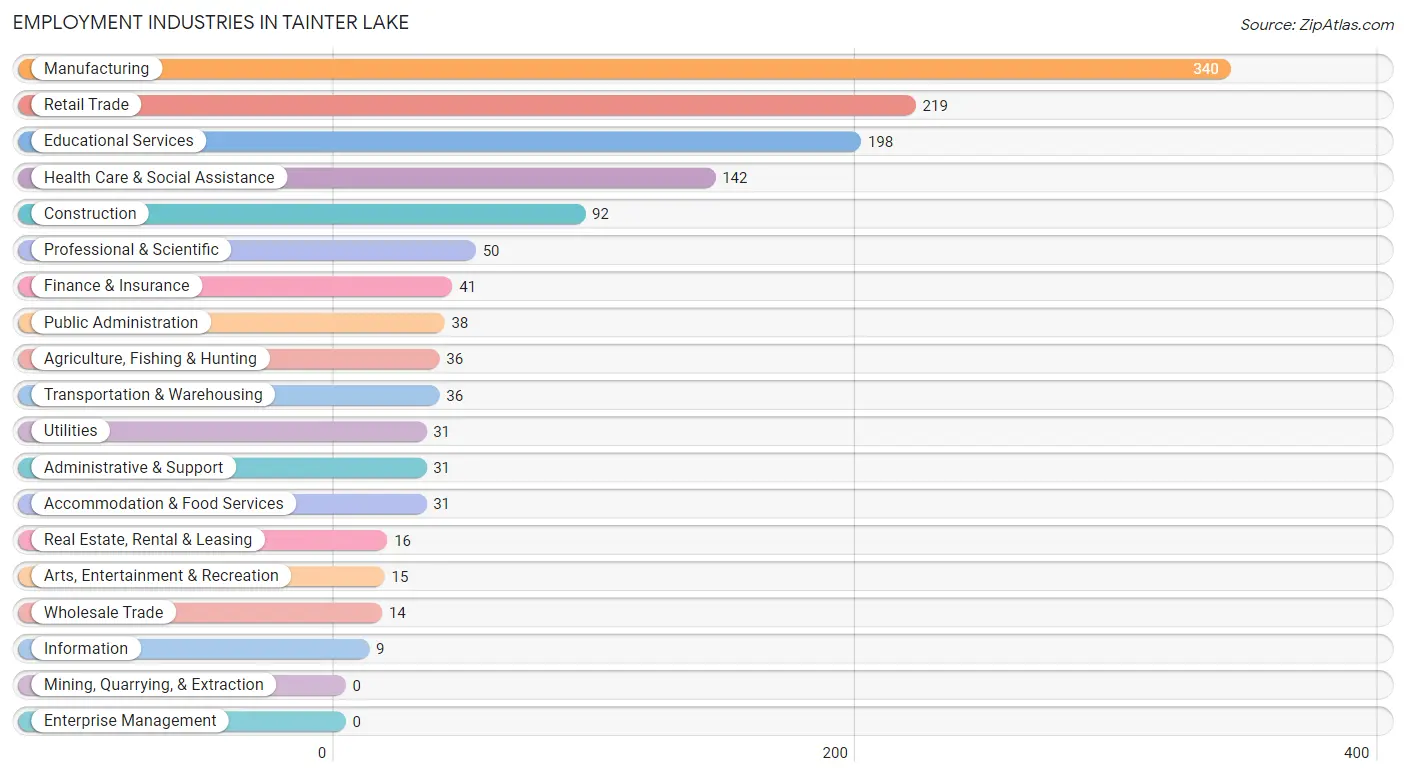
Employment Industries in Tainter Lake
The major employment industries in Tainter Lake include Manufacturing (340 | 24.7%), Retail Trade (219 | 15.9%), Educational Services (198 | 14.4%), Health Care & Social Assistance (142 | 10.3%), and Construction (92 | 6.7%).
Employment Industries by Sex in Tainter Lake
The Tainter Lake industries that see more men than women are Public Administration (100.0%), Agriculture, Fishing & Hunting (88.9%), and Construction (81.5%), whereas the industries that tend to have a higher number of women are Information (100.0%), Health Care & Social Assistance (74.7%), and Finance & Insurance (70.7%).
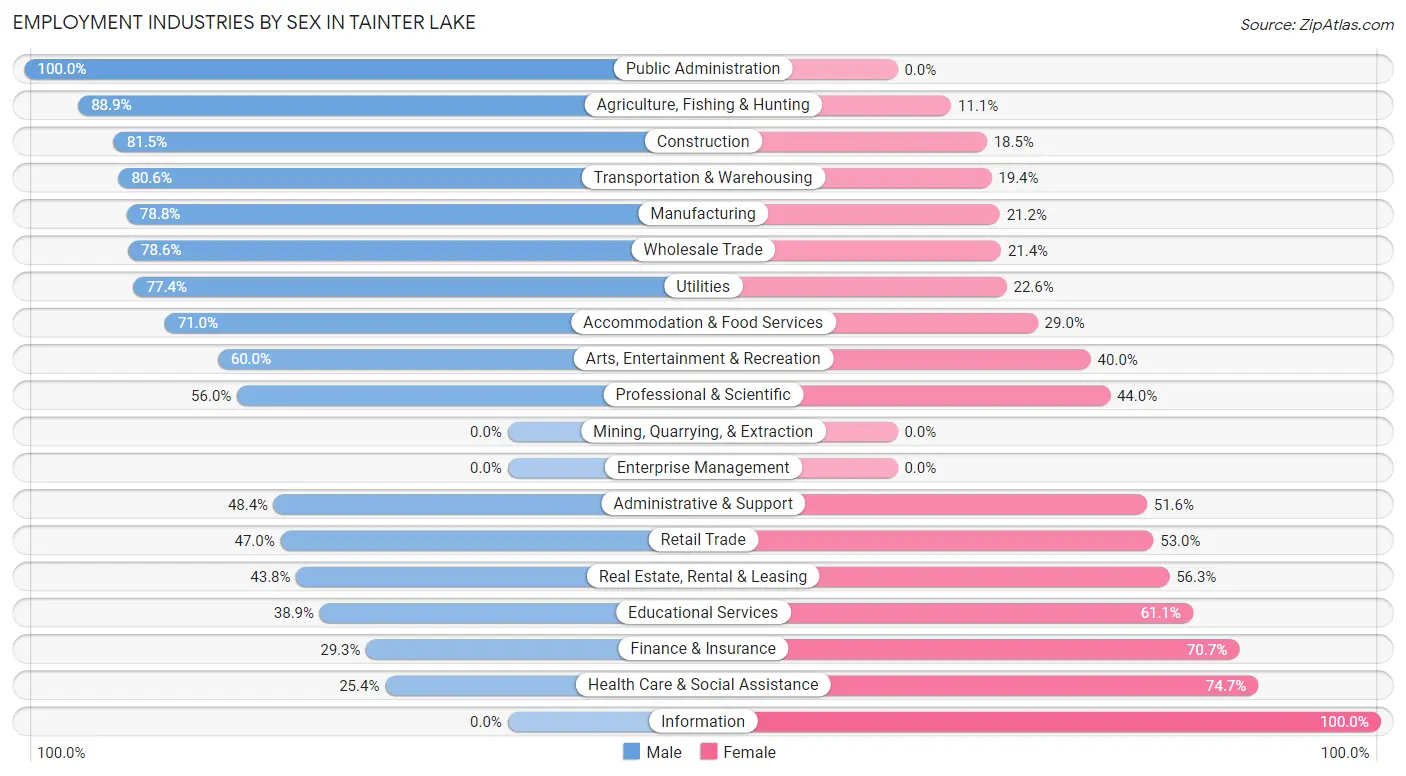
| Industry | Male | Female |
| Agriculture, Fishing & Hunting | 32 (88.9%) | 4 (11.1%) |
| Mining, Quarrying, & Extraction | 0 (0.0%) | 0 (0.0%) |
| Construction | 75 (81.5%) | 17 (18.5%) |
| Manufacturing | 268 (78.8%) | 72 (21.2%) |
| Wholesale Trade | 11 (78.6%) | 3 (21.4%) |
| Retail Trade | 103 (47.0%) | 116 (53.0%) |
| Transportation & Warehousing | 29 (80.6%) | 7 (19.4%) |
| Utilities | 24 (77.4%) | 7 (22.6%) |
| Information | 0 (0.0%) | 9 (100.0%) |
| Finance & Insurance | 12 (29.3%) | 29 (70.7%) |
| Real Estate, Rental & Leasing | 7 (43.8%) | 9 (56.2%) |
| Professional & Scientific | 28 (56.0%) | 22 (44.0%) |
| Enterprise Management | 0 (0.0%) | 0 (0.0%) |
| Administrative & Support | 15 (48.4%) | 16 (51.6%) |
| Educational Services | 77 (38.9%) | 121 (61.1%) |
| Health Care & Social Assistance | 36 (25.4%) | 106 (74.7%) |
| Arts, Entertainment & Recreation | 9 (60.0%) | 6 (40.0%) |
| Accommodation & Food Services | 22 (71.0%) | 9 (29.0%) |
| Public Administration | 38 (100.0%) | 0 (0.0%) |
| Total | 791 (57.5%) | 584 (42.5%) |
Education in Tainter Lake
School Enrollment in Tainter Lake
The most common levels of schooling among the 776 students in Tainter Lake are high school (222 | 28.6%), elementary school (154 | 19.9%), and college / undergraduate (135 | 17.4%).
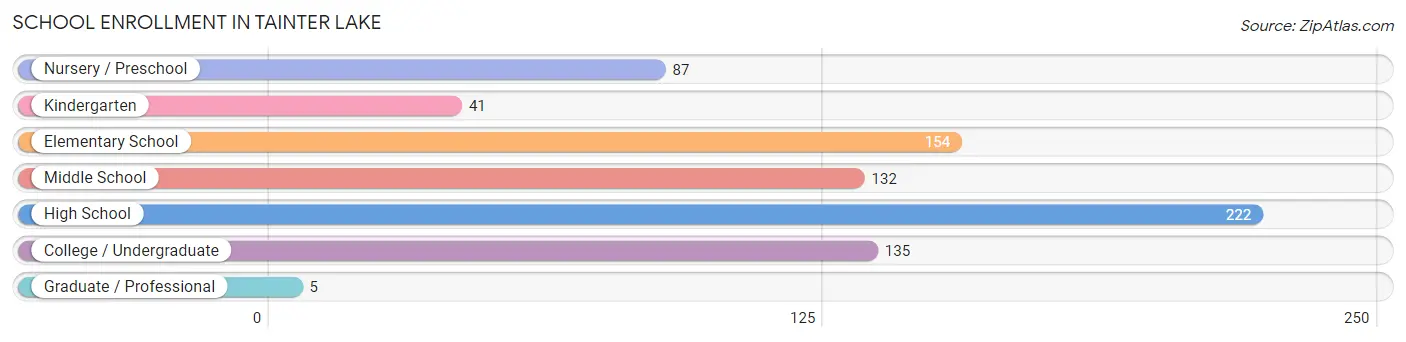
| School Level | # Students | % Students |
| Nursery / Preschool | 87 | 11.2% |
| Kindergarten | 41 | 5.3% |
| Elementary School | 154 | 19.9% |
| Middle School | 132 | 17.0% |
| High School | 222 | 28.6% |
| College / Undergraduate | 135 | 17.4% |
| Graduate / Professional | 5 | 0.6% |
| Total | 776 | 100.0% |
School Enrollment by Age by Funding Source in Tainter Lake
Out of a total of 776 students who are enrolled in schools in Tainter Lake, 46 (5.9%) attend a private institution, while the remaining 730 (94.1%) are enrolled in public schools. The age group of 25 to 34 year olds has the highest likelihood of being enrolled in private schools, with 5 (45.5% in the age bracket) enrolled. Conversely, the age group of 15 to 17 year olds has the lowest likelihood of being enrolled in a private school, with 122 (100.0% in the age bracket) attending a public institution.
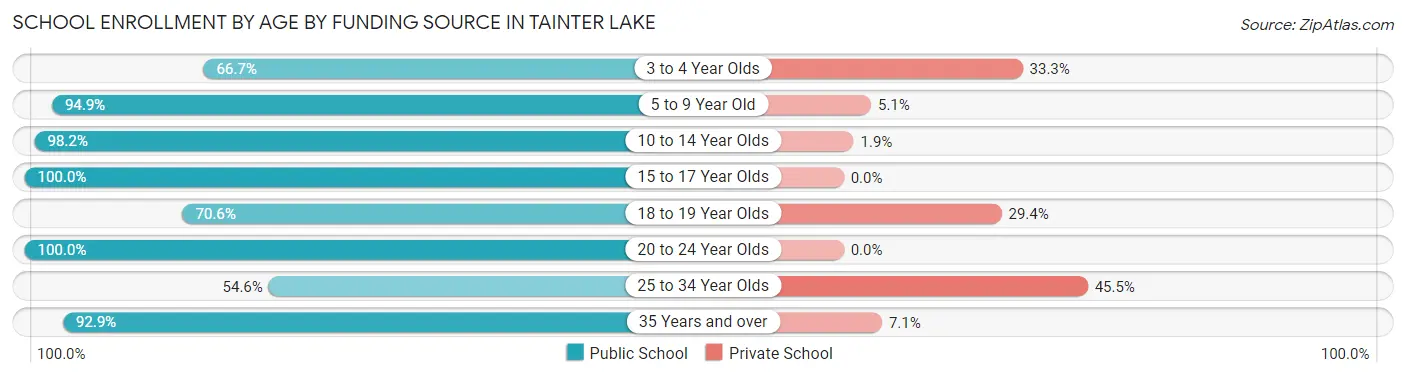
| Age Bracket | Public School | Private School |
| 3 to 4 Year Olds | 30 (66.7%) | 15 (33.3%) |
| 5 to 9 Year Old | 186 (94.9%) | 10 (5.1%) |
| 10 to 14 Year Olds | 266 (98.2%) | 5 (1.8%) |
| 15 to 17 Year Olds | 122 (100.0%) | 0 (0.0%) |
| 18 to 19 Year Olds | 12 (70.6%) | 5 (29.4%) |
| 20 to 24 Year Olds | 30 (100.0%) | 0 (0.0%) |
| 25 to 34 Year Olds | 6 (54.5%) | 5 (45.5%) |
| 35 Years and over | 78 (92.9%) | 6 (7.1%) |
| Total | 730 (94.1%) | 46 (5.9%) |
Educational Attainment by Field of Study in Tainter Lake
Business (152 | 18.2%), education (152 | 18.2%), arts & humanities (88 | 10.5%), bio, nature & agricultural (87 | 10.4%), and science & technology (82 | 9.8%) are the most common fields of study among 837 individuals in Tainter Lake who have obtained a bachelor's degree or higher.
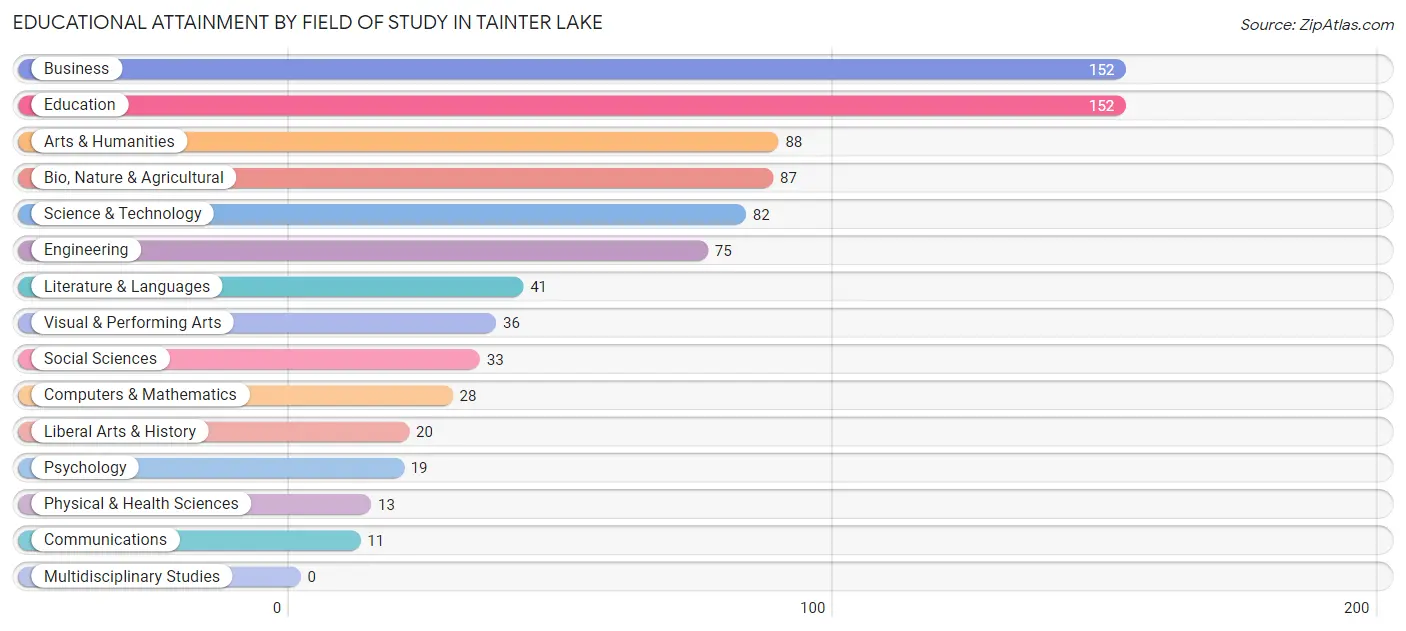
| Field of Study | # Graduates | % Graduates |
| Computers & Mathematics | 28 | 3.4% |
| Bio, Nature & Agricultural | 87 | 10.4% |
| Physical & Health Sciences | 13 | 1.5% |
| Psychology | 19 | 2.3% |
| Social Sciences | 33 | 3.9% |
| Engineering | 75 | 9.0% |
| Multidisciplinary Studies | 0 | 0.0% |
| Science & Technology | 82 | 9.8% |
| Business | 152 | 18.2% |
| Education | 152 | 18.2% |
| Literature & Languages | 41 | 4.9% |
| Liberal Arts & History | 20 | 2.4% |
| Visual & Performing Arts | 36 | 4.3% |
| Communications | 11 | 1.3% |
| Arts & Humanities | 88 | 10.5% |
| Total | 837 | 100.0% |
Transportation & Commute in Tainter Lake
Vehicle Availability by Sex in Tainter Lake
The most prevalent vehicle ownership categories in Tainter Lake are males with 3 vehicles (319, accounting for 40.3%) and females with 3 vehicles (221, making up 54.6%).
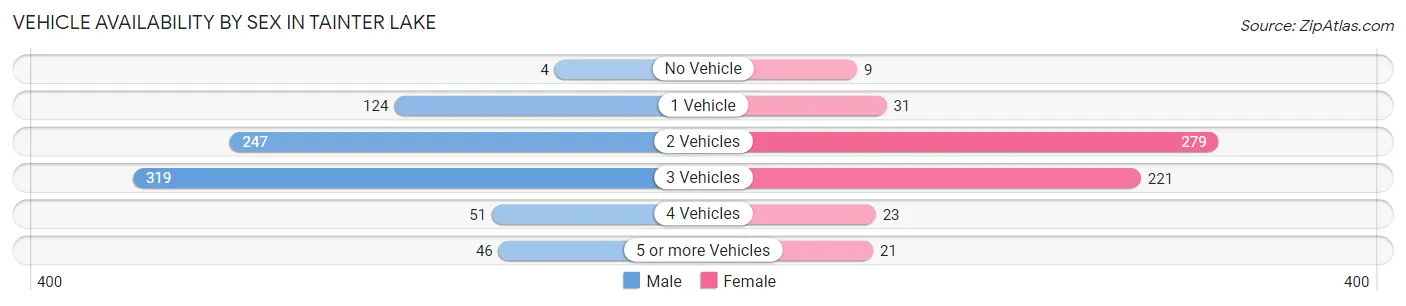
| Vehicles Available | Male | Female |
| No Vehicle | 4 (0.5%) | 9 (1.5%) |
| 1 Vehicle | 124 (15.7%) | 31 (5.3%) |
| 2 Vehicles | 247 (31.2%) | 279 (47.8%) |
| 3 Vehicles | 319 (40.3%) | 221 (37.8%) |
| 4 Vehicles | 51 (6.5%) | 23 (3.9%) |
| 5 or more Vehicles | 46 (5.8%) | 21 (3.6%) |
| Total | 791 (100.0%) | 584 (100.0%) |
Commute Time in Tainter Lake
The most frequently occuring commute durations in Tainter Lake are 10 to 14 minutes (300 commuters, 23.9%), 15 to 19 minutes (283 commuters, 22.6%), and 30 to 34 minutes (142 commuters, 11.3%).
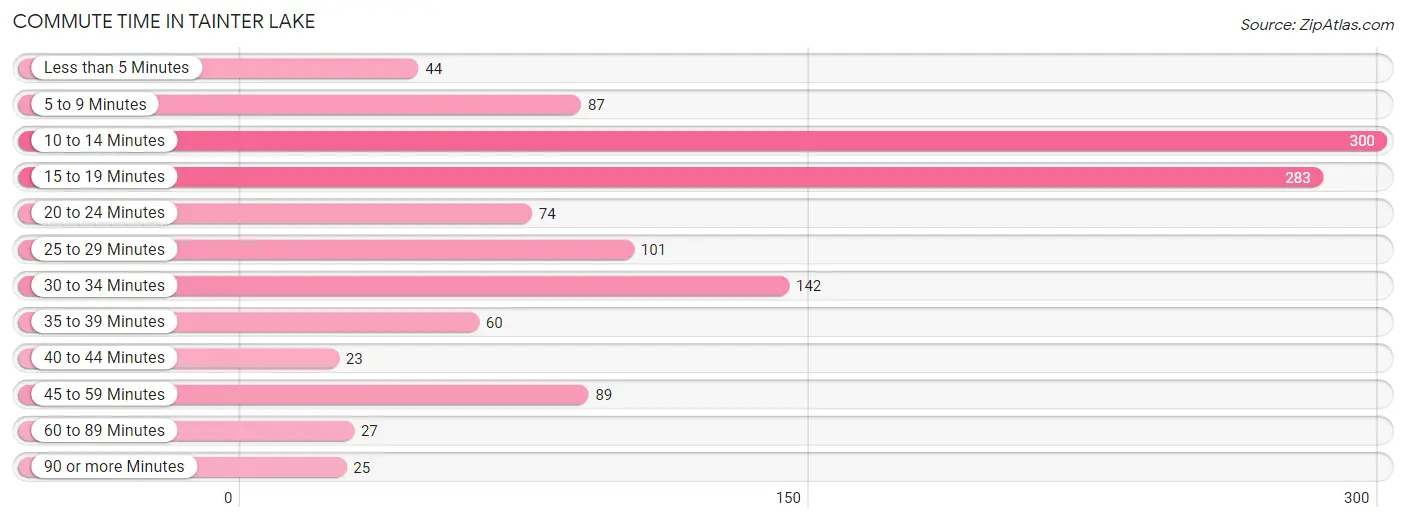
| Commute Time | # Commuters | % Commuters |
| Less than 5 Minutes | 44 | 3.5% |
| 5 to 9 Minutes | 87 | 6.9% |
| 10 to 14 Minutes | 300 | 23.9% |
| 15 to 19 Minutes | 283 | 22.6% |
| 20 to 24 Minutes | 74 | 5.9% |
| 25 to 29 Minutes | 101 | 8.1% |
| 30 to 34 Minutes | 142 | 11.3% |
| 35 to 39 Minutes | 60 | 4.8% |
| 40 to 44 Minutes | 23 | 1.8% |
| 45 to 59 Minutes | 89 | 7.1% |
| 60 to 89 Minutes | 27 | 2.1% |
| 90 or more Minutes | 25 | 2.0% |
Commute Time by Sex in Tainter Lake
The most common commute times in Tainter Lake are 10 to 14 minutes (154 commuters, 20.8%) for males and 10 to 14 minutes (146 commuters, 28.3%) for females.
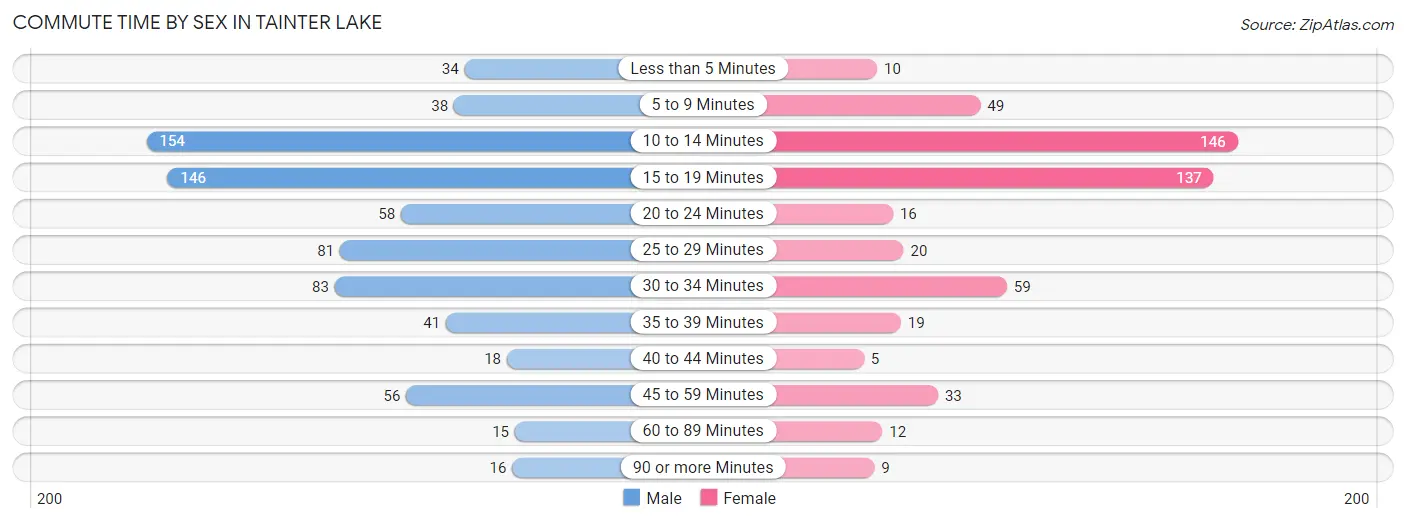
| Commute Time | Male | Female |
| Less than 5 Minutes | 34 (4.6%) | 10 (1.9%) |
| 5 to 9 Minutes | 38 (5.1%) | 49 (9.5%) |
| 10 to 14 Minutes | 154 (20.8%) | 146 (28.3%) |
| 15 to 19 Minutes | 146 (19.7%) | 137 (26.6%) |
| 20 to 24 Minutes | 58 (7.8%) | 16 (3.1%) |
| 25 to 29 Minutes | 81 (11.0%) | 20 (3.9%) |
| 30 to 34 Minutes | 83 (11.2%) | 59 (11.5%) |
| 35 to 39 Minutes | 41 (5.5%) | 19 (3.7%) |
| 40 to 44 Minutes | 18 (2.4%) | 5 (1.0%) |
| 45 to 59 Minutes | 56 (7.6%) | 33 (6.4%) |
| 60 to 89 Minutes | 15 (2.0%) | 12 (2.3%) |
| 90 or more Minutes | 16 (2.2%) | 9 (1.8%) |
Time of Departure to Work by Sex in Tainter Lake
The most frequent times of departure to work in Tainter Lake are 6:30 AM to 6:59 AM (116, 15.7%) for males and 7:00 AM to 7:29 AM (93, 18.1%) for females.
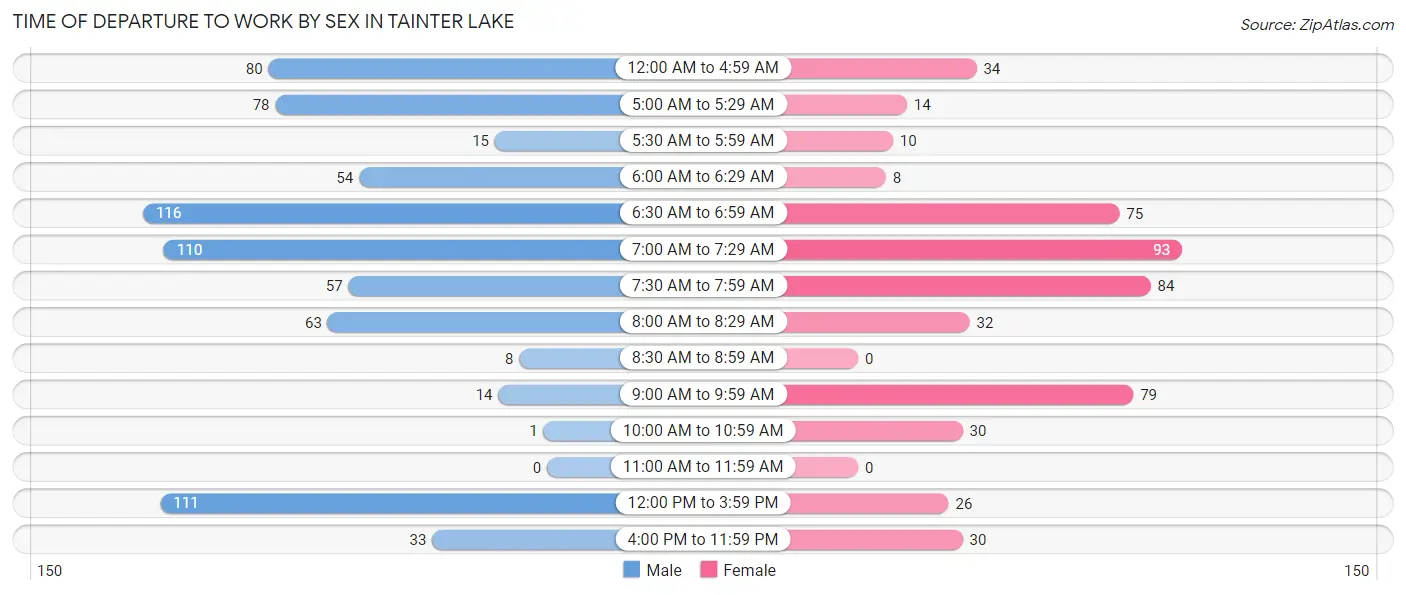
| Time of Departure | Male | Female |
| 12:00 AM to 4:59 AM | 80 (10.8%) | 34 (6.6%) |
| 5:00 AM to 5:29 AM | 78 (10.5%) | 14 (2.7%) |
| 5:30 AM to 5:59 AM | 15 (2.0%) | 10 (1.9%) |
| 6:00 AM to 6:29 AM | 54 (7.3%) | 8 (1.5%) |
| 6:30 AM to 6:59 AM | 116 (15.7%) | 75 (14.6%) |
| 7:00 AM to 7:29 AM | 110 (14.9%) | 93 (18.1%) |
| 7:30 AM to 7:59 AM | 57 (7.7%) | 84 (16.3%) |
| 8:00 AM to 8:29 AM | 63 (8.5%) | 32 (6.2%) |
| 8:30 AM to 8:59 AM | 8 (1.1%) | 0 (0.0%) |
| 9:00 AM to 9:59 AM | 14 (1.9%) | 79 (15.3%) |
| 10:00 AM to 10:59 AM | 1 (0.1%) | 30 (5.8%) |
| 11:00 AM to 11:59 AM | 0 (0.0%) | 0 (0.0%) |
| 12:00 PM to 3:59 PM | 111 (15.0%) | 26 (5.1%) |
| 4:00 PM to 11:59 PM | 33 (4.5%) | 30 (5.8%) |
| Total | 740 (100.0%) | 515 (100.0%) |
Housing Occupancy in Tainter Lake
Occupancy by Ownership in Tainter Lake
Of the total 1,023 dwellings in Tainter Lake, owner-occupied units account for 886 (86.6%), while renter-occupied units make up 137 (13.4%).
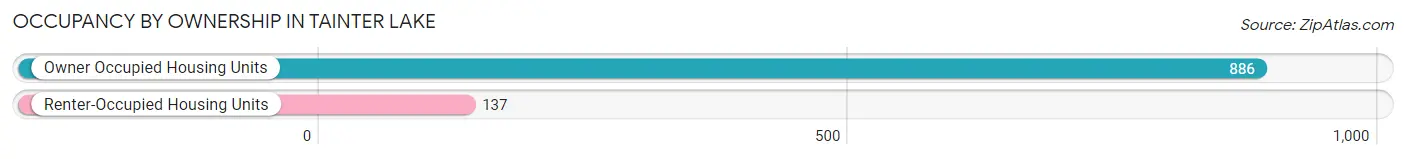
| Occupancy | # Housing Units | % Housing Units |
| Owner Occupied Housing Units | 886 | 86.6% |
| Renter-Occupied Housing Units | 137 | 13.4% |
| Total Occupied Housing Units | 1,023 | 100.0% |
Occupancy by Household Size in Tainter Lake
| Household Size | # Housing Units | % Housing Units |
| 1-Person Household | 266 | 26.0% |
| 2-Person Household | 443 | 43.3% |
| 3-Person Household | 122 | 11.9% |
| 4+ Person Household | 192 | 18.8% |
| Total Housing Units | 1,023 | 100.0% |
Occupancy by Ownership by Household Size in Tainter Lake
| Household Size | Owner-occupied | Renter-occupied |
| 1-Person Household | 203 (76.3%) | 63 (23.7%) |
| 2-Person Household | 391 (88.3%) | 52 (11.7%) |
| 3-Person Household | 108 (88.5%) | 14 (11.5%) |
| 4+ Person Household | 184 (95.8%) | 8 (4.2%) |
| Total Housing Units | 886 (86.6%) | 137 (13.4%) |
Occupancy by Educational Attainment in Tainter Lake
| Household Size | Owner-occupied | Renter-occupied |
| Less than High School | 6 (100.0%) | 0 (0.0%) |
| High School Diploma | 182 (82.7%) | 38 (17.3%) |
| College/Associate Degree | 271 (80.9%) | 64 (19.1%) |
| Bachelor's Degree or higher | 427 (92.4%) | 35 (7.6%) |
Occupancy by Age of Householder in Tainter Lake
| Age Bracket | # Households | % Households |
| Under 35 Years | 102 | 10.0% |
| 35 to 44 Years | 209 | 20.4% |
| 45 to 54 Years | 186 | 18.2% |
| 55 to 64 Years | 216 | 21.1% |
| 65 to 74 Years | 178 | 17.4% |
| 75 to 84 Years | 112 | 11.0% |
| 85 Years and Over | 20 | 2.0% |
| Total | 1,023 | 100.0% |
Housing Finances in Tainter Lake
Median Income by Occupancy in Tainter Lake
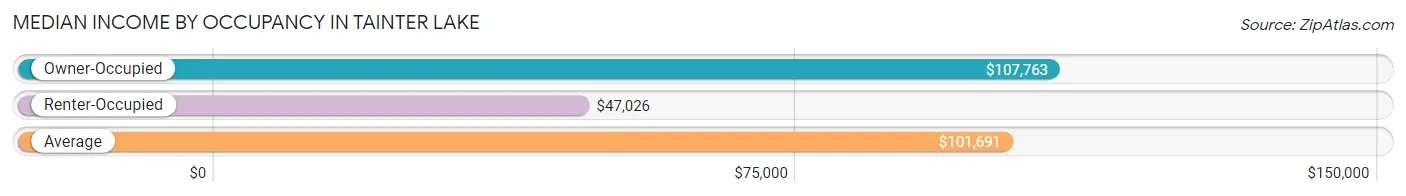
| Occupancy Type | # Households | Median Income |
| Owner-Occupied | 886 (86.6%) | $107,763 |
| Renter-Occupied | 137 (13.4%) | $47,026 |
| Average | 1,023 (100.0%) | $101,691 |
Occupancy by Householder Income Bracket in Tainter Lake
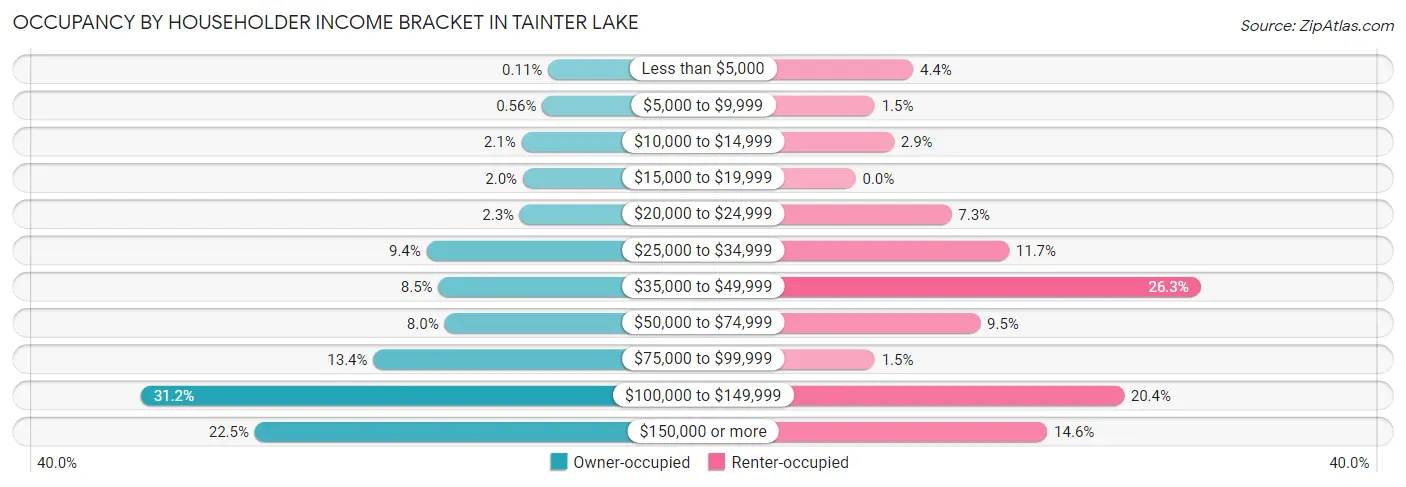
| Income Bracket | Owner-occupied | Renter-occupied |
| Less than $5,000 | 1 (0.1%) | 6 (4.4%) |
| $5,000 to $9,999 | 5 (0.6%) | 2 (1.5%) |
| $10,000 to $14,999 | 19 (2.1%) | 4 (2.9%) |
| $15,000 to $19,999 | 18 (2.0%) | 0 (0.0%) |
| $20,000 to $24,999 | 20 (2.3%) | 10 (7.3%) |
| $25,000 to $34,999 | 83 (9.4%) | 16 (11.7%) |
| $35,000 to $49,999 | 75 (8.5%) | 36 (26.3%) |
| $50,000 to $74,999 | 71 (8.0%) | 13 (9.5%) |
| $75,000 to $99,999 | 119 (13.4%) | 2 (1.5%) |
| $100,000 to $149,999 | 276 (31.1%) | 28 (20.4%) |
| $150,000 or more | 199 (22.5%) | 20 (14.6%) |
| Total | 886 (100.0%) | 137 (100.0%) |
Monthly Housing Cost Tiers in Tainter Lake
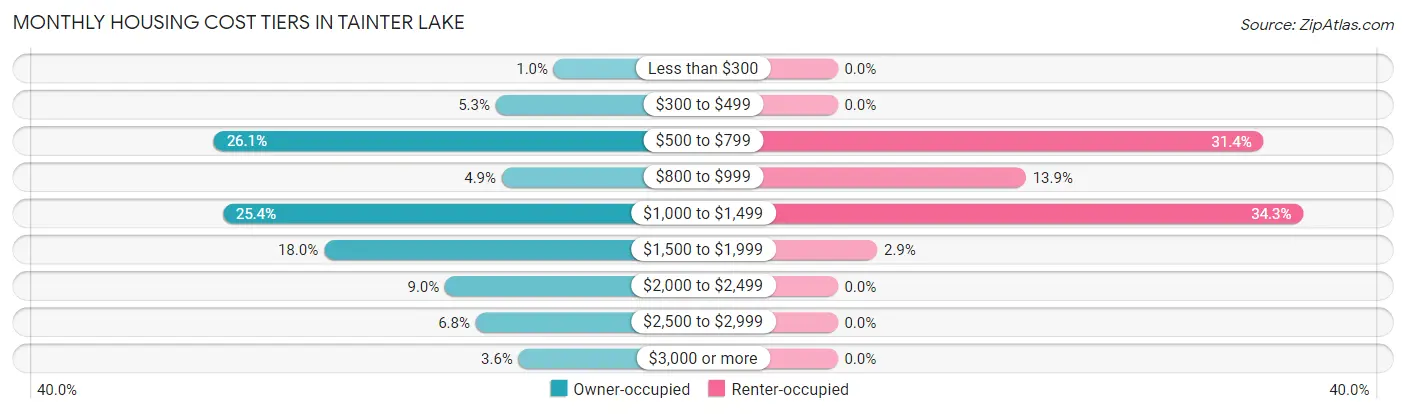
| Monthly Cost | Owner-occupied | Renter-occupied |
| Less than $300 | 9 (1.0%) | 0 (0.0%) |
| $300 to $499 | 47 (5.3%) | 0 (0.0%) |
| $500 to $799 | 231 (26.1%) | 43 (31.4%) |
| $800 to $999 | 43 (4.9%) | 19 (13.9%) |
| $1,000 to $1,499 | 225 (25.4%) | 47 (34.3%) |
| $1,500 to $1,999 | 159 (17.9%) | 4 (2.9%) |
| $2,000 to $2,499 | 80 (9.0%) | 0 (0.0%) |
| $2,500 to $2,999 | 60 (6.8%) | 0 (0.0%) |
| $3,000 or more | 32 (3.6%) | 0 (0.0%) |
| Total | 886 (100.0%) | 137 (100.0%) |
Physical Housing Characteristics in Tainter Lake
Housing Structures in Tainter Lake
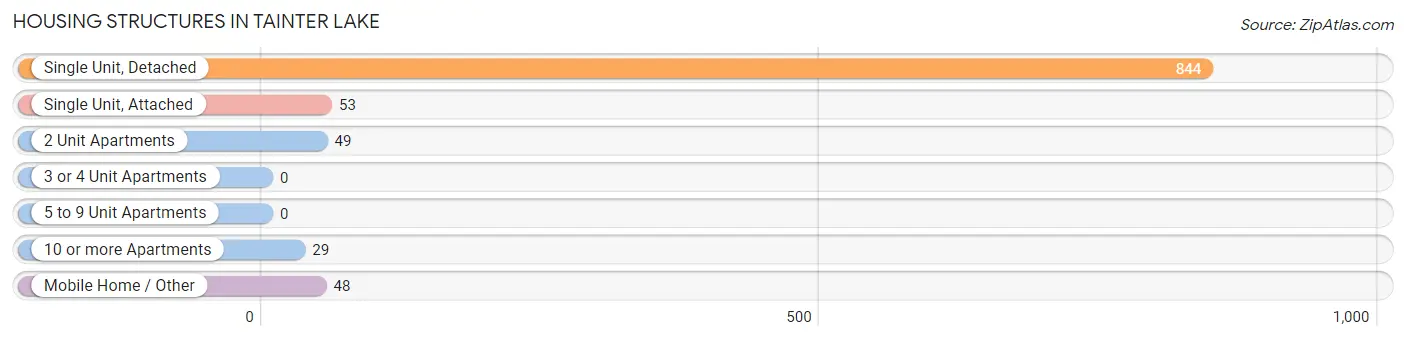
| Structure Type | # Housing Units | % Housing Units |
| Single Unit, Detached | 844 | 82.5% |
| Single Unit, Attached | 53 | 5.2% |
| 2 Unit Apartments | 49 | 4.8% |
| 3 or 4 Unit Apartments | 0 | 0.0% |
| 5 to 9 Unit Apartments | 0 | 0.0% |
| 10 or more Apartments | 29 | 2.8% |
| Mobile Home / Other | 48 | 4.7% |
| Total | 1,023 | 100.0% |
Housing Structures by Occupancy in Tainter Lake
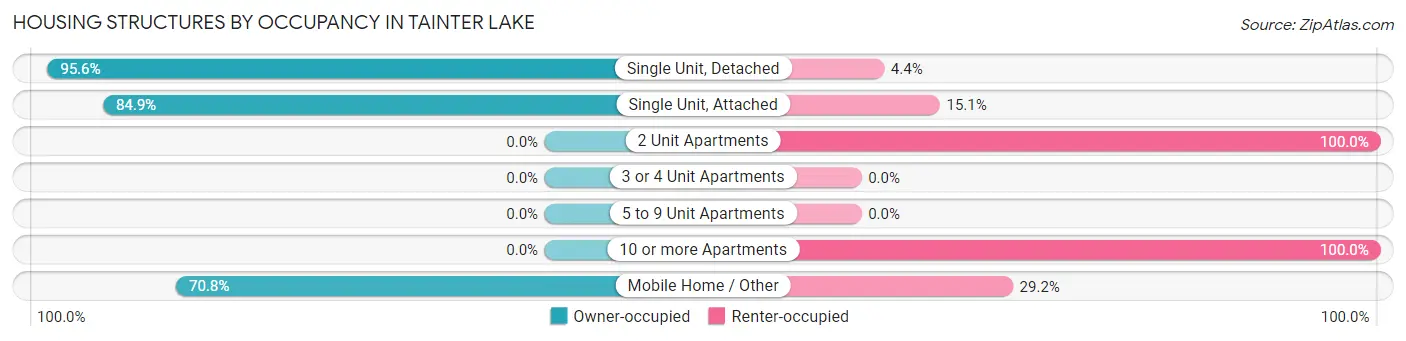
| Structure Type | Owner-occupied | Renter-occupied |
| Single Unit, Detached | 807 (95.6%) | 37 (4.4%) |
| Single Unit, Attached | 45 (84.9%) | 8 (15.1%) |
| 2 Unit Apartments | 0 (0.0%) | 49 (100.0%) |
| 3 or 4 Unit Apartments | 0 (0.0%) | 0 (0.0%) |
| 5 to 9 Unit Apartments | 0 (0.0%) | 0 (0.0%) |
| 10 or more Apartments | 0 (0.0%) | 29 (100.0%) |
| Mobile Home / Other | 34 (70.8%) | 14 (29.2%) |
| Total | 886 (86.6%) | 137 (13.4%) |
Housing Structures by Number of Rooms in Tainter Lake
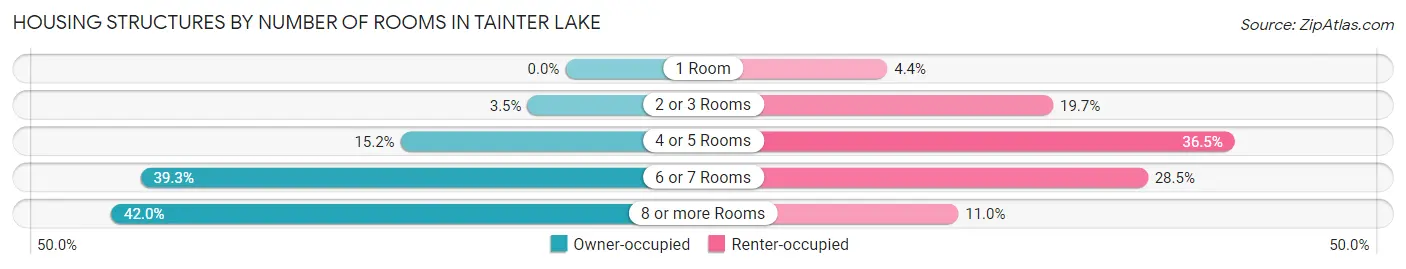
| Number of Rooms | Owner-occupied | Renter-occupied |
| 1 Room | 0 (0.0%) | 6 (4.4%) |
| 2 or 3 Rooms | 31 (3.5%) | 27 (19.7%) |
| 4 or 5 Rooms | 135 (15.2%) | 50 (36.5%) |
| 6 or 7 Rooms | 348 (39.3%) | 39 (28.5%) |
| 8 or more Rooms | 372 (42.0%) | 15 (11.0%) |
| Total | 886 (100.0%) | 137 (100.0%) |
Housing Structure by Heating Type in Tainter Lake
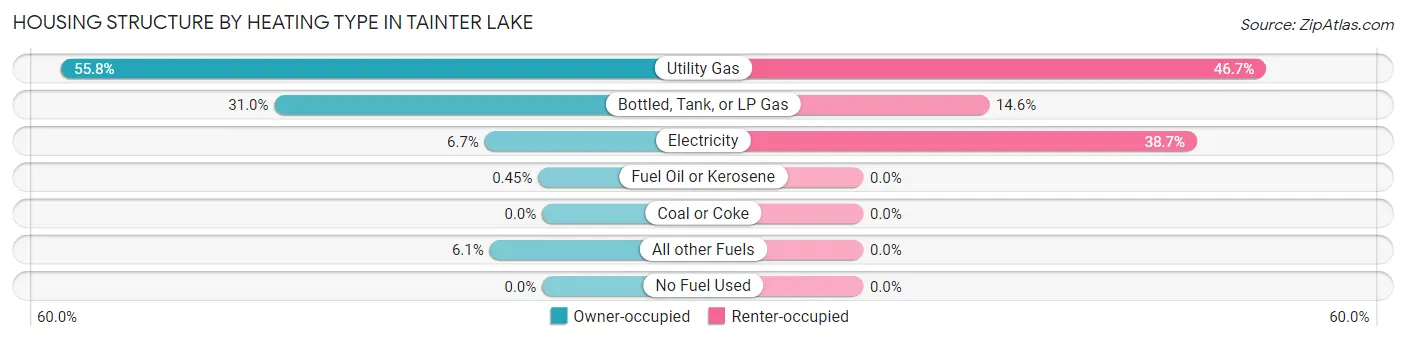
| Heating Type | Owner-occupied | Renter-occupied |
| Utility Gas | 494 (55.8%) | 64 (46.7%) |
| Bottled, Tank, or LP Gas | 275 (31.0%) | 20 (14.6%) |
| Electricity | 59 (6.7%) | 53 (38.7%) |
| Fuel Oil or Kerosene | 4 (0.4%) | 0 (0.0%) |
| Coal or Coke | 0 (0.0%) | 0 (0.0%) |
| All other Fuels | 54 (6.1%) | 0 (0.0%) |
| No Fuel Used | 0 (0.0%) | 0 (0.0%) |
| Total | 886 (100.0%) | 137 (100.0%) |
Household Vehicle Usage in Tainter Lake
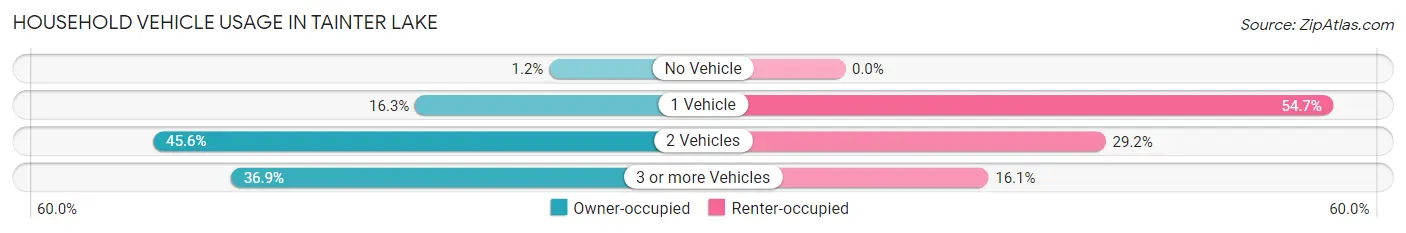
| Vehicles per Household | Owner-occupied | Renter-occupied |
| No Vehicle | 11 (1.2%) | 0 (0.0%) |
| 1 Vehicle | 144 (16.3%) | 75 (54.7%) |
| 2 Vehicles | 404 (45.6%) | 40 (29.2%) |
| 3 or more Vehicles | 327 (36.9%) | 22 (16.1%) |
| Total | 886 (100.0%) | 137 (100.0%) |
Real Estate & Mortgages in Tainter Lake
Real Estate and Mortgage Overview in Tainter Lake
| Characteristic | Without Mortgage | With Mortgage |
| Housing Units | 298 | 588 |
| Median Property Value | $263,000 | $245,200 |
| Median Household Income | $86,000 | $127 |
| Monthly Housing Costs | $702 | $32 |
| Real Estate Taxes | $4,315 | $0 |
Property Value by Mortgage Status in Tainter Lake
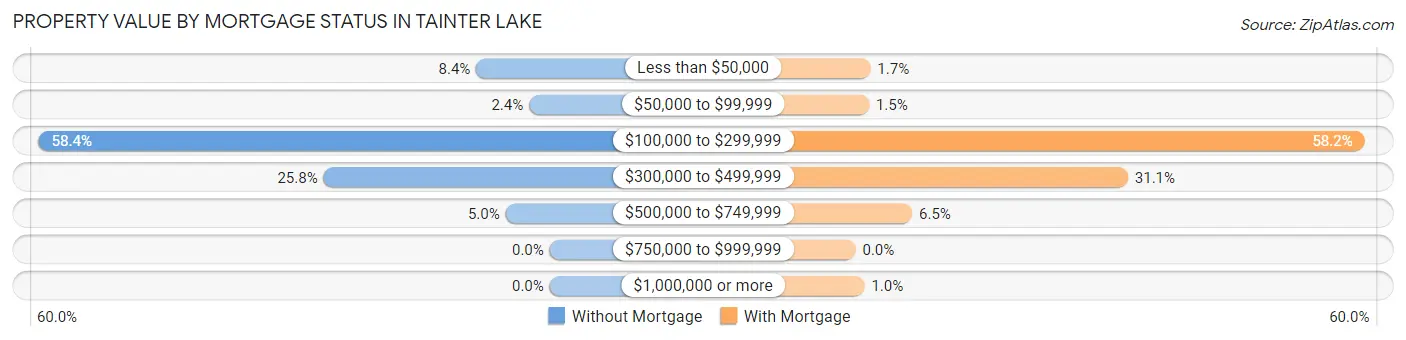
| Property Value | Without Mortgage | With Mortgage |
| Less than $50,000 | 25 (8.4%) | 10 (1.7%) |
| $50,000 to $99,999 | 7 (2.4%) | 9 (1.5%) |
| $100,000 to $299,999 | 174 (58.4%) | 342 (58.2%) |
| $300,000 to $499,999 | 77 (25.8%) | 183 (31.1%) |
| $500,000 to $749,999 | 15 (5.0%) | 38 (6.5%) |
| $750,000 to $999,999 | 0 (0.0%) | 0 (0.0%) |
| $1,000,000 or more | 0 (0.0%) | 6 (1.0%) |
| Total | 298 (100.0%) | 588 (100.0%) |
Household Income by Mortgage Status in Tainter Lake
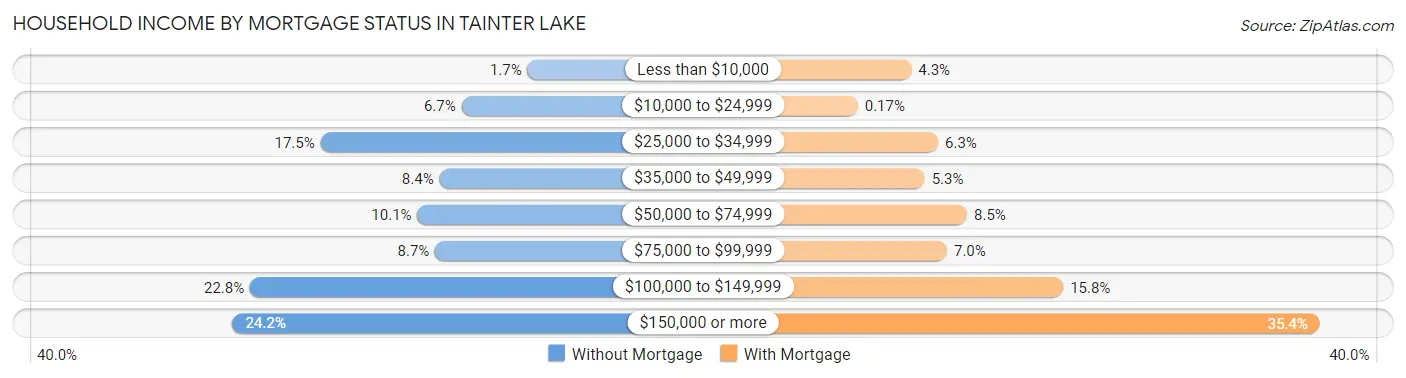
| Household Income | Without Mortgage | With Mortgage |
| Less than $10,000 | 5 (1.7%) | 25 (4.3%) |
| $10,000 to $24,999 | 20 (6.7%) | 1 (0.2%) |
| $25,000 to $34,999 | 52 (17.4%) | 37 (6.3%) |
| $35,000 to $49,999 | 25 (8.4%) | 31 (5.3%) |
| $50,000 to $74,999 | 30 (10.1%) | 50 (8.5%) |
| $75,000 to $99,999 | 26 (8.7%) | 41 (7.0%) |
| $100,000 to $149,999 | 68 (22.8%) | 93 (15.8%) |
| $150,000 or more | 72 (24.2%) | 208 (35.4%) |
| Total | 298 (100.0%) | 588 (100.0%) |
Property Value to Household Income Ratio in Tainter Lake
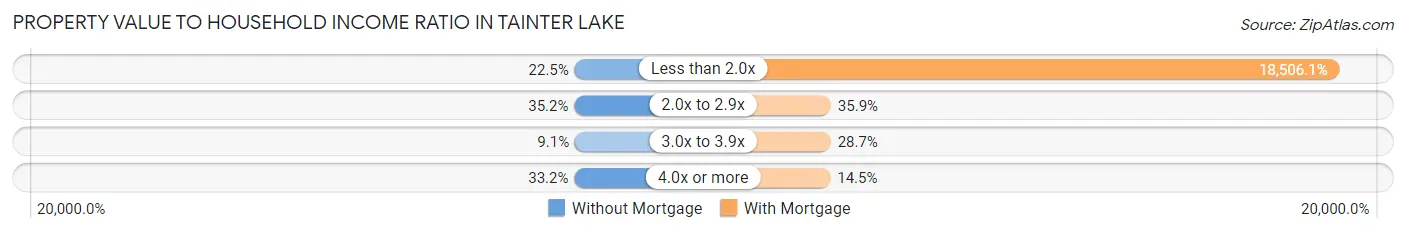
| Value-to-Income Ratio | Without Mortgage | With Mortgage |
| Less than 2.0x | 67 (22.5%) | 108,816 (18,506.1%) |
| 2.0x to 2.9x | 105 (35.2%) | 211 (35.9%) |
| 3.0x to 3.9x | 27 (9.1%) | 169 (28.7%) |
| 4.0x or more | 99 (33.2%) | 85 (14.5%) |
| Total | 298 (100.0%) | 588 (100.0%) |
Real Estate Taxes by Mortgage Status in Tainter Lake
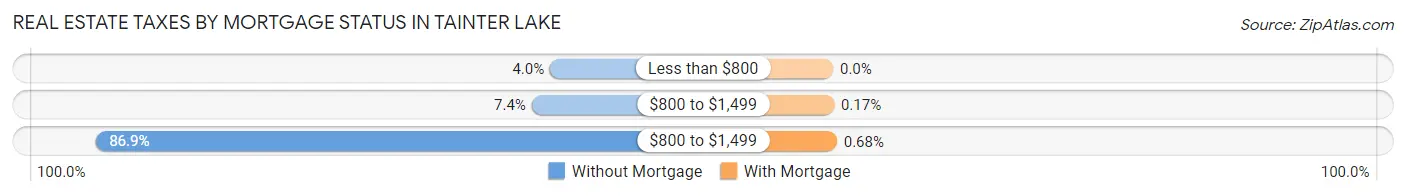
| Property Taxes | Without Mortgage | With Mortgage |
| Less than $800 | 12 (4.0%) | 0 (0.0%) |
| $800 to $1,499 | 22 (7.4%) | 1 (0.2%) |
| $800 to $1,499 | 259 (86.9%) | 4 (0.7%) |
| Total | 298 (100.0%) | 588 (100.0%) |
Health & Disability in Tainter Lake
Health Insurance Coverage by Age in Tainter Lake
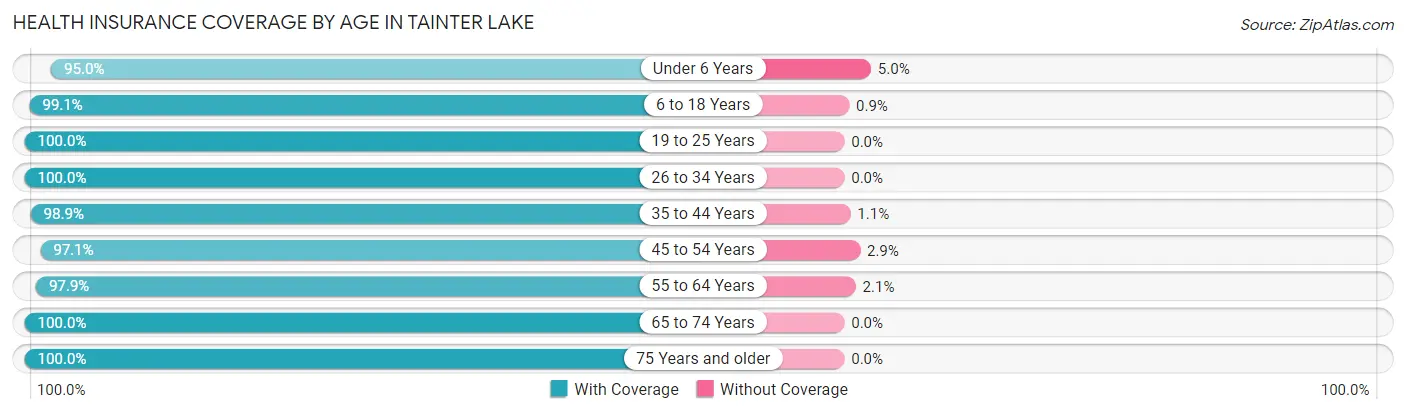
| Age Bracket | With Coverage | Without Coverage |
| Under 6 Years | 230 (95.0%) | 12 (5.0%) |
| 6 to 18 Years | 552 (99.1%) | 5 (0.9%) |
| 19 to 25 Years | 110 (100.0%) | 0 (0.0%) |
| 26 to 34 Years | 211 (100.0%) | 0 (0.0%) |
| 35 to 44 Years | 432 (98.9%) | 5 (1.1%) |
| 45 to 54 Years | 331 (97.1%) | 10 (2.9%) |
| 55 to 64 Years | 370 (97.9%) | 8 (2.1%) |
| 65 to 74 Years | 327 (100.0%) | 0 (0.0%) |
| 75 Years and older | 186 (100.0%) | 0 (0.0%) |
| Total | 2,749 (98.6%) | 40 (1.4%) |
Health Insurance Coverage by Citizenship Status in Tainter Lake
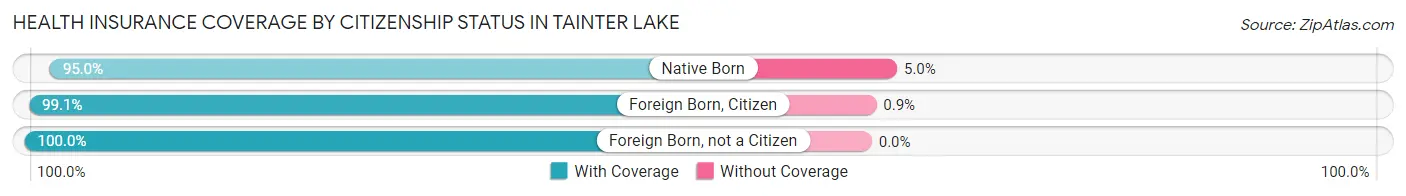
| Citizenship Status | With Coverage | Without Coverage |
| Native Born | 230 (95.0%) | 12 (5.0%) |
| Foreign Born, Citizen | 552 (99.1%) | 5 (0.9%) |
| Foreign Born, not a Citizen | 110 (100.0%) | 0 (0.0%) |
Health Insurance Coverage by Household Income in Tainter Lake
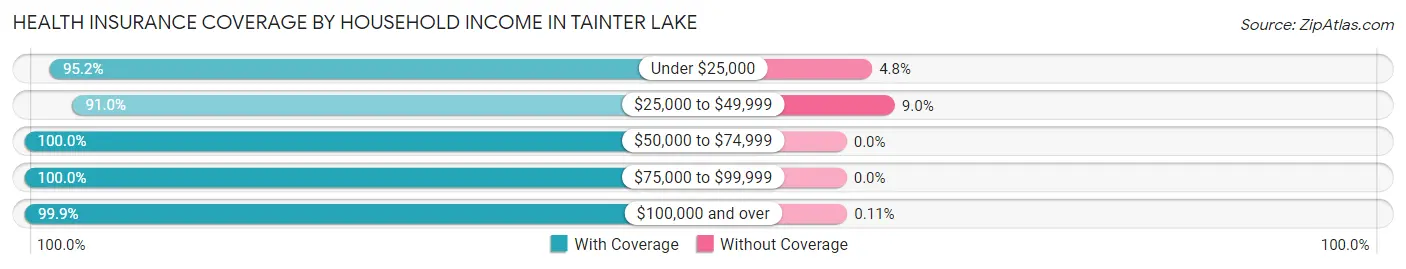
| Household Income | With Coverage | Without Coverage |
| Under $25,000 | 120 (95.2%) | 6 (4.8%) |
| $25,000 to $49,999 | 323 (91.0%) | 32 (9.0%) |
| $50,000 to $74,999 | 196 (100.0%) | 0 (0.0%) |
| $75,000 to $99,999 | 281 (100.0%) | 0 (0.0%) |
| $100,000 and over | 1,826 (99.9%) | 2 (0.1%) |
Public vs Private Health Insurance Coverage by Age in Tainter Lake
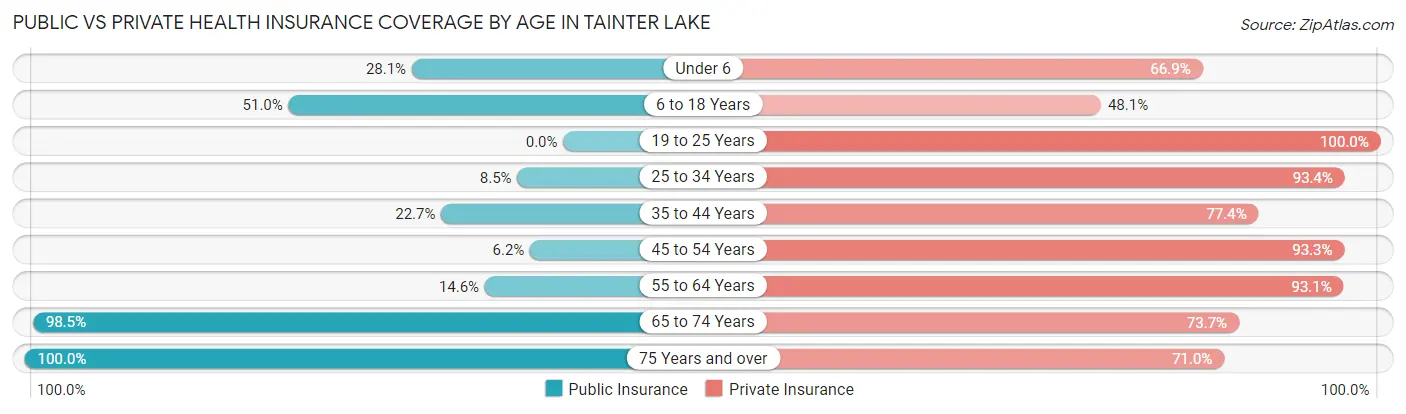
| Age Bracket | Public Insurance | Private Insurance |
| Under 6 | 68 (28.1%) | 162 (66.9%) |
| 6 to 18 Years | 284 (51.0%) | 268 (48.1%) |
| 19 to 25 Years | 0 (0.0%) | 110 (100.0%) |
| 25 to 34 Years | 18 (8.5%) | 197 (93.4%) |
| 35 to 44 Years | 99 (22.7%) | 338 (77.3%) |
| 45 to 54 Years | 21 (6.2%) | 318 (93.3%) |
| 55 to 64 Years | 55 (14.5%) | 352 (93.1%) |
| 65 to 74 Years | 322 (98.5%) | 241 (73.7%) |
| 75 Years and over | 186 (100.0%) | 132 (71.0%) |
| Total | 1,053 (37.8%) | 2,118 (75.9%) |
Disability Status by Sex by Age in Tainter Lake
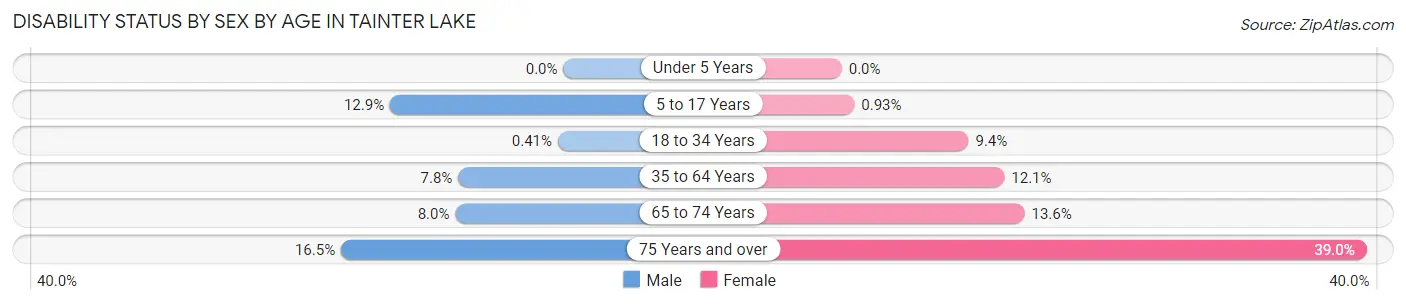
| Age Bracket | Male | Female |
| Under 5 Years | 0 (0.0%) | 0 (0.0%) |
| 5 to 17 Years | 48 (12.9%) | 2 (0.9%) |
| 18 to 34 Years | 1 (0.4%) | 8 (9.4%) |
| 35 to 64 Years | 45 (7.8%) | 70 (12.1%) |
| 65 to 74 Years | 15 (8.0%) | 19 (13.6%) |
| 75 Years and over | 18 (16.5%) | 30 (39.0%) |
Disability Class by Sex by Age in Tainter Lake
Disability Class: Hearing Difficulty
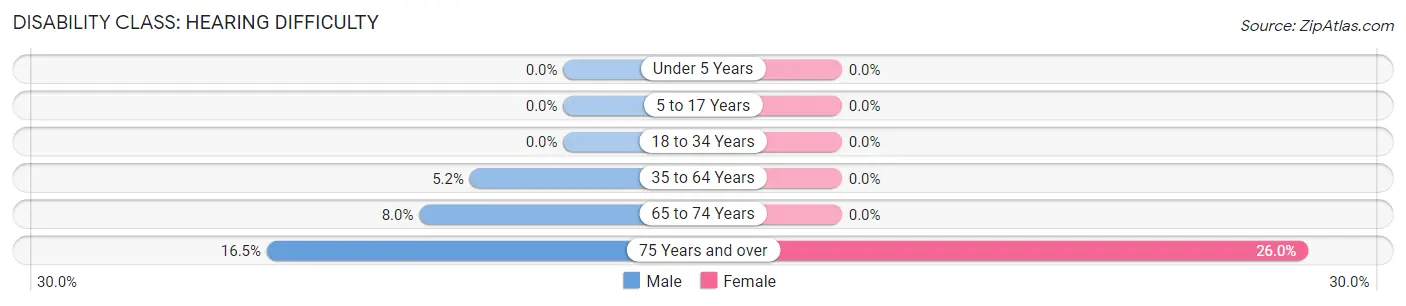
| Age Bracket | Male | Female |
| Under 5 Years | 0 (0.0%) | 0 (0.0%) |
| 5 to 17 Years | 0 (0.0%) | 0 (0.0%) |
| 18 to 34 Years | 0 (0.0%) | 0 (0.0%) |
| 35 to 64 Years | 30 (5.2%) | 0 (0.0%) |
| 65 to 74 Years | 15 (8.0%) | 0 (0.0%) |
| 75 Years and over | 18 (16.5%) | 20 (26.0%) |
Disability Class: Vision Difficulty
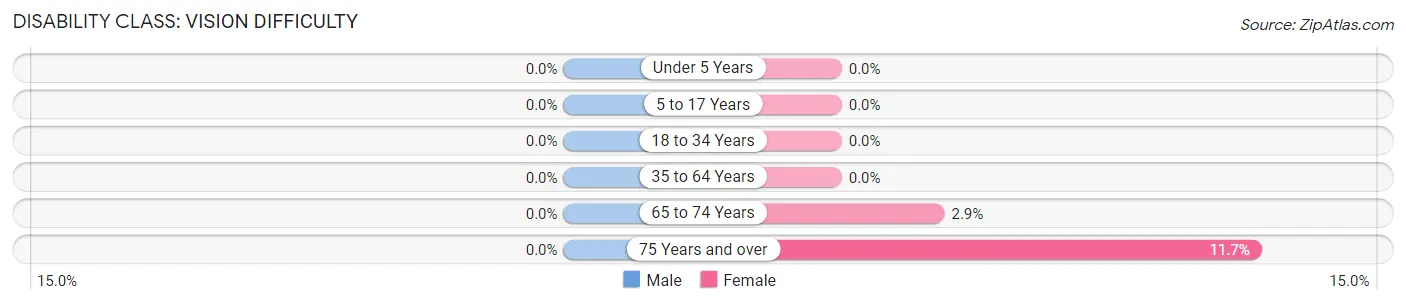
| Age Bracket | Male | Female |
| Under 5 Years | 0 (0.0%) | 0 (0.0%) |
| 5 to 17 Years | 0 (0.0%) | 0 (0.0%) |
| 18 to 34 Years | 0 (0.0%) | 0 (0.0%) |
| 35 to 64 Years | 0 (0.0%) | 0 (0.0%) |
| 65 to 74 Years | 0 (0.0%) | 4 (2.9%) |
| 75 Years and over | 0 (0.0%) | 9 (11.7%) |
Disability Class: Cognitive Difficulty
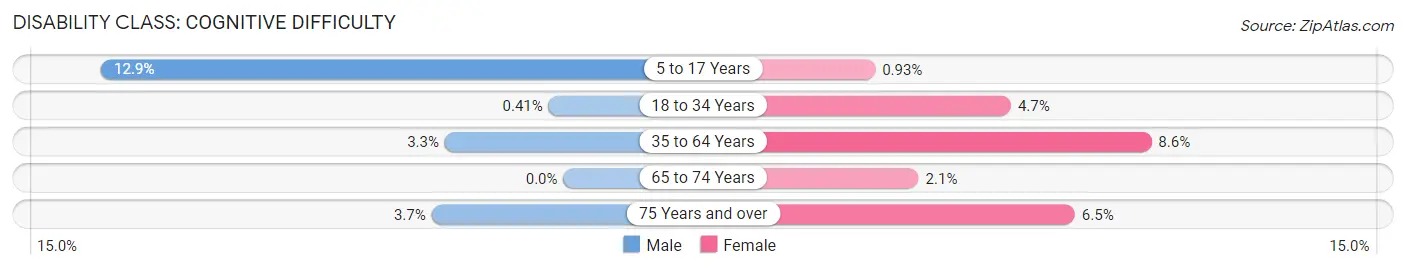
| Age Bracket | Male | Female |
| 5 to 17 Years | 48 (12.9%) | 2 (0.9%) |
| 18 to 34 Years | 1 (0.4%) | 4 (4.7%) |
| 35 to 64 Years | 19 (3.3%) | 50 (8.6%) |
| 65 to 74 Years | 0 (0.0%) | 3 (2.1%) |
| 75 Years and over | 4 (3.7%) | 5 (6.5%) |
Disability Class: Ambulatory Difficulty
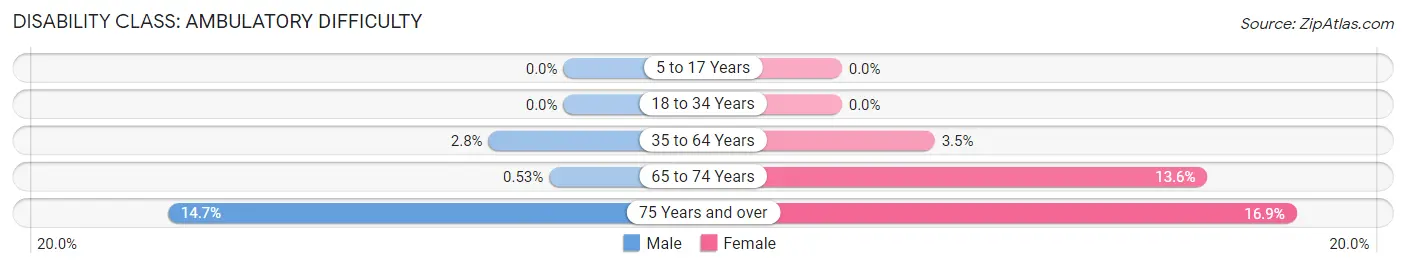
| Age Bracket | Male | Female |
| 5 to 17 Years | 0 (0.0%) | 0 (0.0%) |
| 18 to 34 Years | 0 (0.0%) | 0 (0.0%) |
| 35 to 64 Years | 16 (2.8%) | 20 (3.5%) |
| 65 to 74 Years | 1 (0.5%) | 19 (13.6%) |
| 75 Years and over | 16 (14.7%) | 13 (16.9%) |
Disability Class: Self-Care Difficulty
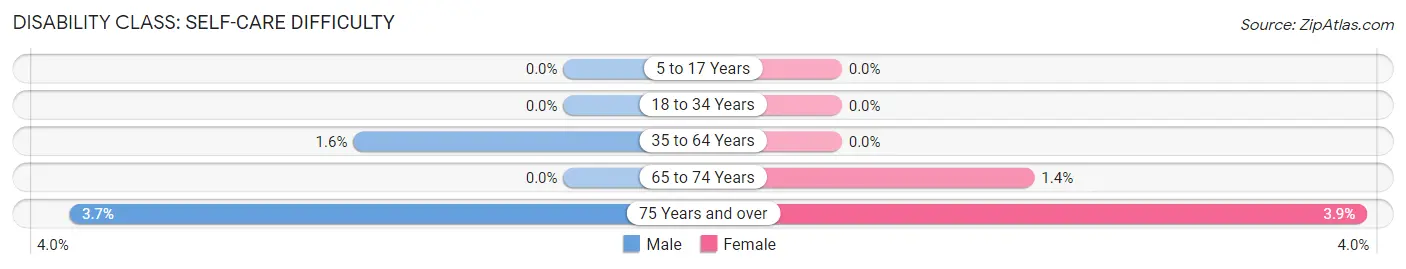
| Age Bracket | Male | Female |
| 5 to 17 Years | 0 (0.0%) | 0 (0.0%) |
| 18 to 34 Years | 0 (0.0%) | 0 (0.0%) |
| 35 to 64 Years | 9 (1.6%) | 0 (0.0%) |
| 65 to 74 Years | 0 (0.0%) | 2 (1.4%) |
| 75 Years and over | 4 (3.7%) | 3 (3.9%) |
Technology Access in Tainter Lake
Computing Device Access in Tainter Lake
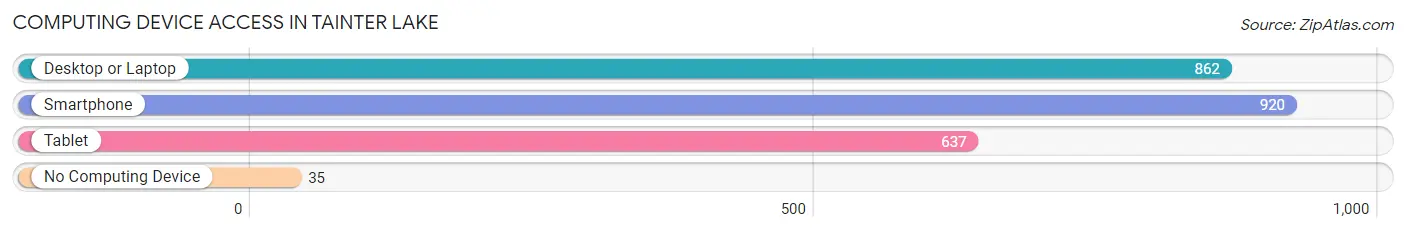
| Device Type | # Households | % Households |
| Desktop or Laptop | 862 | 84.3% |
| Smartphone | 920 | 89.9% |
| Tablet | 637 | 62.3% |
| No Computing Device | 35 | 3.4% |
| Total | 1,023 | 100.0% |
Internet Access in Tainter Lake
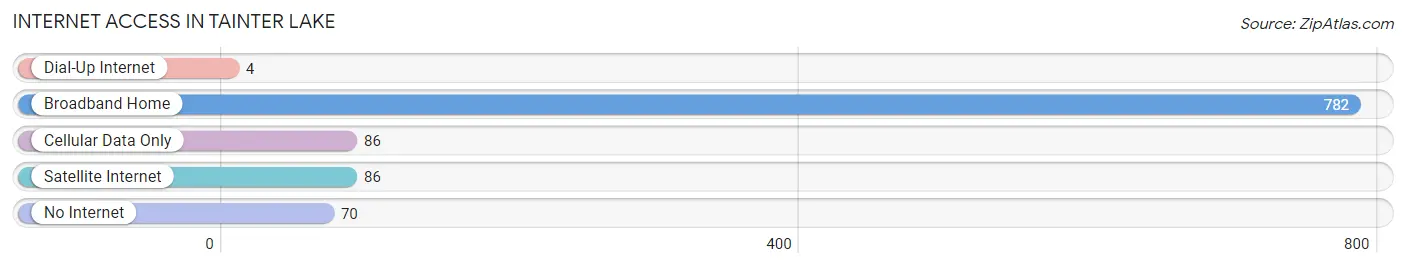
| Internet Type | # Households | % Households |
| Dial-Up Internet | 4 | 0.4% |
| Broadband Home | 782 | 76.4% |
| Cellular Data Only | 86 | 8.4% |
| Satellite Internet | 86 | 8.4% |
| No Internet | 70 | 6.8% |
| Total | 1,023 | 100.0% |
Tainter Lake Summary
Tainter Lake is a small lake located in Dunn County, Wisconsin. It is part of the Red Cedar River watershed and is located about 10 miles northwest of Menomonie. The lake is approximately 1,000 acres in size and has a maximum depth of about 30 feet.
History
Tainter Lake was originally named after the Tainter family, who were among the first settlers in the area. The Tainters were originally from New York and moved to Wisconsin in the early 1800s. They settled near the lake and built a log cabin on the shore. The lake was also known as Tainter's Lake for many years.
The lake was used for recreational purposes in the late 1800s and early 1900s. People would come to the lake to fish, swim, and boat. In the 1920s, the lake was developed for recreational use and a number of resorts were built around the lake. The resorts provided cabins, boats, and other amenities for visitors.
In the 1950s, the lake was used for commercial fishing. The lake was stocked with walleye, northern pike, and other species of fish. The lake was also used for recreational fishing and boating.
In the 1970s, the lake was developed for residential use. A number of homes were built around the lake and the area became a popular vacation destination.
Geography
Tainter Lake is located in Dunn County, Wisconsin. It is part of the Red Cedar River watershed and is located about 10 miles northwest of Menomonie. The lake is approximately 1,000 acres in size and has a maximum depth of about 30 feet. The lake is surrounded by a number of small islands and is fed by several small streams.
The lake is located in a rural area and is surrounded by forests and farmland. The lake is a popular destination for fishing, boating, and swimming.
Economy
The economy of Tainter Lake is largely based on tourism and recreation. The lake is a popular destination for fishing, boating, and swimming. There are several resorts and campgrounds located around the lake. The lake is also a popular destination for bird watching and wildlife viewing.
The lake is also home to a number of businesses that provide services to visitors. These businesses include boat rental companies, bait shops, and restaurants.
Demographics
The population of Tainter Lake is largely made up of seasonal visitors and vacationers. The lake is a popular destination for fishing, boating, and swimming. The lake is also a popular destination for bird watching and wildlife viewing.
The population of the area is largely white and the median age is around 40 years old. The median household income is around $50,000 and the median home value is around $200,000. The area is largely rural and the majority of the population is employed in the tourism and recreation industry.
Common Questions
What is Per Capita Income in Tainter Lake?
Per Capita income in Tainter Lake is $46,139.
What is the Median Family Income in Tainter Lake?
Median Family Income in Tainter Lake is $113,000.
What is the Median Household income in Tainter Lake?
Median Household Income in Tainter Lake is $101,691.
What is Income or Wage Gap in Tainter Lake?
Income or Wage Gap in Tainter Lake is 31.6%.
Women in Tainter Lake earn 68.4 cents for every dollar earned by a man.
What is Family Income Deficit in Tainter Lake?
Family Income Deficit in Tainter Lake is $7,225.
Families that are below poverty line in Tainter Lake earn $7,225 less on average than the poverty threshold level.
What is Inequality or Gini Index in Tainter Lake?
Inequality or Gini Index in Tainter Lake is 0.43.
What is the Total Population of Tainter Lake?
Total Population of Tainter Lake is 2,789.
What is the Total Male Population of Tainter Lake?
Total Male Population of Tainter Lake is 1,604.
What is the Total Female Population of Tainter Lake?
Total Female Population of Tainter Lake is 1,185.
What is the Ratio of Males per 100 Females in Tainter Lake?
There are 135.36 Males per 100 Females in Tainter Lake.
What is the Ratio of Females per 100 Males in Tainter Lake?
There are 73.88 Females per 100 Males in Tainter Lake.
What is the Median Population Age in Tainter Lake?
Median Population Age in Tainter Lake is 38.9 Years.
What is the Average Family Size in Tainter Lake
Average Family Size in Tainter Lake is 3.4 People.
What is the Average Household Size in Tainter Lake
Average Household Size in Tainter Lake is 2.7 People.
How Large is the Labor Force in Tainter Lake?
There are 1,442 People in the Labor Forcein in Tainter Lake.
What is the Percentage of People in the Labor Force in Tainter Lake?
69.8% of People are in the Labor Force in Tainter Lake.
What is the Unemployment Rate in Tainter Lake?
Unemployment Rate in Tainter Lake is 4.6%.