Wind Point, WI Map & Demographics
Wind Point Map
Wind Point Overview
$87,232
PER CAPITA INCOME
$162,222
AVG FAMILY INCOME
$143,000
AVG HOUSEHOLD INCOME
49.9%
WAGE / INCOME GAP [ % ]
50.1¢/ $1
WAGE / INCOME GAP [ $ ]
0.44
INEQUALITY / GINI INDEX
1,688
TOTAL POPULATION
888
MALE POPULATION
800
FEMALE POPULATION
111.00
MALES / 100 FEMALES
90.09
FEMALES / 100 MALES
55.3
MEDIAN AGE
2.3
AVG FAMILY SIZE
2.1
AVG HOUSEHOLD SIZE
842
LABOR FORCE [ PEOPLE ]
56.8%
PERCENT IN LABOR FORCE
1.8%
UNEMPLOYMENT RATE
Wind Point Area Codes
Income in Wind Point
Income Overview in Wind Point
Per Capita Income in Wind Point is $87,232, while median incomes of families and households are $162,222 and $143,000 respectively.
| Characteristic | Number | Measure |
| Per Capita Income | 1,688 | $87,232 |
| Median Family Income | 640 | $162,222 |
| Mean Family Income | 640 | $209,677 |
| Median Household Income | 796 | $143,000 |
| Mean Household Income | 796 | $186,383 |
| Income Deficit | 640 | $0 |
| Wage / Income Gap (%) | 1,688 | 49.93% |
| Wage / Income Gap ($) | 1,688 | 50.07¢ per $1 |
| Gini / Inequality Index | 1,688 | 0.44 |
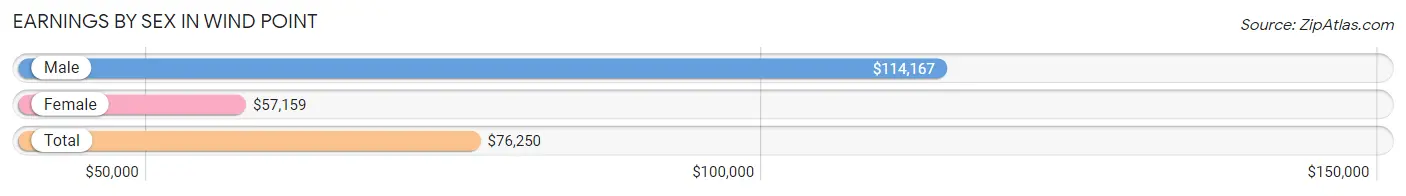
Earnings by Sex in Wind Point
Average Earnings in Wind Point are $76,250, $114,167 for men and $57,159 for women, a difference of 49.9%.
| Sex | Number | Average Earnings |
| Male | 500 (56.3%) | $114,167 |
| Female | 388 (43.7%) | $57,159 |
| Total | 888 (100.0%) | $76,250 |
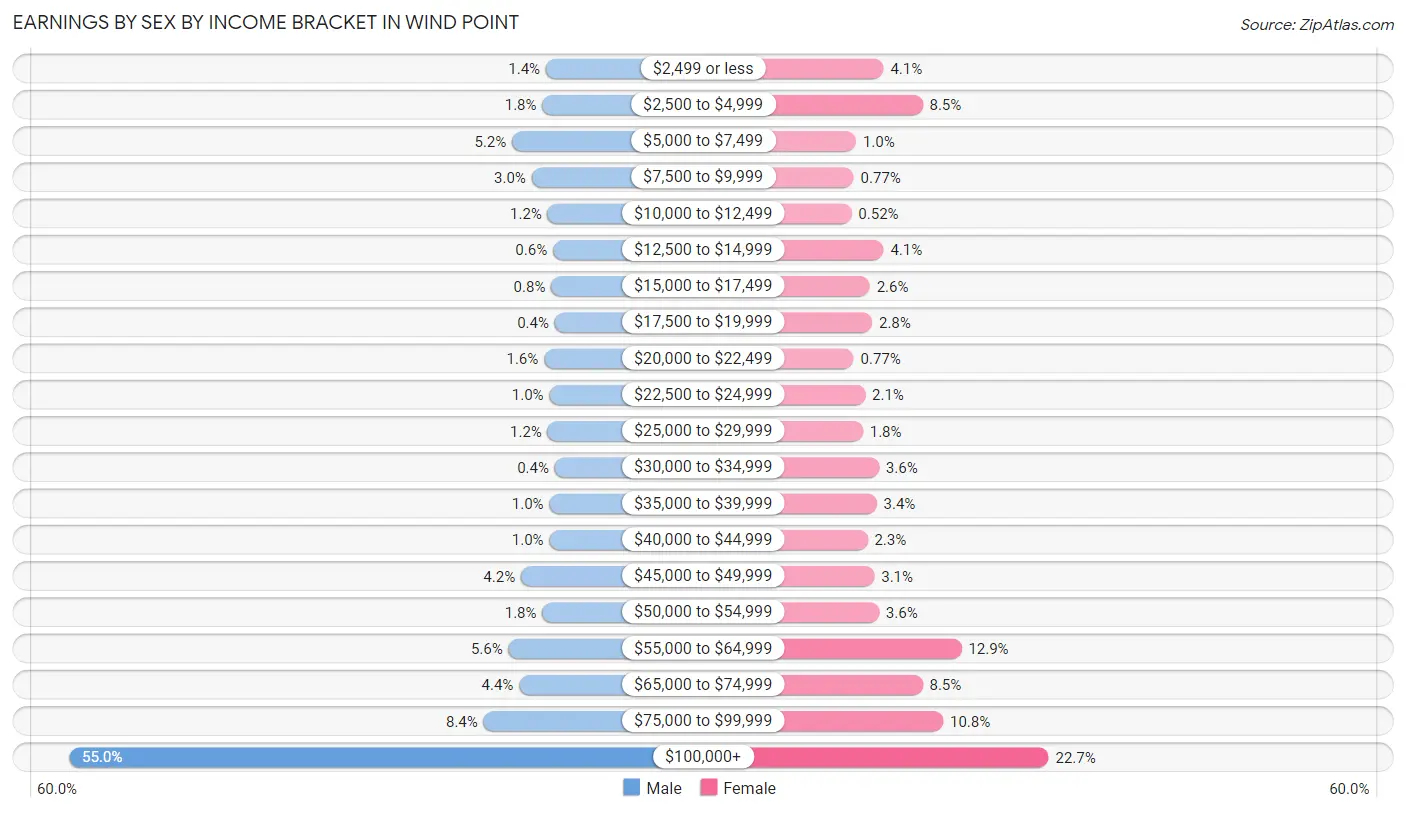
Earnings by Sex by Income Bracket in Wind Point
The most common earnings brackets in Wind Point are $100,000+ for men (275 | 55.0%) and $100,000+ for women (88 | 22.7%).
| Income | Male | Female |
| $2,499 or less | 7 (1.4%) | 16 (4.1%) |
| $2,500 to $4,999 | 9 (1.8%) | 33 (8.5%) |
| $5,000 to $7,499 | 26 (5.2%) | 4 (1.0%) |
| $7,500 to $9,999 | 15 (3.0%) | 3 (0.8%) |
| $10,000 to $12,499 | 6 (1.2%) | 2 (0.5%) |
| $12,500 to $14,999 | 3 (0.6%) | 16 (4.1%) |
| $15,000 to $17,499 | 4 (0.8%) | 10 (2.6%) |
| $17,500 to $19,999 | 2 (0.4%) | 11 (2.8%) |
| $20,000 to $22,499 | 8 (1.6%) | 3 (0.8%) |
| $22,500 to $24,999 | 5 (1.0%) | 8 (2.1%) |
| $25,000 to $29,999 | 6 (1.2%) | 7 (1.8%) |
| $30,000 to $34,999 | 2 (0.4%) | 14 (3.6%) |
| $35,000 to $39,999 | 5 (1.0%) | 13 (3.4%) |
| $40,000 to $44,999 | 5 (1.0%) | 9 (2.3%) |
| $45,000 to $49,999 | 21 (4.2%) | 12 (3.1%) |
| $50,000 to $54,999 | 9 (1.8%) | 14 (3.6%) |
| $55,000 to $64,999 | 28 (5.6%) | 50 (12.9%) |
| $65,000 to $74,999 | 22 (4.4%) | 33 (8.5%) |
| $75,000 to $99,999 | 42 (8.4%) | 42 (10.8%) |
| $100,000+ | 275 (55.0%) | 88 (22.7%) |
| Total | 500 (100.0%) | 388 (100.0%) |
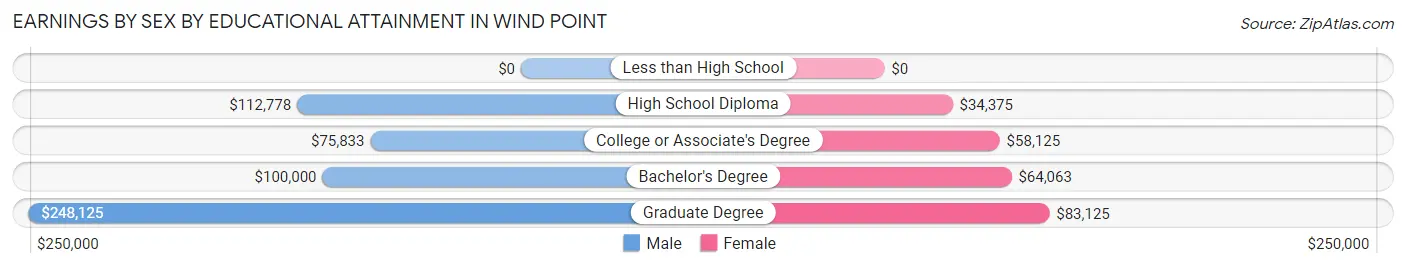
Earnings by Sex by Educational Attainment in Wind Point
Average earnings in Wind Point are $123,015 for men and $61,000 for women, a difference of 50.4%. Men with an educational attainment of graduate degree enjoy the highest average annual earnings of $248,125, while those with college or associate's degree education earn the least with $75,833. Women with an educational attainment of graduate degree earn the most with the average annual earnings of $83,125, while those with high school diploma education have the smallest earnings of $34,375.
| Educational Attainment | Male Income | Female Income |
| Less than High School | - | - |
| High School Diploma | $112,778 | $34,375 |
| College or Associate's Degree | $75,833 | $58,125 |
| Bachelor's Degree | $100,000 | $64,063 |
| Graduate Degree | $248,125 | $83,125 |
| Total | $123,015 | $61,000 |
Family Income in Wind Point
Family Income Brackets in Wind Point
According to the Wind Point family income data, there are 216 families falling into the $200,000+ income range, which is the most common income bracket and makes up 33.8% of all families.

| Income Bracket | # Families | % Families |
| Less than $10,000 | 3 | 0.5% |
| $10,000 to $14,999 | 0 | 0.0% |
| $15,000 to $24,999 | 9 | 1.4% |
| $25,000 to $34,999 | 10 | 1.6% |
| $35,000 to $49,999 | 23 | 3.6% |
| $50,000 to $74,999 | 116 | 18.1% |
| $75,000 to $99,999 | 36 | 5.6% |
| $100,000 to $149,999 | 104 | 16.3% |
| $150,000 to $199,999 | 123 | 19.2% |
| $200,000+ | 216 | 33.8% |
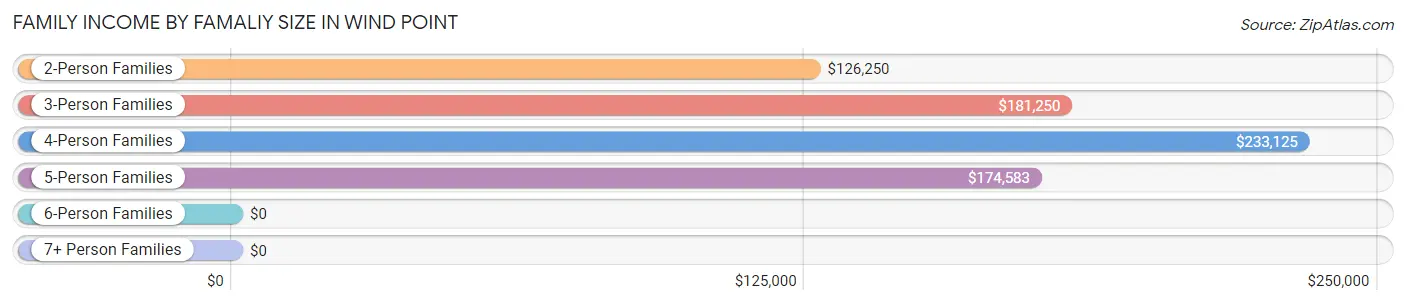
Family Income by Famaliy Size in Wind Point
4-person families (59 | 9.2%) account for the highest median family income in Wind Point with $233,125 per family, while 2-person families (462 | 72.2%) have the highest median income of $63,125 per family member.
| Income Bracket | # Families | Median Income |
| 2-Person Families | 462 (72.2%) | $126,250 |
| 3-Person Families | 89 (13.9%) | $181,250 |
| 4-Person Families | 59 (9.2%) | $233,125 |
| 5-Person Families | 17 (2.7%) | $174,583 |
| 6-Person Families | 13 (2.0%) | $0 |
| 7+ Person Families | 0 (0.0%) | $0 |
| Total | 640 (100.0%) | $162,222 |
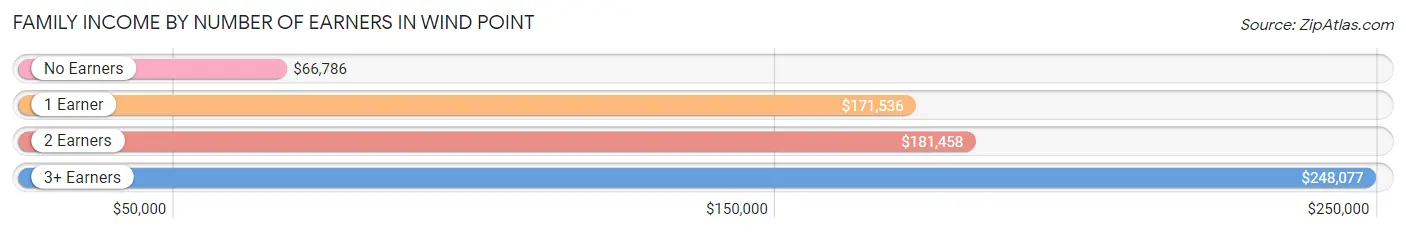
Family Income by Number of Earners in Wind Point
The median family income in Wind Point is $162,222, with families comprising 3+ earners (50) having the highest median family income of $248,077, while families with no earners (180) have the lowest median family income of $66,786, accounting for 7.8% and 28.1% of families, respectively.
| Number of Earners | # Families | Median Income |
| No Earners | 180 (28.1%) | $66,786 |
| 1 Earner | 221 (34.5%) | $171,536 |
| 2 Earners | 189 (29.5%) | $181,458 |
| 3+ Earners | 50 (7.8%) | $248,077 |
| Total | 640 (100.0%) | $162,222 |
Household Income in Wind Point
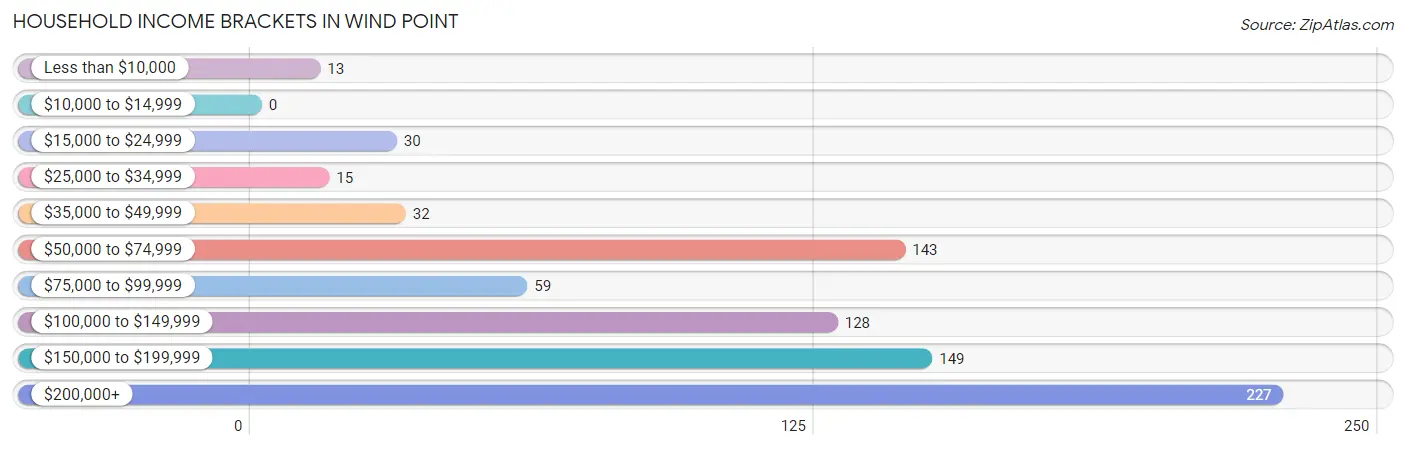
Household Income Brackets in Wind Point
With 227 households falling in the category, the $200,000+ income range is the most frequent in Wind Point, accounting for 28.5% of all households.
| Income Bracket | # Households | % Households |
| Less than $10,000 | 13 | 1.6% |
| $10,000 to $14,999 | 0 | 0.0% |
| $15,000 to $24,999 | 30 | 3.8% |
| $25,000 to $34,999 | 15 | 1.9% |
| $35,000 to $49,999 | 32 | 4.0% |
| $50,000 to $74,999 | 143 | 18.0% |
| $75,000 to $99,999 | 59 | 7.4% |
| $100,000 to $149,999 | 128 | 16.1% |
| $150,000 to $199,999 | 149 | 18.7% |
| $200,000+ | 227 | 28.5% |
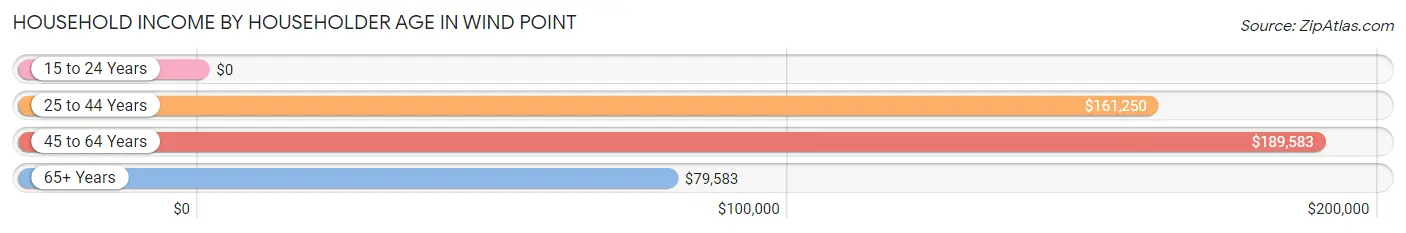
Household Income by Householder Age in Wind Point
The median household income in Wind Point is $143,000, with the highest median household income of $189,583 found in the 45 to 64 years age bracket for the primary householder. A total of 327 households (41.1%) fall into this category.
| Income Bracket | # Households | Median Income |
| 15 to 24 Years | 0 (0.0%) | $0 |
| 25 to 44 Years | 85 (10.7%) | $161,250 |
| 45 to 64 Years | 327 (41.1%) | $189,583 |
| 65+ Years | 384 (48.2%) | $79,583 |
| Total | 796 (100.0%) | $143,000 |
Poverty in Wind Point
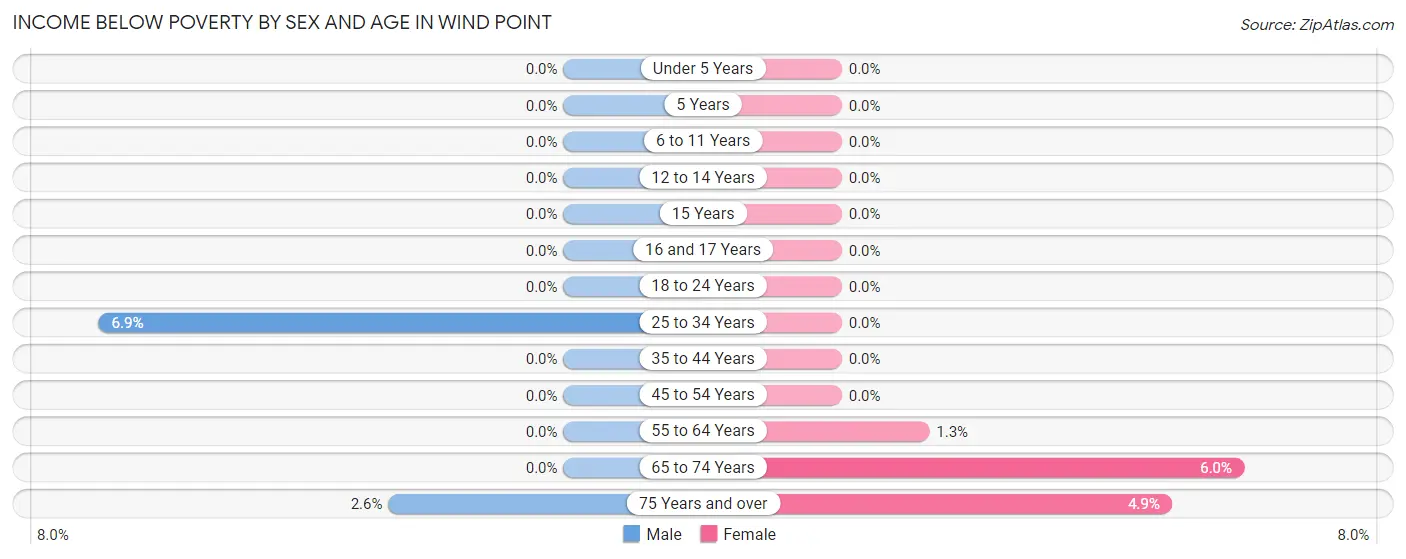
Income Below Poverty by Sex and Age in Wind Point
With 0.7% poverty level for males and 1.9% for females among the residents of Wind Point, 25 to 34 year old males and 65 to 74 year old females are the most vulnerable to poverty, with 2 males (6.9%) and 8 females (6.0%) in their respective age groups living below the poverty level.
| Age Bracket | Male | Female |
| Under 5 Years | 0 (0.0%) | 0 (0.0%) |
| 5 Years | 0 (0.0%) | 0 (0.0%) |
| 6 to 11 Years | 0 (0.0%) | 0 (0.0%) |
| 12 to 14 Years | 0 (0.0%) | 0 (0.0%) |
| 15 Years | 0 (0.0%) | 0 (0.0%) |
| 16 and 17 Years | 0 (0.0%) | 0 (0.0%) |
| 18 to 24 Years | 0 (0.0%) | 0 (0.0%) |
| 25 to 34 Years | 2 (6.9%) | 0 (0.0%) |
| 35 to 44 Years | 0 (0.0%) | 0 (0.0%) |
| 45 to 54 Years | 0 (0.0%) | 0 (0.0%) |
| 55 to 64 Years | 0 (0.0%) | 2 (1.3%) |
| 65 to 74 Years | 0 (0.0%) | 8 (6.0%) |
| 75 Years and over | 4 (2.6%) | 5 (4.9%) |
| Total | 6 (0.7%) | 15 (1.9%) |
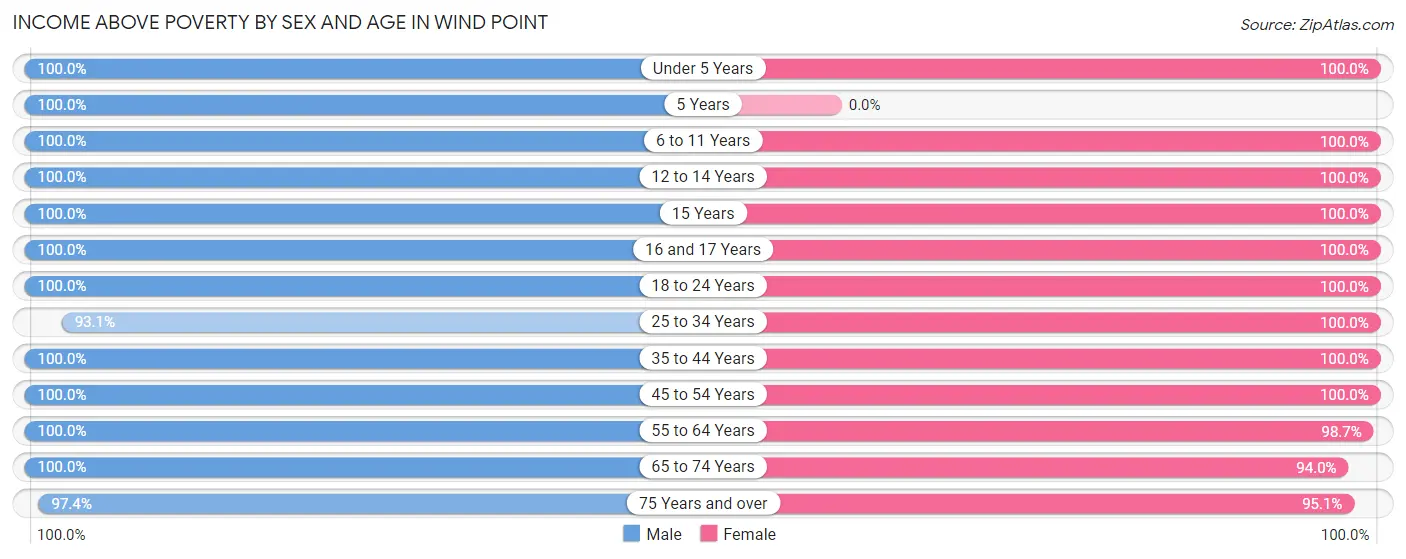
Income Above Poverty by Sex and Age in Wind Point
According to the poverty statistics in Wind Point, males aged under 5 years and females aged under 5 years are the age groups that are most secure financially, with 100.0% of males and 100.0% of females in these age groups living above the poverty line.
| Age Bracket | Male | Female |
| Under 5 Years | 17 (100.0%) | 10 (100.0%) |
| 5 Years | 7 (100.0%) | 0 (0.0%) |
| 6 to 11 Years | 44 (100.0%) | 36 (100.0%) |
| 12 to 14 Years | 26 (100.0%) | 22 (100.0%) |
| 15 Years | 12 (100.0%) | 22 (100.0%) |
| 16 and 17 Years | 17 (100.0%) | 15 (100.0%) |
| 18 to 24 Years | 34 (100.0%) | 29 (100.0%) |
| 25 to 34 Years | 27 (93.1%) | 29 (100.0%) |
| 35 to 44 Years | 62 (100.0%) | 87 (100.0%) |
| 45 to 54 Years | 171 (100.0%) | 160 (100.0%) |
| 55 to 64 Years | 136 (100.0%) | 152 (98.7%) |
| 65 to 74 Years | 170 (100.0%) | 126 (94.0%) |
| 75 Years and over | 150 (97.4%) | 97 (95.1%) |
| Total | 873 (99.3%) | 785 (98.1%) |
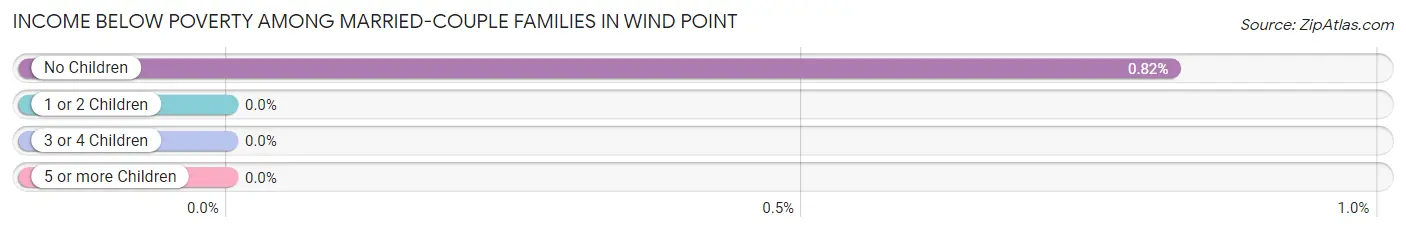
Income Below Poverty Among Married-Couple Families in Wind Point
The poverty statistics for married-couple families in Wind Point show that 0.7% or 4 of the total 607 families live below the poverty line. Families with no children have the highest poverty rate of 0.8%, comprising of 4 families. On the other hand, families with 1 or 2 children have the lowest poverty rate of 0.0%, which includes 0 families.
| Children | Above Poverty | Below Poverty |
| No Children | 486 (99.2%) | 4 (0.8%) |
| 1 or 2 Children | 105 (100.0%) | 0 (0.0%) |
| 3 or 4 Children | 12 (100.0%) | 0 (0.0%) |
| 5 or more Children | 0 (0.0%) | 0 (0.0%) |
| Total | 603 (99.3%) | 4 (0.7%) |
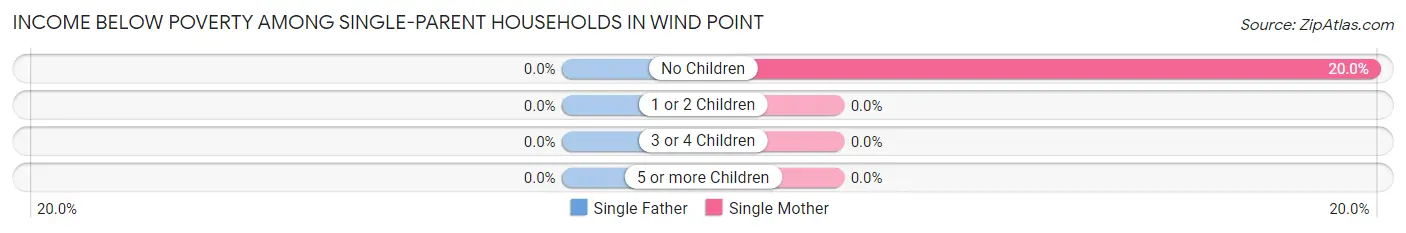
Income Below Poverty Among Single-Parent Households in Wind Point
| Children | Single Father | Single Mother |
| No Children | 0 (0.0%) | 2 (20.0%) |
| 1 or 2 Children | 0 (0.0%) | 0 (0.0%) |
| 3 or 4 Children | 0 (0.0%) | 0 (0.0%) |
| 5 or more Children | 0 (0.0%) | 0 (0.0%) |
| Total | 0 (0.0%) | 2 (10.0%) |
Income Below Poverty Among Married-Couple vs Single-Parent Households in Wind Point
The poverty data for Wind Point shows that 4 of the married-couple family households (0.7%) and 2 of the single-parent households (6.1%) are living below the poverty level. Within the married-couple family households, those with no children have the highest poverty rate, with 4 households (0.8%) falling below the poverty line. Among the single-parent households, those with no children have the highest poverty rate, with 2 household (11.1%) living below poverty.
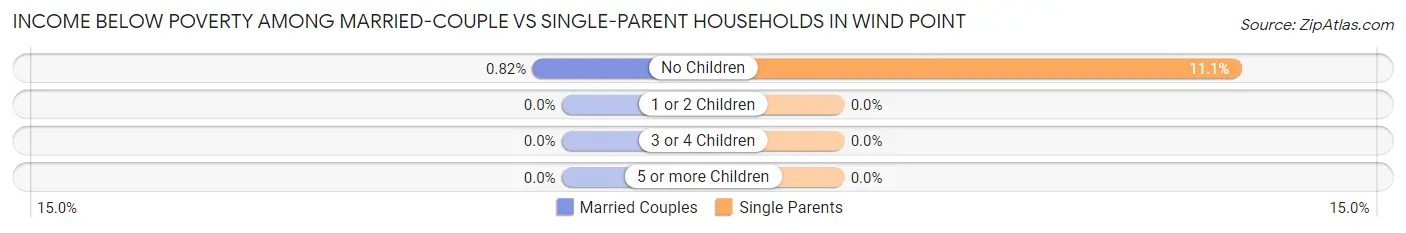
| Children | Married-Couple Families | Single-Parent Households |
| No Children | 4 (0.8%) | 2 (11.1%) |
| 1 or 2 Children | 0 (0.0%) | 0 (0.0%) |
| 3 or 4 Children | 0 (0.0%) | 0 (0.0%) |
| 5 or more Children | 0 (0.0%) | 0 (0.0%) |
| Total | 4 (0.7%) | 2 (6.1%) |
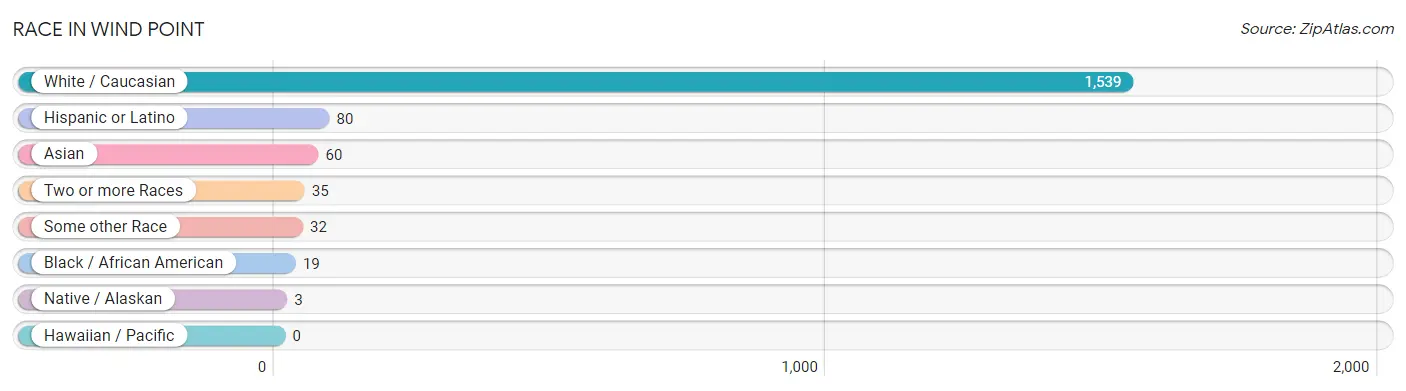
Race in Wind Point
The most populous races in Wind Point are White / Caucasian (1,539 | 91.2%), Hispanic or Latino (80 | 4.7%), and Asian (60 | 3.5%).
| Race | # Population | % Population |
| Asian | 60 | 3.5% |
| Black / African American | 19 | 1.1% |
| Hawaiian / Pacific | 0 | 0.0% |
| Hispanic or Latino | 80 | 4.7% |
| Native / Alaskan | 3 | 0.2% |
| White / Caucasian | 1,539 | 91.2% |
| Two or more Races | 35 | 2.1% |
| Some other Race | 32 | 1.9% |
| Total | 1,688 | 100.0% |
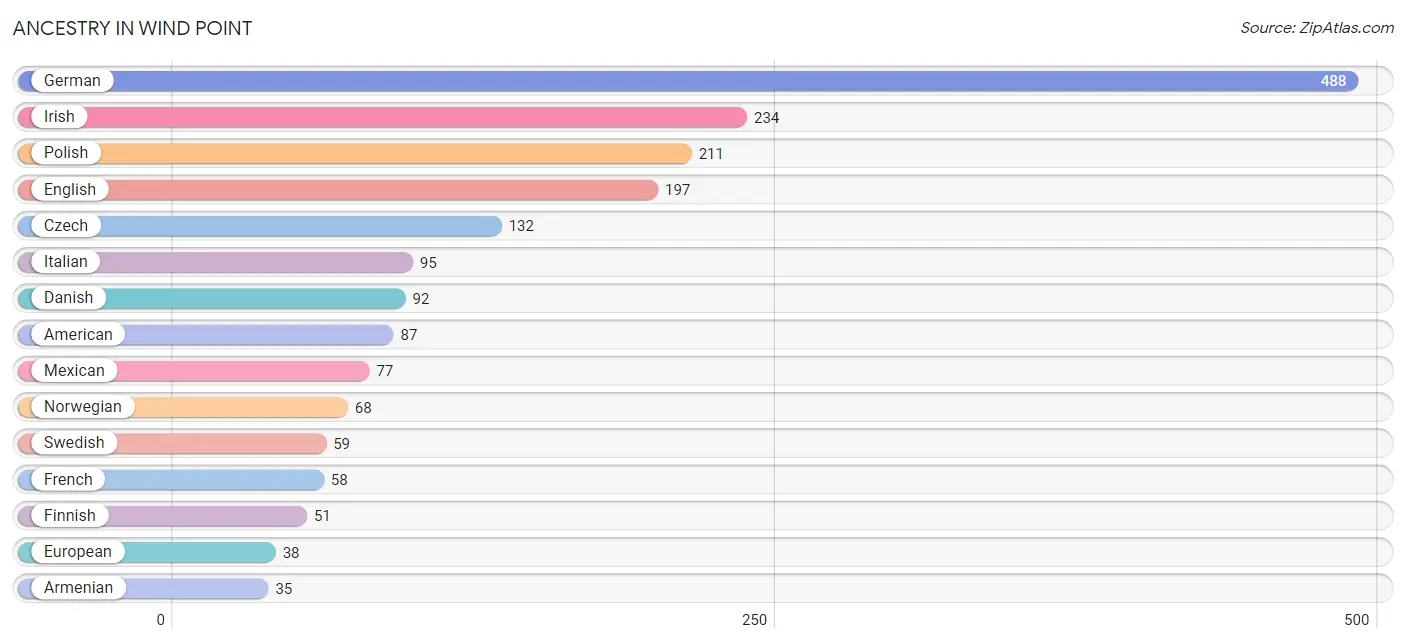
Ancestry in Wind Point
The most populous ancestries reported in Wind Point are German (488 | 28.9%), Irish (234 | 13.9%), Polish (211 | 12.5%), English (197 | 11.7%), and Czech (132 | 7.8%), together accounting for 74.8% of all Wind Point residents.
| Ancestry | # Population | % Population |
| Albanian | 6 | 0.4% |
| American | 87 | 5.1% |
| Arab | 5 | 0.3% |
| Armenian | 35 | 2.1% |
| Austrian | 4 | 0.2% |
| Belgian | 5 | 0.3% |
| Bhutanese | 4 | 0.2% |
| Brazilian | 12 | 0.7% |
| British | 7 | 0.4% |
| Burmese | 2 | 0.1% |
| Croatian | 3 | 0.2% |
| Czech | 132 | 7.8% |
| Danish | 92 | 5.4% |
| Dutch | 19 | 1.1% |
| Eastern European | 11 | 0.6% |
| English | 197 | 11.7% |
| European | 38 | 2.2% |
| Finnish | 51 | 3.0% |
| French | 58 | 3.4% |
| French Canadian | 6 | 0.4% |
| German | 488 | 28.9% |
| Greek | 12 | 0.7% |
| Hungarian | 5 | 0.3% |
| Irish | 234 | 13.9% |
| Italian | 95 | 5.6% |
| Korean | 4 | 0.2% |
| Lebanese | 5 | 0.3% |
| Lithuanian | 1 | 0.1% |
| Malaysian | 24 | 1.4% |
| Mexican | 77 | 4.6% |
| Northern European | 2 | 0.1% |
| Norwegian | 68 | 4.0% |
| Polish | 211 | 12.5% |
| Romanian | 15 | 0.9% |
| Russian | 7 | 0.4% |
| Scandinavian | 12 | 0.7% |
| Scotch-Irish | 5 | 0.3% |
| Scottish | 27 | 1.6% |
| Slavic | 6 | 0.4% |
| Slovak | 21 | 1.2% |
| Spanish | 3 | 0.2% |
| Swedish | 59 | 3.5% |
| Swiss | 2 | 0.1% |
| Thai | 26 | 1.5% |
| Ukrainian | 6 | 0.4% |
| Welsh | 13 | 0.8% | View All 46 Rows |
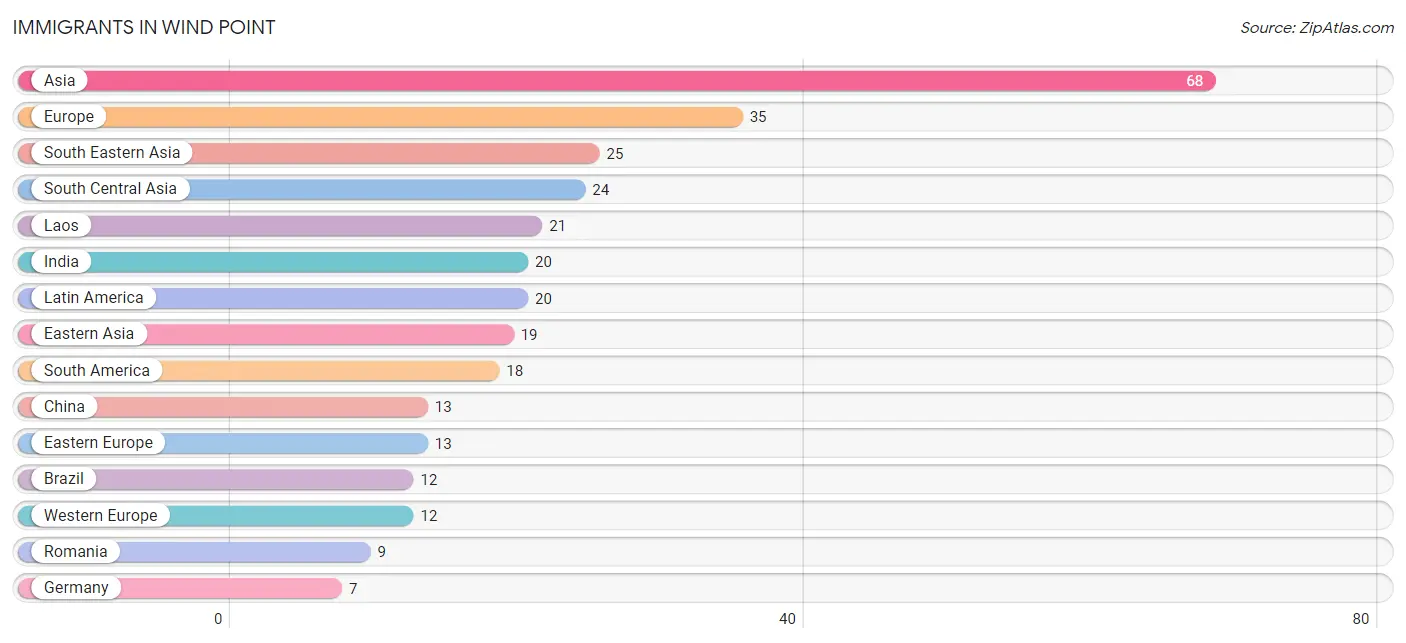
Immigrants in Wind Point
The most numerous immigrant groups reported in Wind Point came from Asia (68 | 4.0%), Europe (35 | 2.1%), South Eastern Asia (25 | 1.5%), South Central Asia (24 | 1.4%), and Laos (21 | 1.2%), together accounting for 10.2% of all Wind Point residents.
| Immigration Origin | # Population | % Population |
| Asia | 68 | 4.0% |
| Brazil | 12 | 0.7% |
| Canada | 6 | 0.4% |
| Central America | 2 | 0.1% |
| Chile | 6 | 0.4% |
| China | 13 | 0.8% |
| Eastern Asia | 19 | 1.1% |
| Eastern Europe | 13 | 0.8% |
| England | 5 | 0.3% |
| Europe | 35 | 2.1% |
| France | 5 | 0.3% |
| Germany | 7 | 0.4% |
| India | 20 | 1.2% |
| Italy | 5 | 0.3% |
| Japan | 4 | 0.2% |
| Korea | 2 | 0.1% |
| Laos | 21 | 1.2% |
| Latin America | 20 | 1.2% |
| Mexico | 2 | 0.1% |
| Northern Europe | 5 | 0.3% |
| Pakistan | 4 | 0.2% |
| Philippines | 4 | 0.2% |
| Romania | 9 | 0.5% |
| South America | 18 | 1.1% |
| South Central Asia | 24 | 1.4% |
| South Eastern Asia | 25 | 1.5% |
| Southern Europe | 5 | 0.3% |
| Ukraine | 4 | 0.2% |
| Western Europe | 12 | 0.7% | View All 29 Rows |
Sex and Age in Wind Point
Sex and Age in Wind Point
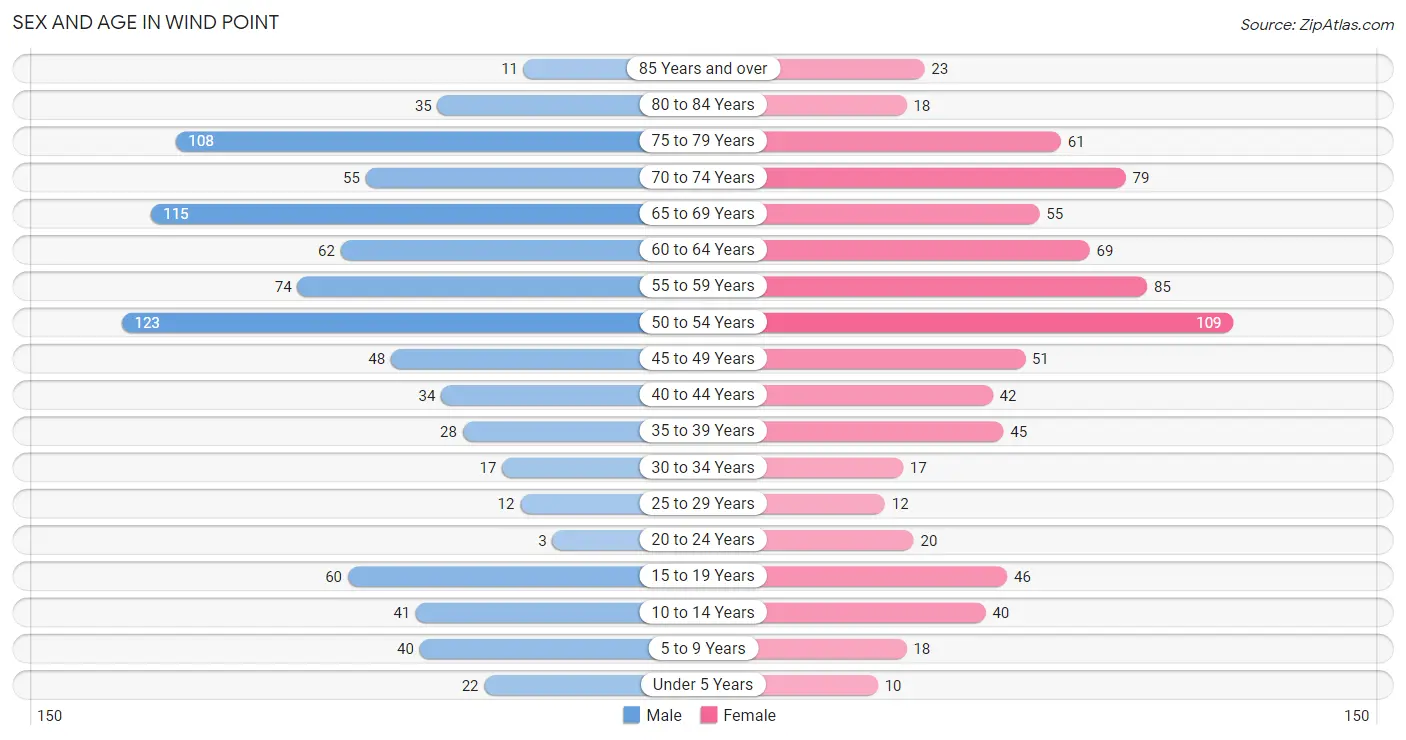
The most populous age groups in Wind Point are 50 to 54 Years (123 | 13.9%) for men and 50 to 54 Years (109 | 13.6%) for women.
| Age Bracket | Male | Female |
| Under 5 Years | 22 (2.5%) | 10 (1.3%) |
| 5 to 9 Years | 40 (4.5%) | 18 (2.2%) |
| 10 to 14 Years | 41 (4.6%) | 40 (5.0%) |
| 15 to 19 Years | 60 (6.8%) | 46 (5.8%) |
| 20 to 24 Years | 3 (0.3%) | 20 (2.5%) |
| 25 to 29 Years | 12 (1.3%) | 12 (1.5%) |
| 30 to 34 Years | 17 (1.9%) | 17 (2.1%) |
| 35 to 39 Years | 28 (3.2%) | 45 (5.6%) |
| 40 to 44 Years | 34 (3.8%) | 42 (5.2%) |
| 45 to 49 Years | 48 (5.4%) | 51 (6.4%) |
| 50 to 54 Years | 123 (13.9%) | 109 (13.6%) |
| 55 to 59 Years | 74 (8.3%) | 85 (10.6%) |
| 60 to 64 Years | 62 (7.0%) | 69 (8.6%) |
| 65 to 69 Years | 115 (13.0%) | 55 (6.9%) |
| 70 to 74 Years | 55 (6.2%) | 79 (9.9%) |
| 75 to 79 Years | 108 (12.2%) | 61 (7.6%) |
| 80 to 84 Years | 35 (3.9%) | 18 (2.2%) |
| 85 Years and over | 11 (1.2%) | 23 (2.9%) |
| Total | 888 (100.0%) | 800 (100.0%) |
Families and Households in Wind Point
Median Family Size in Wind Point
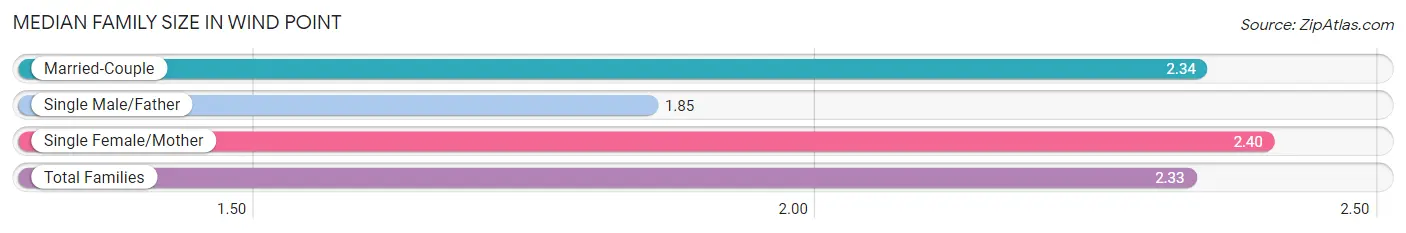
The median family size in Wind Point is 2.33 persons per family, with single female/mother families (20 | 3.1%) accounting for the largest median family size of 2.4 persons per family. On the other hand, single male/father families (13 | 2.0%) represent the smallest median family size with 1.85 persons per family.
| Family Type | # Families | Family Size |
| Married-Couple | 607 (94.8%) | 2.34 |
| Single Male/Father | 13 (2.0%) | 1.85 |
| Single Female/Mother | 20 (3.1%) | 2.40 |
| Total Families | 640 (100.0%) | 2.33 |
Median Household Size in Wind Point
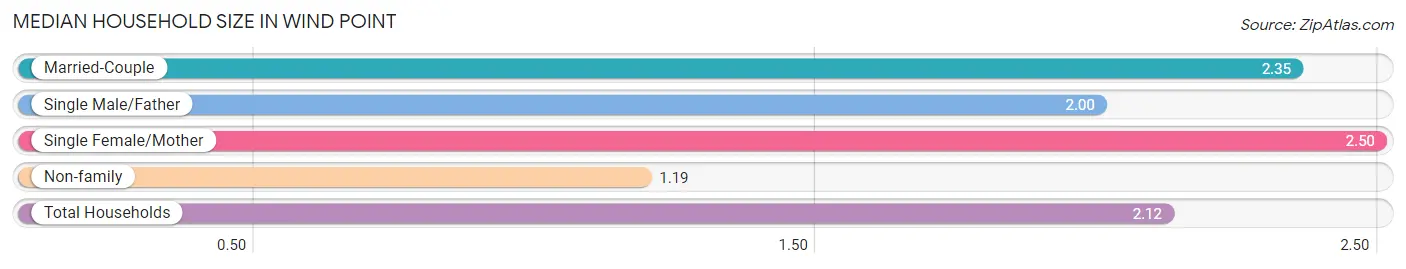
The median household size in Wind Point is 2.12 persons per household, with single female/mother households (20 | 2.5%) accounting for the largest median household size of 2.5 persons per household. non-family households (156 | 19.6%) represent the smallest median household size with 1.19 persons per household.
| Household Type | # Households | Household Size |
| Married-Couple | 607 (76.3%) | 2.35 |
| Single Male/Father | 13 (1.6%) | 2.00 |
| Single Female/Mother | 20 (2.5%) | 2.50 |
| Non-family | 156 (19.6%) | 1.19 |
| Total Households | 796 (100.0%) | 2.12 |
Household Size by Marriage Status in Wind Point
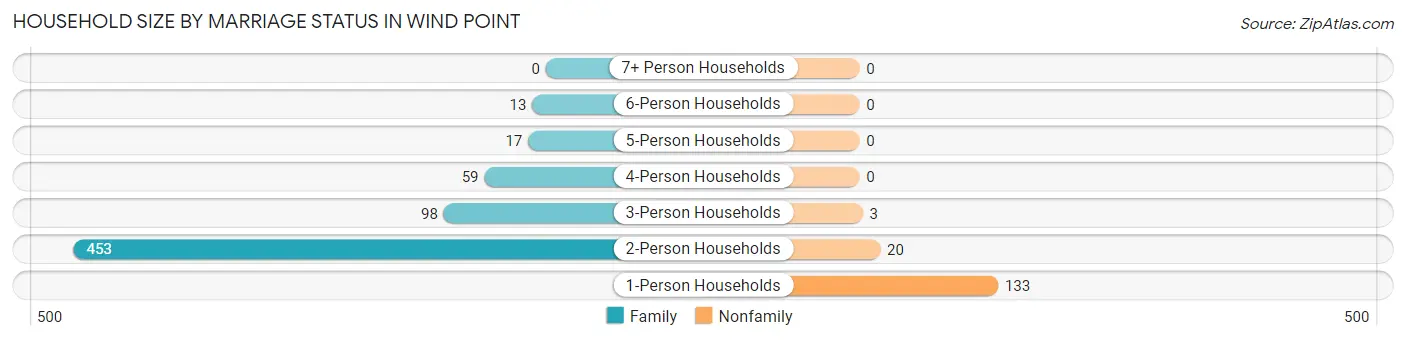
Out of a total of 796 households in Wind Point, 640 (80.4%) are family households, while 156 (19.6%) are nonfamily households. The most numerous type of family households are 2-person households, comprising 453, and the most common type of nonfamily households are 1-person households, comprising 133.
| Household Size | Family Households | Nonfamily Households |
| 1-Person Households | - | 133 (16.7%) |
| 2-Person Households | 453 (56.9%) | 20 (2.5%) |
| 3-Person Households | 98 (12.3%) | 3 (0.4%) |
| 4-Person Households | 59 (7.4%) | 0 (0.0%) |
| 5-Person Households | 17 (2.1%) | 0 (0.0%) |
| 6-Person Households | 13 (1.6%) | 0 (0.0%) |
| 7+ Person Households | 0 (0.0%) | 0 (0.0%) |
| Total | 640 (80.4%) | 156 (19.6%) |
Female Fertility in Wind Point
Fertility by Age in Wind Point
Average fertility rate in Wind Point is 25.0 births per 1,000 women. Women in the age bracket of 15 to 19 years have the highest fertility rate with 87.0 births per 1,000 women. Women in the age bracket of 15 to 19 years acount for 66.7% of all women with births.
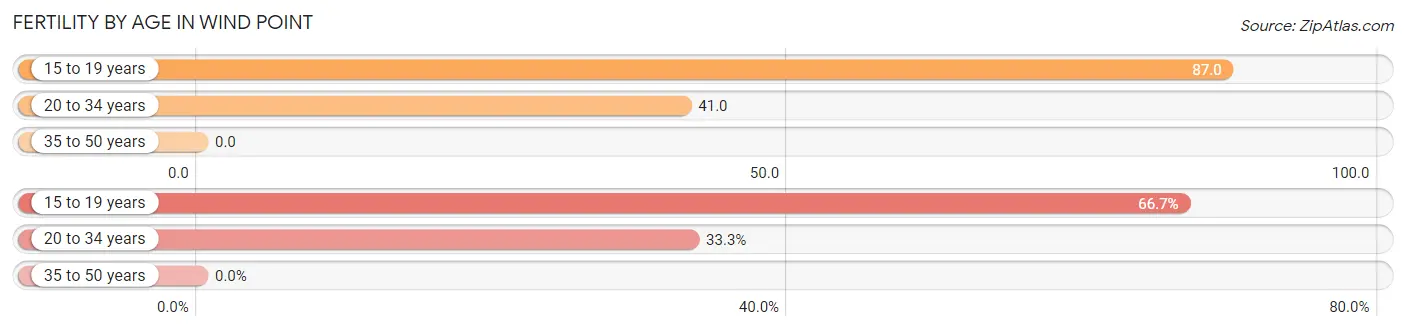
| Age Bracket | Women with Births | Births / 1,000 Women |
| 15 to 19 years | 4 (66.7%) | 87.0 |
| 20 to 34 years | 2 (33.3%) | 41.0 |
| 35 to 50 years | 0 (0.0%) | 0.0 |
| Total | 6 (100.0%) | 25.0 |
Fertility by Age by Marriage Status in Wind Point
33.3% of women with births (6) in Wind Point are married. The highest percentage of unmarried women with births falls into 15 to 19 years age bracket with 100.0% of them unmarried at the time of birth, while the lowest percentage of unmarried women with births belong to 20 to 34 years age bracket with 0.0% of them unmarried.
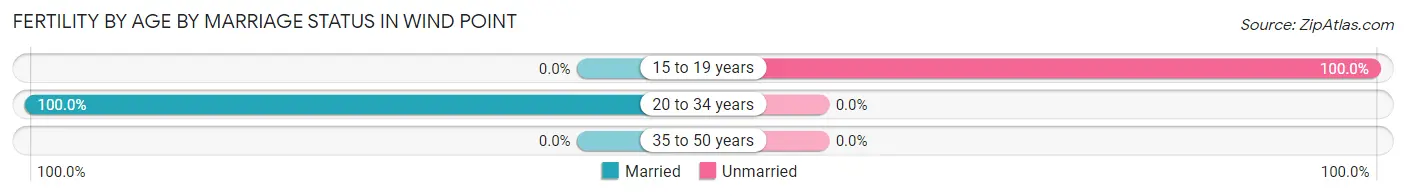
| Age Bracket | Married | Unmarried |
| 15 to 19 years | 0 (0.0%) | 4 (100.0%) |
| 20 to 34 years | 2 (100.0%) | 0 (0.0%) |
| 35 to 50 years | 0 (0.0%) | 0 (0.0%) |
| Total | 2 (33.3%) | 4 (66.7%) |
Fertility by Education in Wind Point
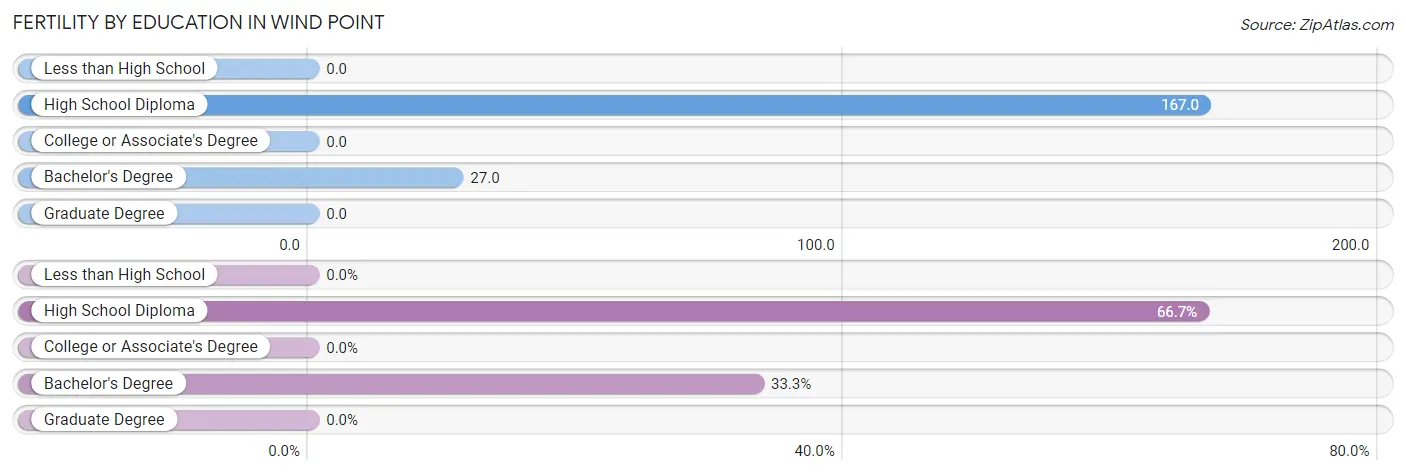
| Educational Attainment | Women with Births | Births / 1,000 Women |
| Less than High School | 0 (0.0%) | 0.0 |
| High School Diploma | 4 (66.7%) | 167.0 |
| College or Associate's Degree | 0 (0.0%) | 0.0 |
| Bachelor's Degree | 2 (33.3%) | 27.0 |
| Graduate Degree | 0 (0.0%) | 0.0 |
| Total | 6 (100.0%) | 25.0 |
Fertility by Education by Marriage Status in Wind Point
66.7% of women with births in Wind Point are unmarried. Women with the educational attainment of bachelor's degree are most likely to be married with 100.0% of them married at childbirth, while women with the educational attainment of high school diploma are least likely to be married with 100.0% of them unmarried at childbirth.
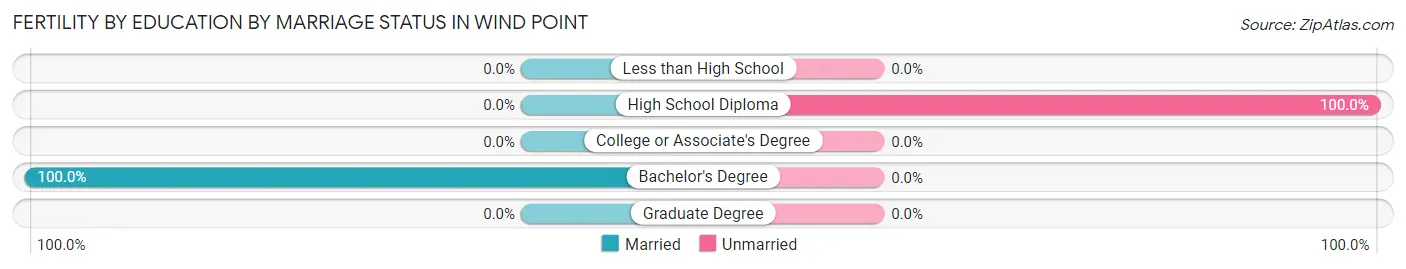
| Educational Attainment | Married | Unmarried |
| Less than High School | 0 (0.0%) | 0 (0.0%) |
| High School Diploma | 0 (0.0%) | 4 (100.0%) |
| College or Associate's Degree | 0 (0.0%) | 0 (0.0%) |
| Bachelor's Degree | 2 (100.0%) | 0 (0.0%) |
| Graduate Degree | 0 (0.0%) | 0 (0.0%) |
| Total | 2 (33.3%) | 4 (66.7%) |
Employment Characteristics in Wind Point
Employment by Class of Employer in Wind Point
Among the 827 employed individuals in Wind Point, private company employees (520 | 62.9%), not-for-profit organizations (91 | 11.0%), and self-employed (not incorporated) (71 | 8.6%) make up the most common classes of employment.
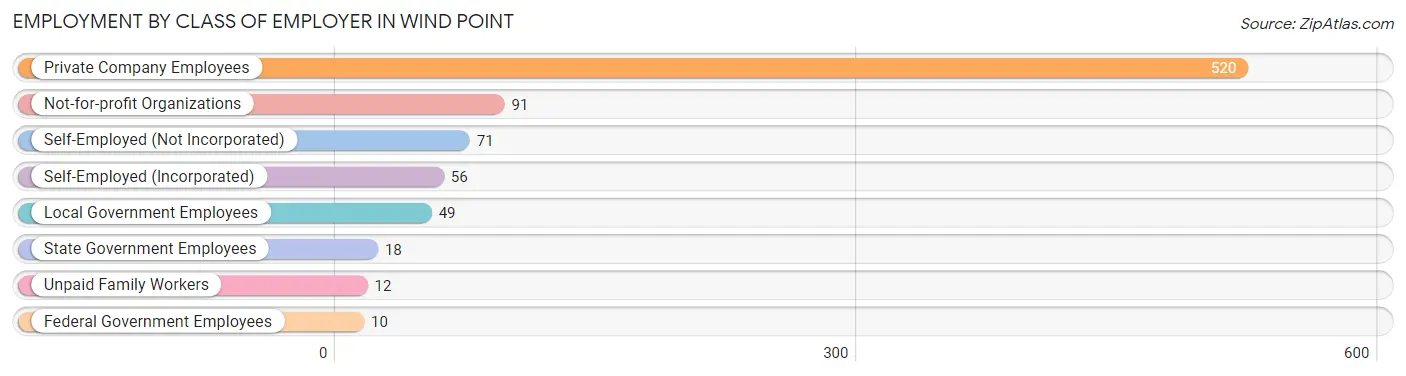
| Employer Class | # Employees | % Employees |
| Private Company Employees | 520 | 62.9% |
| Self-Employed (Incorporated) | 56 | 6.8% |
| Self-Employed (Not Incorporated) | 71 | 8.6% |
| Not-for-profit Organizations | 91 | 11.0% |
| Local Government Employees | 49 | 5.9% |
| State Government Employees | 18 | 2.2% |
| Federal Government Employees | 10 | 1.2% |
| Unpaid Family Workers | 12 | 1.5% |
| Total | 827 | 100.0% |
Employment Status by Age in Wind Point
According to the labor force statistics for Wind Point, out of the total population over 16 years of age (1,483), 56.8% or 842 individuals are in the labor force, with 1.8% or 15 of them unemployed. The age group with the highest labor force participation rate is 25 to 29 years, with 83.3% or 20 individuals in the labor force. Within the labor force, the 30 to 34 years age range has the highest percentage of unemployed individuals, with 19.2% or 5 of them being unemployed.
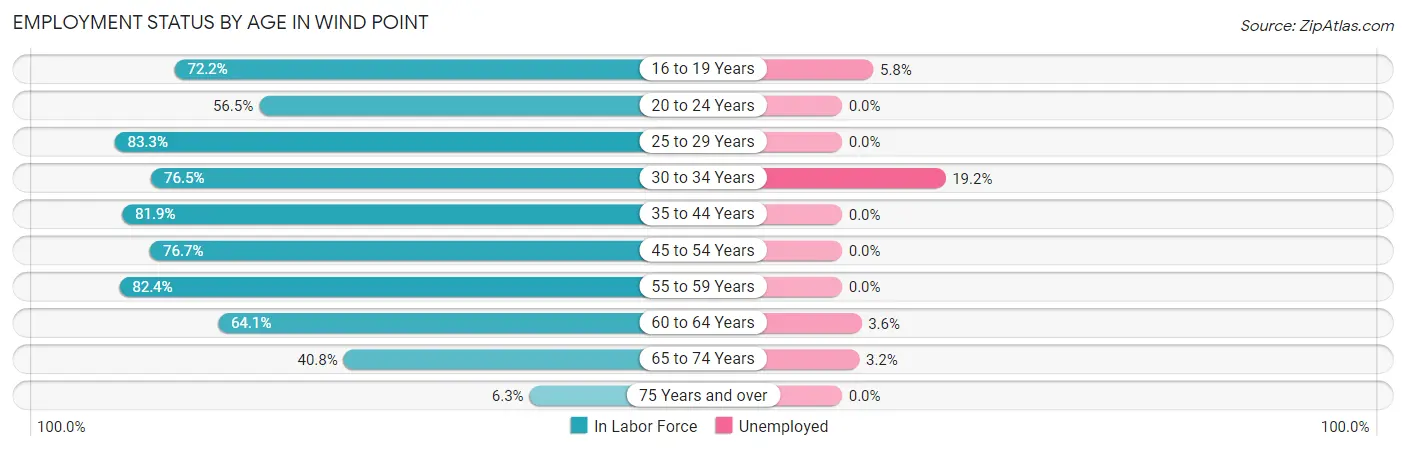
| Age Bracket | In Labor Force | Unemployed |
| 16 to 19 Years | 52 (72.2%) | 3 (5.8%) |
| 20 to 24 Years | 13 (56.5%) | 0 (0.0%) |
| 25 to 29 Years | 20 (83.3%) | 0 (0.0%) |
| 30 to 34 Years | 26 (76.5%) | 5 (19.2%) |
| 35 to 44 Years | 122 (81.9%) | 0 (0.0%) |
| 45 to 54 Years | 254 (76.7%) | 0 (0.0%) |
| 55 to 59 Years | 131 (82.4%) | 0 (0.0%) |
| 60 to 64 Years | 84 (64.1%) | 3 (3.6%) |
| 65 to 74 Years | 124 (40.8%) | 4 (3.2%) |
| 75 Years and over | 16 (6.3%) | 0 (0.0%) |
| Total | 842 (56.8%) | 15 (1.8%) |
Employment Status by Educational Attainment in Wind Point
According to labor force statistics for Wind Point, 76.9% of individuals (637) out of the total population between 25 and 64 years of age (828) are in the labor force, with 1.3% or 8 of them being unemployed. The group with the highest labor force participation rate are those with the educational attainment of bachelor's degree or higher, with 86.2% or 475 individuals in the labor force. Within the labor force, individuals with college / associate degree education have the highest percentage of unemployment, with 4.1% or 5 of them being unemployed.
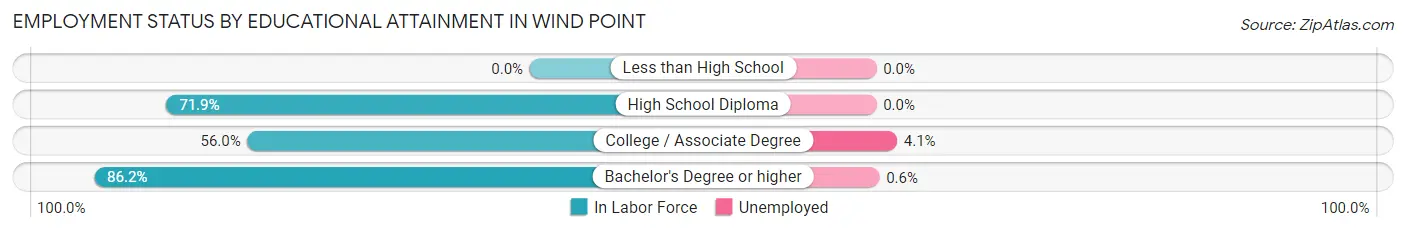
| Educational Attainment | In Labor Force | Unemployed |
| Less than High School | 0 (0.0%) | 0 (0.0%) |
| High School Diploma | 41 (71.9%) | 0 (0.0%) |
| College / Associate Degree | 121 (56.0%) | 9 (4.1%) |
| Bachelor's Degree or higher | 475 (86.2%) | 3 (0.6%) |
| Total | 637 (76.9%) | 11 (1.3%) |
Employment Occupations by Sex in Wind Point
Management, Business, Science and Arts Occupations
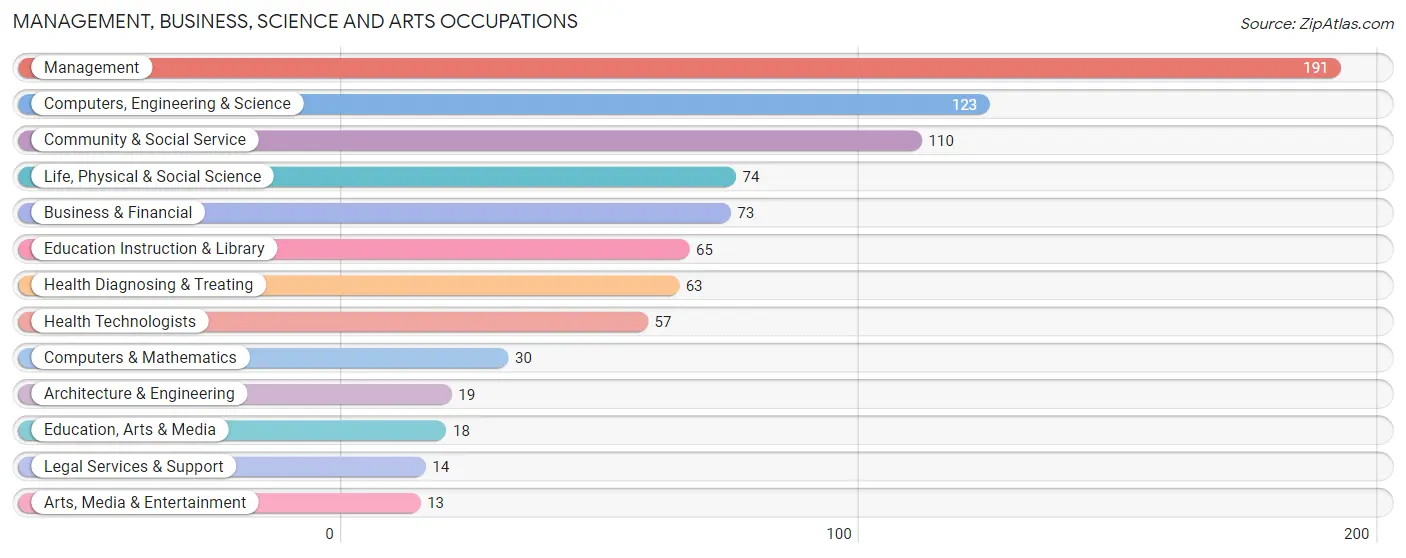
The most common Management, Business, Science and Arts occupations in Wind Point are Management (191 | 23.1%), Computers, Engineering & Science (123 | 14.9%), Community & Social Service (110 | 13.3%), Life, Physical & Social Science (74 | 8.9%), and Business & Financial (73 | 8.8%).
Management, Business, Science and Arts Occupations by Sex
Within the Management, Business, Science and Arts occupations in Wind Point, the most male-oriented occupations are Architecture & Engineering (100.0%), Life, Physical & Social Science (86.5%), and Computers, Engineering & Science (80.5%), while the most female-oriented occupations are Education Instruction & Library (86.2%), Arts, Media & Entertainment (84.6%), and Community & Social Service (81.8%).
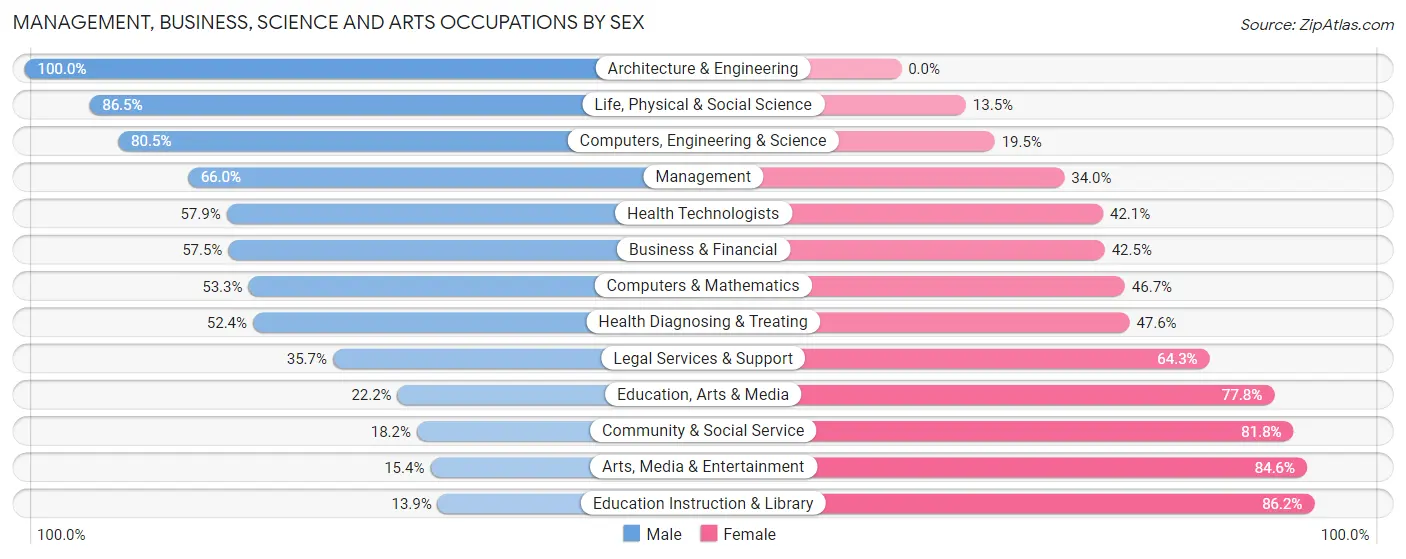
| Occupation | Male | Female |
| Management | 126 (66.0%) | 65 (34.0%) |
| Business & Financial | 42 (57.5%) | 31 (42.5%) |
| Computers, Engineering & Science | 99 (80.5%) | 24 (19.5%) |
| Computers & Mathematics | 16 (53.3%) | 14 (46.7%) |
| Architecture & Engineering | 19 (100.0%) | 0 (0.0%) |
| Life, Physical & Social Science | 64 (86.5%) | 10 (13.5%) |
| Community & Social Service | 20 (18.2%) | 90 (81.8%) |
| Education, Arts & Media | 4 (22.2%) | 14 (77.8%) |
| Legal Services & Support | 5 (35.7%) | 9 (64.3%) |
| Education Instruction & Library | 9 (13.9%) | 56 (86.2%) |
| Arts, Media & Entertainment | 2 (15.4%) | 11 (84.6%) |
| Health Diagnosing & Treating | 33 (52.4%) | 30 (47.6%) |
| Health Technologists | 33 (57.9%) | 24 (42.1%) |
| Total (Category) | 320 (57.1%) | 240 (42.9%) |
| Total (Overall) | 468 (56.6%) | 359 (43.4%) |
Services Occupations
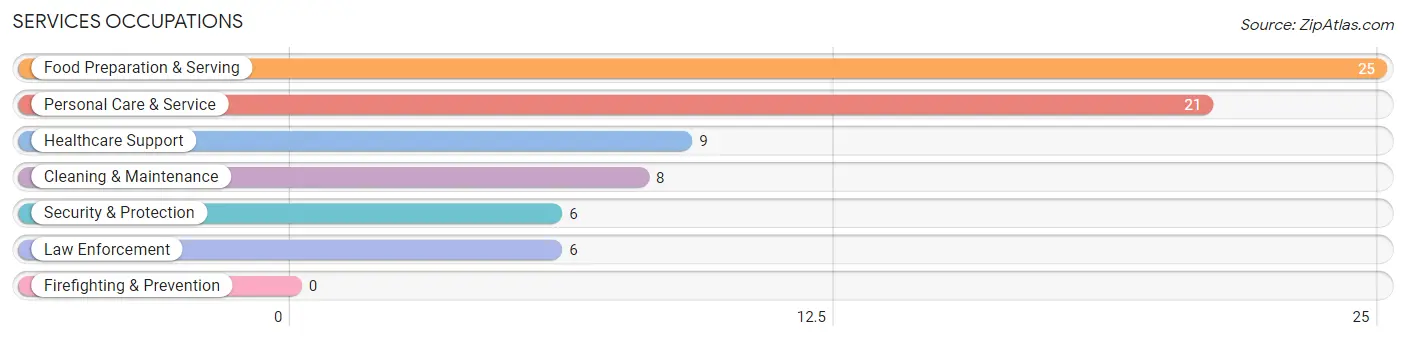
The most common Services occupations in Wind Point are Food Preparation & Serving (25 | 3.0%), Personal Care & Service (21 | 2.5%), Healthcare Support (9 | 1.1%), Cleaning & Maintenance (8 | 1.0%), and Security & Protection (6 | 0.7%).
Services Occupations by Sex
Within the Services occupations in Wind Point, the most male-oriented occupations are Security & Protection (100.0%), Law Enforcement (100.0%), and Cleaning & Maintenance (50.0%), while the most female-oriented occupations are Healthcare Support (77.8%), Personal Care & Service (71.4%), and Food Preparation & Serving (60.0%).
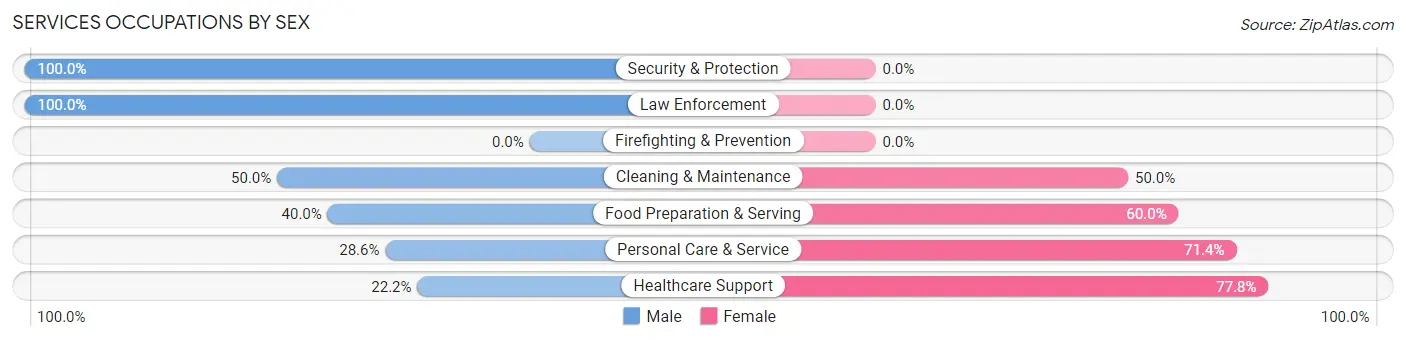
| Occupation | Male | Female |
| Healthcare Support | 2 (22.2%) | 7 (77.8%) |
| Security & Protection | 6 (100.0%) | 0 (0.0%) |
| Firefighting & Prevention | 0 (0.0%) | 0 (0.0%) |
| Law Enforcement | 6 (100.0%) | 0 (0.0%) |
| Food Preparation & Serving | 10 (40.0%) | 15 (60.0%) |
| Cleaning & Maintenance | 4 (50.0%) | 4 (50.0%) |
| Personal Care & Service | 6 (28.6%) | 15 (71.4%) |
| Total (Category) | 28 (40.6%) | 41 (59.4%) |
| Total (Overall) | 468 (56.6%) | 359 (43.4%) |
Sales and Office Occupations
The most common Sales and Office occupations in Wind Point are Sales & Related (57 | 6.9%), and Office & Administration (23 | 2.8%).

Sales and Office Occupations by Sex
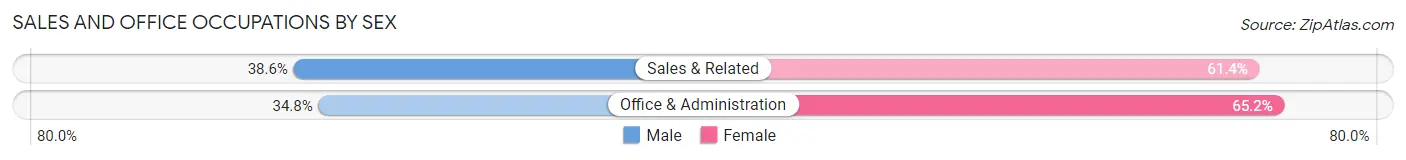
| Occupation | Male | Female |
| Sales & Related | 22 (38.6%) | 35 (61.4%) |
| Office & Administration | 8 (34.8%) | 15 (65.2%) |
| Total (Category) | 30 (37.5%) | 50 (62.5%) |
| Total (Overall) | 468 (56.6%) | 359 (43.4%) |
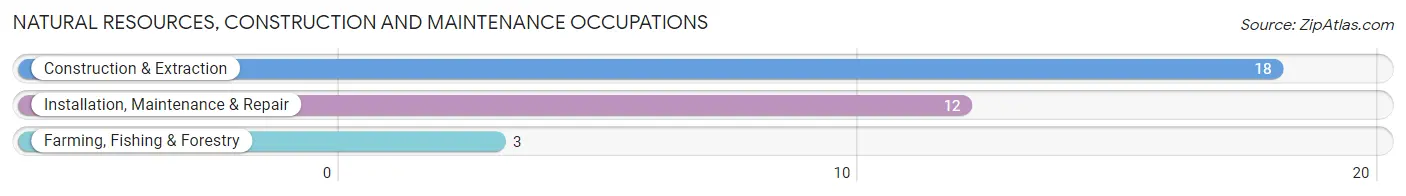
Natural Resources, Construction and Maintenance Occupations
The most common Natural Resources, Construction and Maintenance occupations in Wind Point are Construction & Extraction (18 | 2.2%), Installation, Maintenance & Repair (12 | 1.5%), and Farming, Fishing & Forestry (3 | 0.4%).
Natural Resources, Construction and Maintenance Occupations by Sex
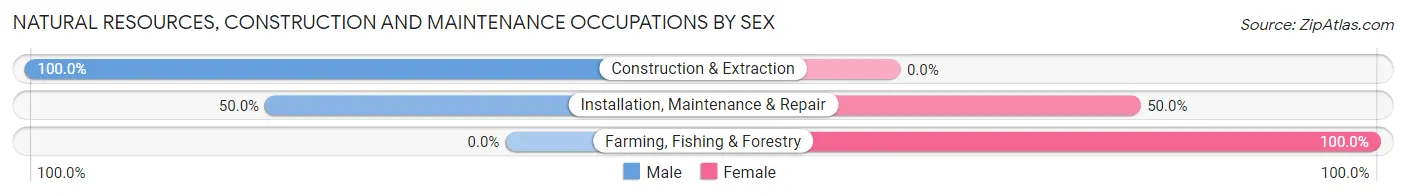
| Occupation | Male | Female |
| Farming, Fishing & Forestry | 0 (0.0%) | 3 (100.0%) |
| Construction & Extraction | 18 (100.0%) | 0 (0.0%) |
| Installation, Maintenance & Repair | 6 (50.0%) | 6 (50.0%) |
| Total (Category) | 24 (72.7%) | 9 (27.3%) |
| Total (Overall) | 468 (56.6%) | 359 (43.4%) |
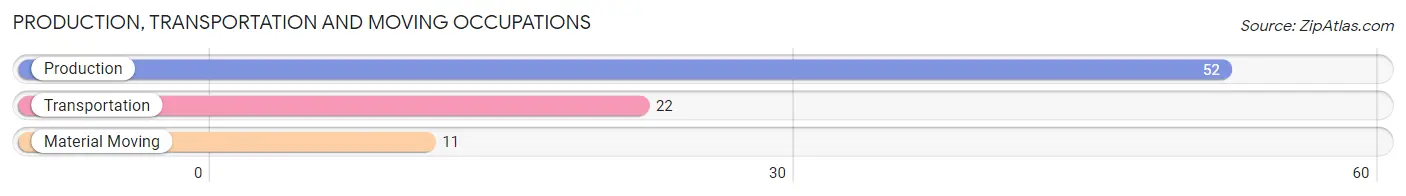
Production, Transportation and Moving Occupations
The most common Production, Transportation and Moving occupations in Wind Point are Production (52 | 6.3%), Transportation (22 | 2.7%), and Material Moving (11 | 1.3%).
Production, Transportation and Moving Occupations by Sex
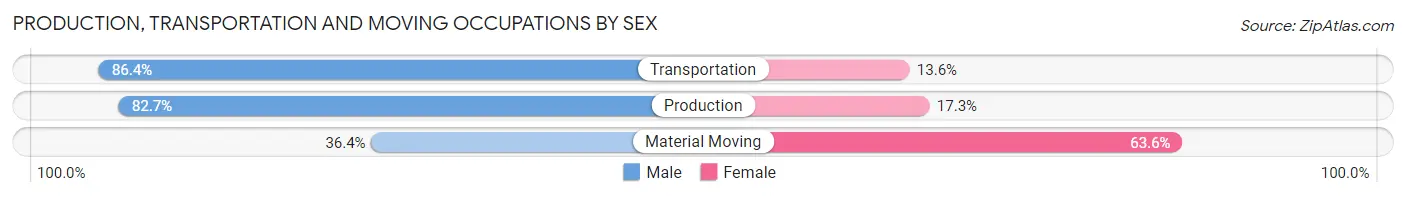
| Occupation | Male | Female |
| Production | 43 (82.7%) | 9 (17.3%) |
| Transportation | 19 (86.4%) | 3 (13.6%) |
| Material Moving | 4 (36.4%) | 7 (63.6%) |
| Total (Category) | 66 (77.6%) | 19 (22.4%) |
| Total (Overall) | 468 (56.6%) | 359 (43.4%) |
Employment Industries by Sex in Wind Point
Employment Industries in Wind Point
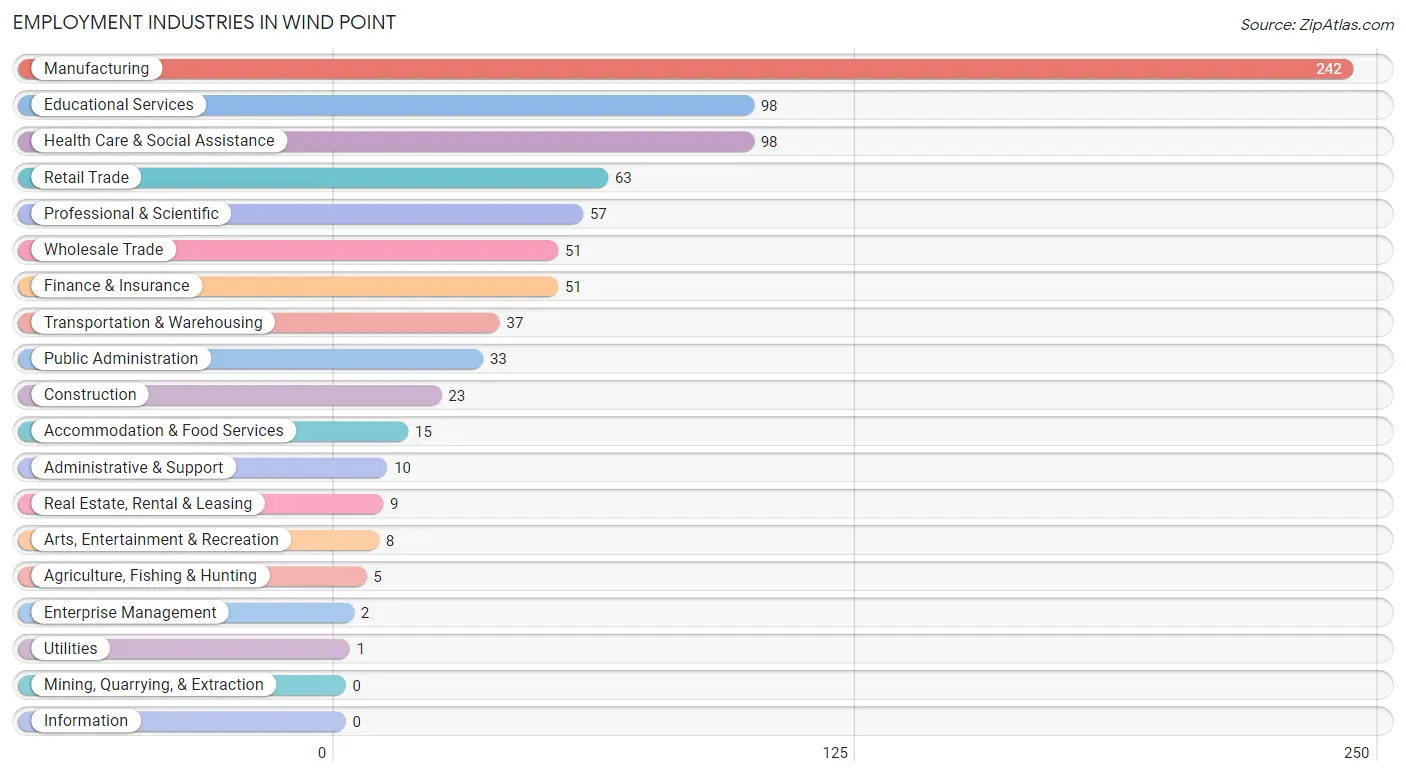
The major employment industries in Wind Point include Manufacturing (242 | 29.3%), Educational Services (98 | 11.8%), Health Care & Social Assistance (98 | 11.8%), Retail Trade (63 | 7.6%), and Professional & Scientific (57 | 6.9%).
Employment Industries by Sex in Wind Point
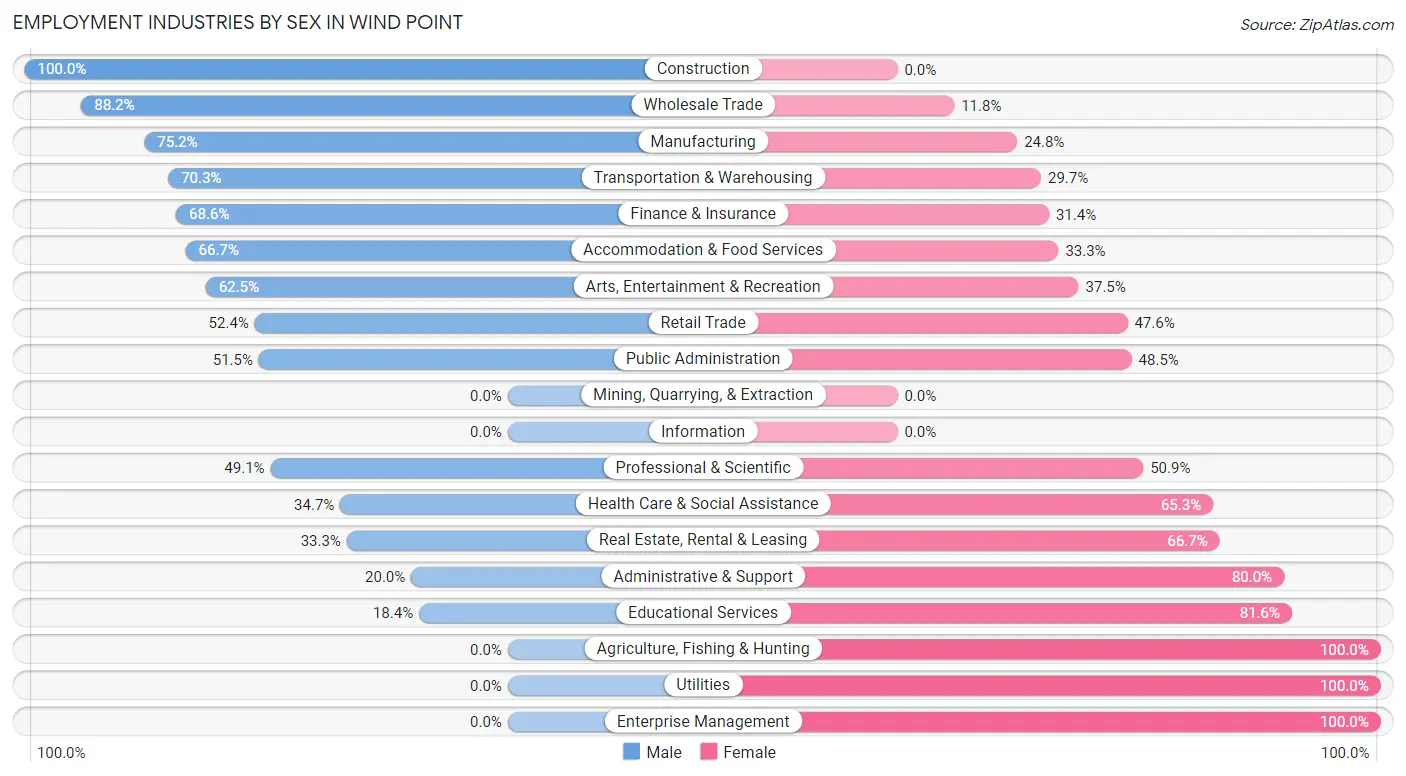
The Wind Point industries that see more men than women are Construction (100.0%), Wholesale Trade (88.2%), and Manufacturing (75.2%), whereas the industries that tend to have a higher number of women are Agriculture, Fishing & Hunting (100.0%), Utilities (100.0%), and Enterprise Management (100.0%).
| Industry | Male | Female |
| Agriculture, Fishing & Hunting | 0 (0.0%) | 5 (100.0%) |
| Mining, Quarrying, & Extraction | 0 (0.0%) | 0 (0.0%) |
| Construction | 23 (100.0%) | 0 (0.0%) |
| Manufacturing | 182 (75.2%) | 60 (24.8%) |
| Wholesale Trade | 45 (88.2%) | 6 (11.8%) |
| Retail Trade | 33 (52.4%) | 30 (47.6%) |
| Transportation & Warehousing | 26 (70.3%) | 11 (29.7%) |
| Utilities | 0 (0.0%) | 1 (100.0%) |
| Information | 0 (0.0%) | 0 (0.0%) |
| Finance & Insurance | 35 (68.6%) | 16 (31.4%) |
| Real Estate, Rental & Leasing | 3 (33.3%) | 6 (66.7%) |
| Professional & Scientific | 28 (49.1%) | 29 (50.9%) |
| Enterprise Management | 0 (0.0%) | 2 (100.0%) |
| Administrative & Support | 2 (20.0%) | 8 (80.0%) |
| Educational Services | 18 (18.4%) | 80 (81.6%) |
| Health Care & Social Assistance | 34 (34.7%) | 64 (65.3%) |
| Arts, Entertainment & Recreation | 5 (62.5%) | 3 (37.5%) |
| Accommodation & Food Services | 10 (66.7%) | 5 (33.3%) |
| Public Administration | 17 (51.5%) | 16 (48.5%) |
| Total | 468 (56.6%) | 359 (43.4%) |
Education in Wind Point
School Enrollment in Wind Point
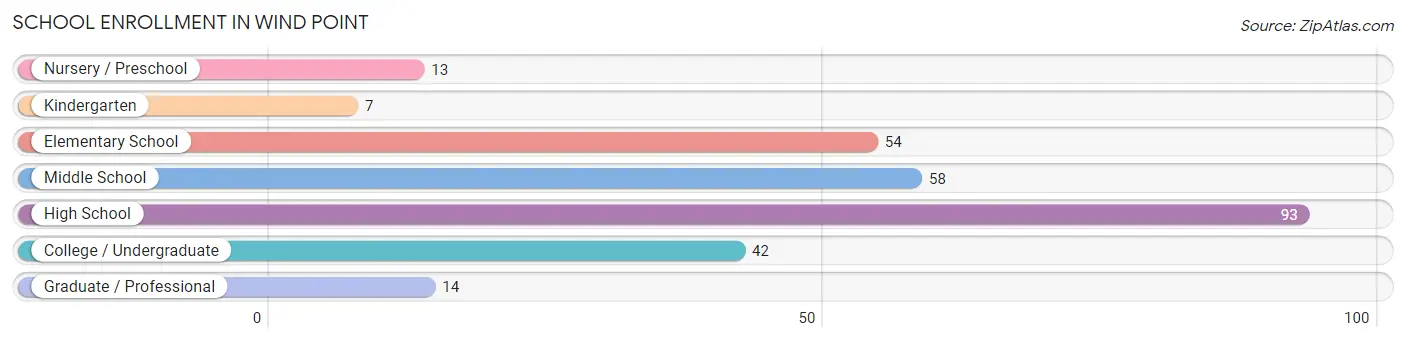
The most common levels of schooling among the 281 students in Wind Point are high school (93 | 33.1%), middle school (58 | 20.6%), and elementary school (54 | 19.2%).
| School Level | # Students | % Students |
| Nursery / Preschool | 13 | 4.6% |
| Kindergarten | 7 | 2.5% |
| Elementary School | 54 | 19.2% |
| Middle School | 58 | 20.6% |
| High School | 93 | 33.1% |
| College / Undergraduate | 42 | 14.9% |
| Graduate / Professional | 14 | 5.0% |
| Total | 281 | 100.0% |
School Enrollment by Age by Funding Source in Wind Point
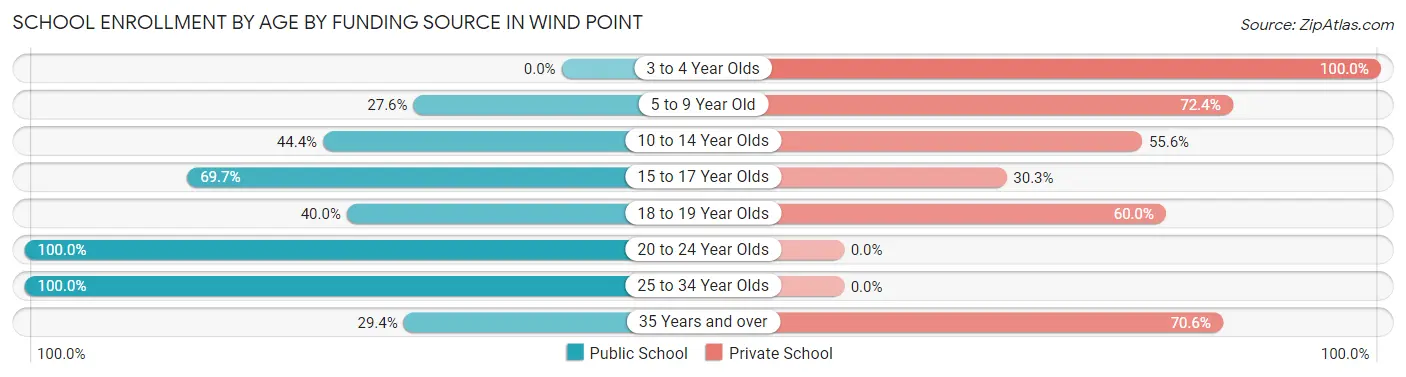
Out of a total of 281 students who are enrolled in schools in Wind Point, 141 (50.2%) attend a private institution, while the remaining 140 (49.8%) are enrolled in public schools. The age group of 3 to 4 year olds has the highest likelihood of being enrolled in private schools, with 10 (100.0% in the age bracket) enrolled. Conversely, the age group of 20 to 24 year olds has the lowest likelihood of being enrolled in a private school, with 20 (100.0% in the age bracket) attending a public institution.
| Age Bracket | Public School | Private School |
| 3 to 4 Year Olds | 0 (0.0%) | 10 (100.0%) |
| 5 to 9 Year Old | 16 (27.6%) | 42 (72.4%) |
| 10 to 14 Year Olds | 36 (44.4%) | 45 (55.6%) |
| 15 to 17 Year Olds | 46 (69.7%) | 20 (30.3%) |
| 18 to 19 Year Olds | 8 (40.0%) | 12 (60.0%) |
| 20 to 24 Year Olds | 20 (100.0%) | 0 (0.0%) |
| 25 to 34 Year Olds | 9 (100.0%) | 0 (0.0%) |
| 35 Years and over | 5 (29.4%) | 12 (70.6%) |
| Total | 140 (49.8%) | 141 (50.2%) |
Educational Attainment by Field of Study in Wind Point
Education (178 | 16.5%), business (172 | 16.0%), engineering (159 | 14.8%), science & technology (130 | 12.1%), and social sciences (78 | 7.2%) are the most common fields of study among 1,077 individuals in Wind Point who have obtained a bachelor's degree or higher.
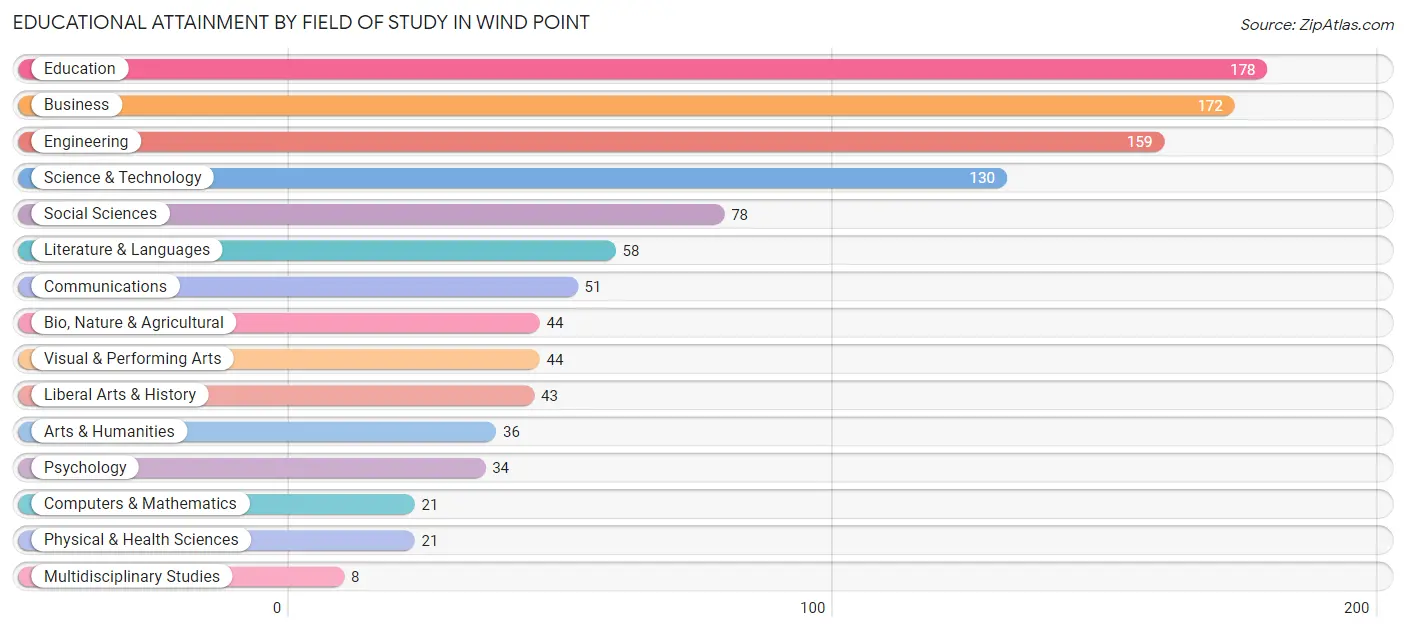
| Field of Study | # Graduates | % Graduates |
| Computers & Mathematics | 21 | 1.9% |
| Bio, Nature & Agricultural | 44 | 4.1% |
| Physical & Health Sciences | 21 | 1.9% |
| Psychology | 34 | 3.2% |
| Social Sciences | 78 | 7.2% |
| Engineering | 159 | 14.8% |
| Multidisciplinary Studies | 8 | 0.7% |
| Science & Technology | 130 | 12.1% |
| Business | 172 | 16.0% |
| Education | 178 | 16.5% |
| Literature & Languages | 58 | 5.4% |
| Liberal Arts & History | 43 | 4.0% |
| Visual & Performing Arts | 44 | 4.1% |
| Communications | 51 | 4.7% |
| Arts & Humanities | 36 | 3.3% |
| Total | 1,077 | 100.0% |
Transportation & Commute in Wind Point
Vehicle Availability by Sex in Wind Point
The most prevalent vehicle ownership categories in Wind Point are males with 2 vehicles (299, accounting for 63.9%) and females with 2 vehicles (176, making up 83.3%).
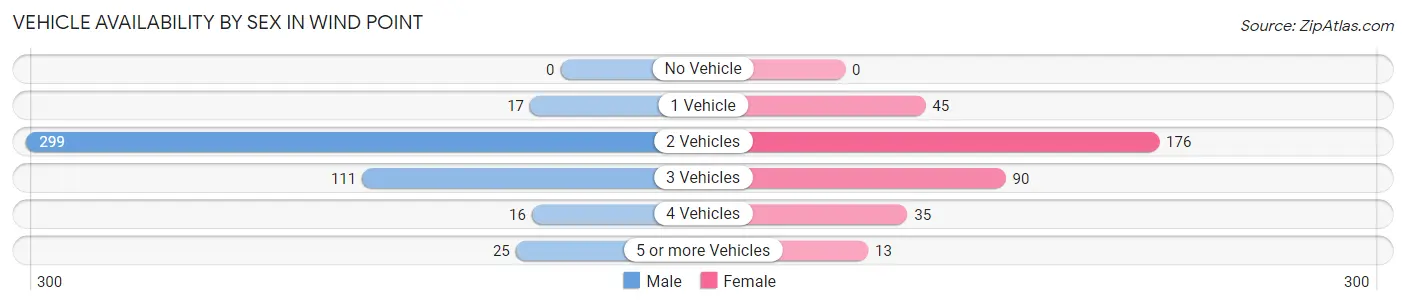
| Vehicles Available | Male | Female |
| No Vehicle | 0 (0.0%) | 0 (0.0%) |
| 1 Vehicle | 17 (3.6%) | 45 (12.5%) |
| 2 Vehicles | 299 (63.9%) | 176 (49.0%) |
| 3 Vehicles | 111 (23.7%) | 90 (25.1%) |
| 4 Vehicles | 16 (3.4%) | 35 (9.8%) |
| 5 or more Vehicles | 25 (5.3%) | 13 (3.6%) |
| Total | 468 (100.0%) | 359 (100.0%) |
Commute Time in Wind Point
The most frequently occuring commute durations in Wind Point are 45 to 59 minutes (109 commuters, 15.9%), 10 to 14 minutes (99 commuters, 14.4%), and 25 to 29 minutes (98 commuters, 14.3%).
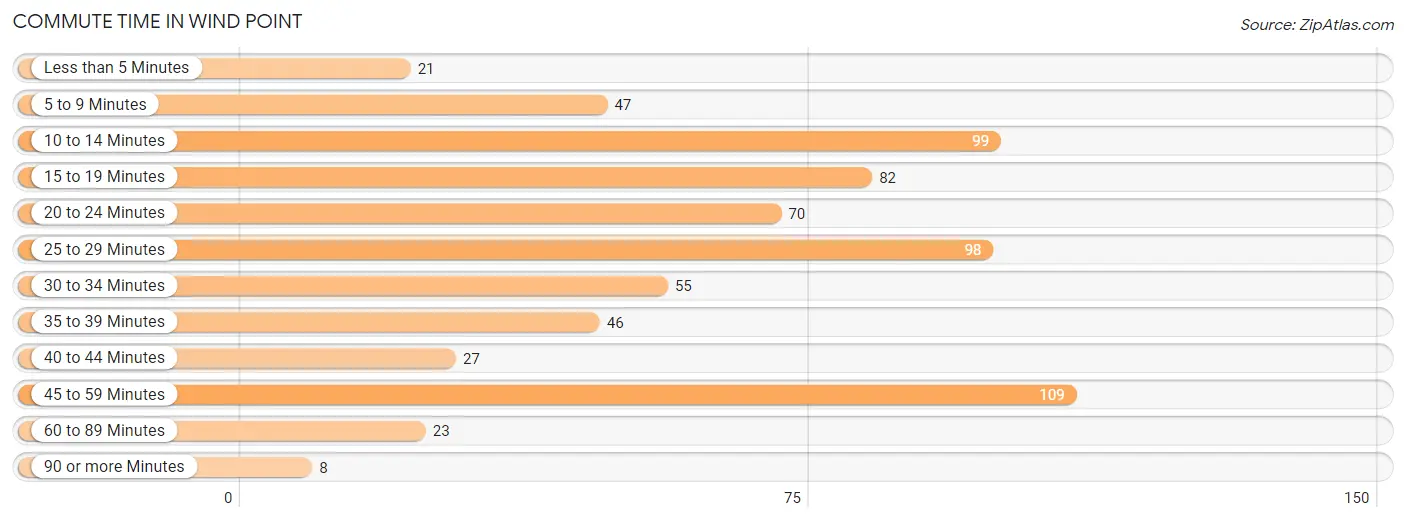
| Commute Time | # Commuters | % Commuters |
| Less than 5 Minutes | 21 | 3.1% |
| 5 to 9 Minutes | 47 | 6.9% |
| 10 to 14 Minutes | 99 | 14.4% |
| 15 to 19 Minutes | 82 | 12.0% |
| 20 to 24 Minutes | 70 | 10.2% |
| 25 to 29 Minutes | 98 | 14.3% |
| 30 to 34 Minutes | 55 | 8.0% |
| 35 to 39 Minutes | 46 | 6.7% |
| 40 to 44 Minutes | 27 | 3.9% |
| 45 to 59 Minutes | 109 | 15.9% |
| 60 to 89 Minutes | 23 | 3.4% |
| 90 or more Minutes | 8 | 1.2% |
Commute Time by Sex in Wind Point
The most common commute times in Wind Point are 25 to 29 minutes (84 commuters, 21.3%) for males and 10 to 14 minutes (62 commuters, 21.4%) for females.
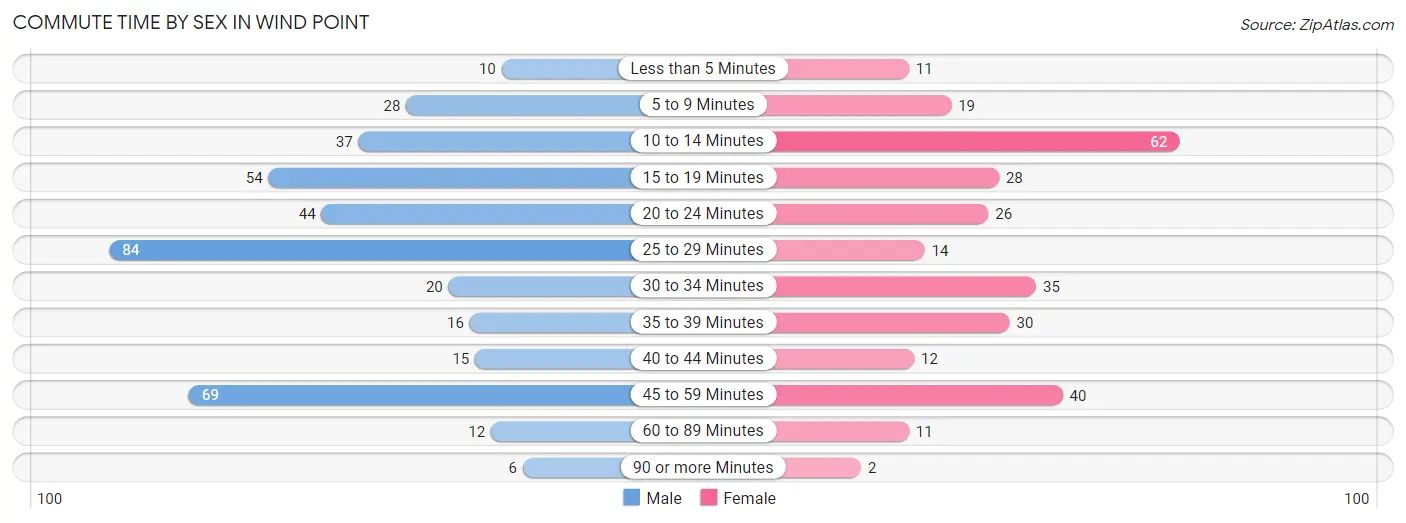
| Commute Time | Male | Female |
| Less than 5 Minutes | 10 (2.5%) | 11 (3.8%) |
| 5 to 9 Minutes | 28 (7.1%) | 19 (6.6%) |
| 10 to 14 Minutes | 37 (9.4%) | 62 (21.4%) |
| 15 to 19 Minutes | 54 (13.7%) | 28 (9.7%) |
| 20 to 24 Minutes | 44 (11.1%) | 26 (9.0%) |
| 25 to 29 Minutes | 84 (21.3%) | 14 (4.8%) |
| 30 to 34 Minutes | 20 (5.1%) | 35 (12.1%) |
| 35 to 39 Minutes | 16 (4.1%) | 30 (10.3%) |
| 40 to 44 Minutes | 15 (3.8%) | 12 (4.1%) |
| 45 to 59 Minutes | 69 (17.5%) | 40 (13.8%) |
| 60 to 89 Minutes | 12 (3.0%) | 11 (3.8%) |
| 90 or more Minutes | 6 (1.5%) | 2 (0.7%) |
Time of Departure to Work by Sex in Wind Point
The most frequent times of departure to work in Wind Point are 7:00 AM to 7:29 AM (98, 24.8%) for males and 7:00 AM to 7:29 AM (76, 26.2%) for females.
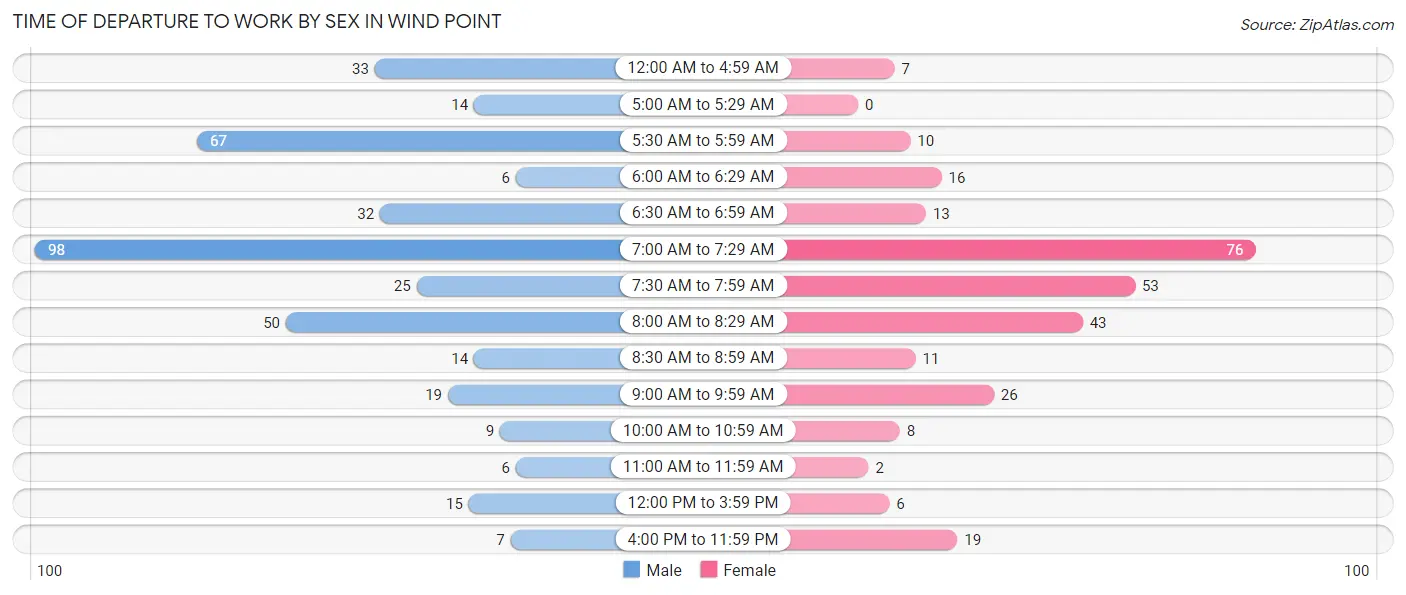
| Time of Departure | Male | Female |
| 12:00 AM to 4:59 AM | 33 (8.4%) | 7 (2.4%) |
| 5:00 AM to 5:29 AM | 14 (3.5%) | 0 (0.0%) |
| 5:30 AM to 5:59 AM | 67 (17.0%) | 10 (3.5%) |
| 6:00 AM to 6:29 AM | 6 (1.5%) | 16 (5.5%) |
| 6:30 AM to 6:59 AM | 32 (8.1%) | 13 (4.5%) |
| 7:00 AM to 7:29 AM | 98 (24.8%) | 76 (26.2%) |
| 7:30 AM to 7:59 AM | 25 (6.3%) | 53 (18.3%) |
| 8:00 AM to 8:29 AM | 50 (12.7%) | 43 (14.8%) |
| 8:30 AM to 8:59 AM | 14 (3.5%) | 11 (3.8%) |
| 9:00 AM to 9:59 AM | 19 (4.8%) | 26 (9.0%) |
| 10:00 AM to 10:59 AM | 9 (2.3%) | 8 (2.8%) |
| 11:00 AM to 11:59 AM | 6 (1.5%) | 2 (0.7%) |
| 12:00 PM to 3:59 PM | 15 (3.8%) | 6 (2.1%) |
| 4:00 PM to 11:59 PM | 7 (1.8%) | 19 (6.6%) |
| Total | 395 (100.0%) | 290 (100.0%) |
Housing Occupancy in Wind Point
Occupancy by Ownership in Wind Point
Of the total 796 dwellings in Wind Point, owner-occupied units account for 778 (97.7%), while renter-occupied units make up 18 (2.3%).
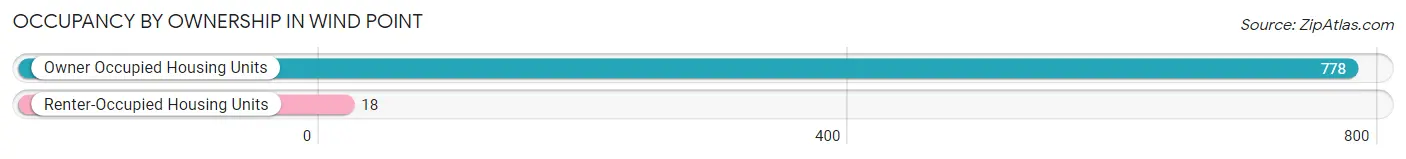
| Occupancy | # Housing Units | % Housing Units |
| Owner Occupied Housing Units | 778 | 97.7% |
| Renter-Occupied Housing Units | 18 | 2.3% |
| Total Occupied Housing Units | 796 | 100.0% |
Occupancy by Household Size in Wind Point
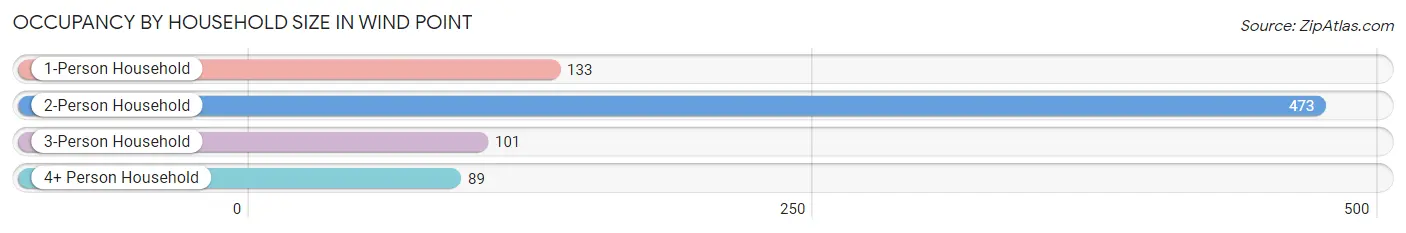
| Household Size | # Housing Units | % Housing Units |
| 1-Person Household | 133 | 16.7% |
| 2-Person Household | 473 | 59.4% |
| 3-Person Household | 101 | 12.7% |
| 4+ Person Household | 89 | 11.2% |
| Total Housing Units | 796 | 100.0% |
Occupancy by Ownership by Household Size in Wind Point
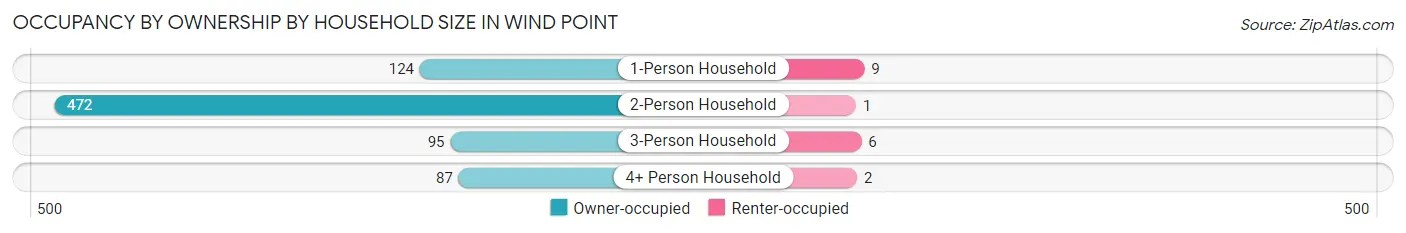
| Household Size | Owner-occupied | Renter-occupied |
| 1-Person Household | 124 (93.2%) | 9 (6.8%) |
| 2-Person Household | 472 (99.8%) | 1 (0.2%) |
| 3-Person Household | 95 (94.1%) | 6 (5.9%) |
| 4+ Person Household | 87 (97.8%) | 2 (2.2%) |
| Total Housing Units | 778 (97.7%) | 18 (2.3%) |
Occupancy by Educational Attainment in Wind Point
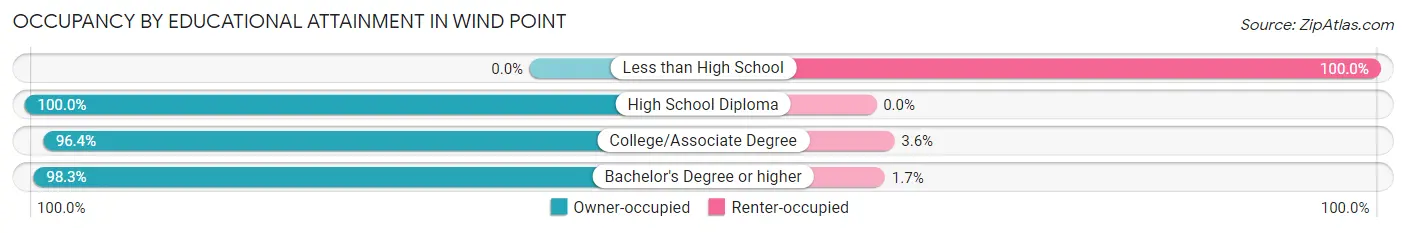
| Household Size | Owner-occupied | Renter-occupied |
| Less than High School | 0 (0.0%) | 2 (100.0%) |
| High School Diploma | 49 (100.0%) | 0 (0.0%) |
| College/Associate Degree | 160 (96.4%) | 6 (3.6%) |
| Bachelor's Degree or higher | 569 (98.3%) | 10 (1.7%) |
Occupancy by Age of Householder in Wind Point
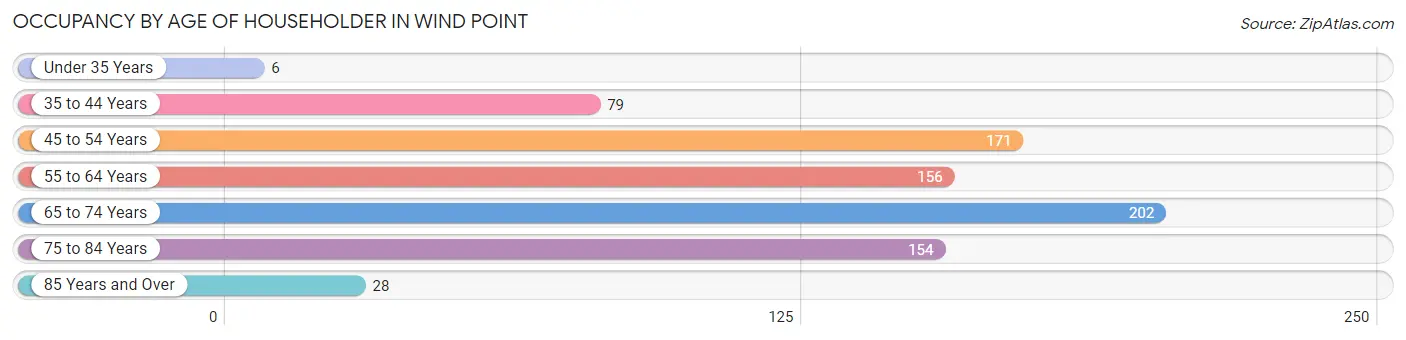
| Age Bracket | # Households | % Households |
| Under 35 Years | 6 | 0.7% |
| 35 to 44 Years | 79 | 9.9% |
| 45 to 54 Years | 171 | 21.5% |
| 55 to 64 Years | 156 | 19.6% |
| 65 to 74 Years | 202 | 25.4% |
| 75 to 84 Years | 154 | 19.4% |
| 85 Years and Over | 28 | 3.5% |
| Total | 796 | 100.0% |
Housing Finances in Wind Point
Median Income by Occupancy in Wind Point
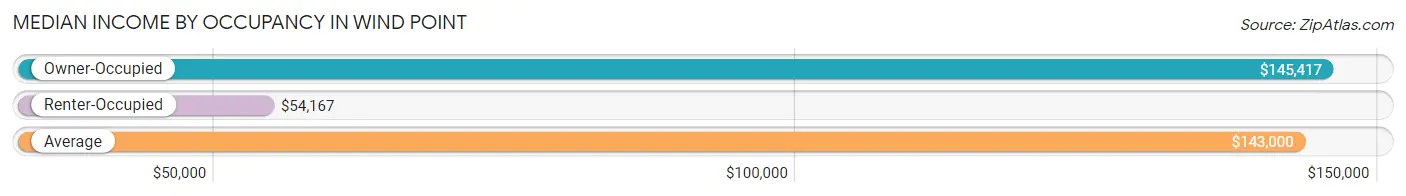
| Occupancy Type | # Households | Median Income |
| Owner-Occupied | 778 (97.7%) | $145,417 |
| Renter-Occupied | 18 (2.3%) | $54,167 |
| Average | 796 (100.0%) | $143,000 |
Occupancy by Householder Income Bracket in Wind Point
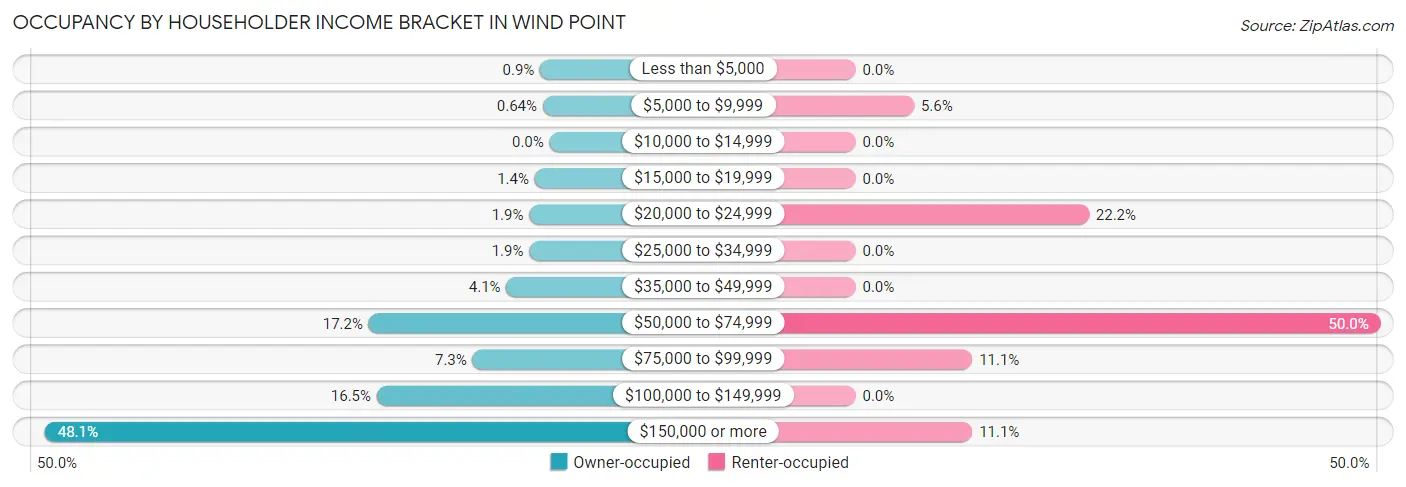
| Income Bracket | Owner-occupied | Renter-occupied |
| Less than $5,000 | 7 (0.9%) | 0 (0.0%) |
| $5,000 to $9,999 | 5 (0.6%) | 1 (5.6%) |
| $10,000 to $14,999 | 0 (0.0%) | 0 (0.0%) |
| $15,000 to $19,999 | 11 (1.4%) | 0 (0.0%) |
| $20,000 to $24,999 | 15 (1.9%) | 4 (22.2%) |
| $25,000 to $34,999 | 15 (1.9%) | 0 (0.0%) |
| $35,000 to $49,999 | 32 (4.1%) | 0 (0.0%) |
| $50,000 to $74,999 | 134 (17.2%) | 9 (50.0%) |
| $75,000 to $99,999 | 57 (7.3%) | 2 (11.1%) |
| $100,000 to $149,999 | 128 (16.5%) | 0 (0.0%) |
| $150,000 or more | 374 (48.1%) | 2 (11.1%) |
| Total | 778 (100.0%) | 18 (100.0%) |
Monthly Housing Cost Tiers in Wind Point
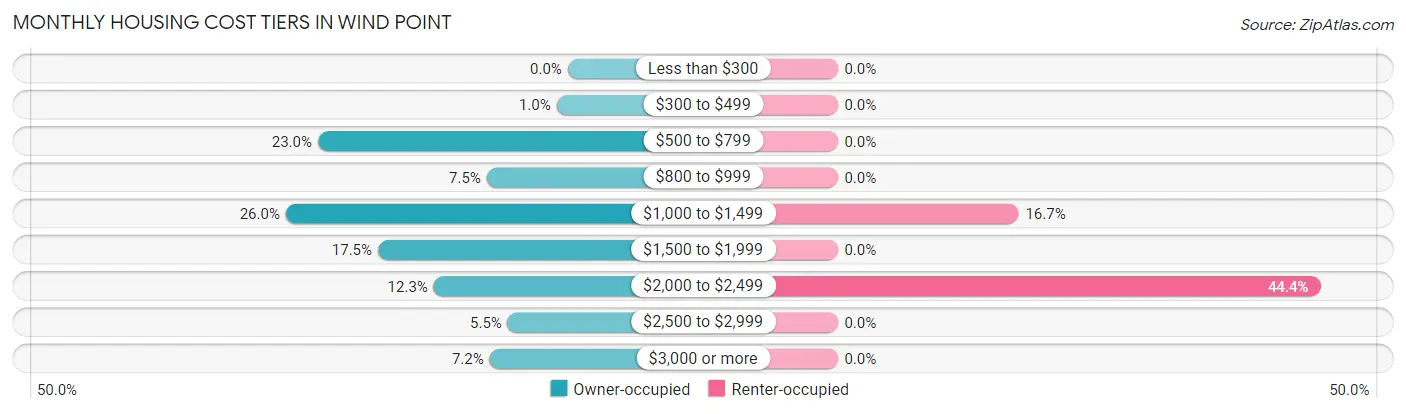
| Monthly Cost | Owner-occupied | Renter-occupied |
| Less than $300 | 0 (0.0%) | 0 (0.0%) |
| $300 to $499 | 8 (1.0%) | 0 (0.0%) |
| $500 to $799 | 179 (23.0%) | 0 (0.0%) |
| $800 to $999 | 58 (7.5%) | 0 (0.0%) |
| $1,000 to $1,499 | 202 (26.0%) | 3 (16.7%) |
| $1,500 to $1,999 | 136 (17.5%) | 0 (0.0%) |
| $2,000 to $2,499 | 96 (12.3%) | 8 (44.4%) |
| $2,500 to $2,999 | 43 (5.5%) | 0 (0.0%) |
| $3,000 or more | 56 (7.2%) | 0 (0.0%) |
| Total | 778 (100.0%) | 18 (100.0%) |
Physical Housing Characteristics in Wind Point
Housing Structures in Wind Point
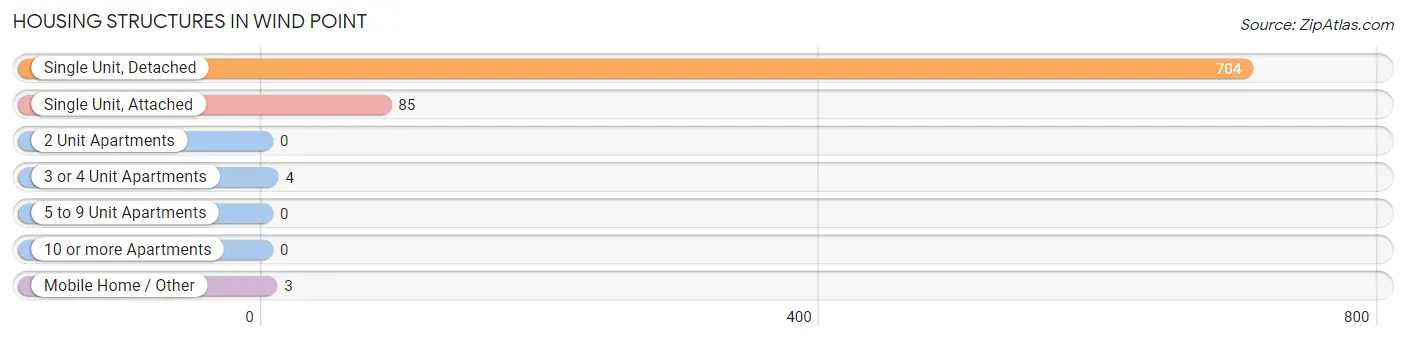
| Structure Type | # Housing Units | % Housing Units |
| Single Unit, Detached | 704 | 88.4% |
| Single Unit, Attached | 85 | 10.7% |
| 2 Unit Apartments | 0 | 0.0% |
| 3 or 4 Unit Apartments | 4 | 0.5% |
| 5 to 9 Unit Apartments | 0 | 0.0% |
| 10 or more Apartments | 0 | 0.0% |
| Mobile Home / Other | 3 | 0.4% |
| Total | 796 | 100.0% |
Housing Structures by Occupancy in Wind Point
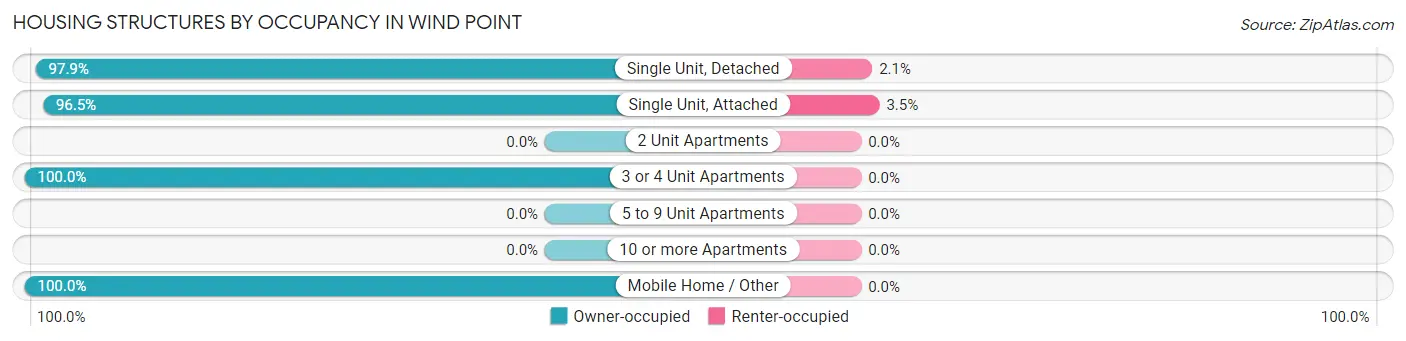
| Structure Type | Owner-occupied | Renter-occupied |
| Single Unit, Detached | 689 (97.9%) | 15 (2.1%) |
| Single Unit, Attached | 82 (96.5%) | 3 (3.5%) |
| 2 Unit Apartments | 0 (0.0%) | 0 (0.0%) |
| 3 or 4 Unit Apartments | 4 (100.0%) | 0 (0.0%) |
| 5 to 9 Unit Apartments | 0 (0.0%) | 0 (0.0%) |
| 10 or more Apartments | 0 (0.0%) | 0 (0.0%) |
| Mobile Home / Other | 3 (100.0%) | 0 (0.0%) |
| Total | 778 (97.7%) | 18 (2.3%) |
Housing Structures by Number of Rooms in Wind Point
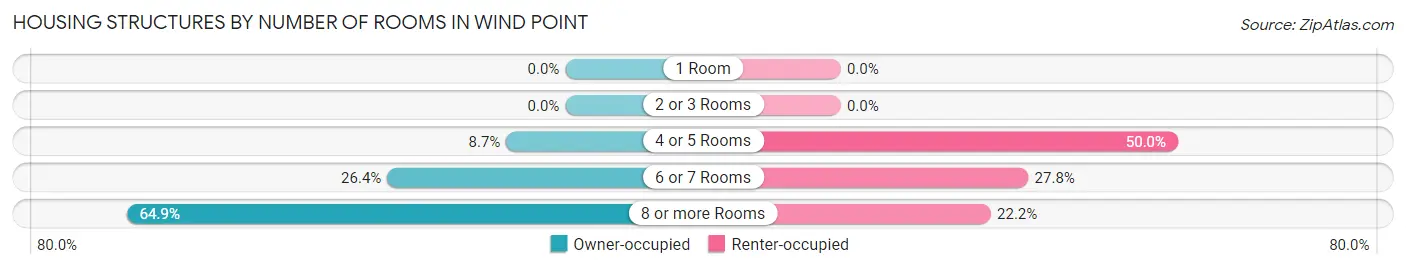
| Number of Rooms | Owner-occupied | Renter-occupied |
| 1 Room | 0 (0.0%) | 0 (0.0%) |
| 2 or 3 Rooms | 0 (0.0%) | 0 (0.0%) |
| 4 or 5 Rooms | 68 (8.7%) | 9 (50.0%) |
| 6 or 7 Rooms | 205 (26.4%) | 5 (27.8%) |
| 8 or more Rooms | 505 (64.9%) | 4 (22.2%) |
| Total | 778 (100.0%) | 18 (100.0%) |
Housing Structure by Heating Type in Wind Point
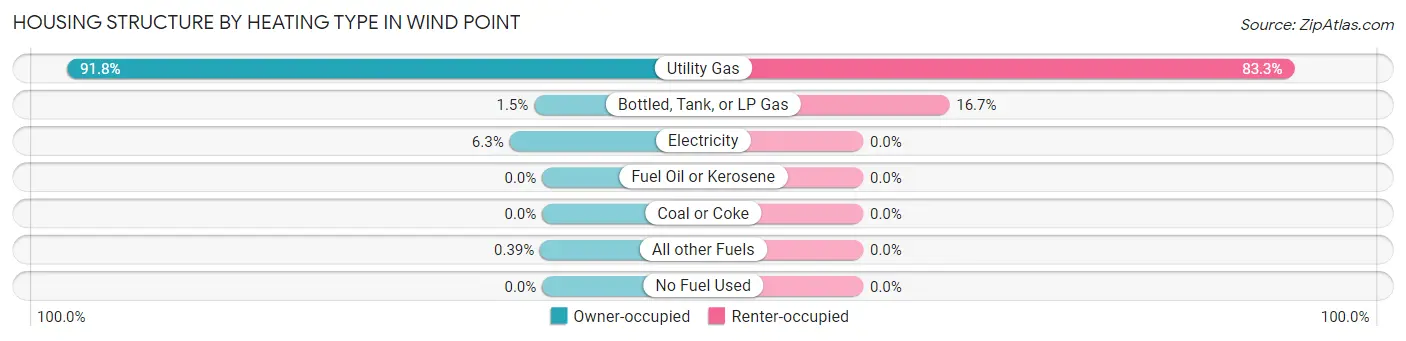
| Heating Type | Owner-occupied | Renter-occupied |
| Utility Gas | 714 (91.8%) | 15 (83.3%) |
| Bottled, Tank, or LP Gas | 12 (1.5%) | 3 (16.7%) |
| Electricity | 49 (6.3%) | 0 (0.0%) |
| Fuel Oil or Kerosene | 0 (0.0%) | 0 (0.0%) |
| Coal or Coke | 0 (0.0%) | 0 (0.0%) |
| All other Fuels | 3 (0.4%) | 0 (0.0%) |
| No Fuel Used | 0 (0.0%) | 0 (0.0%) |
| Total | 778 (100.0%) | 18 (100.0%) |
Household Vehicle Usage in Wind Point
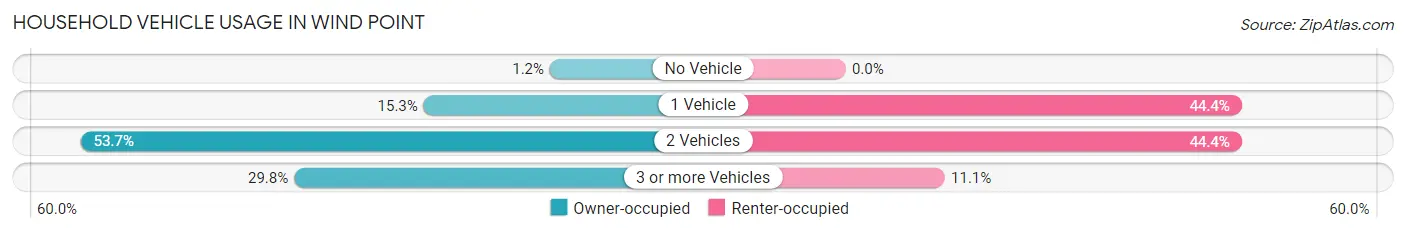
| Vehicles per Household | Owner-occupied | Renter-occupied |
| No Vehicle | 9 (1.2%) | 0 (0.0%) |
| 1 Vehicle | 119 (15.3%) | 8 (44.4%) |
| 2 Vehicles | 418 (53.7%) | 8 (44.4%) |
| 3 or more Vehicles | 232 (29.8%) | 2 (11.1%) |
| Total | 778 (100.0%) | 18 (100.0%) |
Real Estate & Mortgages in Wind Point
Real Estate and Mortgage Overview in Wind Point
| Characteristic | Without Mortgage | With Mortgage |
| Housing Units | 329 | 449 |
| Median Property Value | $242,800 | $291,800 |
| Median Household Income | $102,917 | $251 |
| Monthly Housing Costs | $693 | $51 |
| Real Estate Taxes | $3,825 | $3 |
Property Value by Mortgage Status in Wind Point
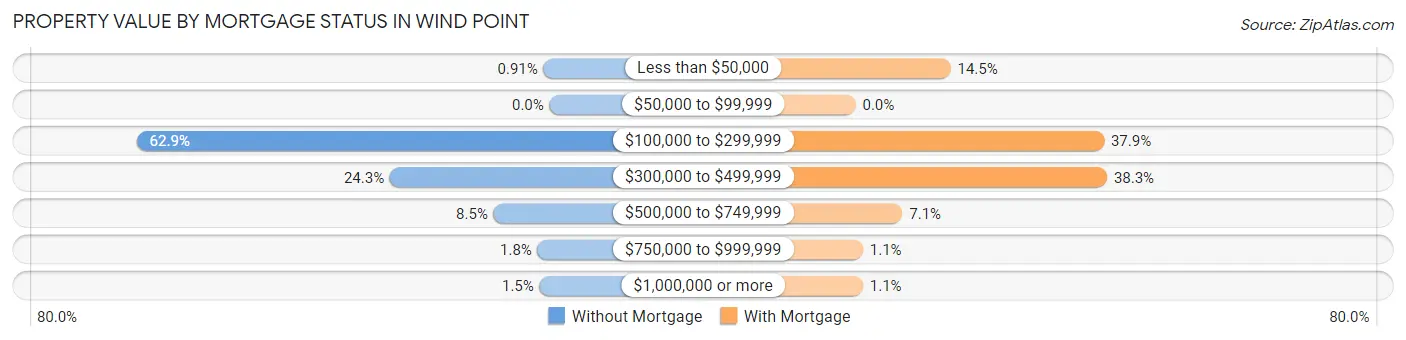
| Property Value | Without Mortgage | With Mortgage |
| Less than $50,000 | 3 (0.9%) | 65 (14.5%) |
| $50,000 to $99,999 | 0 (0.0%) | 0 (0.0%) |
| $100,000 to $299,999 | 207 (62.9%) | 170 (37.9%) |
| $300,000 to $499,999 | 80 (24.3%) | 172 (38.3%) |
| $500,000 to $749,999 | 28 (8.5%) | 32 (7.1%) |
| $750,000 to $999,999 | 6 (1.8%) | 5 (1.1%) |
| $1,000,000 or more | 5 (1.5%) | 5 (1.1%) |
| Total | 329 (100.0%) | 449 (100.0%) |
Household Income by Mortgage Status in Wind Point
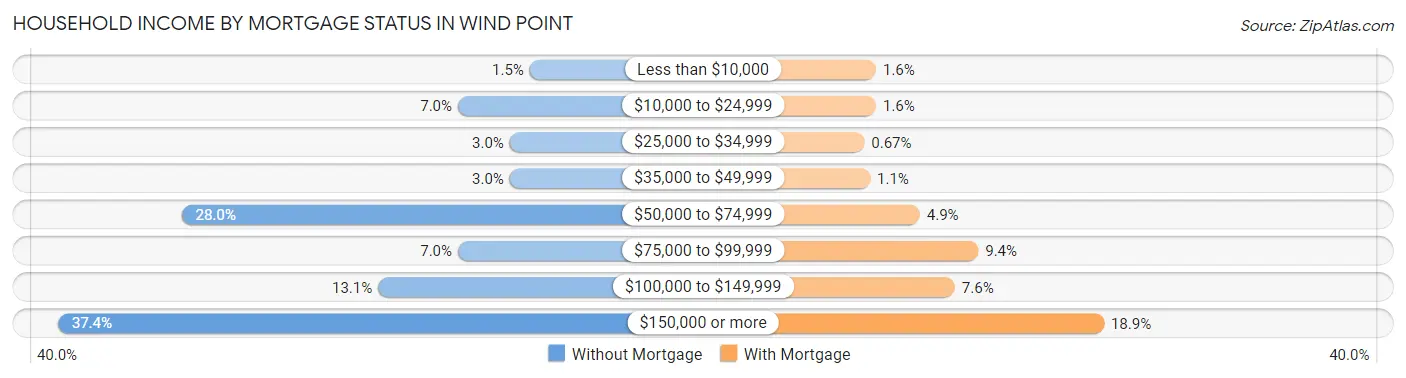
| Household Income | Without Mortgage | With Mortgage |
| Less than $10,000 | 5 (1.5%) | 7 (1.6%) |
| $10,000 to $24,999 | 23 (7.0%) | 7 (1.6%) |
| $25,000 to $34,999 | 10 (3.0%) | 3 (0.7%) |
| $35,000 to $49,999 | 10 (3.0%) | 5 (1.1%) |
| $50,000 to $74,999 | 92 (28.0%) | 22 (4.9%) |
| $75,000 to $99,999 | 23 (7.0%) | 42 (9.3%) |
| $100,000 to $149,999 | 43 (13.1%) | 34 (7.6%) |
| $150,000 or more | 123 (37.4%) | 85 (18.9%) |
| Total | 329 (100.0%) | 449 (100.0%) |
Property Value to Household Income Ratio in Wind Point
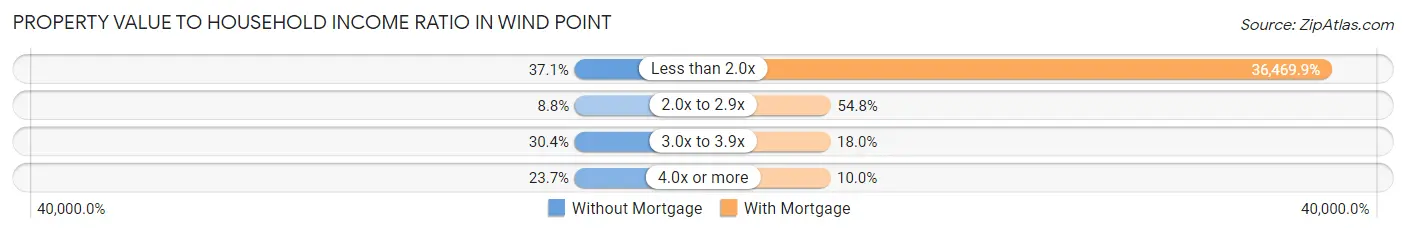
| Value-to-Income Ratio | Without Mortgage | With Mortgage |
| Less than 2.0x | 122 (37.1%) | 163,750 (36,469.9%) |
| 2.0x to 2.9x | 29 (8.8%) | 246 (54.8%) |
| 3.0x to 3.9x | 100 (30.4%) | 81 (18.0%) |
| 4.0x or more | 78 (23.7%) | 45 (10.0%) |
| Total | 329 (100.0%) | 449 (100.0%) |
Real Estate Taxes by Mortgage Status in Wind Point
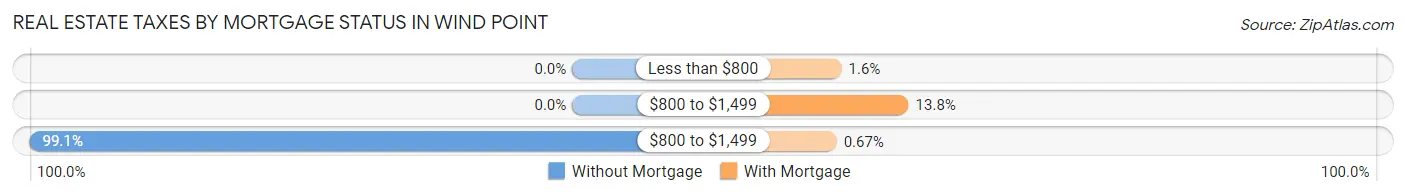
| Property Taxes | Without Mortgage | With Mortgage |
| Less than $800 | 0 (0.0%) | 7 (1.6%) |
| $800 to $1,499 | 0 (0.0%) | 62 (13.8%) |
| $800 to $1,499 | 326 (99.1%) | 3 (0.7%) |
| Total | 329 (100.0%) | 449 (100.0%) |
Health & Disability in Wind Point
Health Insurance Coverage by Age in Wind Point
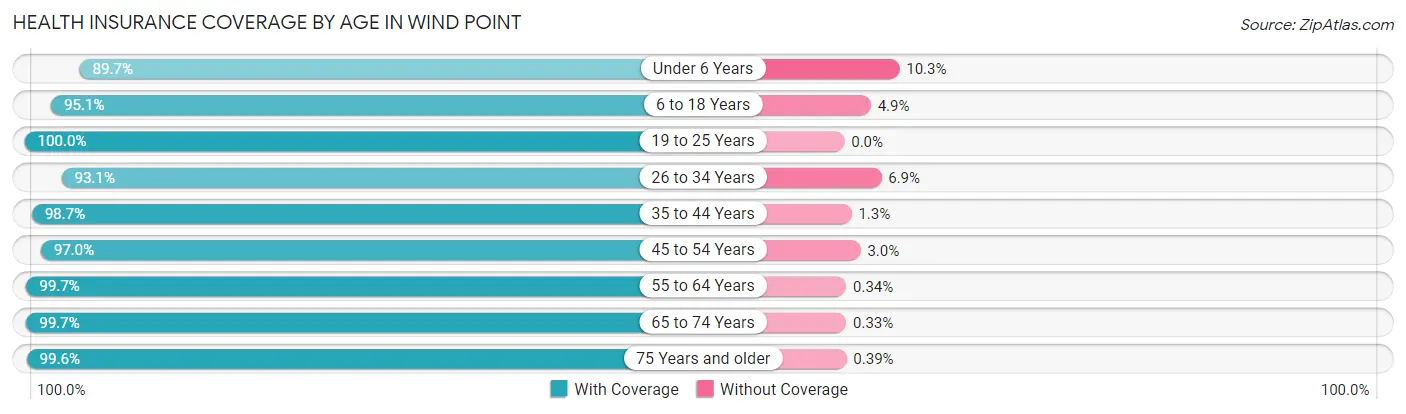
| Age Bracket | With Coverage | Without Coverage |
| Under 6 Years | 35 (89.7%) | 4 (10.3%) |
| 6 to 18 Years | 212 (95.1%) | 11 (4.9%) |
| 19 to 25 Years | 38 (100.0%) | 0 (0.0%) |
| 26 to 34 Years | 54 (93.1%) | 4 (6.9%) |
| 35 to 44 Years | 147 (98.7%) | 2 (1.3%) |
| 45 to 54 Years | 321 (97.0%) | 10 (3.0%) |
| 55 to 64 Years | 289 (99.7%) | 1 (0.3%) |
| 65 to 74 Years | 303 (99.7%) | 1 (0.3%) |
| 75 Years and older | 255 (99.6%) | 1 (0.4%) |
| Total | 1,654 (98.0%) | 34 (2.0%) |
Health Insurance Coverage by Citizenship Status in Wind Point
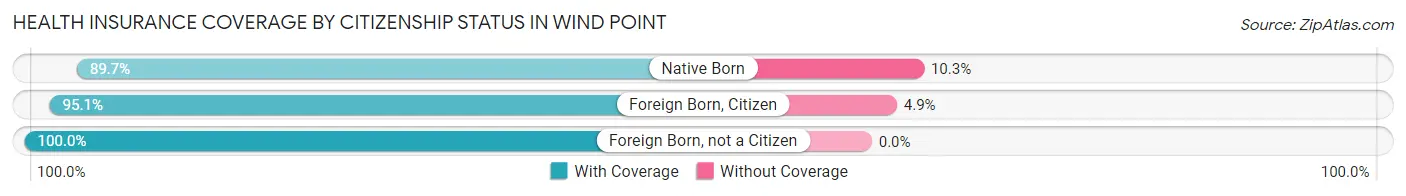
| Citizenship Status | With Coverage | Without Coverage |
| Native Born | 35 (89.7%) | 4 (10.3%) |
| Foreign Born, Citizen | 212 (95.1%) | 11 (4.9%) |
| Foreign Born, not a Citizen | 38 (100.0%) | 0 (0.0%) |
Health Insurance Coverage by Household Income in Wind Point
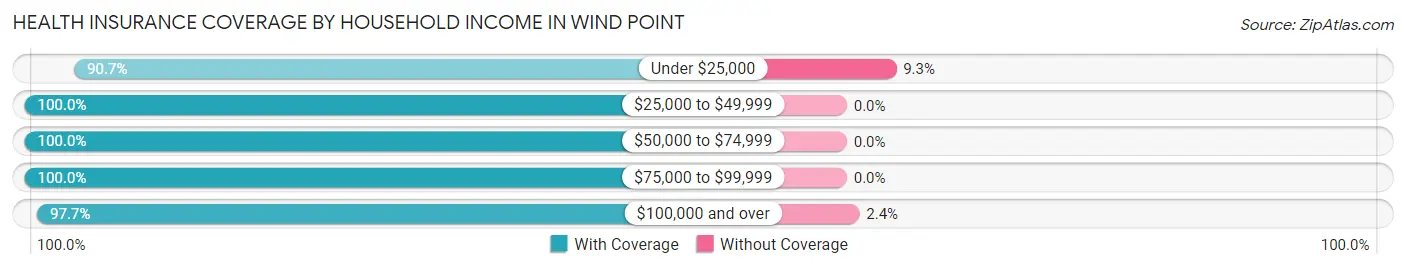
| Household Income | With Coverage | Without Coverage |
| Under $25,000 | 49 (90.7%) | 5 (9.3%) |
| $25,000 to $49,999 | 88 (100.0%) | 0 (0.0%) |
| $50,000 to $74,999 | 203 (100.0%) | 0 (0.0%) |
| $75,000 to $99,999 | 107 (100.0%) | 0 (0.0%) |
| $100,000 and over | 1,207 (97.7%) | 29 (2.4%) |
Public vs Private Health Insurance Coverage by Age in Wind Point
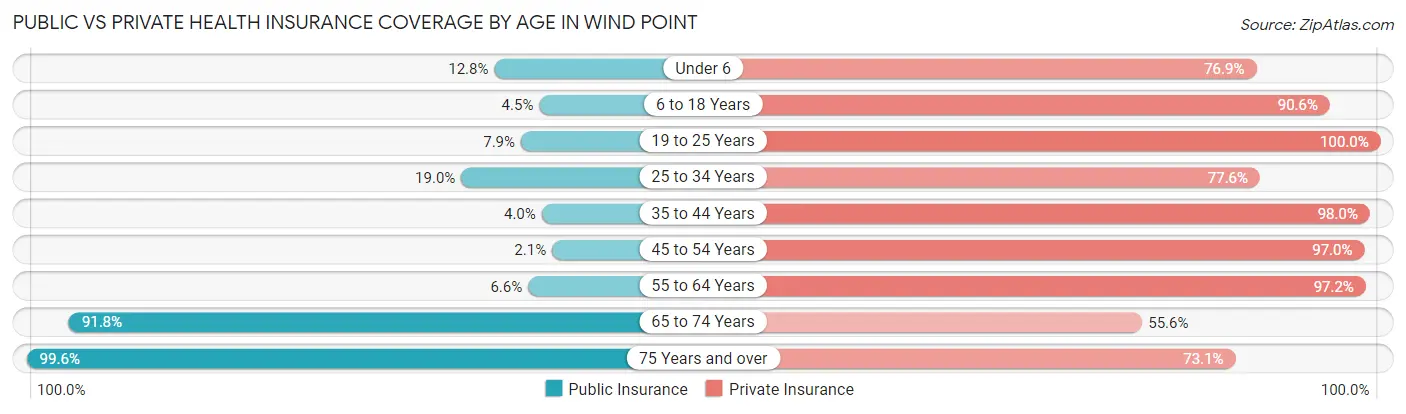
| Age Bracket | Public Insurance | Private Insurance |
| Under 6 | 5 (12.8%) | 30 (76.9%) |
| 6 to 18 Years | 10 (4.5%) | 202 (90.6%) |
| 19 to 25 Years | 3 (7.9%) | 38 (100.0%) |
| 25 to 34 Years | 11 (19.0%) | 45 (77.6%) |
| 35 to 44 Years | 6 (4.0%) | 146 (98.0%) |
| 45 to 54 Years | 7 (2.1%) | 321 (97.0%) |
| 55 to 64 Years | 19 (6.6%) | 282 (97.2%) |
| 65 to 74 Years | 279 (91.8%) | 169 (55.6%) |
| 75 Years and over | 255 (99.6%) | 187 (73.1%) |
| Total | 595 (35.2%) | 1,420 (84.1%) |
Disability Status by Sex by Age in Wind Point
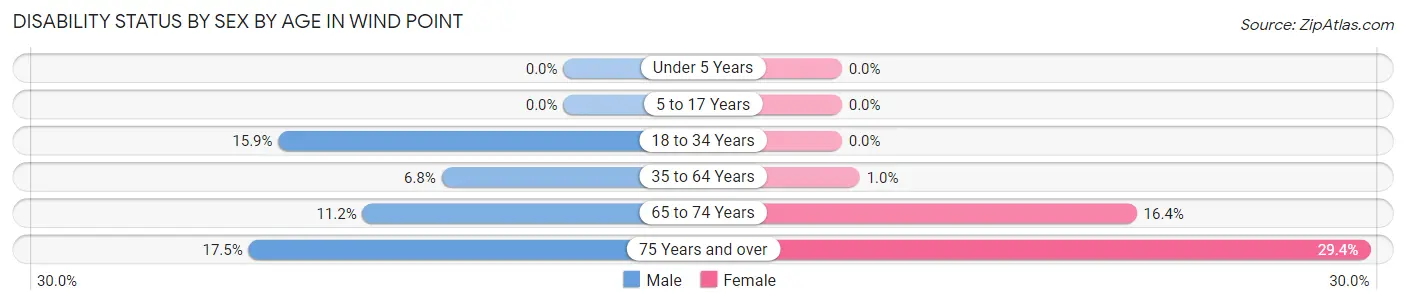
| Age Bracket | Male | Female |
| Under 5 Years | 0 (0.0%) | 0 (0.0%) |
| 5 to 17 Years | 0 (0.0%) | 0 (0.0%) |
| 18 to 34 Years | 10 (15.9%) | 0 (0.0%) |
| 35 to 64 Years | 25 (6.8%) | 4 (1.0%) |
| 65 to 74 Years | 19 (11.2%) | 22 (16.4%) |
| 75 Years and over | 27 (17.5%) | 30 (29.4%) |
Disability Class by Sex by Age in Wind Point
Disability Class: Hearing Difficulty
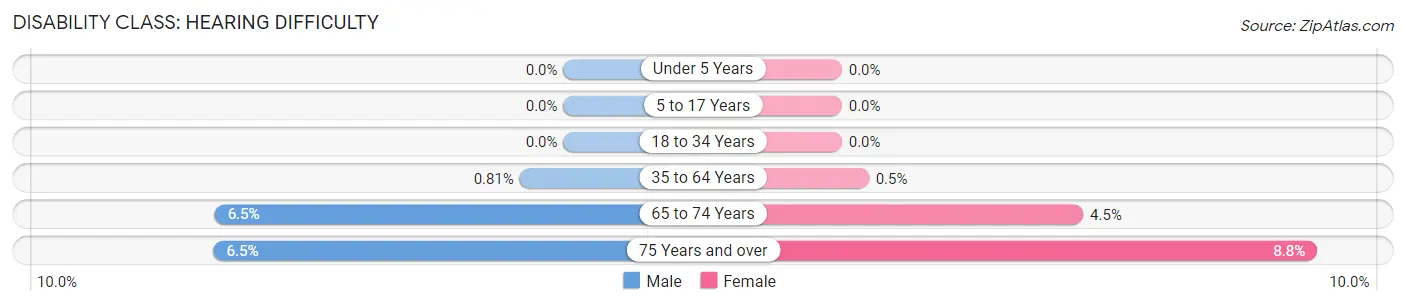
| Age Bracket | Male | Female |
| Under 5 Years | 0 (0.0%) | 0 (0.0%) |
| 5 to 17 Years | 0 (0.0%) | 0 (0.0%) |
| 18 to 34 Years | 0 (0.0%) | 0 (0.0%) |
| 35 to 64 Years | 3 (0.8%) | 2 (0.5%) |
| 65 to 74 Years | 11 (6.5%) | 6 (4.5%) |
| 75 Years and over | 10 (6.5%) | 9 (8.8%) |
Disability Class: Vision Difficulty
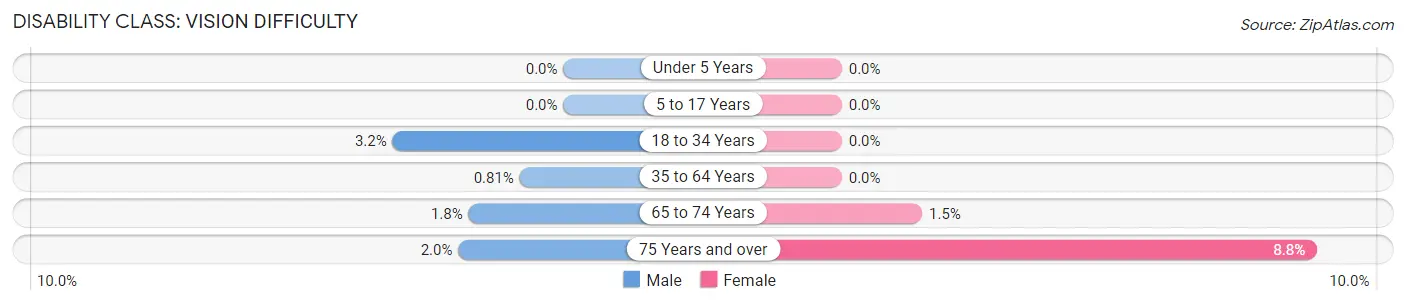
| Age Bracket | Male | Female |
| Under 5 Years | 0 (0.0%) | 0 (0.0%) |
| 5 to 17 Years | 0 (0.0%) | 0 (0.0%) |
| 18 to 34 Years | 2 (3.2%) | 0 (0.0%) |
| 35 to 64 Years | 3 (0.8%) | 0 (0.0%) |
| 65 to 74 Years | 3 (1.8%) | 2 (1.5%) |
| 75 Years and over | 3 (1.9%) | 9 (8.8%) |
Disability Class: Cognitive Difficulty
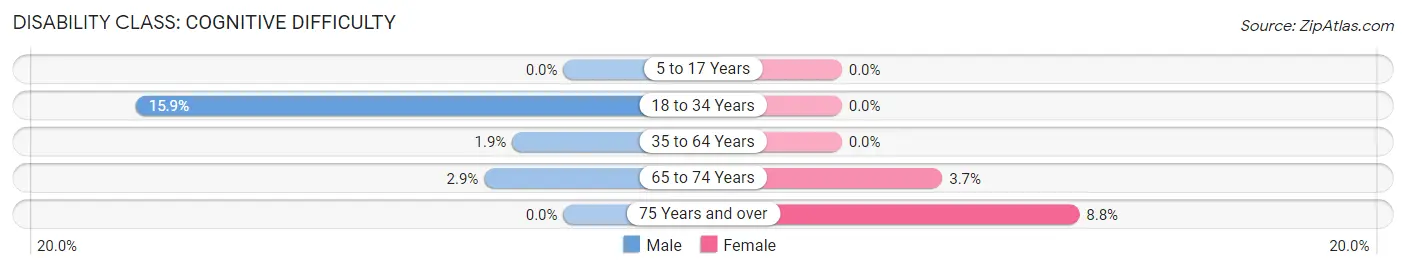
| Age Bracket | Male | Female |
| 5 to 17 Years | 0 (0.0%) | 0 (0.0%) |
| 18 to 34 Years | 10 (15.9%) | 0 (0.0%) |
| 35 to 64 Years | 7 (1.9%) | 0 (0.0%) |
| 65 to 74 Years | 5 (2.9%) | 5 (3.7%) |
| 75 Years and over | 0 (0.0%) | 9 (8.8%) |
Disability Class: Ambulatory Difficulty
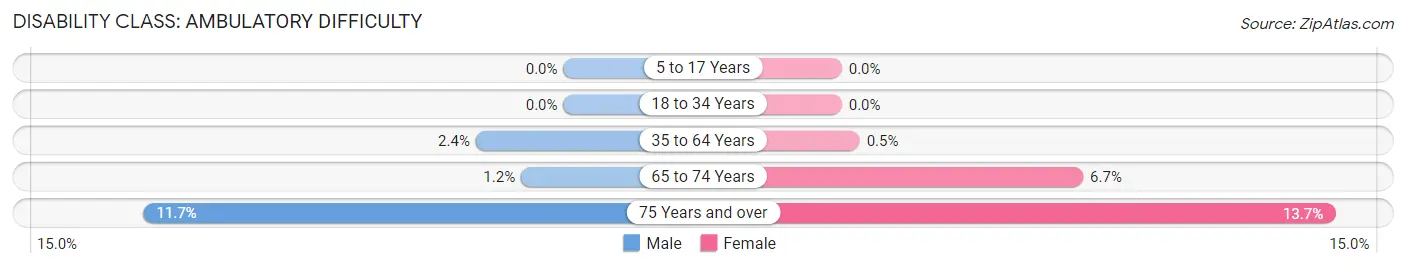
| Age Bracket | Male | Female |
| 5 to 17 Years | 0 (0.0%) | 0 (0.0%) |
| 18 to 34 Years | 0 (0.0%) | 0 (0.0%) |
| 35 to 64 Years | 9 (2.4%) | 2 (0.5%) |
| 65 to 74 Years | 2 (1.2%) | 9 (6.7%) |
| 75 Years and over | 18 (11.7%) | 14 (13.7%) |
Disability Class: Self-Care Difficulty
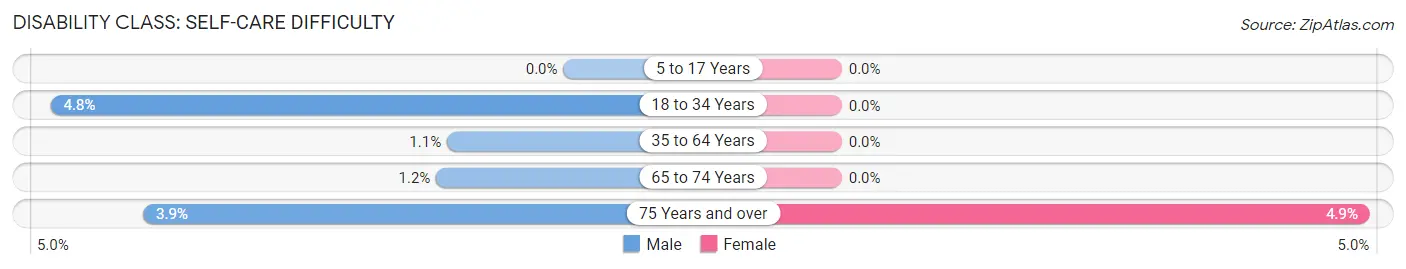
| Age Bracket | Male | Female |
| 5 to 17 Years | 0 (0.0%) | 0 (0.0%) |
| 18 to 34 Years | 3 (4.8%) | 0 (0.0%) |
| 35 to 64 Years | 4 (1.1%) | 0 (0.0%) |
| 65 to 74 Years | 2 (1.2%) | 0 (0.0%) |
| 75 Years and over | 6 (3.9%) | 5 (4.9%) |
Technology Access in Wind Point
Computing Device Access in Wind Point
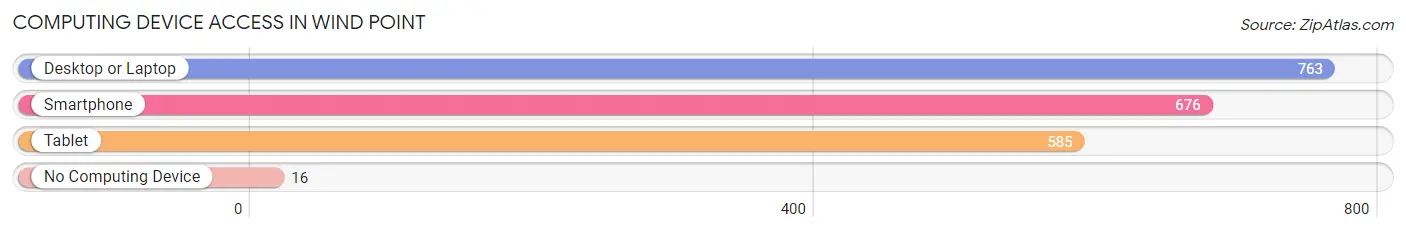
| Device Type | # Households | % Households |
| Desktop or Laptop | 763 | 95.9% |
| Smartphone | 676 | 84.9% |
| Tablet | 585 | 73.5% |
| No Computing Device | 16 | 2.0% |
| Total | 796 | 100.0% |
Internet Access in Wind Point
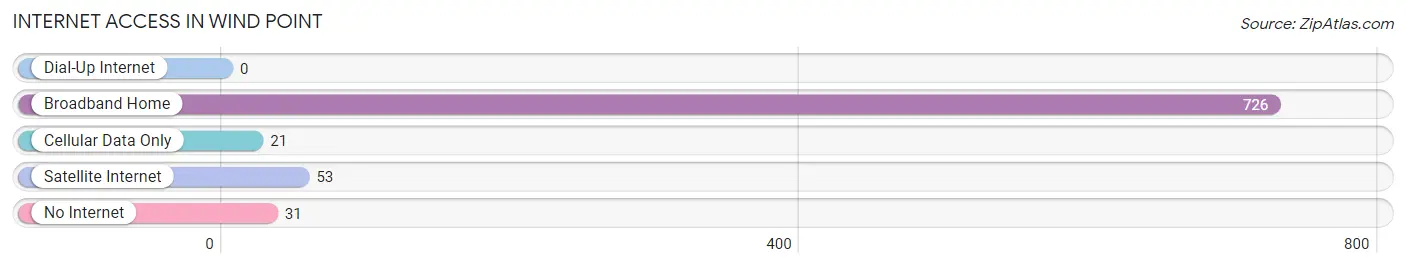
| Internet Type | # Households | % Households |
| Dial-Up Internet | 0 | 0.0% |
| Broadband Home | 726 | 91.2% |
| Cellular Data Only | 21 | 2.6% |
| Satellite Internet | 53 | 6.7% |
| No Internet | 31 | 3.9% |
| Total | 796 | 100.0% |
Wind Point Summary
Wind Point, Wisconsin is a small village located in Racine County, Wisconsin. It is situated on the shores of Lake Michigan, just north of the city of Racine. The village has a population of approximately 1,500 people and is part of the Racine Metropolitan Statistical Area.
History
The area that is now Wind Point was first settled in the early 1800s by a group of French-Canadian fur traders. The village was originally known as “Pointe du Vent”, which translates to “Wind Point” in English. The village was officially incorporated in 1891.
In the late 1800s, the village was a popular summer destination for wealthy Chicagoans. The village was home to several large resorts, including the Wind Point Hotel, which was built in 1891. The hotel was destroyed by a fire in the early 1900s, but the village continued to attract visitors from Chicago and other nearby cities.
In the early 1900s, the village began to attract more permanent residents. Many of these residents were employed in the nearby city of Racine, which was home to several large manufacturing companies. The village also became home to a number of small businesses, including a grocery store, a hardware store, and a post office.
Geography
Wind Point is located in southeastern Wisconsin, on the shores of Lake Michigan. The village is situated on a peninsula that juts out into the lake. The village is bordered by the city of Racine to the south and the village of Mount Pleasant to the north.
The village is located in a region of Wisconsin known as the Kettle Moraine. The Kettle Moraine is a region of rolling hills and glacial lakes. The area is known for its scenic beauty and is home to several state parks and nature preserves.
Economy
The economy of Wind Point is largely based on tourism and small businesses. The village is home to several small businesses, including restaurants, shops, and a marina. The village also attracts visitors from nearby cities, who come to enjoy the scenic beauty of the area.
The village is also home to several large employers, including the Racine Unified School District and the Racine County government. The village is also home to a number of small manufacturing companies, which produce a variety of products, including furniture, automotive parts, and medical supplies.
Demographics
As of the 2010 census, the population of Wind Point was 1,500. The racial makeup of the village was 94.2% White, 1.3% African American, 0.7% Native American, 0.7% Asian, 0.7% from other races, and 2.3% from two or more races. Hispanic or Latino of any race were 2.3% of the population.
The median household income in Wind Point was $50,000, and the median family income was $60,000. The per capita income for the village was $25,000. About 8.3% of families and 10.3% of the population were below the poverty line, including 14.3% of those under age 18 and 5.3% of those age 65 or over.
Wind Point is a small village with a rich history and a vibrant economy. The village is home to a diverse population and is a popular destination for tourists and residents alike. The village is a great place to live, work, and play, and is sure to remain a popular destination for years to come.
Common Questions
What is Per Capita Income in Wind Point?
Per Capita income in Wind Point is $87,232.
What is the Median Family Income in Wind Point?
Median Family Income in Wind Point is $162,222.
What is the Median Household income in Wind Point?
Median Household Income in Wind Point is $143,000.
What is Income or Wage Gap in Wind Point?
Income or Wage Gap in Wind Point is 49.9%.
Women in Wind Point earn 50.1 cents for every dollar earned by a man.
What is Inequality or Gini Index in Wind Point?
Inequality or Gini Index in Wind Point is 0.44.
What is the Total Population of Wind Point?
Total Population of Wind Point is 1,688.
What is the Total Male Population of Wind Point?
Total Male Population of Wind Point is 888.
What is the Total Female Population of Wind Point?
Total Female Population of Wind Point is 800.
What is the Ratio of Males per 100 Females in Wind Point?
There are 111.00 Males per 100 Females in Wind Point.
What is the Ratio of Females per 100 Males in Wind Point?
There are 90.09 Females per 100 Males in Wind Point.
What is the Median Population Age in Wind Point?
Median Population Age in Wind Point is 55.3 Years.
What is the Average Family Size in Wind Point
Average Family Size in Wind Point is 2.3 People.
What is the Average Household Size in Wind Point
Average Household Size in Wind Point is 2.1 People.
How Large is the Labor Force in Wind Point?
There are 842 People in the Labor Forcein in Wind Point.
What is the Percentage of People in the Labor Force in Wind Point?
56.8% of People are in the Labor Force in Wind Point.
What is the Unemployment Rate in Wind Point?
Unemployment Rate in Wind Point is 1.8%.