Prescott, WI Map & Demographics
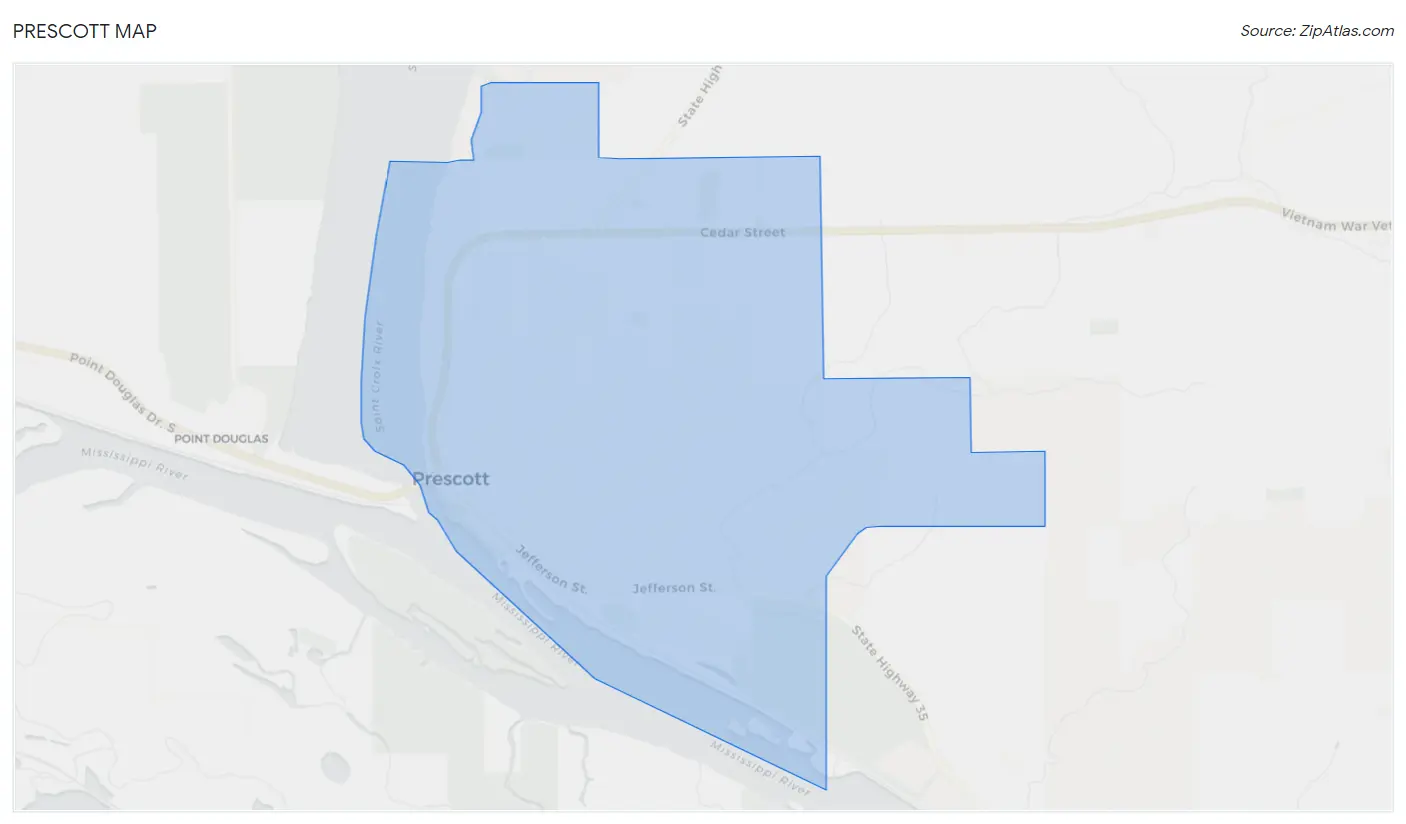
Prescott Map
Prescott Overview
$37,208
PER CAPITA INCOME
$74,864
AVG FAMILY INCOME
$74,195
AVG HOUSEHOLD INCOME
25.5%
WAGE / INCOME GAP [ % ]
74.5¢/ $1
WAGE / INCOME GAP [ $ ]
0.34
INEQUALITY / GINI INDEX
4,343
TOTAL POPULATION
2,228
MALE POPULATION
2,115
FEMALE POPULATION
105.34
MALES / 100 FEMALES
94.93
FEMALES / 100 MALES
36.1
MEDIAN AGE
2.7
AVG FAMILY SIZE
2.2
AVG HOUSEHOLD SIZE
2,412
LABOR FORCE [ PEOPLE ]
69.2%
PERCENT IN LABOR FORCE
1.5%
UNEMPLOYMENT RATE
Prescott Zip Codes
Prescott Area Codes
Income in Prescott
Income Overview in Prescott
Per Capita Income in Prescott is $37,208, while median incomes of families and households are $74,864 and $74,195 respectively.
| Characteristic | Number | Measure |
| Per Capita Income | 4,343 | $37,208 |
| Median Family Income | 1,191 | $74,864 |
| Mean Family Income | 1,191 | $90,099 |
| Median Household Income | 1,910 | $74,195 |
| Mean Household Income | 1,910 | $85,581 |
| Income Deficit | 1,191 | $0 |
| Wage / Income Gap (%) | 4,343 | 25.51% |
| Wage / Income Gap ($) | 4,343 | 74.49¢ per $1 |
| Gini / Inequality Index | 4,343 | 0.34 |
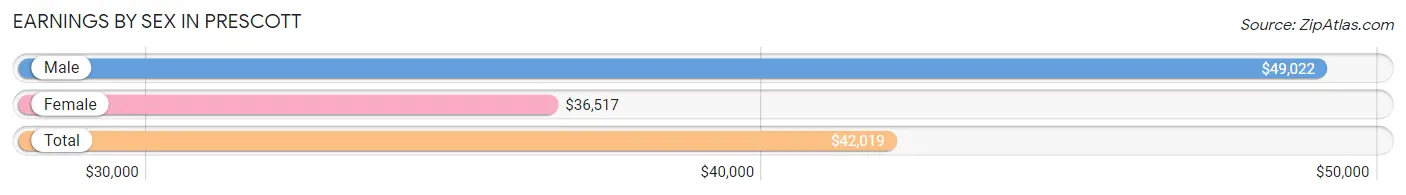
Earnings by Sex in Prescott
Average Earnings in Prescott are $42,019, $49,022 for men and $36,517 for women, a difference of 25.5%.
| Sex | Number | Average Earnings |
| Male | 1,298 (50.2%) | $49,022 |
| Female | 1,286 (49.8%) | $36,517 |
| Total | 2,584 (100.0%) | $42,019 |
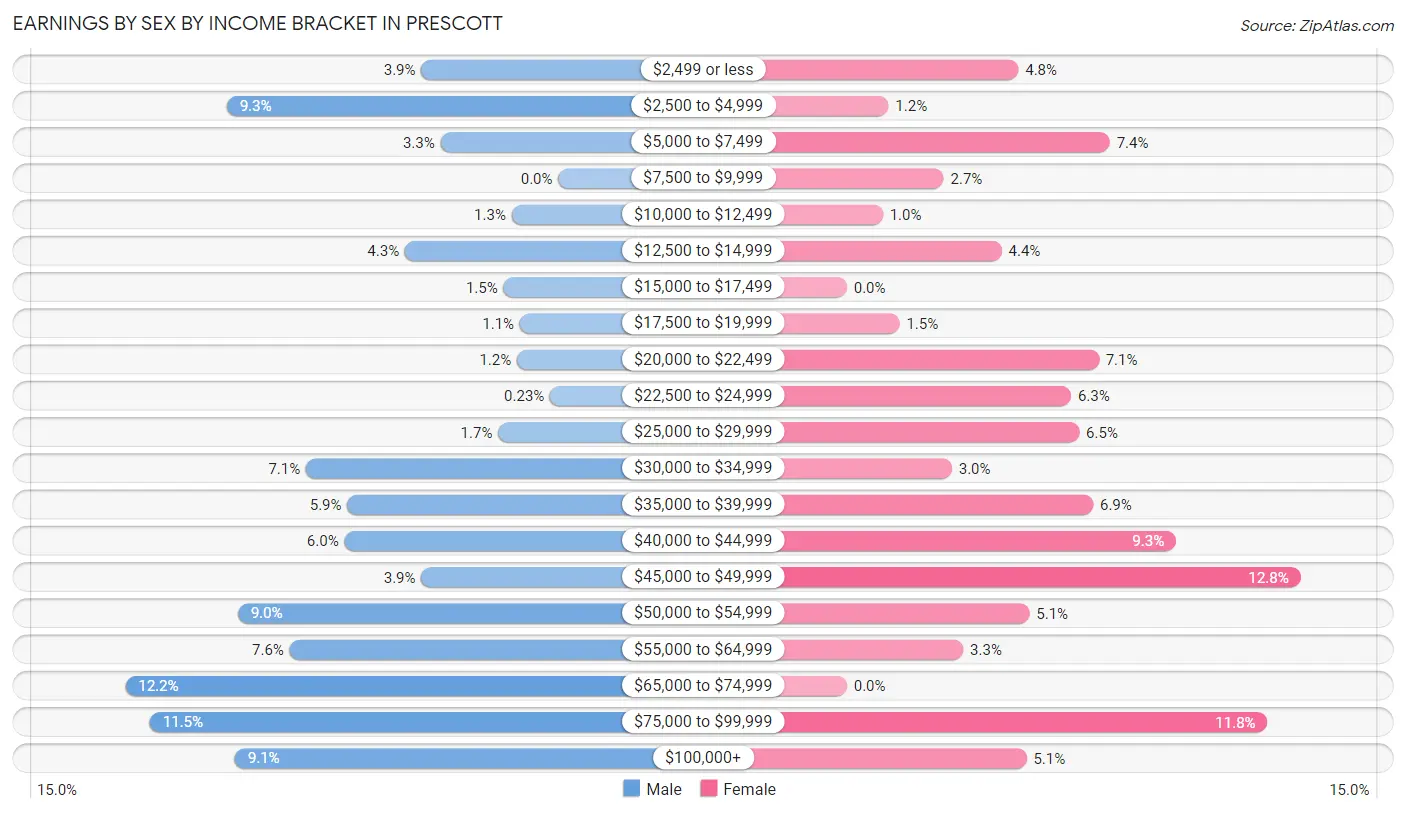
Earnings by Sex by Income Bracket in Prescott
The most common earnings brackets in Prescott are $65,000 to $74,999 for men (158 | 12.2%) and $45,000 to $49,999 for women (164 | 12.8%).
| Income | Male | Female |
| $2,499 or less | 50 (3.8%) | 62 (4.8%) |
| $2,500 to $4,999 | 121 (9.3%) | 15 (1.2%) |
| $5,000 to $7,499 | 43 (3.3%) | 95 (7.4%) |
| $7,500 to $9,999 | 0 (0.0%) | 35 (2.7%) |
| $10,000 to $12,499 | 17 (1.3%) | 13 (1.0%) |
| $12,500 to $14,999 | 56 (4.3%) | 56 (4.3%) |
| $15,000 to $17,499 | 20 (1.5%) | 0 (0.0%) |
| $17,500 to $19,999 | 14 (1.1%) | 19 (1.5%) |
| $20,000 to $22,499 | 15 (1.2%) | 91 (7.1%) |
| $22,500 to $24,999 | 3 (0.2%) | 81 (6.3%) |
| $25,000 to $29,999 | 22 (1.7%) | 84 (6.5%) |
| $30,000 to $34,999 | 92 (7.1%) | 38 (2.9%) |
| $35,000 to $39,999 | 77 (5.9%) | 89 (6.9%) |
| $40,000 to $44,999 | 78 (6.0%) | 119 (9.2%) |
| $45,000 to $49,999 | 50 (3.8%) | 164 (12.8%) |
| $50,000 to $54,999 | 117 (9.0%) | 66 (5.1%) |
| $55,000 to $64,999 | 98 (7.5%) | 42 (3.3%) |
| $65,000 to $74,999 | 158 (12.2%) | 0 (0.0%) |
| $75,000 to $99,999 | 149 (11.5%) | 152 (11.8%) |
| $100,000+ | 118 (9.1%) | 65 (5.1%) |
| Total | 1,298 (100.0%) | 1,286 (100.0%) |
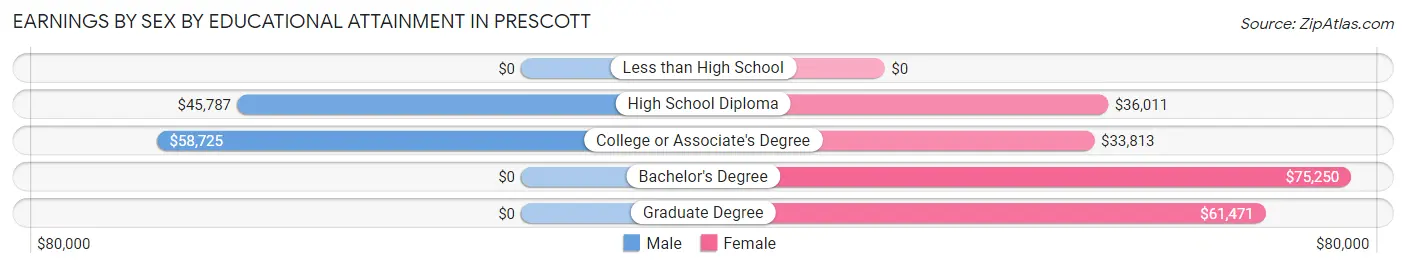
Earnings by Sex by Educational Attainment in Prescott
Average earnings in Prescott are $52,847 for men and $41,058 for women, a difference of 22.3%. Men with an educational attainment of college or associate's degree enjoy the highest average annual earnings of $58,725, while those with high school diploma education earn the least with $45,787. Women with an educational attainment of bachelor's degree earn the most with the average annual earnings of $75,250, while those with college or associate's degree education have the smallest earnings of $33,813.
| Educational Attainment | Male Income | Female Income |
| Less than High School | - | - |
| High School Diploma | $45,787 | $36,011 |
| College or Associate's Degree | $58,725 | $33,813 |
| Bachelor's Degree | - | - |
| Graduate Degree | - | - |
| Total | $52,847 | $41,058 |
Family Income in Prescott
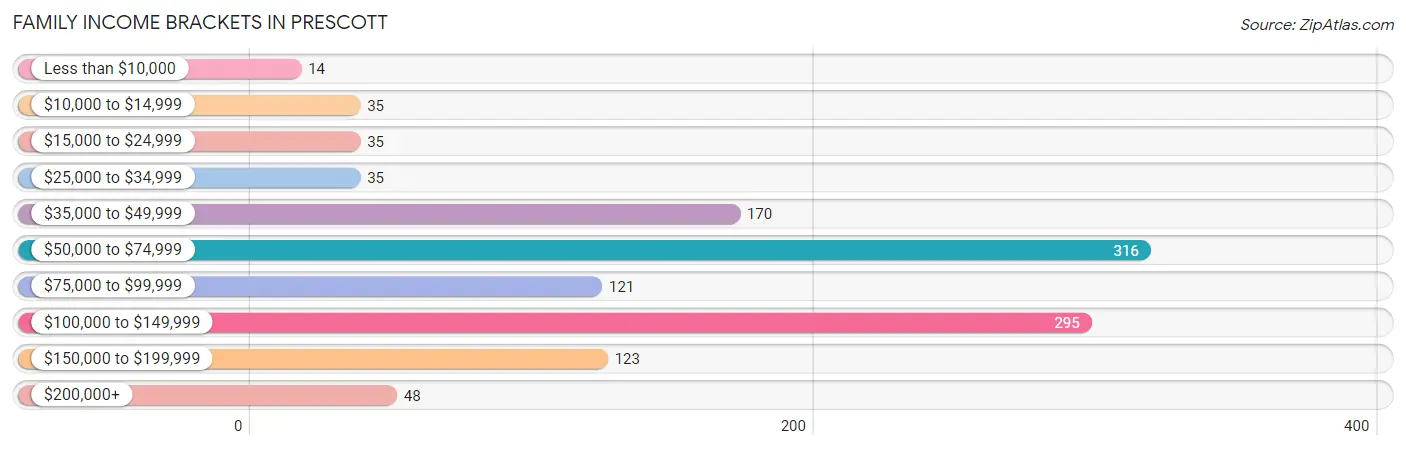
Family Income Brackets in Prescott
According to the Prescott family income data, there are 316 families falling into the $50,000 to $74,999 income range, which is the most common income bracket and makes up 26.5% of all families. Conversely, the less than $10,000 income bracket is the least frequent group with only 14 families (1.2%) belonging to this category.
| Income Bracket | # Families | % Families |
| Less than $10,000 | 14 | 1.2% |
| $10,000 to $14,999 | 35 | 2.9% |
| $15,000 to $24,999 | 35 | 2.9% |
| $25,000 to $34,999 | 35 | 2.9% |
| $35,000 to $49,999 | 170 | 14.3% |
| $50,000 to $74,999 | 316 | 26.5% |
| $75,000 to $99,999 | 121 | 10.2% |
| $100,000 to $149,999 | 295 | 24.8% |
| $150,000 to $199,999 | 123 | 10.3% |
| $200,000+ | 48 | 4.0% |
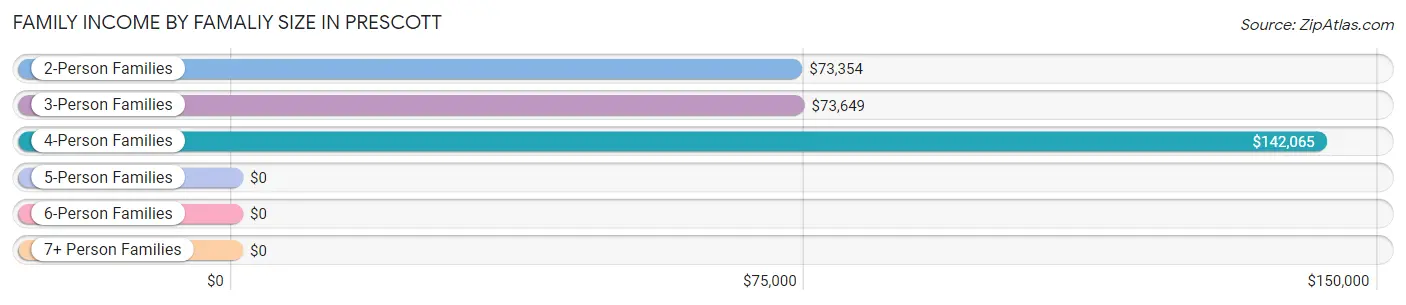
Family Income by Famaliy Size in Prescott
4-person families (224 | 18.8%) account for the highest median family income in Prescott with $142,065 per family, while 2-person families (620 | 52.1%) have the highest median income of $36,677 per family member.
| Income Bracket | # Families | Median Income |
| 2-Person Families | 620 (52.1%) | $73,354 |
| 3-Person Families | 306 (25.7%) | $73,649 |
| 4-Person Families | 224 (18.8%) | $142,065 |
| 5-Person Families | 25 (2.1%) | $0 |
| 6-Person Families | 0 (0.0%) | $0 |
| 7+ Person Families | 16 (1.3%) | $0 |
| Total | 1,191 (100.0%) | $74,864 |
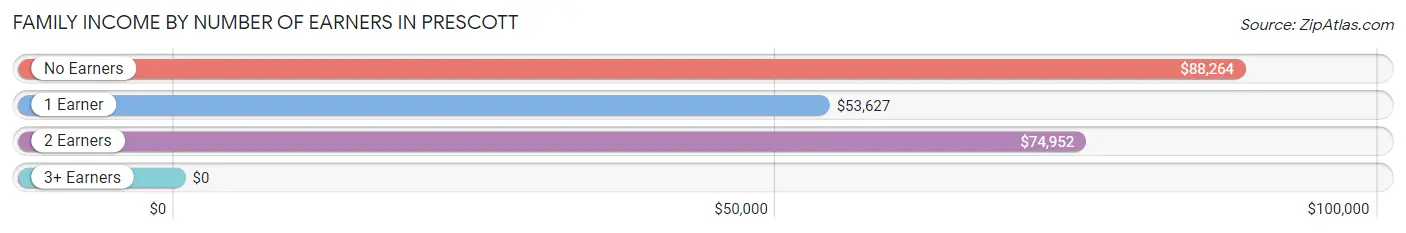
Family Income by Number of Earners in Prescott
| Number of Earners | # Families | Median Income |
| No Earners | 141 (11.8%) | $88,264 |
| 1 Earner | 324 (27.2%) | $53,627 |
| 2 Earners | 688 (57.8%) | $74,952 |
| 3+ Earners | 38 (3.2%) | $0 |
| Total | 1,191 (100.0%) | $74,864 |
Household Income in Prescott
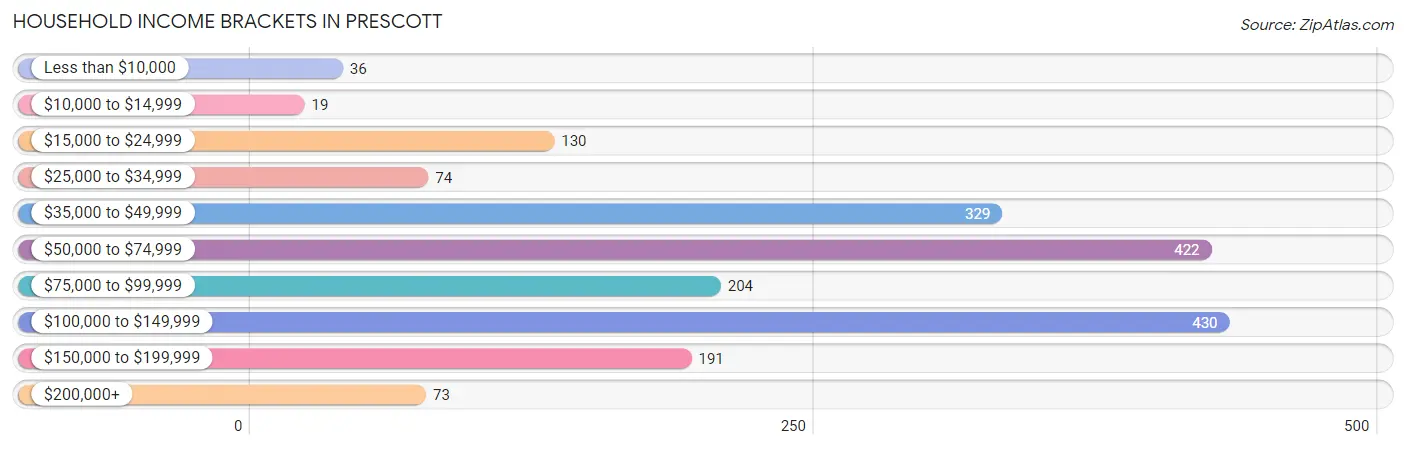
Household Income Brackets in Prescott
With 430 households falling in the category, the $100,000 to $149,999 income range is the most frequent in Prescott, accounting for 22.5% of all households. In contrast, only 19 households (1.0%) fall into the $10,000 to $14,999 income bracket, making it the least populous group.
| Income Bracket | # Households | % Households |
| Less than $10,000 | 36 | 1.9% |
| $10,000 to $14,999 | 19 | 1.0% |
| $15,000 to $24,999 | 130 | 6.8% |
| $25,000 to $34,999 | 74 | 3.9% |
| $35,000 to $49,999 | 329 | 17.2% |
| $50,000 to $74,999 | 422 | 22.1% |
| $75,000 to $99,999 | 204 | 10.7% |
| $100,000 to $149,999 | 430 | 22.5% |
| $150,000 to $199,999 | 191 | 10.0% |
| $200,000+ | 73 | 3.8% |
Household Income by Householder Age in Prescott
The median household income in Prescott is $74,195, with the highest median household income of $90,662 found in the 25 to 44 years age bracket for the primary householder. A total of 658 households (34.4%) fall into this category. Meanwhile, the 15 to 24 years age bracket for the primary householder has the lowest median household income of $0, with 134 households (7.0%) in this group.
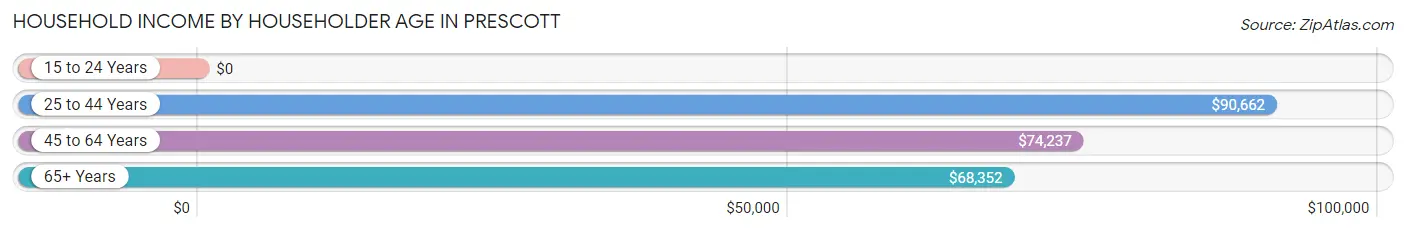
| Income Bracket | # Households | Median Income |
| 15 to 24 Years | 134 (7.0%) | $0 |
| 25 to 44 Years | 658 (34.4%) | $90,662 |
| 45 to 64 Years | 706 (37.0%) | $74,237 |
| 65+ Years | 412 (21.6%) | $68,352 |
| Total | 1,910 (100.0%) | $74,195 |
Poverty in Prescott
Income Below Poverty by Sex and Age in Prescott
With 7.5% poverty level for males and 5.4% for females among the residents of Prescott, under 5 year old males and 18 to 24 year old females are the most vulnerable to poverty, with 46 males (22.9%) and 75 females (58.6%) in their respective age groups living below the poverty level.
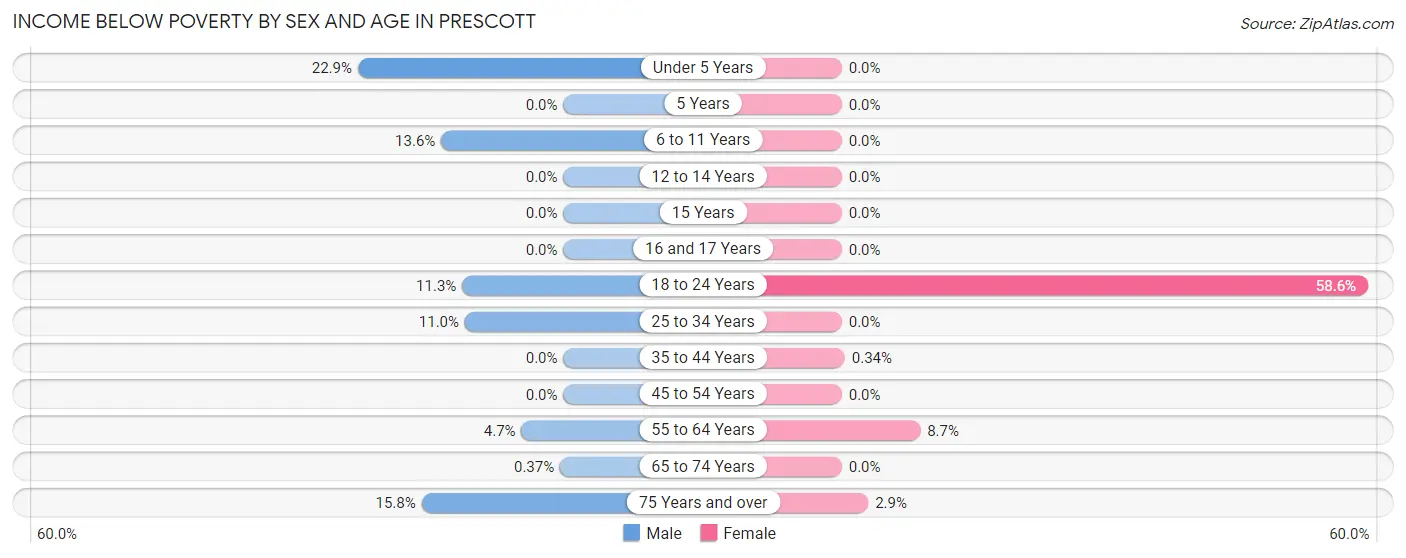
| Age Bracket | Male | Female |
| Under 5 Years | 46 (22.9%) | 0 (0.0%) |
| 5 Years | 0 (0.0%) | 0 (0.0%) |
| 6 to 11 Years | 20 (13.6%) | 0 (0.0%) |
| 12 to 14 Years | 0 (0.0%) | 0 (0.0%) |
| 15 Years | 0 (0.0%) | 0 (0.0%) |
| 16 and 17 Years | 0 (0.0%) | 0 (0.0%) |
| 18 to 24 Years | 23 (11.3%) | 75 (58.6%) |
| 25 to 34 Years | 43 (11.0%) | 0 (0.0%) |
| 35 to 44 Years | 0 (0.0%) | 1 (0.3%) |
| 45 to 54 Years | 0 (0.0%) | 0 (0.0%) |
| 55 to 64 Years | 14 (4.7%) | 33 (8.7%) |
| 65 to 74 Years | 1 (0.4%) | 0 (0.0%) |
| 75 Years and over | 21 (15.8%) | 2 (2.9%) |
| Total | 168 (7.5%) | 111 (5.4%) |
Income Above Poverty by Sex and Age in Prescott
According to the poverty statistics in Prescott, males aged 5 years and females aged under 5 years are the age groups that are most secure financially, with 100.0% of males and 100.0% of females in these age groups living above the poverty line.
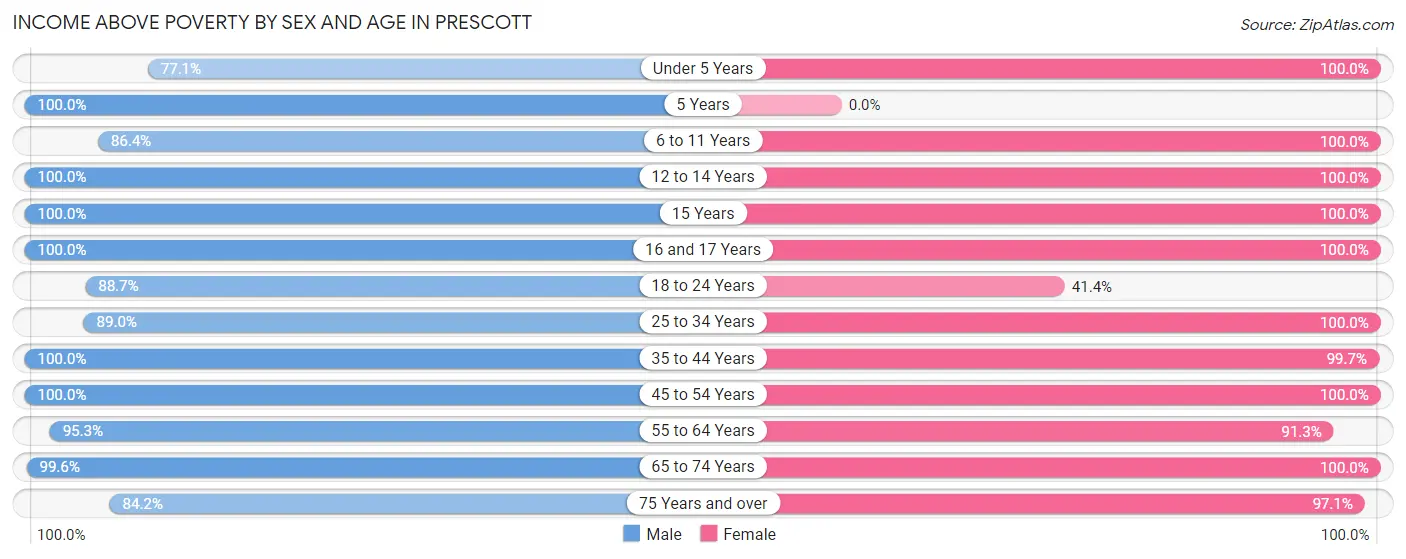
| Age Bracket | Male | Female |
| Under 5 Years | 155 (77.1%) | 139 (100.0%) |
| 5 Years | 40 (100.0%) | 0 (0.0%) |
| 6 to 11 Years | 127 (86.4%) | 144 (100.0%) |
| 12 to 14 Years | 91 (100.0%) | 30 (100.0%) |
| 15 Years | 17 (100.0%) | 26 (100.0%) |
| 16 and 17 Years | 30 (100.0%) | 58 (100.0%) |
| 18 to 24 Years | 181 (88.7%) | 53 (41.4%) |
| 25 to 34 Years | 349 (89.0%) | 413 (100.0%) |
| 35 to 44 Years | 213 (100.0%) | 291 (99.7%) |
| 45 to 54 Years | 190 (100.0%) | 156 (100.0%) |
| 55 to 64 Years | 286 (95.3%) | 345 (91.3%) |
| 65 to 74 Years | 269 (99.6%) | 222 (100.0%) |
| 75 Years and over | 112 (84.2%) | 66 (97.1%) |
| Total | 2,060 (92.5%) | 1,943 (94.6%) |
Income Below Poverty Among Married-Couple Families in Prescott
The poverty statistics for married-couple families in Prescott show that 1.5% or 14 of the total 902 families live below the poverty line. Families with no children have the highest poverty rate of 2.8%, comprising of 14 families. On the other hand, families with 1 or 2 children have the lowest poverty rate of 0.0%, which includes 0 families.
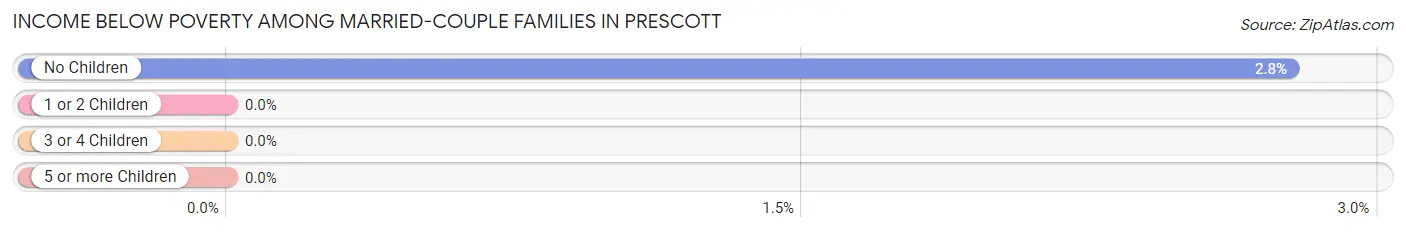
| Children | Above Poverty | Below Poverty |
| No Children | 491 (97.2%) | 14 (2.8%) |
| 1 or 2 Children | 381 (100.0%) | 0 (0.0%) |
| 3 or 4 Children | 0 (0.0%) | 0 (0.0%) |
| 5 or more Children | 16 (100.0%) | 0 (0.0%) |
| Total | 888 (98.5%) | 14 (1.5%) |
Income Below Poverty Among Single-Parent Households in Prescott
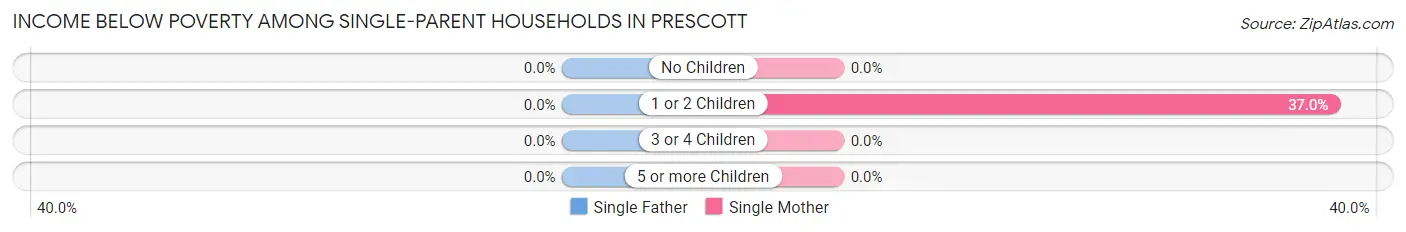
| Children | Single Father | Single Mother |
| No Children | 0 (0.0%) | 0 (0.0%) |
| 1 or 2 Children | 0 (0.0%) | 54 (37.0%) |
| 3 or 4 Children | 0 (0.0%) | 0 (0.0%) |
| 5 or more Children | 0 (0.0%) | 0 (0.0%) |
| Total | 0 (0.0%) | 54 (29.2%) |
Income Below Poverty Among Married-Couple vs Single-Parent Households in Prescott
The poverty data for Prescott shows that 14 of the married-couple family households (1.5%) and 54 of the single-parent households (18.7%) are living below the poverty level. Within the married-couple family households, those with no children have the highest poverty rate, with 14 households (2.8%) falling below the poverty line. Among the single-parent households, those with 1 or 2 children have the highest poverty rate, with 54 household (26.0%) living below poverty.
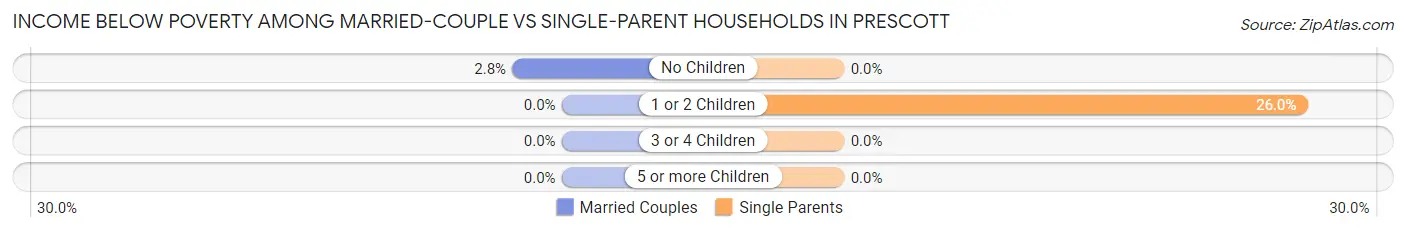
| Children | Married-Couple Families | Single-Parent Households |
| No Children | 14 (2.8%) | 0 (0.0%) |
| 1 or 2 Children | 0 (0.0%) | 54 (26.0%) |
| 3 or 4 Children | 0 (0.0%) | 0 (0.0%) |
| 5 or more Children | 0 (0.0%) | 0 (0.0%) |
| Total | 14 (1.5%) | 54 (18.7%) |
Race in Prescott
The most populous races in Prescott are White / Caucasian (4,053 | 93.3%), Hispanic or Latino (213 | 4.9%), and Two or more Races (187 | 4.3%).
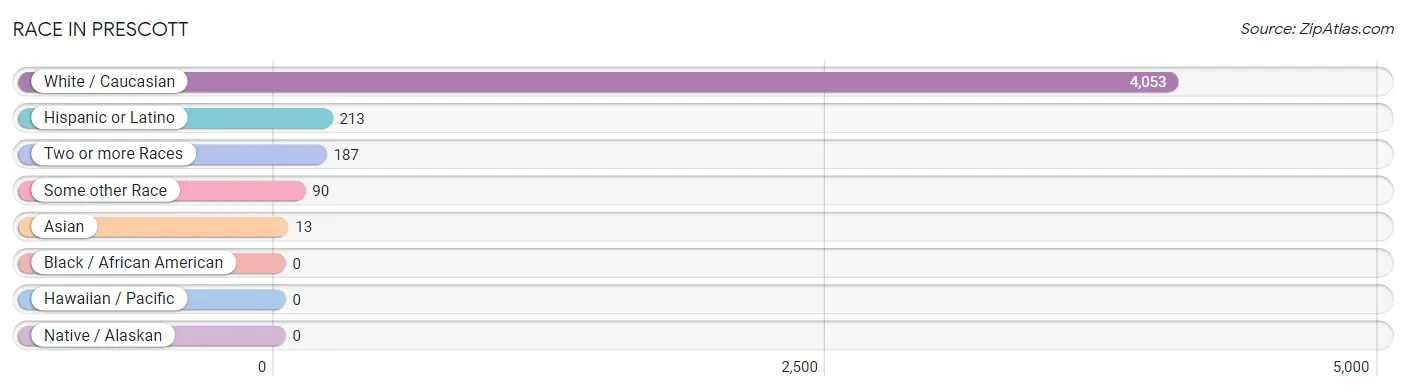
| Race | # Population | % Population |
| Asian | 13 | 0.3% |
| Black / African American | 0 | 0.0% |
| Hawaiian / Pacific | 0 | 0.0% |
| Hispanic or Latino | 213 | 4.9% |
| Native / Alaskan | 0 | 0.0% |
| White / Caucasian | 4,053 | 93.3% |
| Two or more Races | 187 | 4.3% |
| Some other Race | 90 | 2.1% |
| Total | 4,343 | 100.0% |
Ancestry in Prescott
The most populous ancestries reported in Prescott are German (1,446 | 33.3%), Irish (524 | 12.1%), Norwegian (403 | 9.3%), English (176 | 4.1%), and Swedish (130 | 3.0%), together accounting for 61.7% of all Prescott residents.
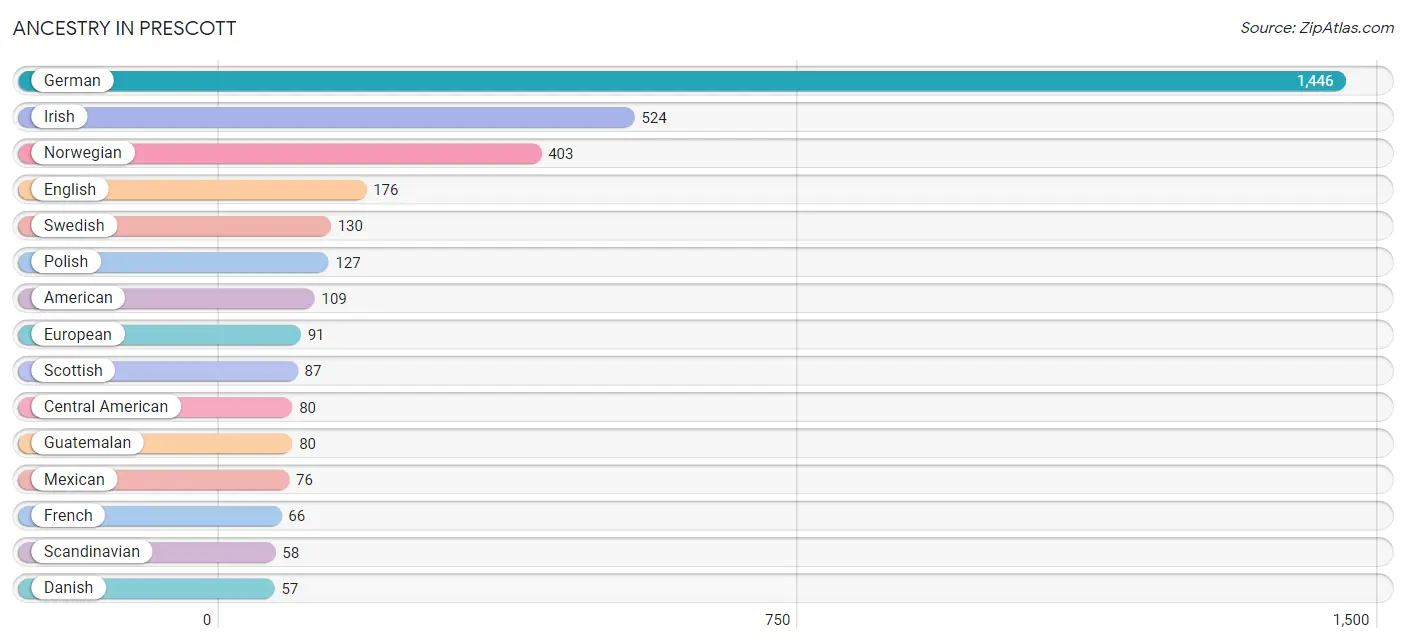
| Ancestry | # Population | % Population |
| American | 109 | 2.5% |
| Bhutanese | 9 | 0.2% |
| Central American | 80 | 1.8% |
| Cherokee | 30 | 0.7% |
| Czech | 56 | 1.3% |
| Danish | 57 | 1.3% |
| English | 176 | 4.1% |
| European | 91 | 2.1% |
| French | 66 | 1.5% |
| French Canadian | 25 | 0.6% |
| German | 1,446 | 33.3% |
| Guatemalan | 80 | 1.8% |
| Indian (Asian) | 13 | 0.3% |
| Irish | 524 | 12.1% |
| Italian | 2 | 0.1% |
| Latvian | 24 | 0.5% |
| Mexican | 76 | 1.8% |
| Native Hawaiian | 3 | 0.1% |
| Norwegian | 403 | 9.3% |
| Polish | 127 | 2.9% |
| Scandinavian | 58 | 1.3% |
| Scotch-Irish | 4 | 0.1% |
| Scottish | 87 | 2.0% |
| Sioux | 9 | 0.2% |
| Spaniard | 32 | 0.7% |
| Spanish | 25 | 0.6% |
| Swedish | 130 | 3.0% | View All 27 Rows |
Immigrants in Prescott
The most numerous immigrant groups reported in Prescott came from Europe (84 | 1.9%), Germany (60 | 1.4%), Western Europe (60 | 1.4%), Eastern Europe (24 | 0.5%), and Latvia (24 | 0.5%), together accounting for 5.8% of all Prescott residents.
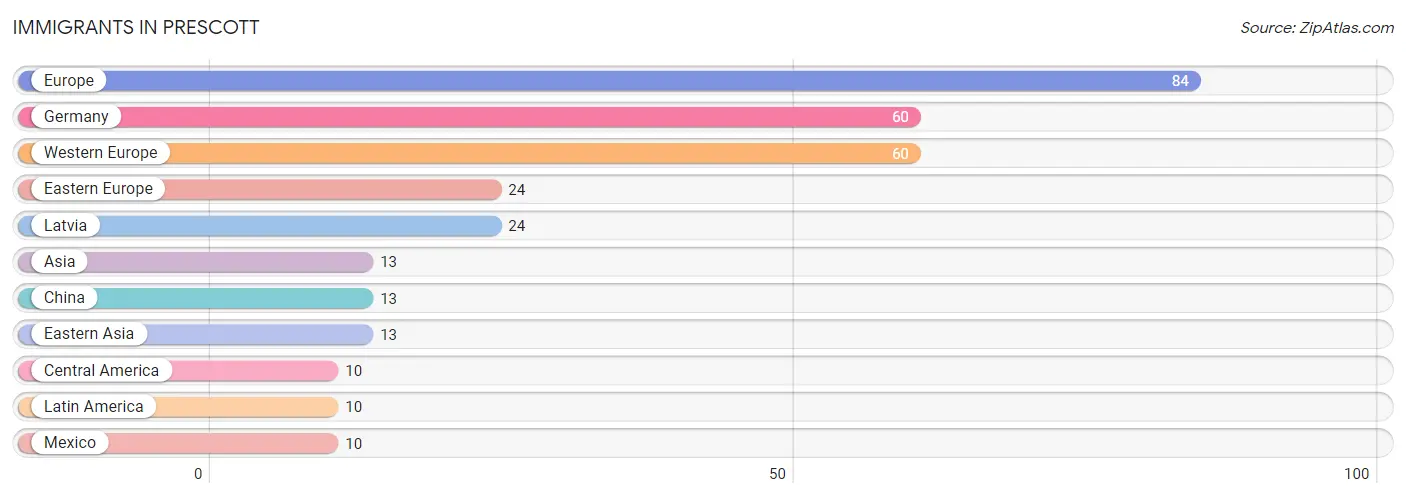
| Immigration Origin | # Population | % Population |
| Asia | 13 | 0.3% |
| Central America | 10 | 0.2% |
| China | 13 | 0.3% |
| Eastern Asia | 13 | 0.3% |
| Eastern Europe | 24 | 0.5% |
| Europe | 84 | 1.9% |
| Germany | 60 | 1.4% |
| Latin America | 10 | 0.2% |
| Latvia | 24 | 0.5% |
| Mexico | 10 | 0.2% |
| Western Europe | 60 | 1.4% | View All 11 Rows |
Sex and Age in Prescott
Sex and Age in Prescott
The most populous age groups in Prescott are 25 to 29 Years (209 | 9.4%) for men and 60 to 64 Years (313 | 14.8%) for women.
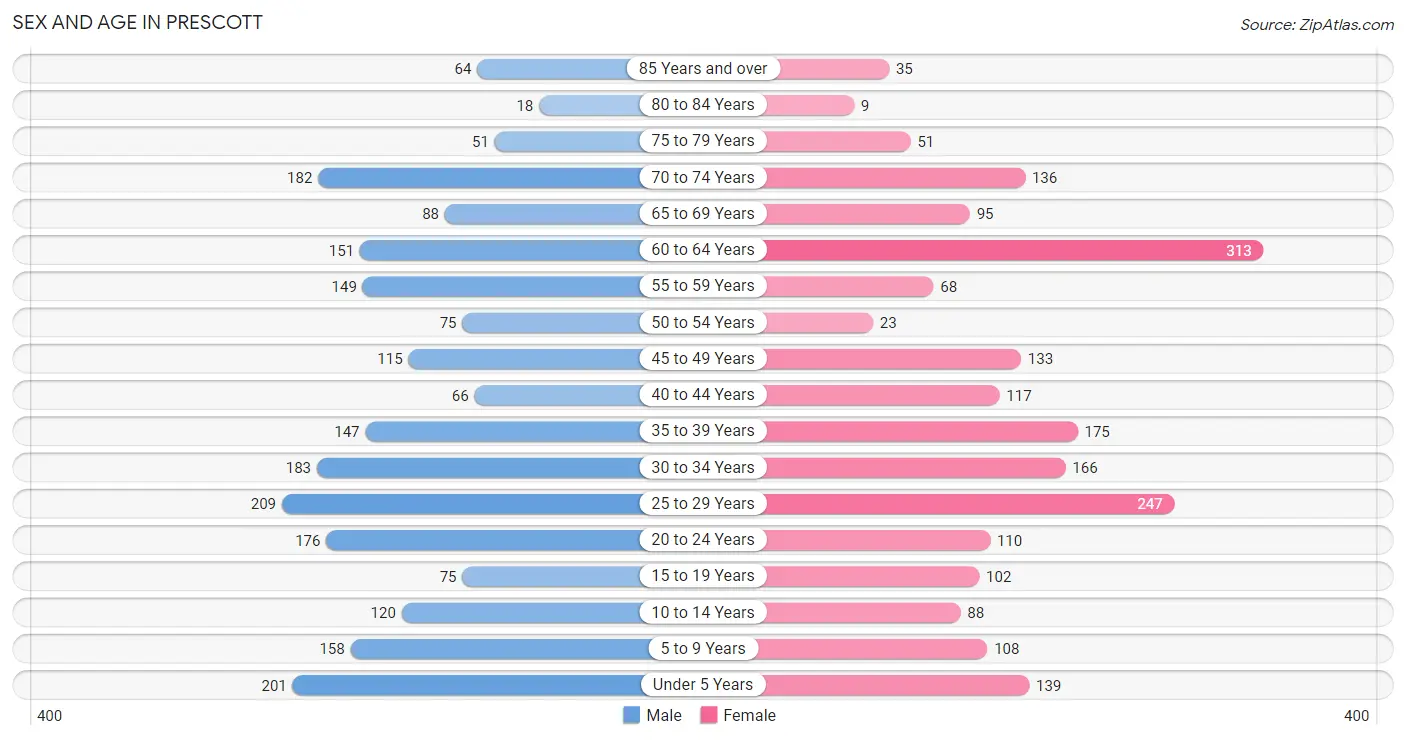
| Age Bracket | Male | Female |
| Under 5 Years | 201 (9.0%) | 139 (6.6%) |
| 5 to 9 Years | 158 (7.1%) | 108 (5.1%) |
| 10 to 14 Years | 120 (5.4%) | 88 (4.2%) |
| 15 to 19 Years | 75 (3.4%) | 102 (4.8%) |
| 20 to 24 Years | 176 (7.9%) | 110 (5.2%) |
| 25 to 29 Years | 209 (9.4%) | 247 (11.7%) |
| 30 to 34 Years | 183 (8.2%) | 166 (7.9%) |
| 35 to 39 Years | 147 (6.6%) | 175 (8.3%) |
| 40 to 44 Years | 66 (3.0%) | 117 (5.5%) |
| 45 to 49 Years | 115 (5.2%) | 133 (6.3%) |
| 50 to 54 Years | 75 (3.4%) | 23 (1.1%) |
| 55 to 59 Years | 149 (6.7%) | 68 (3.2%) |
| 60 to 64 Years | 151 (6.8%) | 313 (14.8%) |
| 65 to 69 Years | 88 (4.0%) | 95 (4.5%) |
| 70 to 74 Years | 182 (8.2%) | 136 (6.4%) |
| 75 to 79 Years | 51 (2.3%) | 51 (2.4%) |
| 80 to 84 Years | 18 (0.8%) | 9 (0.4%) |
| 85 Years and over | 64 (2.9%) | 35 (1.7%) |
| Total | 2,228 (100.0%) | 2,115 (100.0%) |
Families and Households in Prescott
Median Family Size in Prescott
The median family size in Prescott is 2.71 persons per family, with single male/father families (104 | 8.7%) accounting for the largest median family size of 2.91 persons per family. On the other hand, single female/mother families (185 | 15.5%) represent the smallest median family size with 2.16 persons per family.
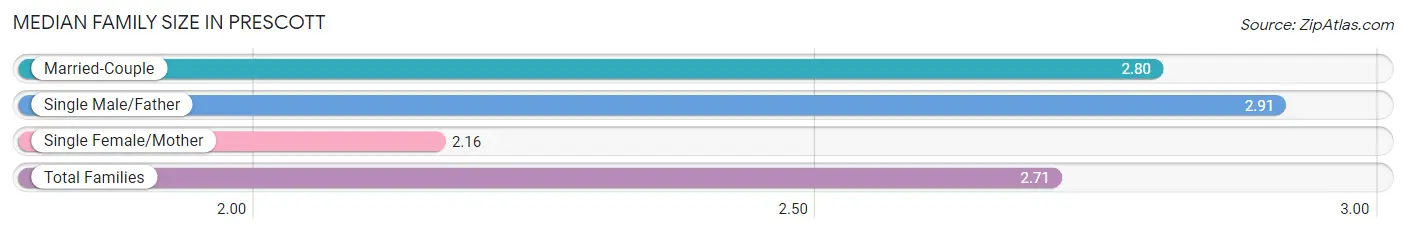
| Family Type | # Families | Family Size |
| Married-Couple | 902 (75.7%) | 2.80 |
| Single Male/Father | 104 (8.7%) | 2.91 |
| Single Female/Mother | 185 (15.5%) | 2.16 |
| Total Families | 1,191 (100.0%) | 2.71 |
Median Household Size in Prescott
The median household size in Prescott is 2.25 persons per household, with single male/father households (104 | 5.4%) accounting for the largest median household size of 3.77 persons per household. non-family households (719 | 37.6%) represent the smallest median household size with 1.23 persons per household.
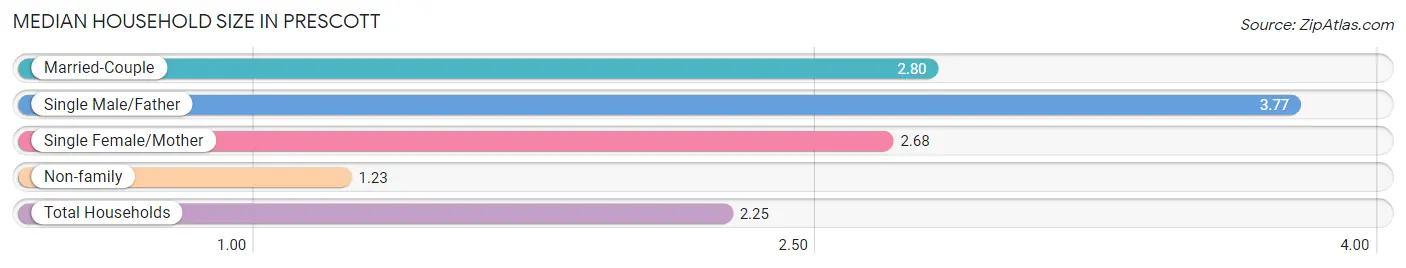
| Household Type | # Households | Household Size |
| Married-Couple | 902 (47.2%) | 2.80 |
| Single Male/Father | 104 (5.4%) | 3.77 |
| Single Female/Mother | 185 (9.7%) | 2.68 |
| Non-family | 719 (37.6%) | 1.23 |
| Total Households | 1,910 (100.0%) | 2.25 |
Household Size by Marriage Status in Prescott
Out of a total of 1,910 households in Prescott, 1,191 (62.4%) are family households, while 719 (37.6%) are nonfamily households. The most numerous type of family households are 2-person households, comprising 565, and the most common type of nonfamily households are 1-person households, comprising 554.
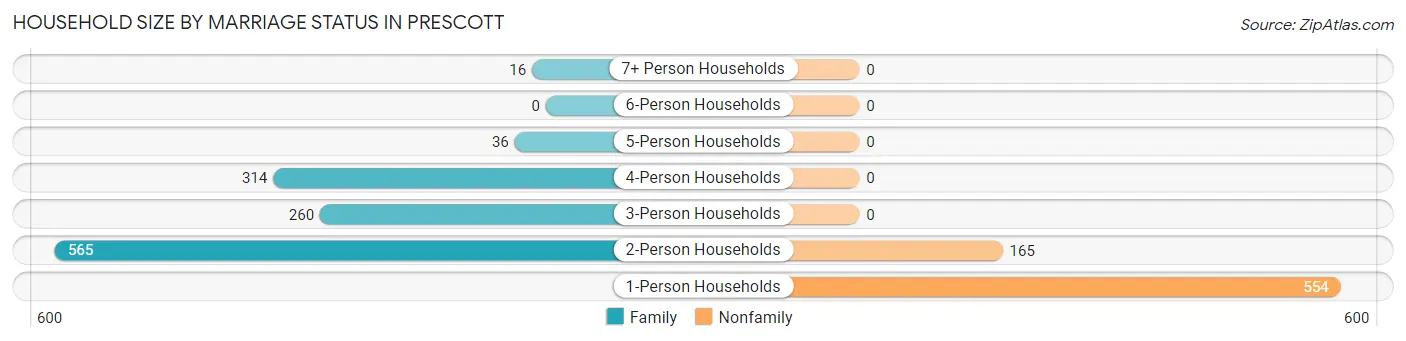
| Household Size | Family Households | Nonfamily Households |
| 1-Person Households | - | 554 (29.0%) |
| 2-Person Households | 565 (29.6%) | 165 (8.6%) |
| 3-Person Households | 260 (13.6%) | 0 (0.0%) |
| 4-Person Households | 314 (16.4%) | 0 (0.0%) |
| 5-Person Households | 36 (1.9%) | 0 (0.0%) |
| 6-Person Households | 0 (0.0%) | 0 (0.0%) |
| 7+ Person Households | 16 (0.8%) | 0 (0.0%) |
| Total | 1,191 (62.4%) | 719 (37.6%) |
Female Fertility in Prescott
Fertility by Age in Prescott
Average fertility rate in Prescott is 110.0 births per 1,000 women. Women in the age bracket of 20 to 34 years have the highest fertility rate with 222.0 births per 1,000 women. Women in the age bracket of 20 to 34 years acount for 100.0% of all women with births.
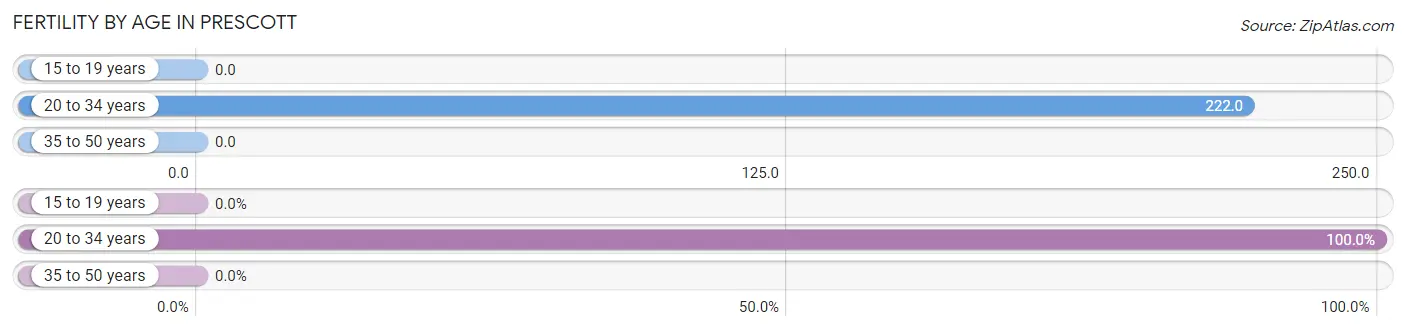
| Age Bracket | Women with Births | Births / 1,000 Women |
| 15 to 19 years | 0 (0.0%) | 0.0 |
| 20 to 34 years | 116 (100.0%) | 222.0 |
| 35 to 50 years | 0 (0.0%) | 0.0 |
| Total | 116 (100.0%) | 110.0 |
Fertility by Age by Marriage Status in Prescott
82.8% of women with births (116) in Prescott are married. The highest percentage of unmarried women with births falls into 20 to 34 years age bracket with 17.2% of them unmarried at the time of birth, while the lowest percentage of unmarried women with births belong to 20 to 34 years age bracket with 17.2% of them unmarried.
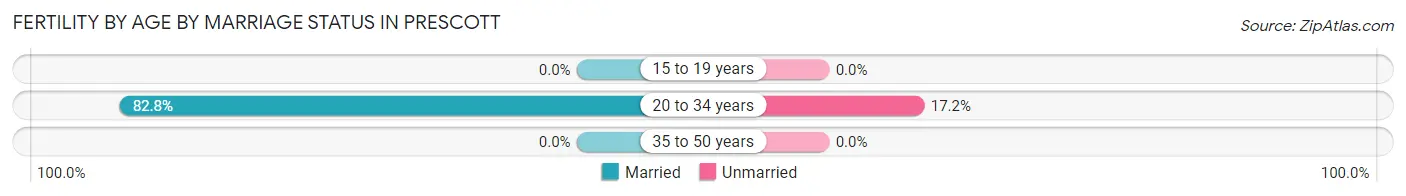
| Age Bracket | Married | Unmarried |
| 15 to 19 years | 0 (0.0%) | 0 (0.0%) |
| 20 to 34 years | 96 (82.8%) | 20 (17.2%) |
| 35 to 50 years | 0 (0.0%) | 0 (0.0%) |
| Total | 96 (82.8%) | 20 (17.2%) |
Fertility by Education in Prescott
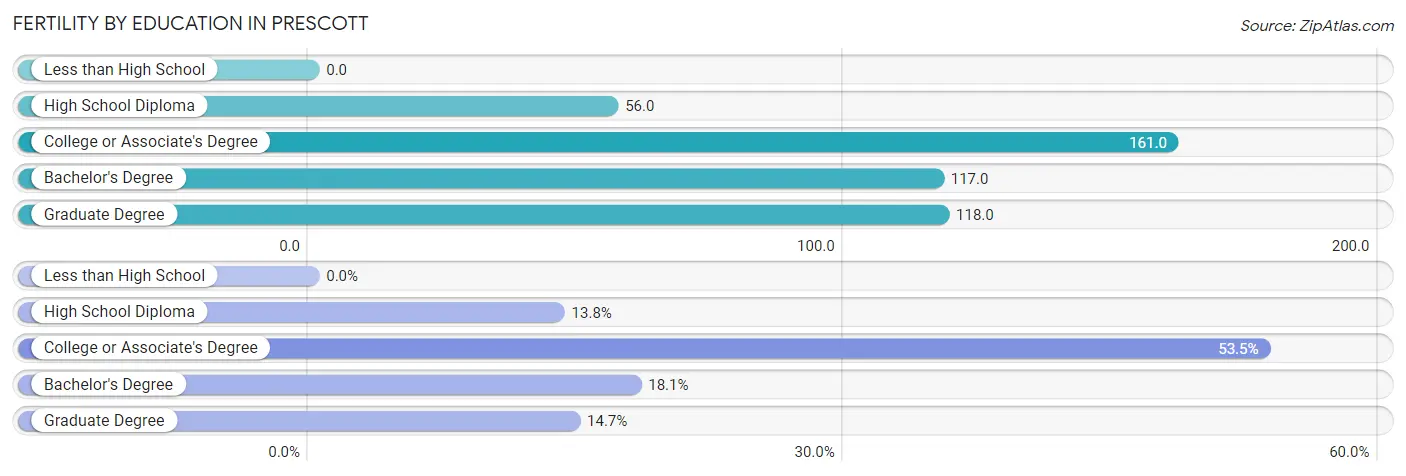
| Educational Attainment | Women with Births | Births / 1,000 Women |
| Less than High School | 0 (0.0%) | 0.0 |
| High School Diploma | 16 (13.8%) | 56.0 |
| College or Associate's Degree | 62 (53.4%) | 161.0 |
| Bachelor's Degree | 21 (18.1%) | 117.0 |
| Graduate Degree | 17 (14.7%) | 118.0 |
| Total | 116 (100.0%) | 110.0 |
Fertility by Education by Marriage Status in Prescott
17.2% of women with births in Prescott are unmarried. Women with the educational attainment of high school diploma are most likely to be married with 100.0% of them married at childbirth, while women with the educational attainment of college or associate's degree are least likely to be married with 32.3% of them unmarried at childbirth.
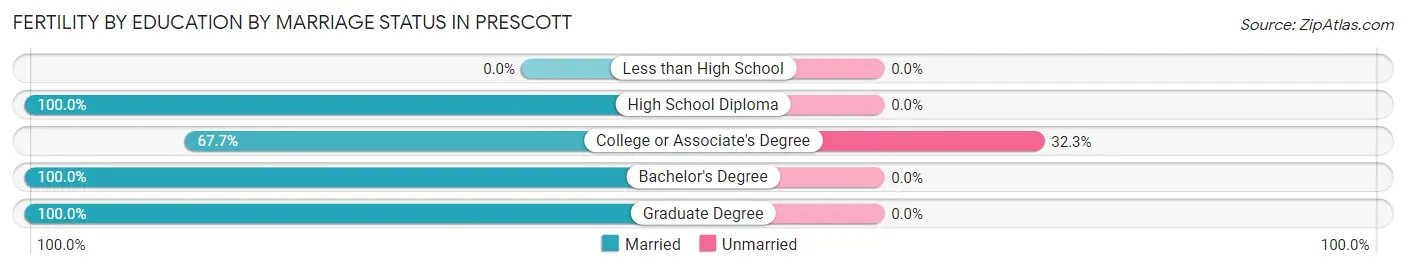
| Educational Attainment | Married | Unmarried |
| Less than High School | 0 (0.0%) | 0 (0.0%) |
| High School Diploma | 16 (100.0%) | 0 (0.0%) |
| College or Associate's Degree | 42 (67.7%) | 20 (32.3%) |
| Bachelor's Degree | 21 (100.0%) | 0 (0.0%) |
| Graduate Degree | 17 (100.0%) | 0 (0.0%) |
| Total | 96 (82.8%) | 20 (17.2%) |
Employment Characteristics in Prescott
Employment by Class of Employer in Prescott
Among the 2,180 employed individuals in Prescott, private company employees (1,605 | 73.6%), not-for-profit organizations (244 | 11.2%), and self-employed (not incorporated) (142 | 6.5%) make up the most common classes of employment.
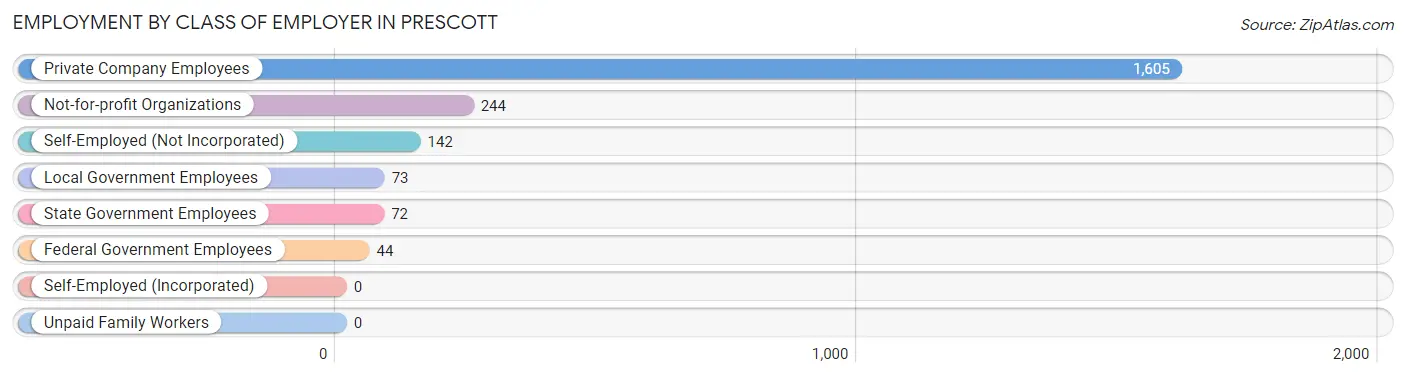
| Employer Class | # Employees | % Employees |
| Private Company Employees | 1,605 | 73.6% |
| Self-Employed (Incorporated) | 0 | 0.0% |
| Self-Employed (Not Incorporated) | 142 | 6.5% |
| Not-for-profit Organizations | 244 | 11.2% |
| Local Government Employees | 73 | 3.4% |
| State Government Employees | 72 | 3.3% |
| Federal Government Employees | 44 | 2.0% |
| Unpaid Family Workers | 0 | 0.0% |
| Total | 2,180 | 100.0% |
Employment Status by Age in Prescott
According to the labor force statistics for Prescott, out of the total population over 16 years of age (3,486), 69.2% or 2,412 individuals are in the labor force, with 1.5% or 36 of them unemployed. The age group with the highest labor force participation rate is 45 to 54 years, with 100.0% or 346 individuals in the labor force. Within the labor force, the 65 to 74 years age range has the highest percentage of unemployed individuals, with 15.5% or 16 of them being unemployed.
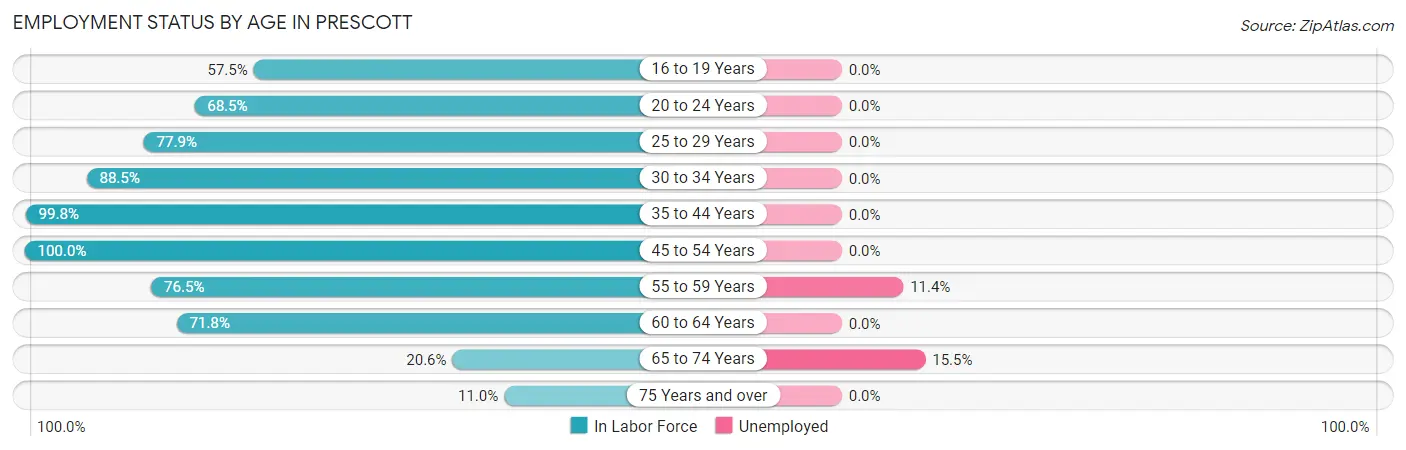
| Age Bracket | In Labor Force | Unemployed |
| 16 to 19 Years | 77 (57.5%) | 0 (0.0%) |
| 20 to 24 Years | 196 (68.5%) | 0 (0.0%) |
| 25 to 29 Years | 355 (77.9%) | 0 (0.0%) |
| 30 to 34 Years | 309 (88.5%) | 0 (0.0%) |
| 35 to 44 Years | 504 (99.8%) | 0 (0.0%) |
| 45 to 54 Years | 346 (100.0%) | 0 (0.0%) |
| 55 to 59 Years | 166 (76.5%) | 19 (11.4%) |
| 60 to 64 Years | 333 (71.8%) | 0 (0.0%) |
| 65 to 74 Years | 103 (20.6%) | 16 (15.5%) |
| 75 Years and over | 25 (11.0%) | 0 (0.0%) |
| Total | 2,412 (69.2%) | 36 (1.5%) |
Employment Status by Educational Attainment in Prescott
According to labor force statistics for Prescott, 86.1% of individuals (2,012) out of the total population between 25 and 64 years of age (2,337) are in the labor force, with 0.9% or 18 of them being unemployed. The group with the highest labor force participation rate are those with the educational attainment of less than high school, with 100.0% or 56 individuals in the labor force. Within the labor force, individuals with bachelor's degree or higher education have the highest percentage of unemployment, with 3.7% or 19 of them being unemployed.
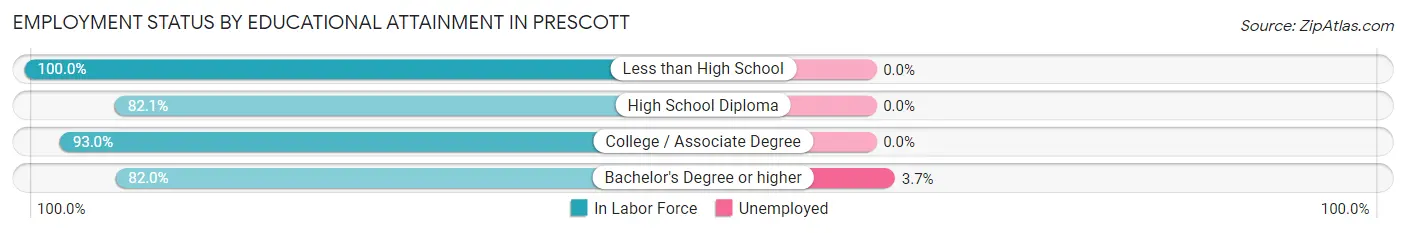
| Educational Attainment | In Labor Force | Unemployed |
| Less than High School | 56 (100.0%) | 0 (0.0%) |
| High School Diploma | 730 (82.1%) | 0 (0.0%) |
| College / Associate Degree | 720 (93.0%) | 0 (0.0%) |
| Bachelor's Degree or higher | 507 (82.0%) | 23 (3.7%) |
| Total | 2,012 (86.1%) | 21 (0.9%) |
Employment Occupations by Sex in Prescott
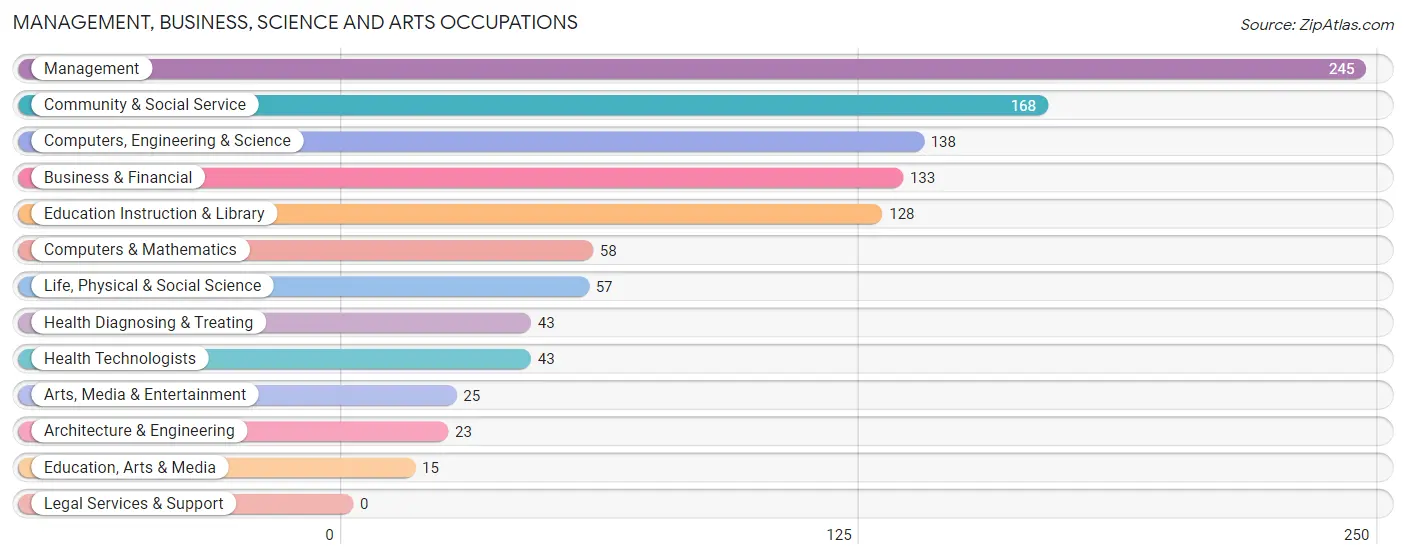
Management, Business, Science and Arts Occupations
The most common Management, Business, Science and Arts occupations in Prescott are Management (245 | 10.4%), Community & Social Service (168 | 7.1%), Computers, Engineering & Science (138 | 5.9%), Business & Financial (133 | 5.6%), and Education Instruction & Library (128 | 5.4%).
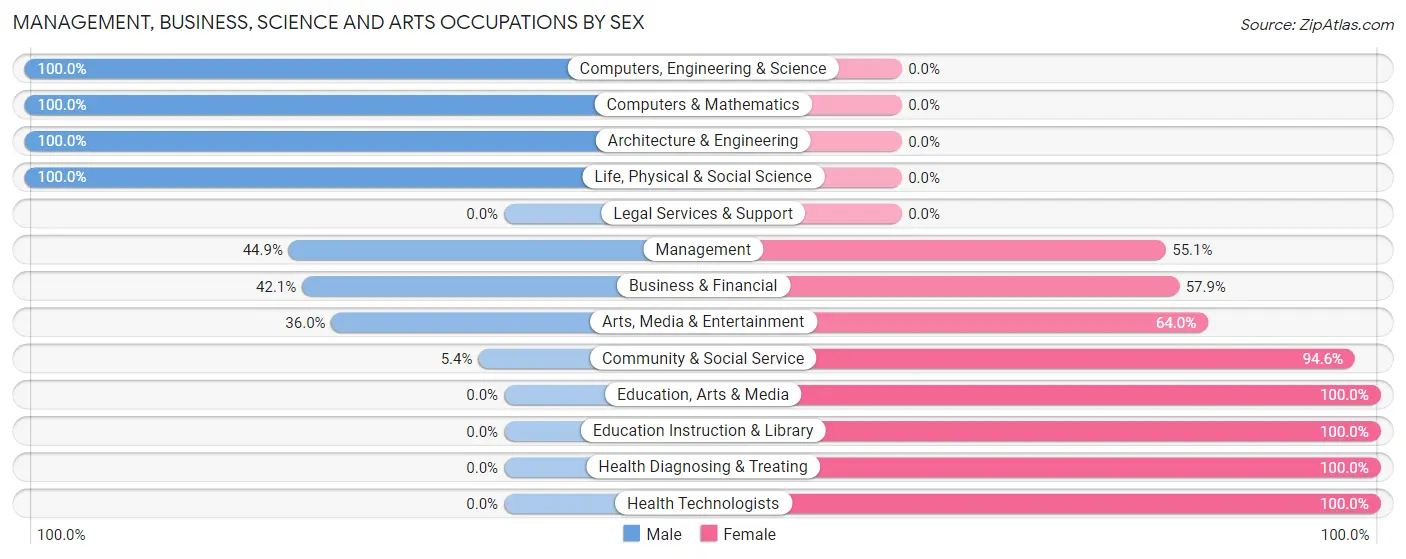
Management, Business, Science and Arts Occupations by Sex
Within the Management, Business, Science and Arts occupations in Prescott, the most male-oriented occupations are Computers, Engineering & Science (100.0%), Computers & Mathematics (100.0%), and Architecture & Engineering (100.0%), while the most female-oriented occupations are Education, Arts & Media (100.0%), Education Instruction & Library (100.0%), and Health Diagnosing & Treating (100.0%).
| Occupation | Male | Female |
| Management | 110 (44.9%) | 135 (55.1%) |
| Business & Financial | 56 (42.1%) | 77 (57.9%) |
| Computers, Engineering & Science | 138 (100.0%) | 0 (0.0%) |
| Computers & Mathematics | 58 (100.0%) | 0 (0.0%) |
| Architecture & Engineering | 23 (100.0%) | 0 (0.0%) |
| Life, Physical & Social Science | 57 (100.0%) | 0 (0.0%) |
| Community & Social Service | 9 (5.4%) | 159 (94.6%) |
| Education, Arts & Media | 0 (0.0%) | 15 (100.0%) |
| Legal Services & Support | 0 (0.0%) | 0 (0.0%) |
| Education Instruction & Library | 0 (0.0%) | 128 (100.0%) |
| Arts, Media & Entertainment | 9 (36.0%) | 16 (64.0%) |
| Health Diagnosing & Treating | 0 (0.0%) | 43 (100.0%) |
| Health Technologists | 0 (0.0%) | 43 (100.0%) |
| Total (Category) | 313 (43.0%) | 414 (57.0%) |
| Total (Overall) | 1,160 (49.2%) | 1,198 (50.8%) |
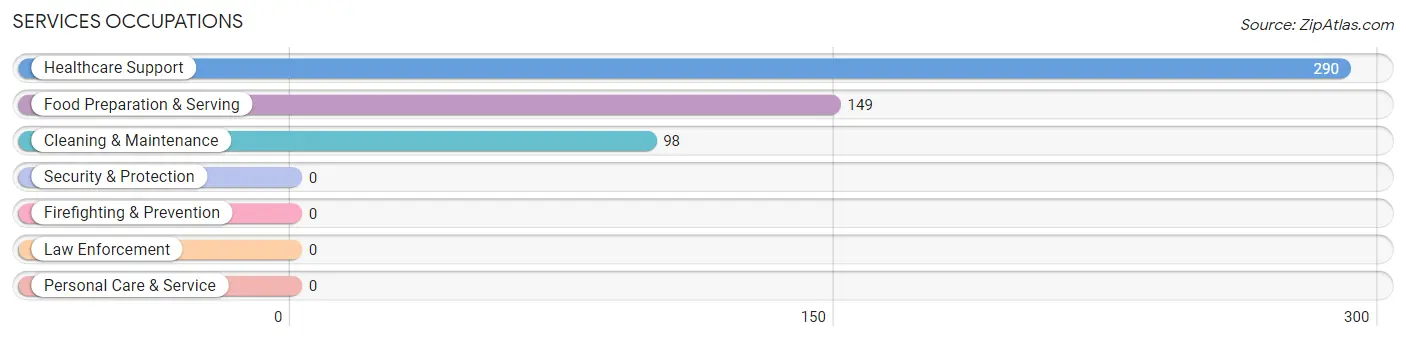
Services Occupations
The most common Services occupations in Prescott are Healthcare Support (290 | 12.3%), Food Preparation & Serving (149 | 6.3%), and Cleaning & Maintenance (98 | 4.2%).
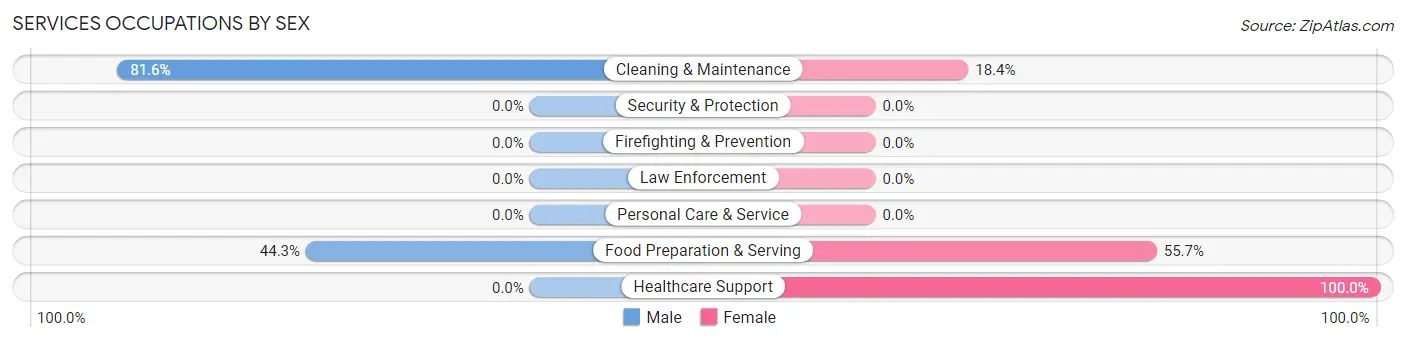
Services Occupations by Sex
Within the Services occupations in Prescott, the most male-oriented occupations are Cleaning & Maintenance (81.6%), and Food Preparation & Serving (44.3%), while the most female-oriented occupations are Healthcare Support (100.0%), Food Preparation & Serving (55.7%), and Cleaning & Maintenance (18.4%).
| Occupation | Male | Female |
| Healthcare Support | 0 (0.0%) | 290 (100.0%) |
| Security & Protection | 0 (0.0%) | 0 (0.0%) |
| Firefighting & Prevention | 0 (0.0%) | 0 (0.0%) |
| Law Enforcement | 0 (0.0%) | 0 (0.0%) |
| Food Preparation & Serving | 66 (44.3%) | 83 (55.7%) |
| Cleaning & Maintenance | 80 (81.6%) | 18 (18.4%) |
| Personal Care & Service | 0 (0.0%) | 0 (0.0%) |
| Total (Category) | 146 (27.2%) | 391 (72.8%) |
| Total (Overall) | 1,160 (49.2%) | 1,198 (50.8%) |
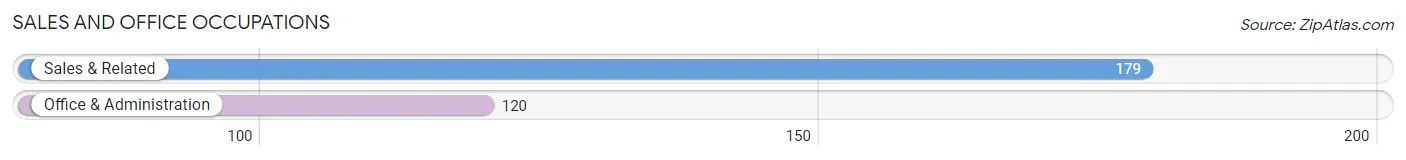
Sales and Office Occupations
The most common Sales and Office occupations in Prescott are Sales & Related (179 | 7.6%), and Office & Administration (120 | 5.1%).
Sales and Office Occupations by Sex
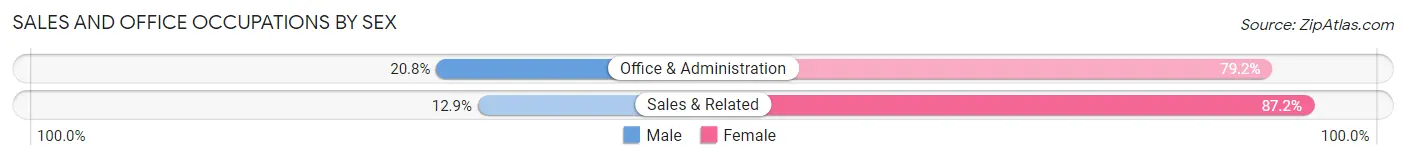
| Occupation | Male | Female |
| Sales & Related | 23 (12.9%) | 156 (87.2%) |
| Office & Administration | 25 (20.8%) | 95 (79.2%) |
| Total (Category) | 48 (16.1%) | 251 (84.0%) |
| Total (Overall) | 1,160 (49.2%) | 1,198 (50.8%) |
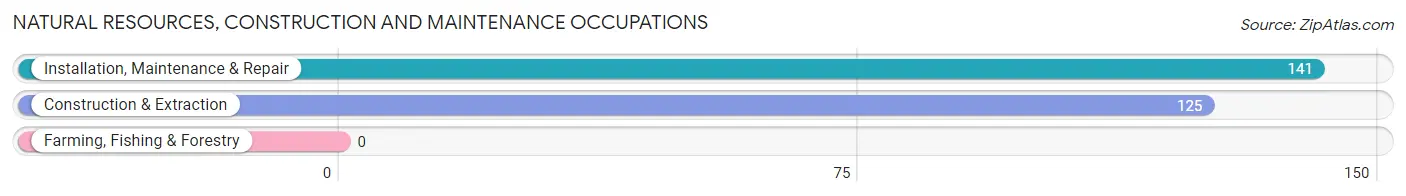
Natural Resources, Construction and Maintenance Occupations
The most common Natural Resources, Construction and Maintenance occupations in Prescott are Installation, Maintenance & Repair (141 | 6.0%), and Construction & Extraction (125 | 5.3%).
Natural Resources, Construction and Maintenance Occupations by Sex
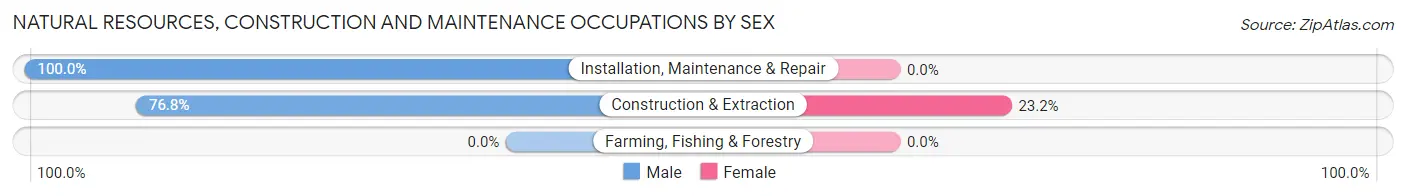
| Occupation | Male | Female |
| Farming, Fishing & Forestry | 0 (0.0%) | 0 (0.0%) |
| Construction & Extraction | 96 (76.8%) | 29 (23.2%) |
| Installation, Maintenance & Repair | 141 (100.0%) | 0 (0.0%) |
| Total (Category) | 237 (89.1%) | 29 (10.9%) |
| Total (Overall) | 1,160 (49.2%) | 1,198 (50.8%) |
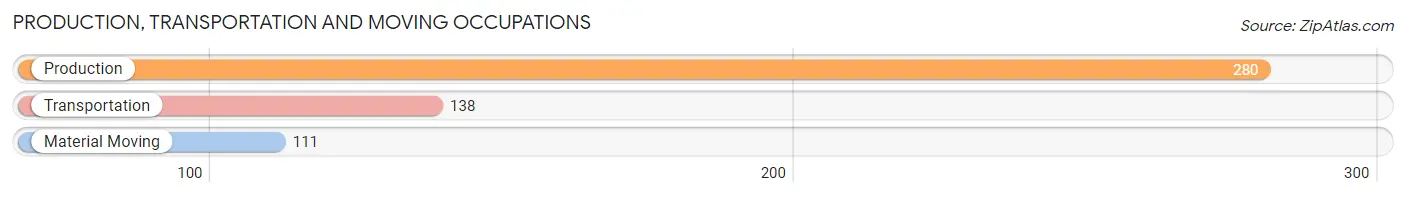
Production, Transportation and Moving Occupations
The most common Production, Transportation and Moving occupations in Prescott are Production (280 | 11.9%), Transportation (138 | 5.9%), and Material Moving (111 | 4.7%).
Production, Transportation and Moving Occupations by Sex
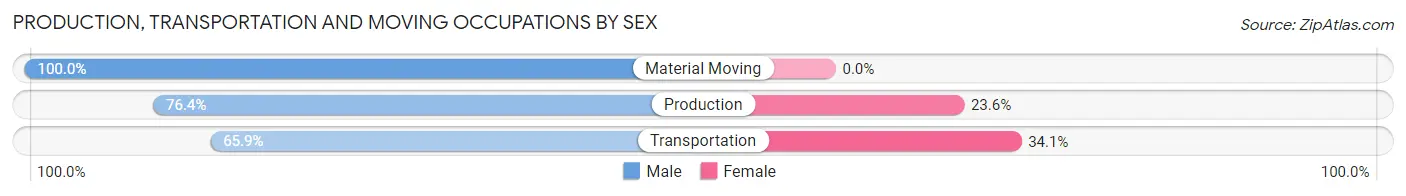
| Occupation | Male | Female |
| Production | 214 (76.4%) | 66 (23.6%) |
| Transportation | 91 (65.9%) | 47 (34.1%) |
| Material Moving | 111 (100.0%) | 0 (0.0%) |
| Total (Category) | 416 (78.6%) | 113 (21.4%) |
| Total (Overall) | 1,160 (49.2%) | 1,198 (50.8%) |
Employment Industries by Sex in Prescott
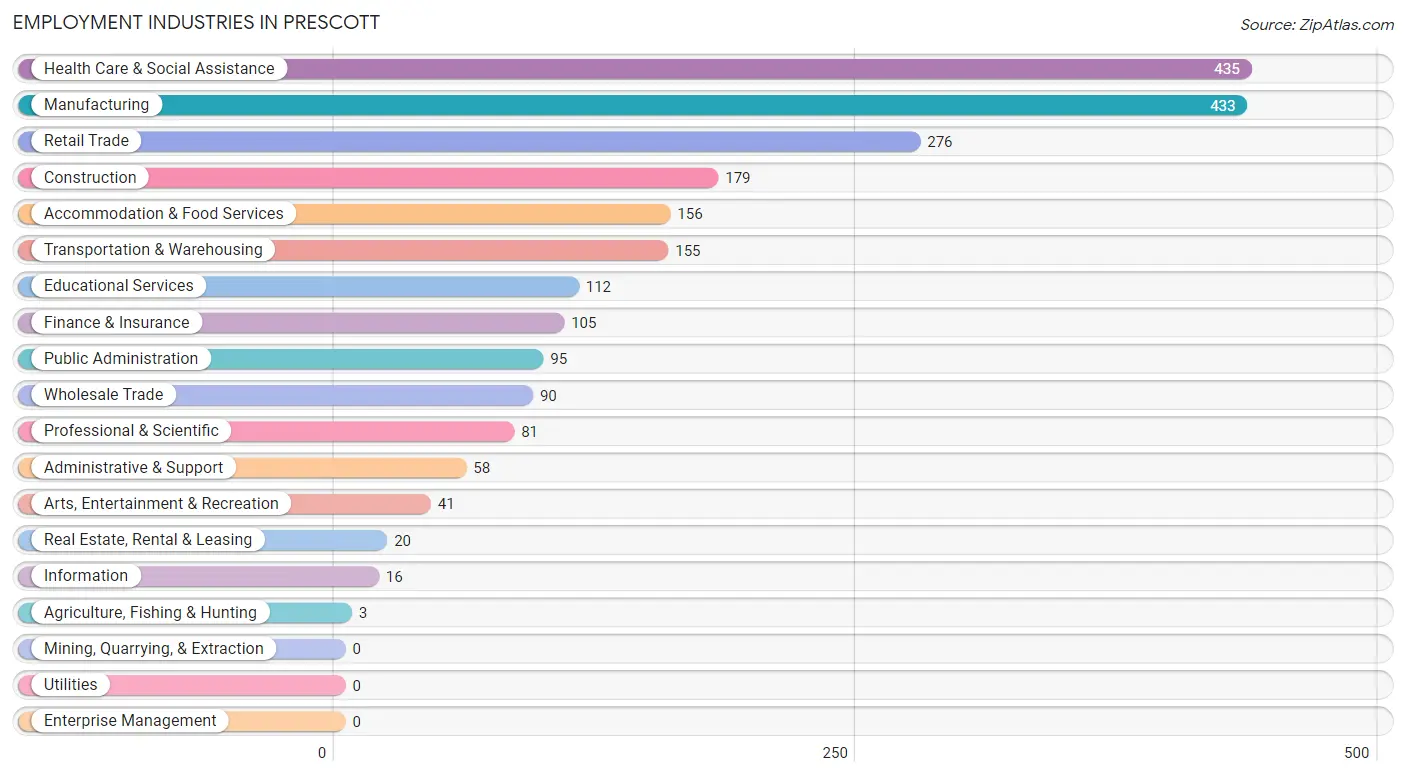
Employment Industries in Prescott
The major employment industries in Prescott include Health Care & Social Assistance (435 | 18.4%), Manufacturing (433 | 18.4%), Retail Trade (276 | 11.7%), Construction (179 | 7.6%), and Accommodation & Food Services (156 | 6.6%).
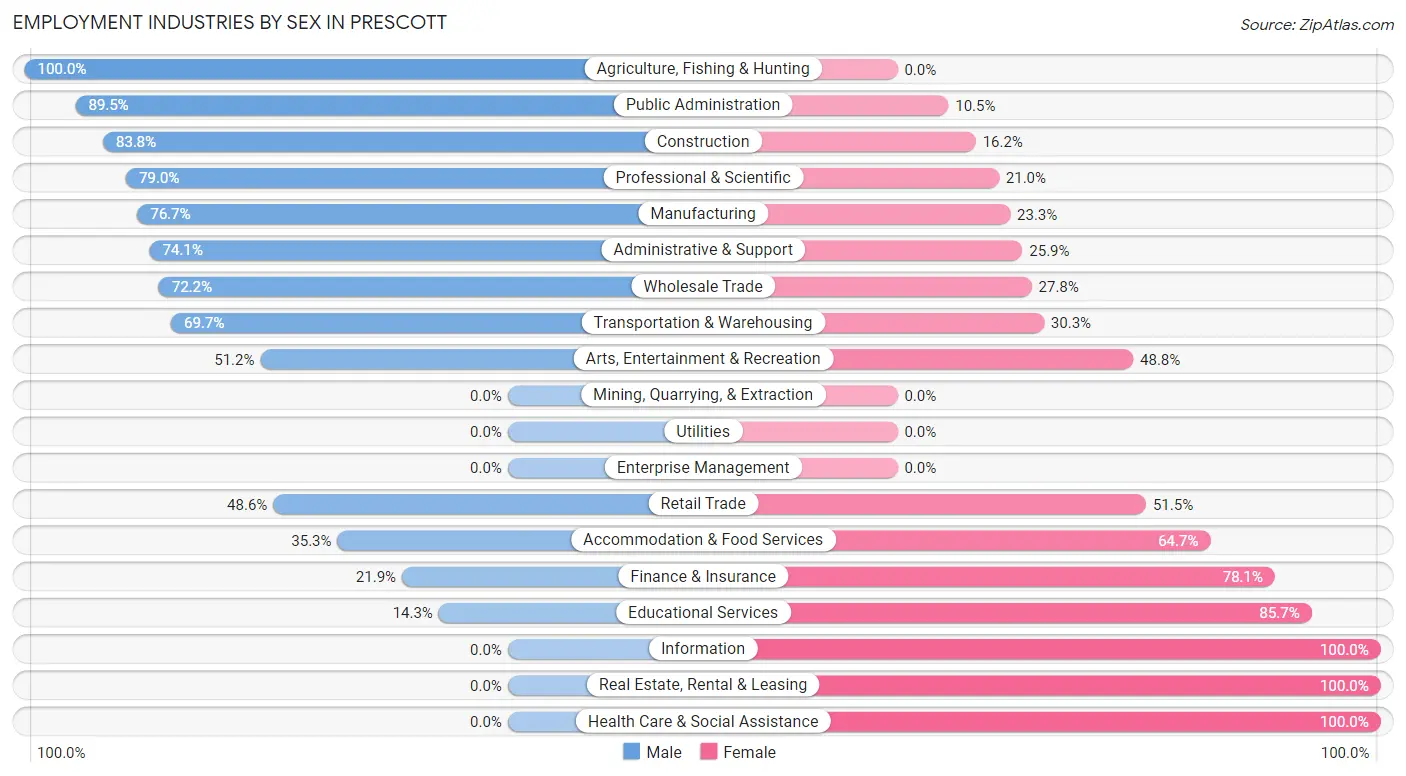
Employment Industries by Sex in Prescott
The Prescott industries that see more men than women are Agriculture, Fishing & Hunting (100.0%), Public Administration (89.5%), and Construction (83.8%), whereas the industries that tend to have a higher number of women are Information (100.0%), Real Estate, Rental & Leasing (100.0%), and Health Care & Social Assistance (100.0%).
| Industry | Male | Female |
| Agriculture, Fishing & Hunting | 3 (100.0%) | 0 (0.0%) |
| Mining, Quarrying, & Extraction | 0 (0.0%) | 0 (0.0%) |
| Construction | 150 (83.8%) | 29 (16.2%) |
| Manufacturing | 332 (76.7%) | 101 (23.3%) |
| Wholesale Trade | 65 (72.2%) | 25 (27.8%) |
| Retail Trade | 134 (48.5%) | 142 (51.4%) |
| Transportation & Warehousing | 108 (69.7%) | 47 (30.3%) |
| Utilities | 0 (0.0%) | 0 (0.0%) |
| Information | 0 (0.0%) | 16 (100.0%) |
| Finance & Insurance | 23 (21.9%) | 82 (78.1%) |
| Real Estate, Rental & Leasing | 0 (0.0%) | 20 (100.0%) |
| Professional & Scientific | 64 (79.0%) | 17 (21.0%) |
| Enterprise Management | 0 (0.0%) | 0 (0.0%) |
| Administrative & Support | 43 (74.1%) | 15 (25.9%) |
| Educational Services | 16 (14.3%) | 96 (85.7%) |
| Health Care & Social Assistance | 0 (0.0%) | 435 (100.0%) |
| Arts, Entertainment & Recreation | 21 (51.2%) | 20 (48.8%) |
| Accommodation & Food Services | 55 (35.3%) | 101 (64.7%) |
| Public Administration | 85 (89.5%) | 10 (10.5%) |
| Total | 1,160 (49.2%) | 1,198 (50.8%) |
Education in Prescott
School Enrollment in Prescott
The most common levels of schooling among the 794 students in Prescott are elementary school (207 | 26.1%), college / undergraduate (193 | 24.3%), and middle school (179 | 22.5%).
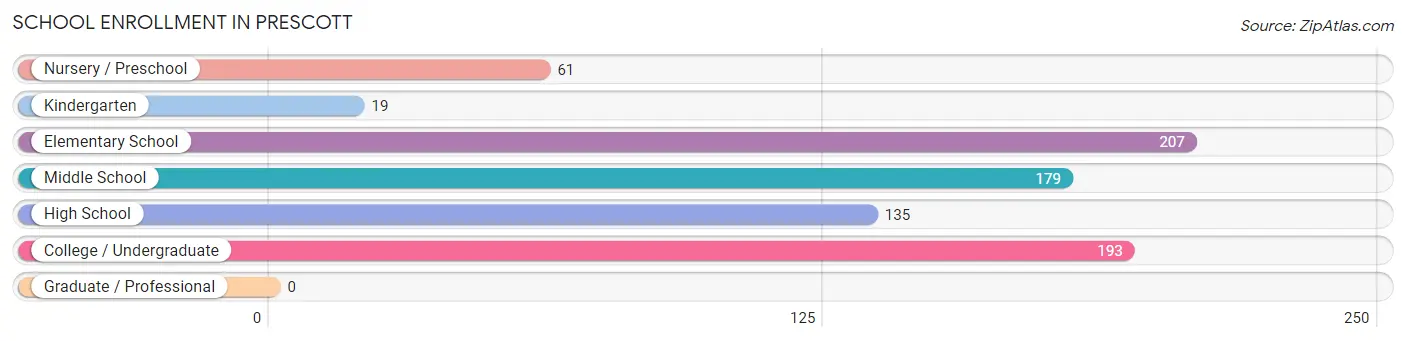
| School Level | # Students | % Students |
| Nursery / Preschool | 61 | 7.7% |
| Kindergarten | 19 | 2.4% |
| Elementary School | 207 | 26.1% |
| Middle School | 179 | 22.5% |
| High School | 135 | 17.0% |
| College / Undergraduate | 193 | 24.3% |
| Graduate / Professional | 0 | 0.0% |
| Total | 794 | 100.0% |
School Enrollment by Age by Funding Source in Prescott
Out of a total of 794 students who are enrolled in schools in Prescott, 77 (9.7%) attend a private institution, while the remaining 717 (90.3%) are enrolled in public schools. The age group of 5 to 9 year old has the highest likelihood of being enrolled in private schools, with 59 (22.2% in the age bracket) enrolled. Conversely, the age group of 3 to 4 year olds has the lowest likelihood of being enrolled in a private school, with 21 (100.0% in the age bracket) attending a public institution.
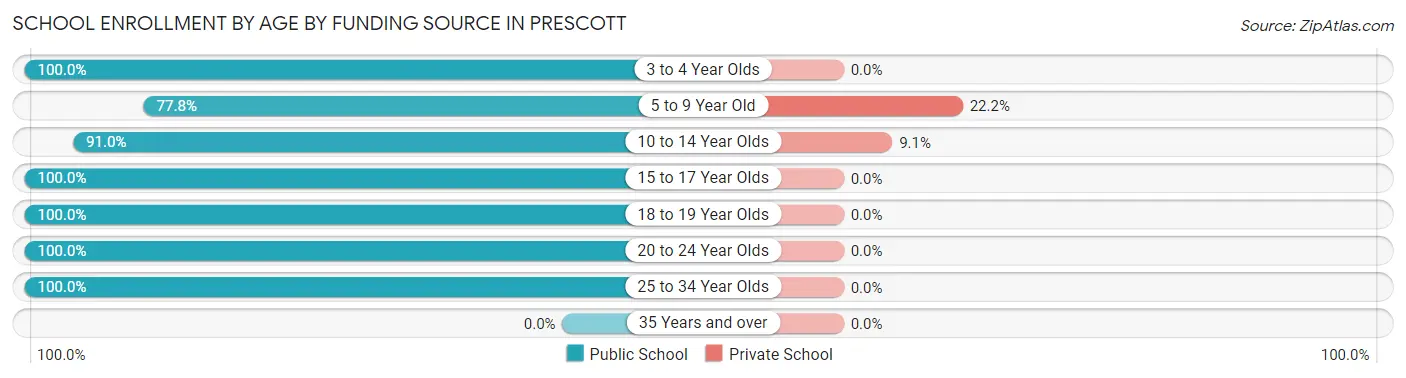
| Age Bracket | Public School | Private School |
| 3 to 4 Year Olds | 21 (100.0%) | 0 (0.0%) |
| 5 to 9 Year Old | 207 (77.8%) | 59 (22.2%) |
| 10 to 14 Year Olds | 181 (90.9%) | 18 (9.0%) |
| 15 to 17 Year Olds | 104 (100.0%) | 0 (0.0%) |
| 18 to 19 Year Olds | 29 (100.0%) | 0 (0.0%) |
| 20 to 24 Year Olds | 113 (100.0%) | 0 (0.0%) |
| 25 to 34 Year Olds | 62 (100.0%) | 0 (0.0%) |
| 35 Years and over | 0 (0.0%) | 0 (0.0%) |
| Total | 717 (90.3%) | 77 (9.7%) |
Educational Attainment by Field of Study in Prescott
Business (268 | 31.9%), education (192 | 22.9%), social sciences (92 | 11.0%), bio, nature & agricultural (71 | 8.5%), and science & technology (69 | 8.2%) are the most common fields of study among 840 individuals in Prescott who have obtained a bachelor's degree or higher.
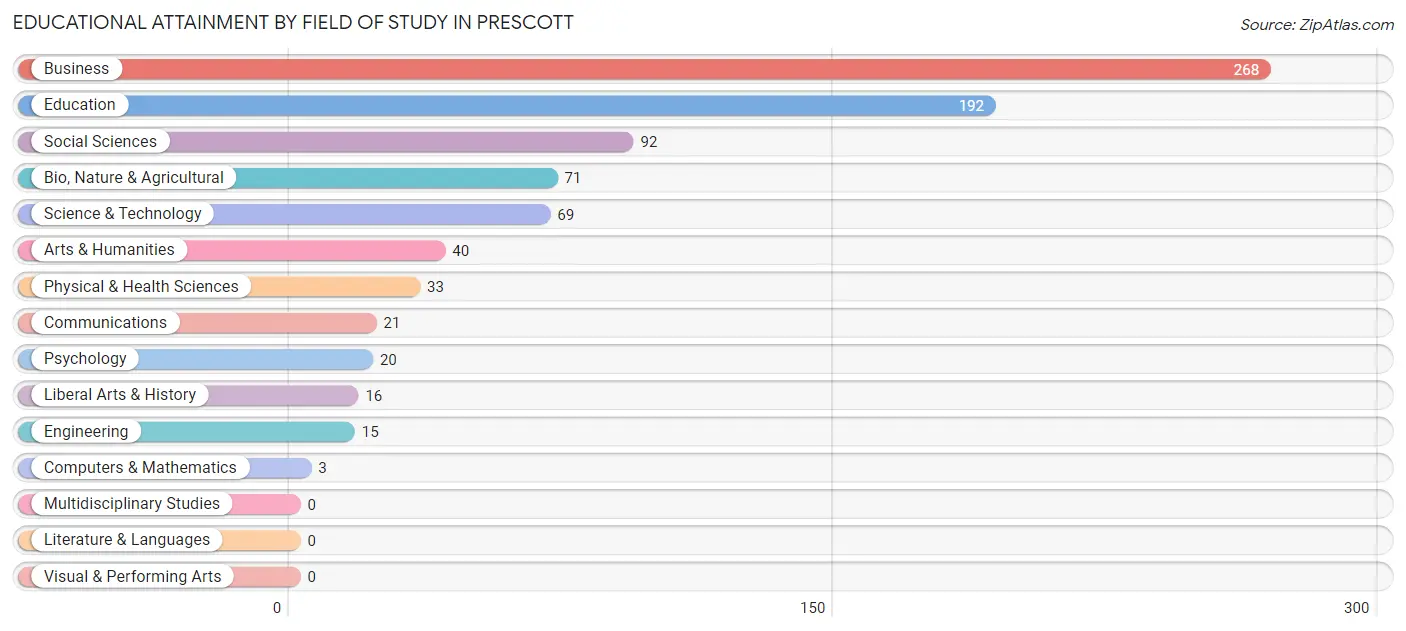
| Field of Study | # Graduates | % Graduates |
| Computers & Mathematics | 3 | 0.4% |
| Bio, Nature & Agricultural | 71 | 8.5% |
| Physical & Health Sciences | 33 | 3.9% |
| Psychology | 20 | 2.4% |
| Social Sciences | 92 | 11.0% |
| Engineering | 15 | 1.8% |
| Multidisciplinary Studies | 0 | 0.0% |
| Science & Technology | 69 | 8.2% |
| Business | 268 | 31.9% |
| Education | 192 | 22.9% |
| Literature & Languages | 0 | 0.0% |
| Liberal Arts & History | 16 | 1.9% |
| Visual & Performing Arts | 0 | 0.0% |
| Communications | 21 | 2.5% |
| Arts & Humanities | 40 | 4.8% |
| Total | 840 | 100.0% |
Transportation & Commute in Prescott
Vehicle Availability by Sex in Prescott
The most prevalent vehicle ownership categories in Prescott are males with 2 vehicles (565, accounting for 51.2%) and females with 2 vehicles (545, making up 52.5%).
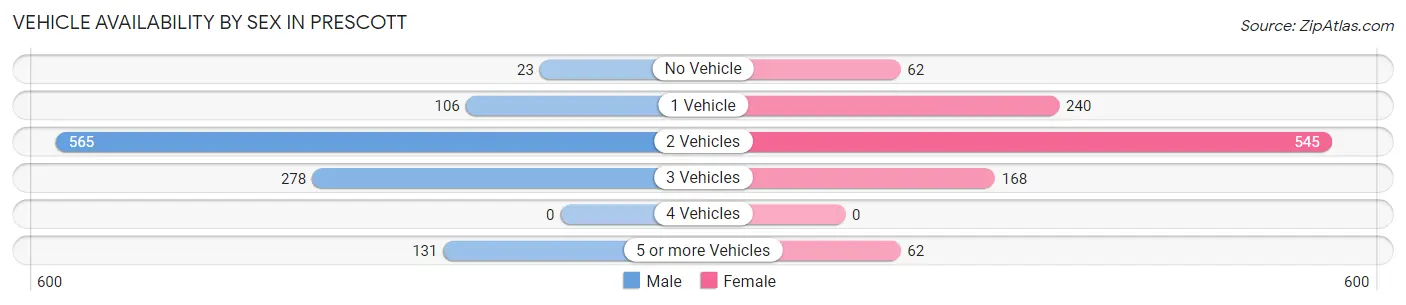
| Vehicles Available | Male | Female |
| No Vehicle | 23 (2.1%) | 62 (5.8%) |
| 1 Vehicle | 106 (9.6%) | 240 (22.3%) |
| 2 Vehicles | 565 (51.2%) | 545 (50.6%) |
| 3 Vehicles | 278 (25.2%) | 168 (15.6%) |
| 4 Vehicles | 0 (0.0%) | 0 (0.0%) |
| 5 or more Vehicles | 131 (11.9%) | 62 (5.8%) |
| Total | 1,103 (100.0%) | 1,077 (100.0%) |
Commute Time in Prescott
The most frequently occuring commute durations in Prescott are 20 to 24 minutes (334 commuters, 17.3%), 5 to 9 minutes (295 commuters, 15.3%), and 30 to 34 minutes (250 commuters, 13.0%).
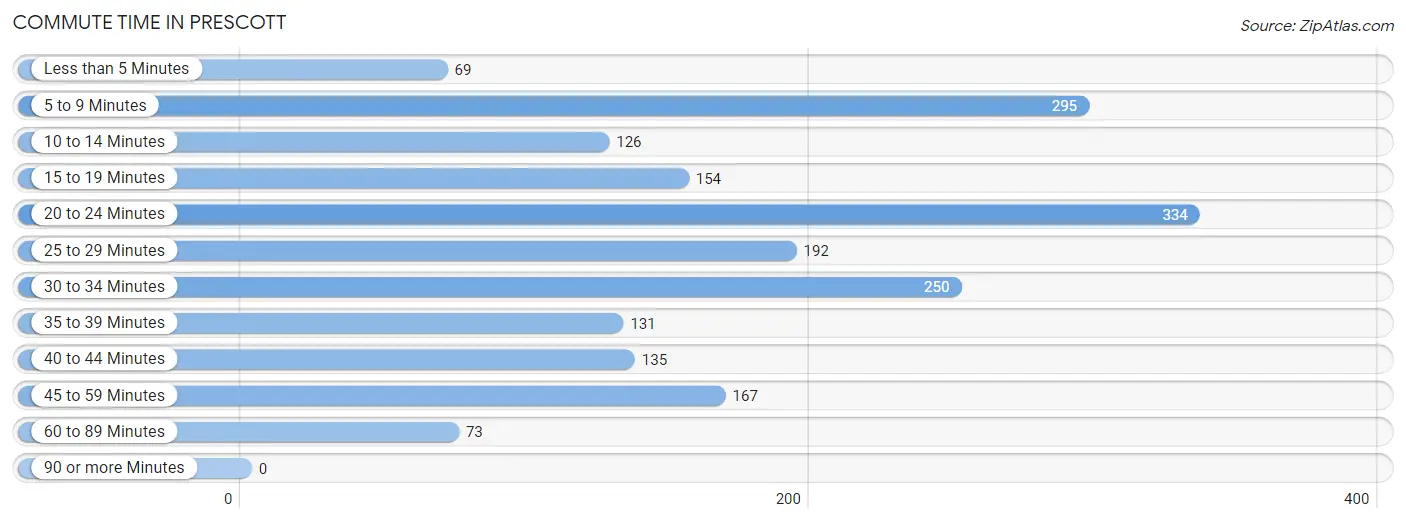
| Commute Time | # Commuters | % Commuters |
| Less than 5 Minutes | 69 | 3.6% |
| 5 to 9 Minutes | 295 | 15.3% |
| 10 to 14 Minutes | 126 | 6.5% |
| 15 to 19 Minutes | 154 | 8.0% |
| 20 to 24 Minutes | 334 | 17.3% |
| 25 to 29 Minutes | 192 | 10.0% |
| 30 to 34 Minutes | 250 | 13.0% |
| 35 to 39 Minutes | 131 | 6.8% |
| 40 to 44 Minutes | 135 | 7.0% |
| 45 to 59 Minutes | 167 | 8.7% |
| 60 to 89 Minutes | 73 | 3.8% |
| 90 or more Minutes | 0 | 0.0% |
Commute Time by Sex in Prescott
The most common commute times in Prescott are 30 to 34 minutes (210 commuters, 21.0%) for males and 20 to 24 minutes (291 commuters, 31.5%) for females.
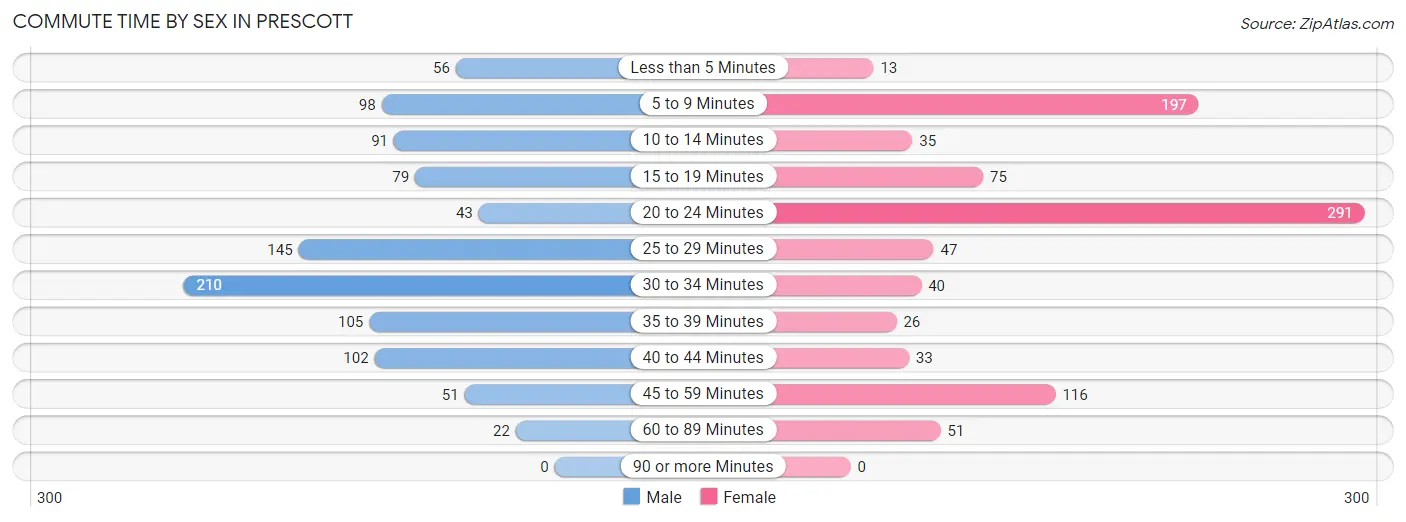
| Commute Time | Male | Female |
| Less than 5 Minutes | 56 (5.6%) | 13 (1.4%) |
| 5 to 9 Minutes | 98 (9.8%) | 197 (21.3%) |
| 10 to 14 Minutes | 91 (9.1%) | 35 (3.8%) |
| 15 to 19 Minutes | 79 (7.9%) | 75 (8.1%) |
| 20 to 24 Minutes | 43 (4.3%) | 291 (31.5%) |
| 25 to 29 Minutes | 145 (14.5%) | 47 (5.1%) |
| 30 to 34 Minutes | 210 (21.0%) | 40 (4.3%) |
| 35 to 39 Minutes | 105 (10.5%) | 26 (2.8%) |
| 40 to 44 Minutes | 102 (10.2%) | 33 (3.6%) |
| 45 to 59 Minutes | 51 (5.1%) | 116 (12.6%) |
| 60 to 89 Minutes | 22 (2.2%) | 51 (5.5%) |
| 90 or more Minutes | 0 (0.0%) | 0 (0.0%) |
Time of Departure to Work by Sex in Prescott
The most frequent times of departure to work in Prescott are 5:30 AM to 5:59 AM (221, 22.1%) for males and 6:00 AM to 6:29 AM (210, 22.7%) for females.
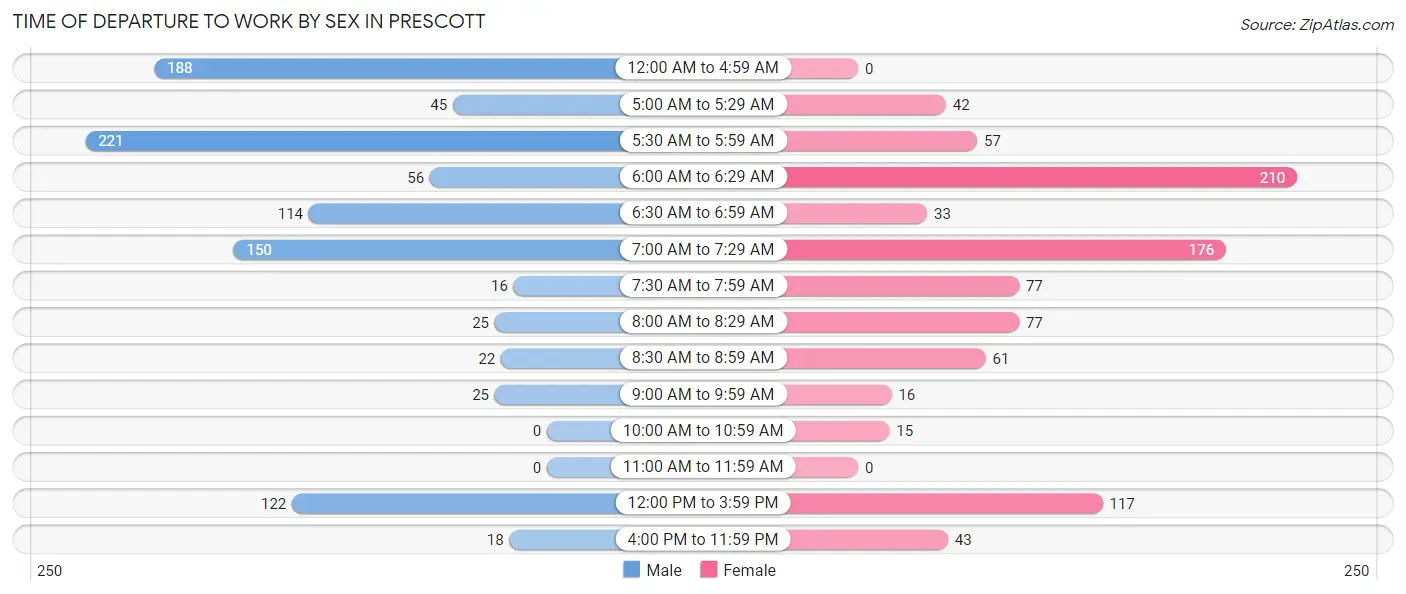
| Time of Departure | Male | Female |
| 12:00 AM to 4:59 AM | 188 (18.8%) | 0 (0.0%) |
| 5:00 AM to 5:29 AM | 45 (4.5%) | 42 (4.5%) |
| 5:30 AM to 5:59 AM | 221 (22.1%) | 57 (6.2%) |
| 6:00 AM to 6:29 AM | 56 (5.6%) | 210 (22.7%) |
| 6:30 AM to 6:59 AM | 114 (11.4%) | 33 (3.6%) |
| 7:00 AM to 7:29 AM | 150 (15.0%) | 176 (19.1%) |
| 7:30 AM to 7:59 AM | 16 (1.6%) | 77 (8.3%) |
| 8:00 AM to 8:29 AM | 25 (2.5%) | 77 (8.3%) |
| 8:30 AM to 8:59 AM | 22 (2.2%) | 61 (6.6%) |
| 9:00 AM to 9:59 AM | 25 (2.5%) | 16 (1.7%) |
| 10:00 AM to 10:59 AM | 0 (0.0%) | 15 (1.6%) |
| 11:00 AM to 11:59 AM | 0 (0.0%) | 0 (0.0%) |
| 12:00 PM to 3:59 PM | 122 (12.2%) | 117 (12.7%) |
| 4:00 PM to 11:59 PM | 18 (1.8%) | 43 (4.6%) |
| Total | 1,002 (100.0%) | 924 (100.0%) |
Housing Occupancy in Prescott
Occupancy by Ownership in Prescott
Of the total 1,910 dwellings in Prescott, owner-occupied units account for 1,260 (66.0%), while renter-occupied units make up 650 (34.0%).
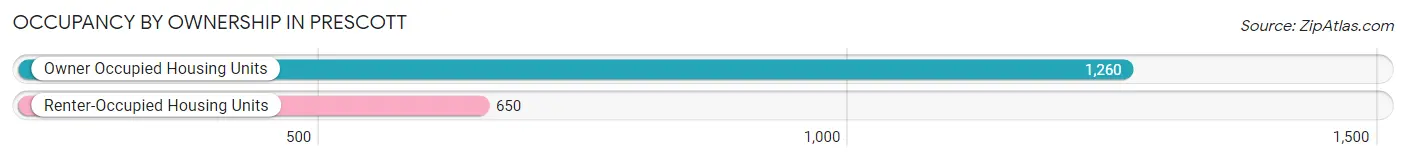
| Occupancy | # Housing Units | % Housing Units |
| Owner Occupied Housing Units | 1,260 | 66.0% |
| Renter-Occupied Housing Units | 650 | 34.0% |
| Total Occupied Housing Units | 1,910 | 100.0% |
Occupancy by Household Size in Prescott
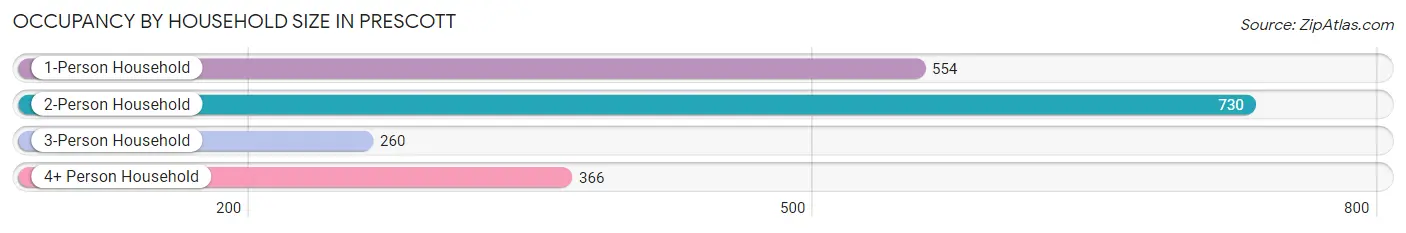
| Household Size | # Housing Units | % Housing Units |
| 1-Person Household | 554 | 29.0% |
| 2-Person Household | 730 | 38.2% |
| 3-Person Household | 260 | 13.6% |
| 4+ Person Household | 366 | 19.2% |
| Total Housing Units | 1,910 | 100.0% |
Occupancy by Ownership by Household Size in Prescott
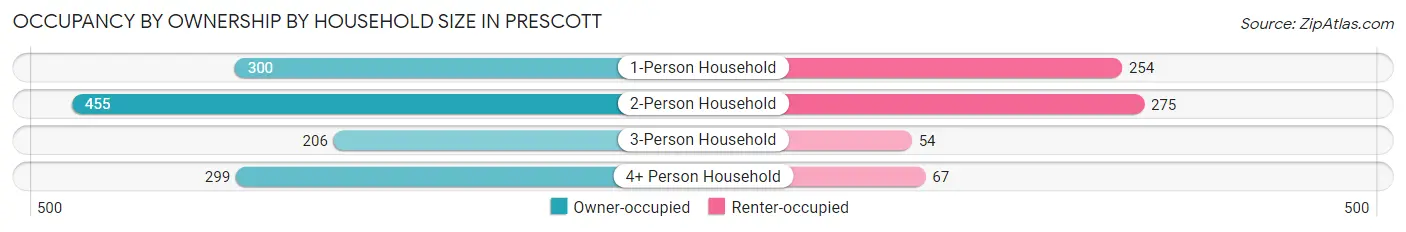
| Household Size | Owner-occupied | Renter-occupied |
| 1-Person Household | 300 (54.1%) | 254 (45.9%) |
| 2-Person Household | 455 (62.3%) | 275 (37.7%) |
| 3-Person Household | 206 (79.2%) | 54 (20.8%) |
| 4+ Person Household | 299 (81.7%) | 67 (18.3%) |
| Total Housing Units | 1,260 (66.0%) | 650 (34.0%) |
Occupancy by Educational Attainment in Prescott
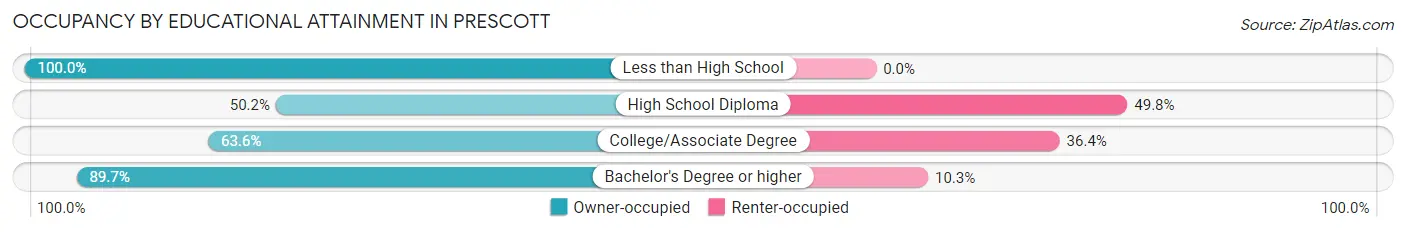
| Household Size | Owner-occupied | Renter-occupied |
| Less than High School | 29 (100.0%) | 0 (0.0%) |
| High School Diploma | 384 (50.2%) | 381 (49.8%) |
| College/Associate Degree | 376 (63.6%) | 215 (36.4%) |
| Bachelor's Degree or higher | 471 (89.7%) | 54 (10.3%) |
Occupancy by Age of Householder in Prescott
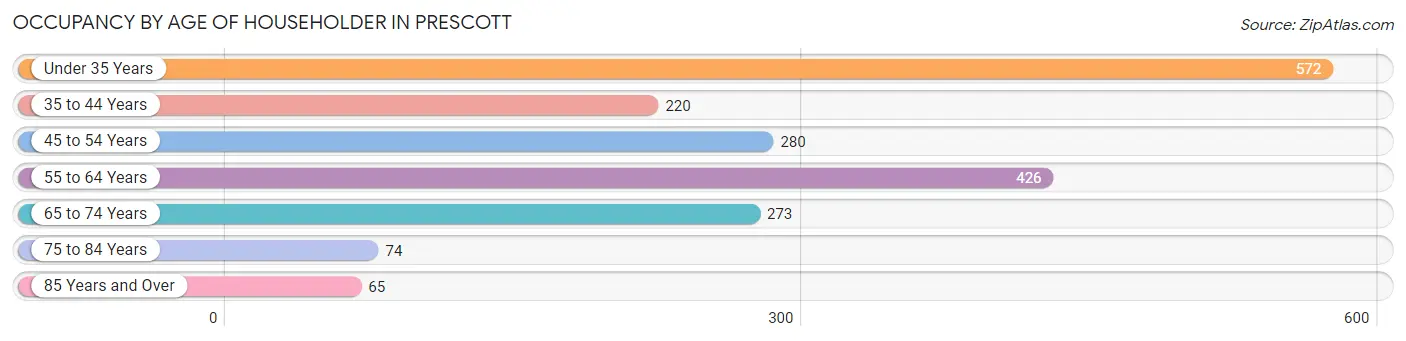
| Age Bracket | # Households | % Households |
| Under 35 Years | 572 | 29.9% |
| 35 to 44 Years | 220 | 11.5% |
| 45 to 54 Years | 280 | 14.7% |
| 55 to 64 Years | 426 | 22.3% |
| 65 to 74 Years | 273 | 14.3% |
| 75 to 84 Years | 74 | 3.9% |
| 85 Years and Over | 65 | 3.4% |
| Total | 1,910 | 100.0% |
Housing Finances in Prescott
Median Income by Occupancy in Prescott
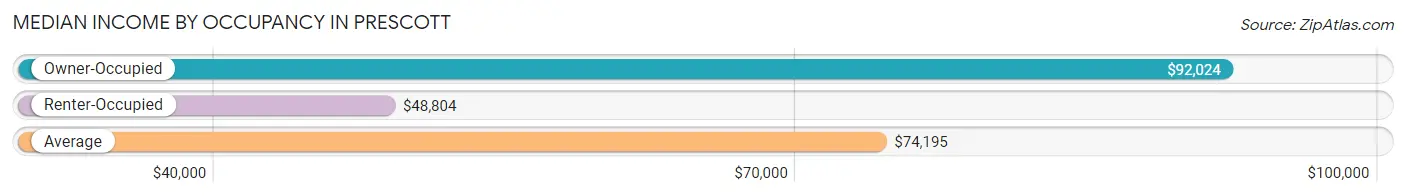
| Occupancy Type | # Households | Median Income |
| Owner-Occupied | 1,260 (66.0%) | $92,024 |
| Renter-Occupied | 650 (34.0%) | $48,804 |
| Average | 1,910 (100.0%) | $74,195 |
Occupancy by Householder Income Bracket in Prescott
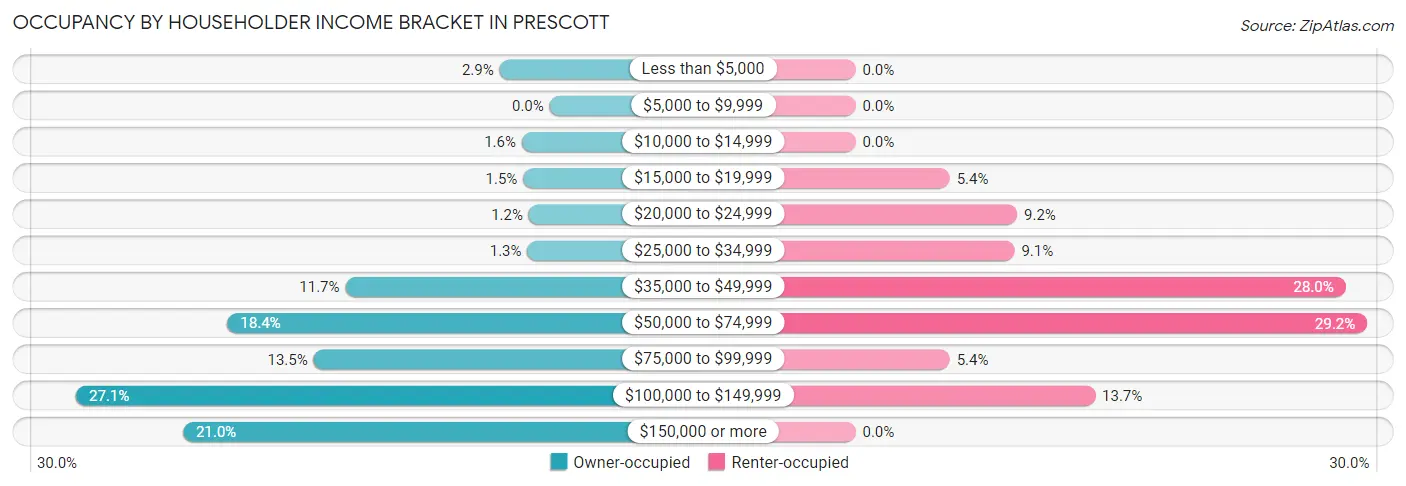
| Income Bracket | Owner-occupied | Renter-occupied |
| Less than $5,000 | 36 (2.9%) | 0 (0.0%) |
| $5,000 to $9,999 | 0 (0.0%) | 0 (0.0%) |
| $10,000 to $14,999 | 20 (1.6%) | 0 (0.0%) |
| $15,000 to $19,999 | 19 (1.5%) | 35 (5.4%) |
| $20,000 to $24,999 | 15 (1.2%) | 60 (9.2%) |
| $25,000 to $34,999 | 16 (1.3%) | 59 (9.1%) |
| $35,000 to $49,999 | 147 (11.7%) | 182 (28.0%) |
| $50,000 to $74,999 | 232 (18.4%) | 190 (29.2%) |
| $75,000 to $99,999 | 170 (13.5%) | 35 (5.4%) |
| $100,000 to $149,999 | 341 (27.1%) | 89 (13.7%) |
| $150,000 or more | 264 (20.9%) | 0 (0.0%) |
| Total | 1,260 (100.0%) | 650 (100.0%) |
Monthly Housing Cost Tiers in Prescott
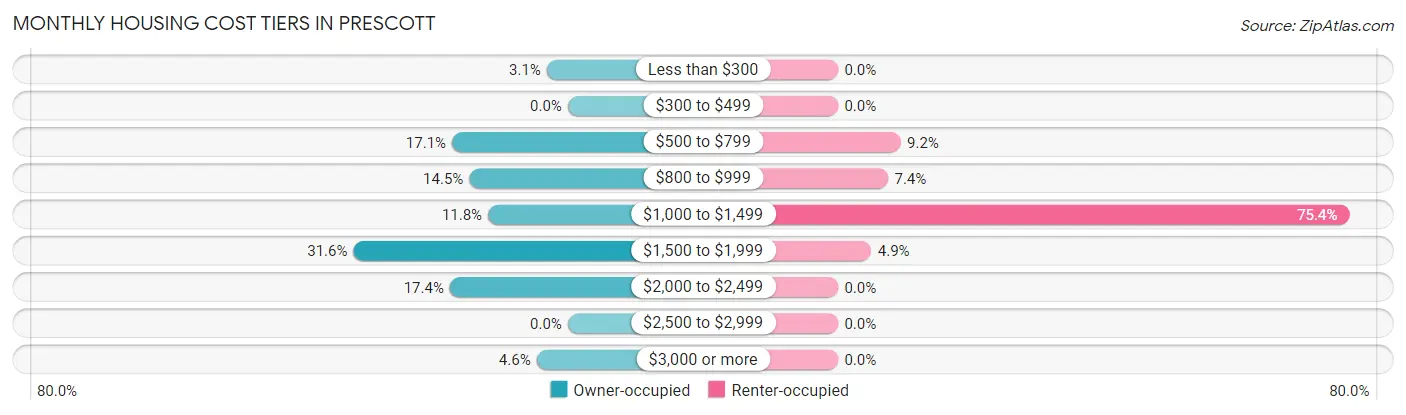
| Monthly Cost | Owner-occupied | Renter-occupied |
| Less than $300 | 39 (3.1%) | 0 (0.0%) |
| $300 to $499 | 0 (0.0%) | 0 (0.0%) |
| $500 to $799 | 215 (17.1%) | 60 (9.2%) |
| $800 to $999 | 183 (14.5%) | 48 (7.4%) |
| $1,000 to $1,499 | 148 (11.7%) | 490 (75.4%) |
| $1,500 to $1,999 | 398 (31.6%) | 32 (4.9%) |
| $2,000 to $2,499 | 219 (17.4%) | 0 (0.0%) |
| $2,500 to $2,999 | 0 (0.0%) | 0 (0.0%) |
| $3,000 or more | 58 (4.6%) | 0 (0.0%) |
| Total | 1,260 (100.0%) | 650 (100.0%) |
Physical Housing Characteristics in Prescott
Housing Structures in Prescott
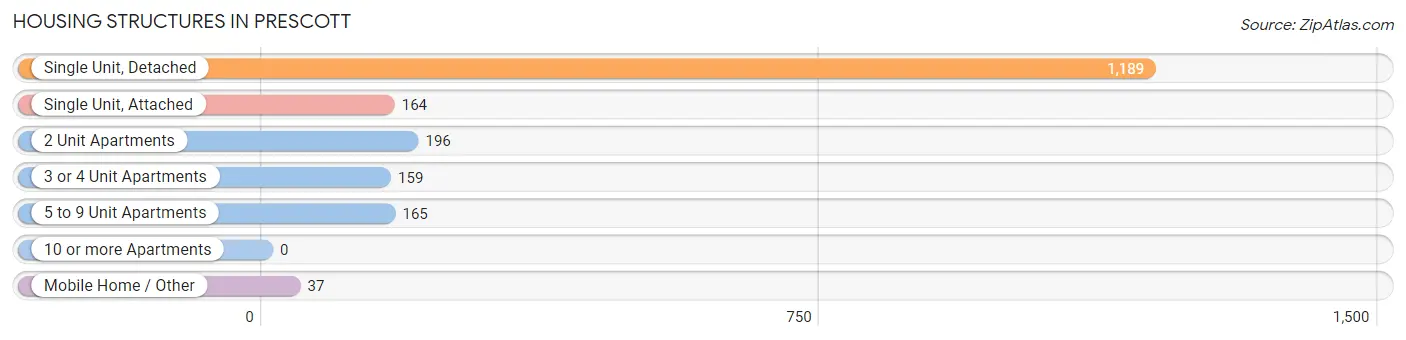
| Structure Type | # Housing Units | % Housing Units |
| Single Unit, Detached | 1,189 | 62.3% |
| Single Unit, Attached | 164 | 8.6% |
| 2 Unit Apartments | 196 | 10.3% |
| 3 or 4 Unit Apartments | 159 | 8.3% |
| 5 to 9 Unit Apartments | 165 | 8.6% |
| 10 or more Apartments | 0 | 0.0% |
| Mobile Home / Other | 37 | 1.9% |
| Total | 1,910 | 100.0% |
Housing Structures by Occupancy in Prescott
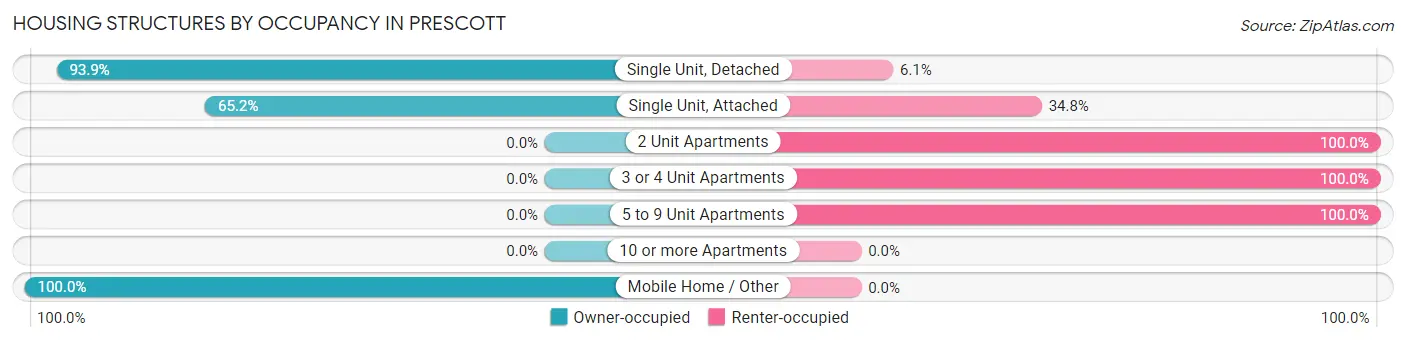
| Structure Type | Owner-occupied | Renter-occupied |
| Single Unit, Detached | 1,116 (93.9%) | 73 (6.1%) |
| Single Unit, Attached | 107 (65.2%) | 57 (34.8%) |
| 2 Unit Apartments | 0 (0.0%) | 196 (100.0%) |
| 3 or 4 Unit Apartments | 0 (0.0%) | 159 (100.0%) |
| 5 to 9 Unit Apartments | 0 (0.0%) | 165 (100.0%) |
| 10 or more Apartments | 0 (0.0%) | 0 (0.0%) |
| Mobile Home / Other | 37 (100.0%) | 0 (0.0%) |
| Total | 1,260 (66.0%) | 650 (34.0%) |
Housing Structures by Number of Rooms in Prescott
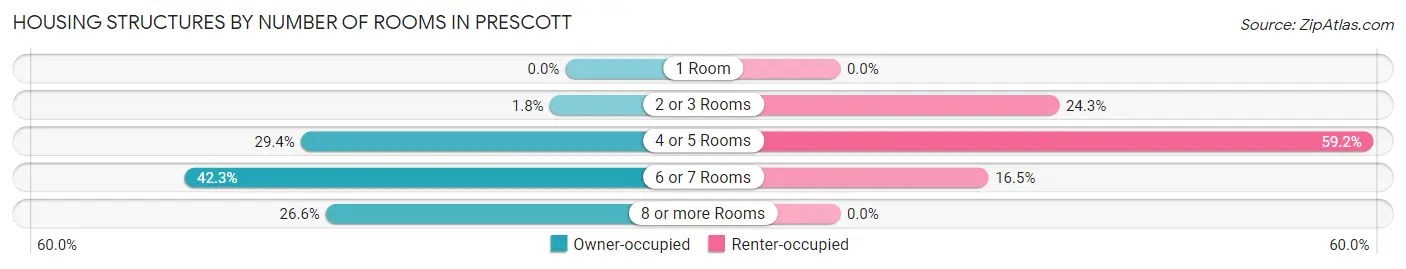
| Number of Rooms | Owner-occupied | Renter-occupied |
| 1 Room | 0 (0.0%) | 0 (0.0%) |
| 2 or 3 Rooms | 22 (1.8%) | 158 (24.3%) |
| 4 or 5 Rooms | 370 (29.4%) | 385 (59.2%) |
| 6 or 7 Rooms | 533 (42.3%) | 107 (16.5%) |
| 8 or more Rooms | 335 (26.6%) | 0 (0.0%) |
| Total | 1,260 (100.0%) | 650 (100.0%) |
Housing Structure by Heating Type in Prescott
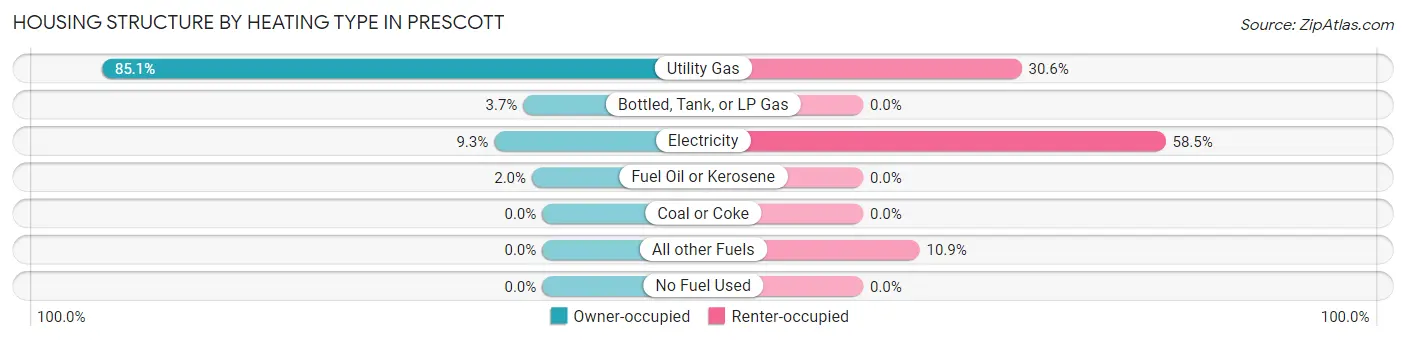
| Heating Type | Owner-occupied | Renter-occupied |
| Utility Gas | 1,072 (85.1%) | 199 (30.6%) |
| Bottled, Tank, or LP Gas | 46 (3.6%) | 0 (0.0%) |
| Electricity | 117 (9.3%) | 380 (58.5%) |
| Fuel Oil or Kerosene | 25 (2.0%) | 0 (0.0%) |
| Coal or Coke | 0 (0.0%) | 0 (0.0%) |
| All other Fuels | 0 (0.0%) | 71 (10.9%) |
| No Fuel Used | 0 (0.0%) | 0 (0.0%) |
| Total | 1,260 (100.0%) | 650 (100.0%) |
Household Vehicle Usage in Prescott
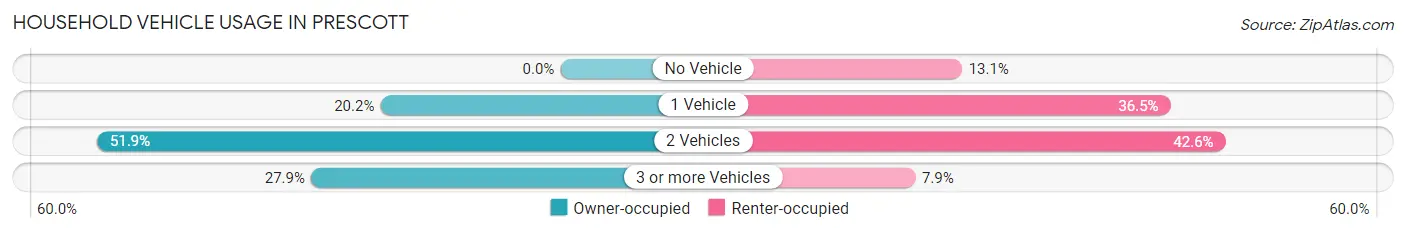
| Vehicles per Household | Owner-occupied | Renter-occupied |
| No Vehicle | 0 (0.0%) | 85 (13.1%) |
| 1 Vehicle | 254 (20.2%) | 237 (36.5%) |
| 2 Vehicles | 654 (51.9%) | 277 (42.6%) |
| 3 or more Vehicles | 352 (27.9%) | 51 (7.9%) |
| Total | 1,260 (100.0%) | 650 (100.0%) |
Real Estate & Mortgages in Prescott
Real Estate and Mortgage Overview in Prescott
| Characteristic | Without Mortgage | With Mortgage |
| Housing Units | 458 | 802 |
| Median Property Value | $242,700 | $250,200 |
| Median Household Income | $66,538 | $179 |
| Monthly Housing Costs | $800 | $58 |
| Real Estate Taxes | $6,021 | $0 |
Property Value by Mortgage Status in Prescott
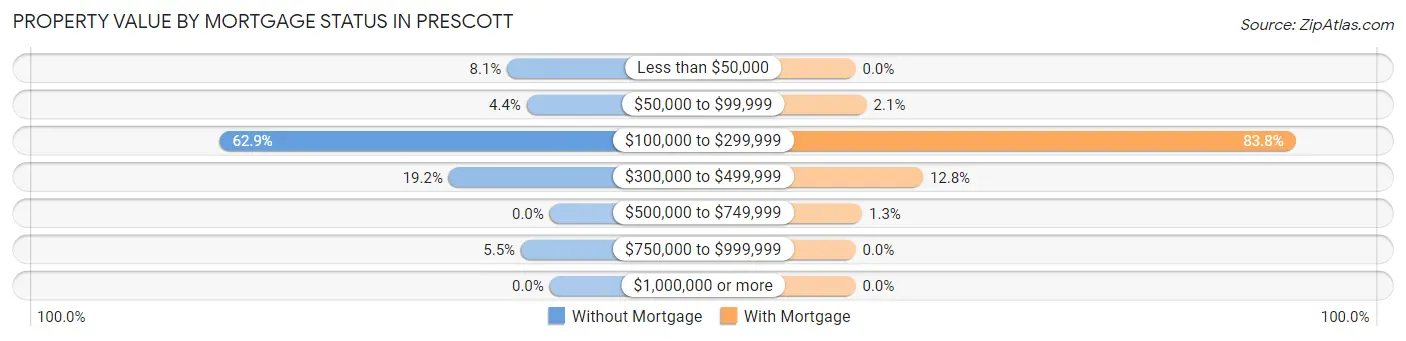
| Property Value | Without Mortgage | With Mortgage |
| Less than $50,000 | 37 (8.1%) | 0 (0.0%) |
| $50,000 to $99,999 | 20 (4.4%) | 17 (2.1%) |
| $100,000 to $299,999 | 288 (62.9%) | 672 (83.8%) |
| $300,000 to $499,999 | 88 (19.2%) | 103 (12.8%) |
| $500,000 to $749,999 | 0 (0.0%) | 10 (1.3%) |
| $750,000 to $999,999 | 25 (5.5%) | 0 (0.0%) |
| $1,000,000 or more | 0 (0.0%) | 0 (0.0%) |
| Total | 458 (100.0%) | 802 (100.0%) |
Household Income by Mortgage Status in Prescott
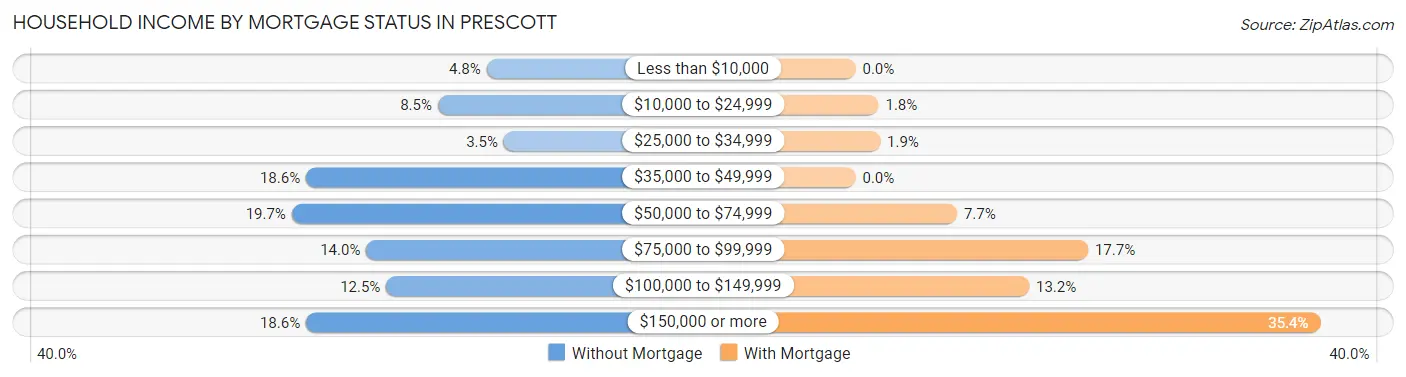
| Household Income | Without Mortgage | With Mortgage |
| Less than $10,000 | 22 (4.8%) | 0 (0.0%) |
| $10,000 to $24,999 | 39 (8.5%) | 14 (1.8%) |
| $25,000 to $34,999 | 16 (3.5%) | 15 (1.9%) |
| $35,000 to $49,999 | 85 (18.6%) | 0 (0.0%) |
| $50,000 to $74,999 | 90 (19.7%) | 62 (7.7%) |
| $75,000 to $99,999 | 64 (14.0%) | 142 (17.7%) |
| $100,000 to $149,999 | 57 (12.4%) | 106 (13.2%) |
| $150,000 or more | 85 (18.6%) | 284 (35.4%) |
| Total | 458 (100.0%) | 802 (100.0%) |
Property Value to Household Income Ratio in Prescott
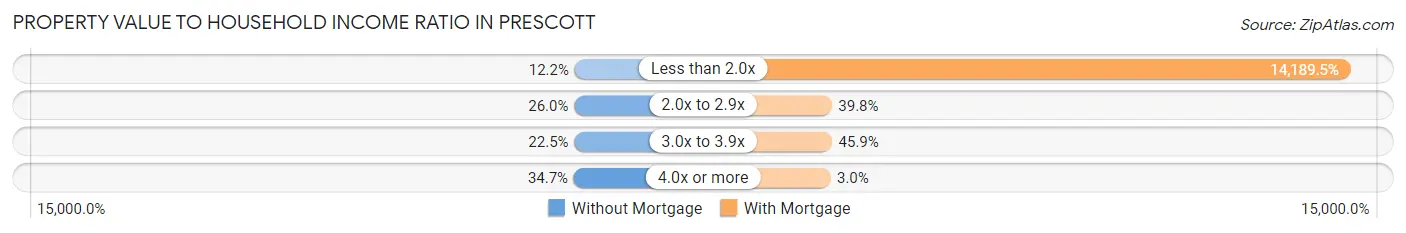
| Value-to-Income Ratio | Without Mortgage | With Mortgage |
| Less than 2.0x | 56 (12.2%) | 113,800 (14,189.5%) |
| 2.0x to 2.9x | 119 (26.0%) | 319 (39.8%) |
| 3.0x to 3.9x | 103 (22.5%) | 368 (45.9%) |
| 4.0x or more | 159 (34.7%) | 24 (3.0%) |
| Total | 458 (100.0%) | 802 (100.0%) |
Real Estate Taxes by Mortgage Status in Prescott
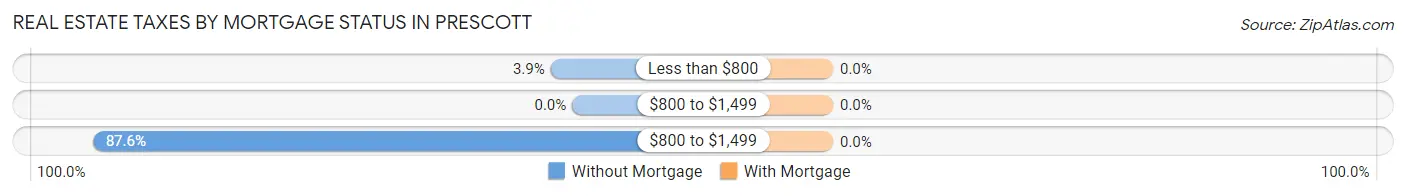
| Property Taxes | Without Mortgage | With Mortgage |
| Less than $800 | 18 (3.9%) | 0 (0.0%) |
| $800 to $1,499 | 0 (0.0%) | 0 (0.0%) |
| $800 to $1,499 | 401 (87.5%) | 0 (0.0%) |
| Total | 458 (100.0%) | 802 (100.0%) |
Health & Disability in Prescott
Health Insurance Coverage by Age in Prescott
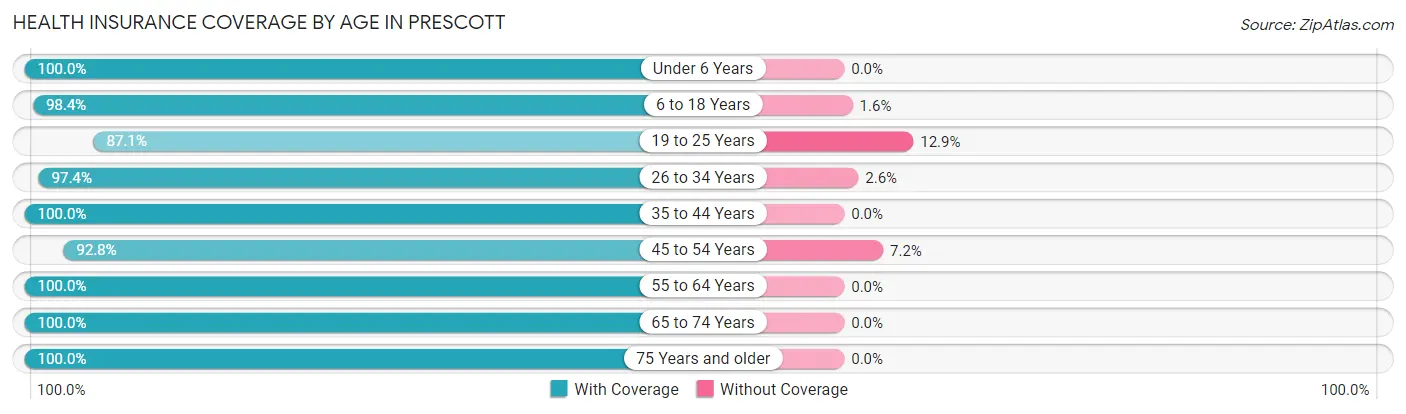
| Age Bracket | With Coverage | Without Coverage |
| Under 6 Years | 380 (100.0%) | 0 (0.0%) |
| 6 to 18 Years | 567 (98.4%) | 9 (1.6%) |
| 19 to 25 Years | 298 (87.1%) | 44 (12.9%) |
| 26 to 34 Years | 743 (97.4%) | 20 (2.6%) |
| 35 to 44 Years | 505 (100.0%) | 0 (0.0%) |
| 45 to 54 Years | 321 (92.8%) | 25 (7.2%) |
| 55 to 64 Years | 678 (100.0%) | 0 (0.0%) |
| 65 to 74 Years | 492 (100.0%) | 0 (0.0%) |
| 75 Years and older | 201 (100.0%) | 0 (0.0%) |
| Total | 4,185 (97.7%) | 98 (2.3%) |
Health Insurance Coverage by Citizenship Status in Prescott
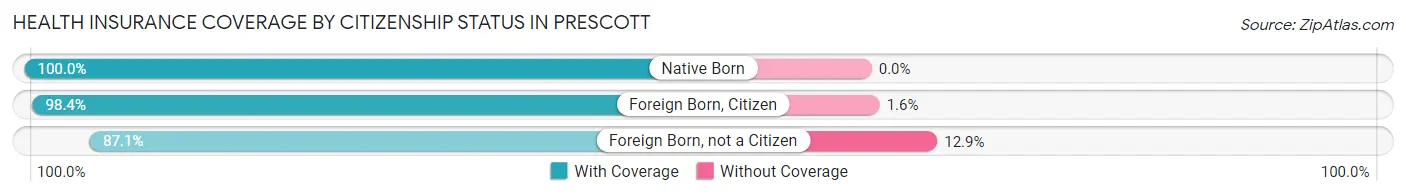
| Citizenship Status | With Coverage | Without Coverage |
| Native Born | 380 (100.0%) | 0 (0.0%) |
| Foreign Born, Citizen | 567 (98.4%) | 9 (1.6%) |
| Foreign Born, not a Citizen | 298 (87.1%) | 44 (12.9%) |
Health Insurance Coverage by Household Income in Prescott
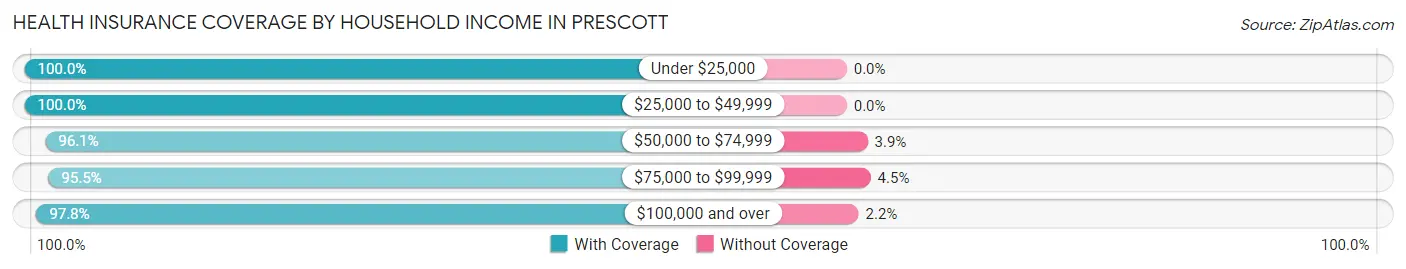
| Household Income | With Coverage | Without Coverage |
| Under $25,000 | 325 (100.0%) | 0 (0.0%) |
| $25,000 to $49,999 | 636 (100.0%) | 0 (0.0%) |
| $50,000 to $74,999 | 838 (96.1%) | 34 (3.9%) |
| $75,000 to $99,999 | 427 (95.5%) | 20 (4.5%) |
| $100,000 and over | 1,950 (97.8%) | 44 (2.2%) |
Public vs Private Health Insurance Coverage by Age in Prescott
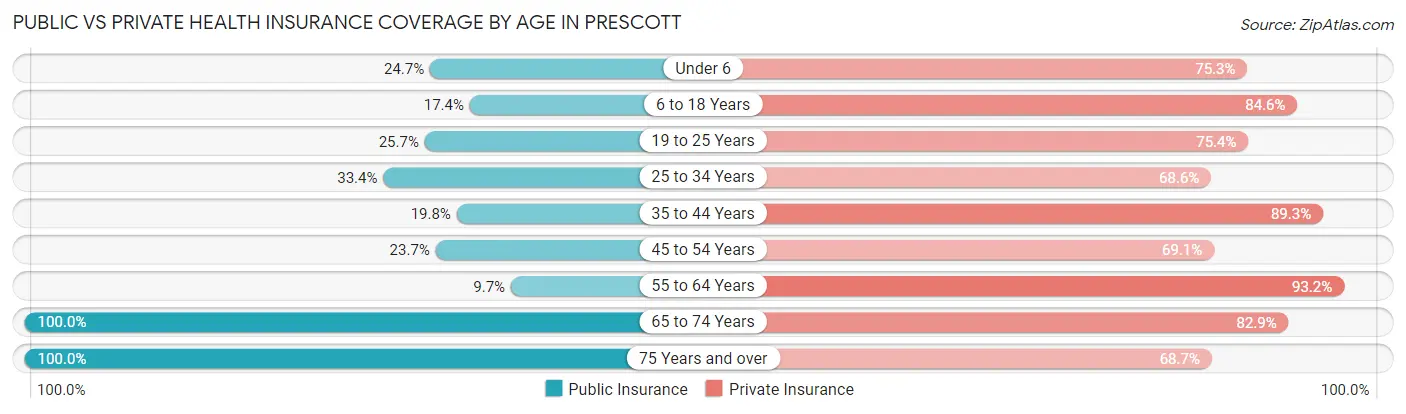
| Age Bracket | Public Insurance | Private Insurance |
| Under 6 | 94 (24.7%) | 286 (75.3%) |
| 6 to 18 Years | 100 (17.4%) | 487 (84.6%) |
| 19 to 25 Years | 88 (25.7%) | 258 (75.4%) |
| 25 to 34 Years | 255 (33.4%) | 523 (68.5%) |
| 35 to 44 Years | 100 (19.8%) | 451 (89.3%) |
| 45 to 54 Years | 82 (23.7%) | 239 (69.1%) |
| 55 to 64 Years | 66 (9.7%) | 632 (93.2%) |
| 65 to 74 Years | 492 (100.0%) | 408 (82.9%) |
| 75 Years and over | 201 (100.0%) | 138 (68.7%) |
| Total | 1,478 (34.5%) | 3,422 (79.9%) |
Disability Status by Sex by Age in Prescott
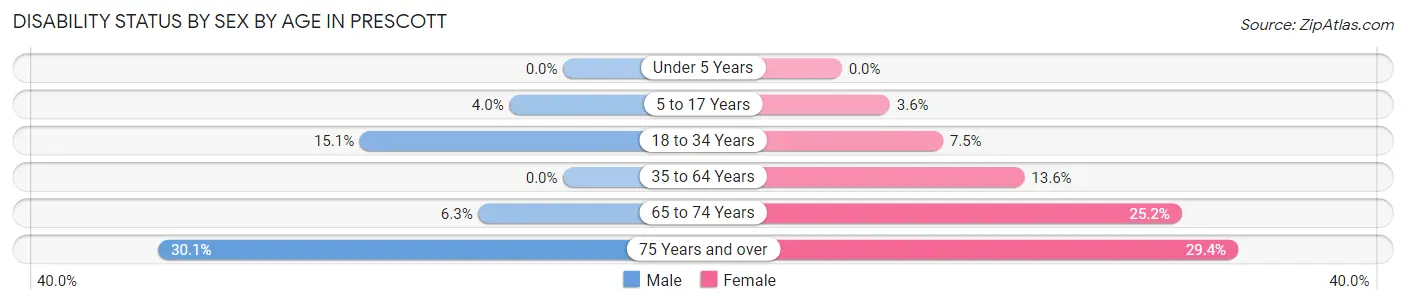
| Age Bracket | Male | Female |
| Under 5 Years | 0 (0.0%) | 0 (0.0%) |
| 5 to 17 Years | 13 (4.0%) | 10 (3.6%) |
| 18 to 34 Years | 90 (15.1%) | 39 (7.5%) |
| 35 to 64 Years | 0 (0.0%) | 112 (13.6%) |
| 65 to 74 Years | 17 (6.3%) | 56 (25.2%) |
| 75 Years and over | 40 (30.1%) | 20 (29.4%) |
Disability Class by Sex by Age in Prescott
Disability Class: Hearing Difficulty
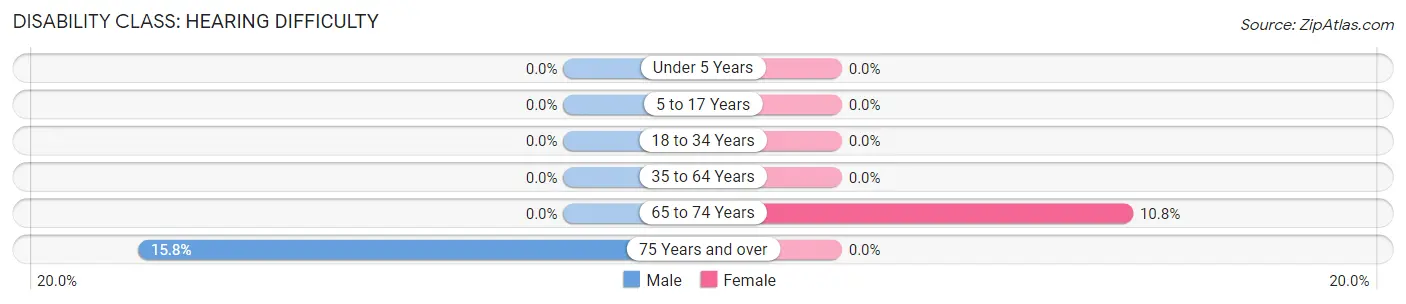
| Age Bracket | Male | Female |
| Under 5 Years | 0 (0.0%) | 0 (0.0%) |
| 5 to 17 Years | 0 (0.0%) | 0 (0.0%) |
| 18 to 34 Years | 0 (0.0%) | 0 (0.0%) |
| 35 to 64 Years | 0 (0.0%) | 0 (0.0%) |
| 65 to 74 Years | 0 (0.0%) | 24 (10.8%) |
| 75 Years and over | 21 (15.8%) | 0 (0.0%) |
Disability Class: Vision Difficulty
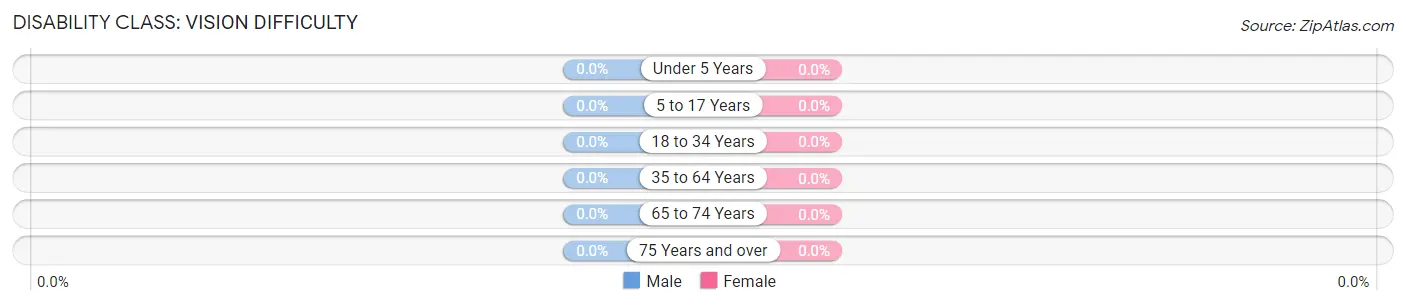
| Age Bracket | Male | Female |
| Under 5 Years | 0 (0.0%) | 0 (0.0%) |
| 5 to 17 Years | 0 (0.0%) | 0 (0.0%) |
| 18 to 34 Years | 0 (0.0%) | 0 (0.0%) |
| 35 to 64 Years | 0 (0.0%) | 0 (0.0%) |
| 65 to 74 Years | 0 (0.0%) | 0 (0.0%) |
| 75 Years and over | 0 (0.0%) | 0 (0.0%) |
Disability Class: Cognitive Difficulty
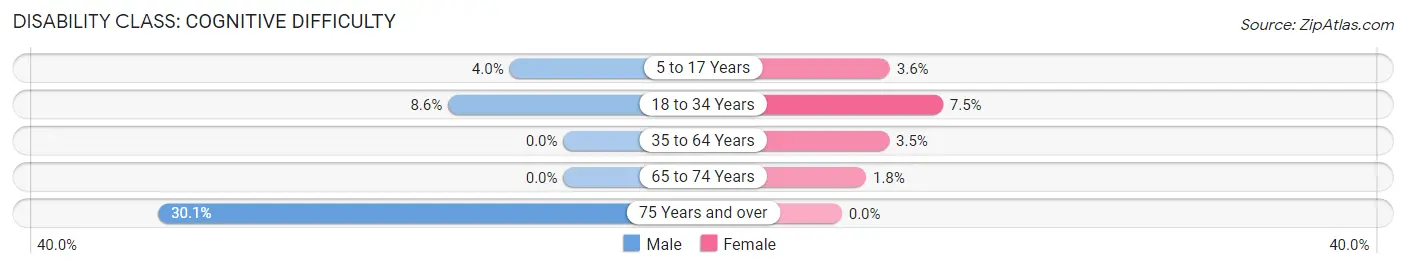
| Age Bracket | Male | Female |
| 5 to 17 Years | 13 (4.0%) | 10 (3.6%) |
| 18 to 34 Years | 51 (8.6%) | 39 (7.5%) |
| 35 to 64 Years | 0 (0.0%) | 29 (3.5%) |
| 65 to 74 Years | 0 (0.0%) | 4 (1.8%) |
| 75 Years and over | 40 (30.1%) | 0 (0.0%) |
Disability Class: Ambulatory Difficulty
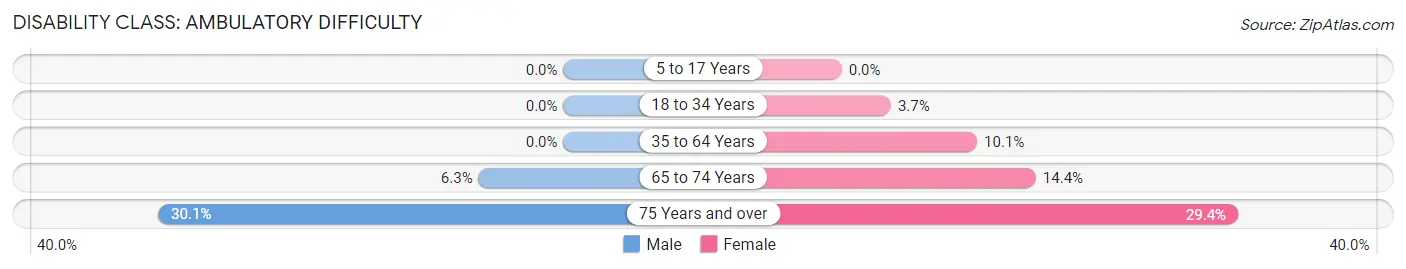
| Age Bracket | Male | Female |
| 5 to 17 Years | 0 (0.0%) | 0 (0.0%) |
| 18 to 34 Years | 0 (0.0%) | 19 (3.6%) |
| 35 to 64 Years | 0 (0.0%) | 83 (10.1%) |
| 65 to 74 Years | 17 (6.3%) | 32 (14.4%) |
| 75 Years and over | 40 (30.1%) | 20 (29.4%) |
Disability Class: Self-Care Difficulty
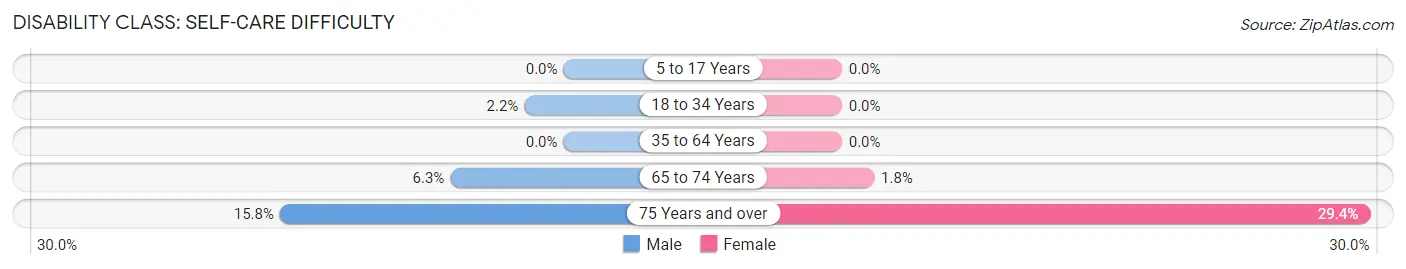
| Age Bracket | Male | Female |
| 5 to 17 Years | 0 (0.0%) | 0 (0.0%) |
| 18 to 34 Years | 13 (2.2%) | 0 (0.0%) |
| 35 to 64 Years | 0 (0.0%) | 0 (0.0%) |
| 65 to 74 Years | 17 (6.3%) | 4 (1.8%) |
| 75 Years and over | 21 (15.8%) | 20 (29.4%) |
Technology Access in Prescott
Computing Device Access in Prescott
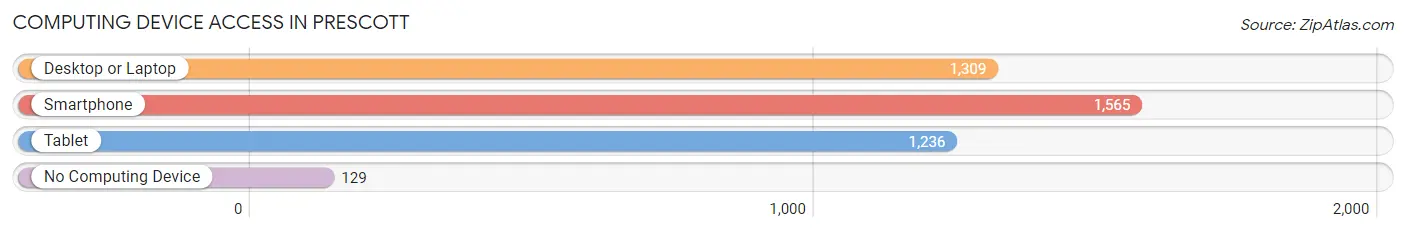
| Device Type | # Households | % Households |
| Desktop or Laptop | 1,309 | 68.5% |
| Smartphone | 1,565 | 81.9% |
| Tablet | 1,236 | 64.7% |
| No Computing Device | 129 | 6.8% |
| Total | 1,910 | 100.0% |
Internet Access in Prescott
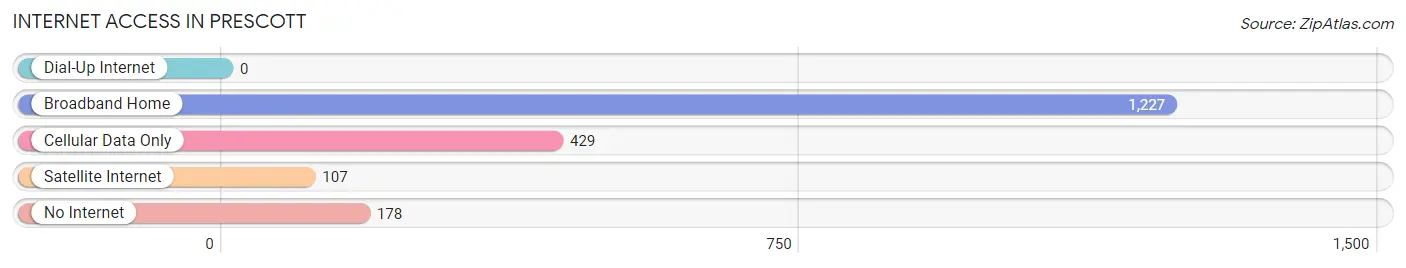
| Internet Type | # Households | % Households |
| Dial-Up Internet | 0 | 0.0% |
| Broadband Home | 1,227 | 64.2% |
| Cellular Data Only | 429 | 22.5% |
| Satellite Internet | 107 | 5.6% |
| No Internet | 178 | 9.3% |
| Total | 1,910 | 100.0% |
Prescott Summary
Prescott, Wisconsin is a small city located in Pierce County, Wisconsin, United States. It is situated on the banks of the St. Croix River, which forms the border between Wisconsin and Minnesota. The city is part of the Twin Cities metropolitan area and is located approximately 25 miles east of Minneapolis, Minnesota. As of the 2010 census, the population of Prescott was 4,258.
History
The area that is now Prescott was first settled in the early 1800s by French-Canadian fur traders. The first permanent settlers arrived in the area in 1839, and the city was officially incorporated in 1856. The city was named after William H. Prescott, a historian and author.
In the late 1800s, Prescott was a major lumbering center, with several sawmills located in the area. The city was also home to a number of brickyards, which produced bricks for the construction of buildings in the Twin Cities.
In the early 1900s, Prescott was a major railroad hub, with several railroads running through the city. The railroads brought in a large number of immigrants, who settled in the area and helped to shape the city’s culture.
Geography
Prescott is located at 44°45'N 92°37'W (44.75, -92.62). According to the United States Census Bureau, the city has a total area of 4.2 square miles (10.8 km2), of which 4.1 square miles (10.6 km2) is land and 0.1 square miles (0.2 km2) is water.
The city is located on the banks of the St. Croix River, which forms the border between Wisconsin and Minnesota. The city is part of the Twin Cities metropolitan area and is located approximately 25 miles east of Minneapolis, Minnesota.
Economy
Prescott’s economy is largely based on agriculture and tourism. The city is home to several farms, which produce a variety of crops, including corn, soybeans, and hay. The city is also home to several wineries, which produce a variety of wines.
The city is also home to several manufacturing companies, which produce a variety of products, including furniture, plastics, and automotive parts.
Demographics
As of the 2010 census, there were 4,258 people, 1,717 households, and 1,093 families residing in the city. The population density was 1,033.2 people per square mile (399.2/km2). There were 1,845 housing units at an average density of 454.2 per square mile (175.3/km2). The racial makeup of the city was 95.2% White, 0.7% African American, 0.4% Native American, 0.7% Asian, 0.1% Pacific Islander, 1.3% from other races, and 1.6% from two or more races. Hispanic or Latino of any race were 3.2% of the population.
There were 1,717 households, out of which 28.2% had children under the age of 18 living with them, 48.2% were married couples living together, 11.2% had a female householder with no husband present, and 36.2% were non-families. 30.2% of all households were made up of individuals, and 14.2% had someone living alone who was 65 years of age or older. The average household size was 2.41 and the average family size was 3.00.
In the city, the population was spread out, with 24.2% under the age of 18, 8.2% from 18 to 24, 27.2% from 25 to 44, 22.2% from 45 to 64, and 18.2% who were 65 years of age or older. The median age was 38 years. For every 100 females, there were 93.2 males. For every 100 females age 18 and over, there were 90.2 males.
The median income for a household in the city was $41,944, and the median income for a family was $50,000. Males had a median income of $36,250 versus $25,000 for females. The per capita income for the city was $20,945. About 5.2% of families and 8.2% of the population were below the poverty line, including 10.2% of those under age 18 and 8.2% of those age 65 or over.
Common Questions
What is Per Capita Income in Prescott?
Per Capita income in Prescott is $37,208.
What is the Median Family Income in Prescott?
Median Family Income in Prescott is $74,864.
What is the Median Household income in Prescott?
Median Household Income in Prescott is $74,195.
What is Income or Wage Gap in Prescott?
Income or Wage Gap in Prescott is 25.5%.
Women in Prescott earn 74.5 cents for every dollar earned by a man.
What is Inequality or Gini Index in Prescott?
Inequality or Gini Index in Prescott is 0.34.
What is the Total Population of Prescott?
Total Population of Prescott is 4,343.
What is the Total Male Population of Prescott?
Total Male Population of Prescott is 2,228.
What is the Total Female Population of Prescott?
Total Female Population of Prescott is 2,115.
What is the Ratio of Males per 100 Females in Prescott?
There are 105.34 Males per 100 Females in Prescott.
What is the Ratio of Females per 100 Males in Prescott?
There are 94.93 Females per 100 Males in Prescott.
What is the Median Population Age in Prescott?
Median Population Age in Prescott is 36.1 Years.
What is the Average Family Size in Prescott
Average Family Size in Prescott is 2.7 People.
What is the Average Household Size in Prescott
Average Household Size in Prescott is 2.2 People.
How Large is the Labor Force in Prescott?
There are 2,412 People in the Labor Forcein in Prescott.
What is the Percentage of People in the Labor Force in Prescott?
69.2% of People are in the Labor Force in Prescott.
What is the Unemployment Rate in Prescott?
Unemployment Rate in Prescott is 1.5%.