Fox Point, WI Map & Demographics
Fox Point Map
Fox Point Overview
$91,650
PER CAPITA INCOME
$166,635
AVG FAMILY INCOME
$130,865
AVG HOUSEHOLD INCOME
40.4%
WAGE / INCOME GAP [ % ]
59.6¢/ $1
WAGE / INCOME GAP [ $ ]
0.56
INEQUALITY / GINI INDEX
6,811
TOTAL POPULATION
3,220
MALE POPULATION
3,591
FEMALE POPULATION
89.67
MALES / 100 FEMALES
111.52
FEMALES / 100 MALES
43.9
MEDIAN AGE
3.2
AVG FAMILY SIZE
2.5
AVG HOUSEHOLD SIZE
3,363
LABOR FORCE [ PEOPLE ]
63.3%
PERCENT IN LABOR FORCE
0.4%
UNEMPLOYMENT RATE
Income in Fox Point
Income Overview in Fox Point
Per Capita Income in Fox Point is $91,650, while median incomes of families and households are $166,635 and $130,865 respectively.
| Characteristic | Number | Measure |
| Per Capita Income | 6,811 | $91,650 |
| Median Family Income | 1,730 | $166,635 |
| Mean Family Income | 1,730 | $294,108 |
| Median Household Income | 2,682 | $130,865 |
| Mean Household Income | 2,682 | $231,783 |
| Income Deficit | 1,730 | $0 |
| Wage / Income Gap (%) | 6,811 | 40.42% |
| Wage / Income Gap ($) | 6,811 | 59.58¢ per $1 |
| Gini / Inequality Index | 6,811 | 0.56 |
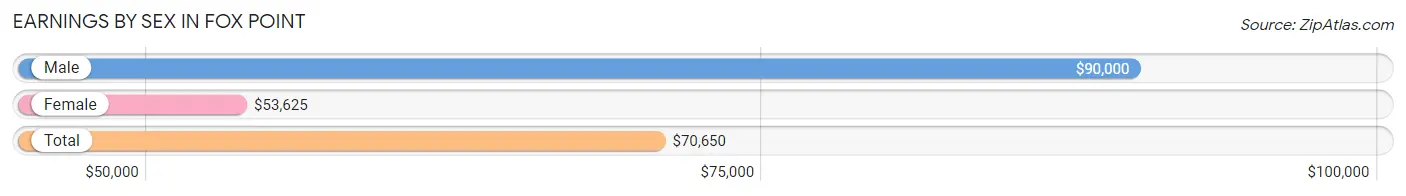
Earnings by Sex in Fox Point
Average Earnings in Fox Point are $70,650, $90,000 for men and $53,625 for women, a difference of 40.4%.
| Sex | Number | Average Earnings |
| Male | 1,954 (53.0%) | $90,000 |
| Female | 1,735 (47.0%) | $53,625 |
| Total | 3,689 (100.0%) | $70,650 |
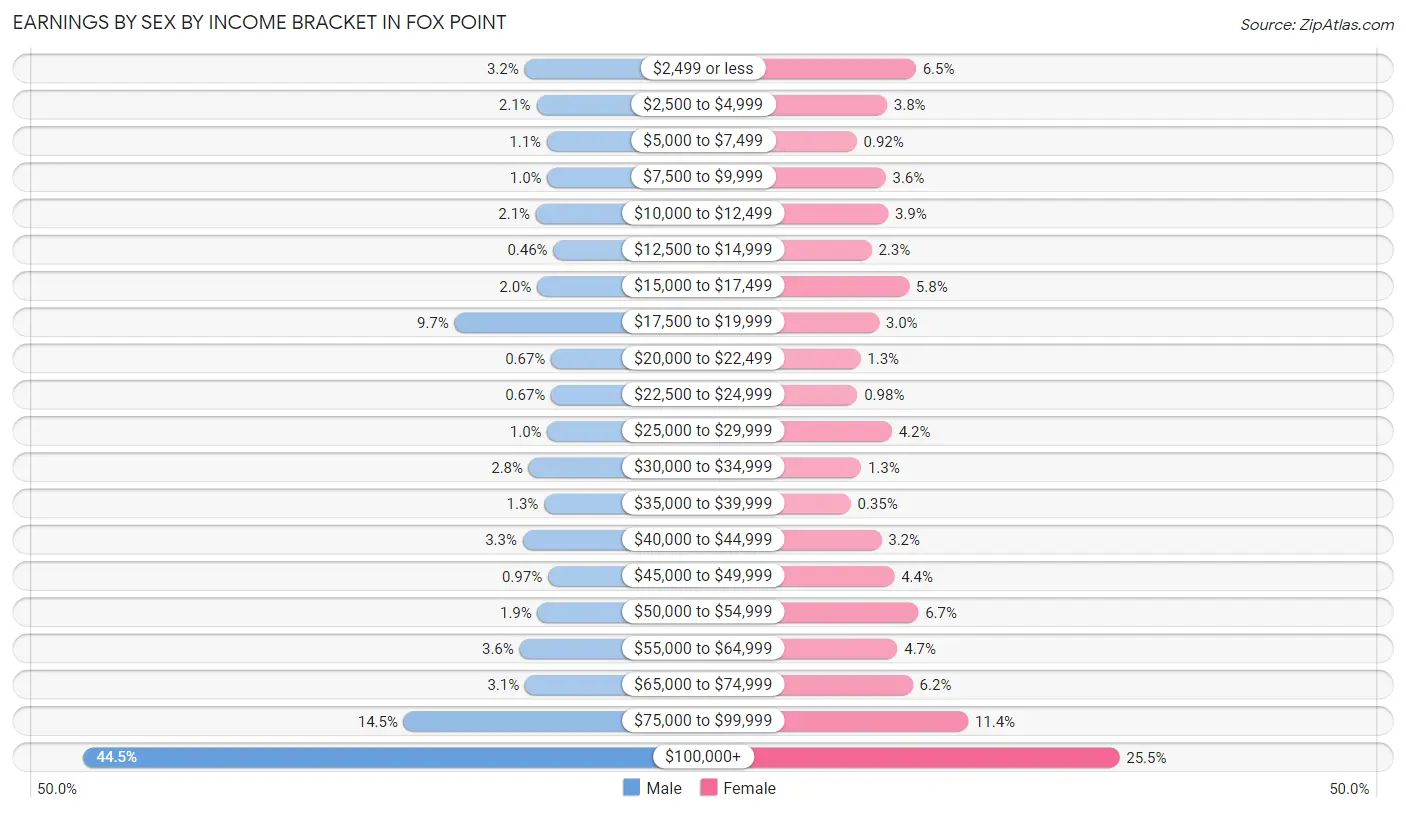
Earnings by Sex by Income Bracket in Fox Point
The most common earnings brackets in Fox Point are $100,000+ for men (869 | 44.5%) and $100,000+ for women (443 | 25.5%).
| Income | Male | Female |
| $2,499 or less | 62 (3.2%) | 112 (6.5%) |
| $2,500 to $4,999 | 40 (2.1%) | 65 (3.7%) |
| $5,000 to $7,499 | 21 (1.1%) | 16 (0.9%) |
| $7,500 to $9,999 | 20 (1.0%) | 63 (3.6%) |
| $10,000 to $12,499 | 41 (2.1%) | 67 (3.9%) |
| $12,500 to $14,999 | 9 (0.5%) | 40 (2.3%) |
| $15,000 to $17,499 | 39 (2.0%) | 101 (5.8%) |
| $17,500 to $19,999 | 190 (9.7%) | 52 (3.0%) |
| $20,000 to $22,499 | 13 (0.7%) | 22 (1.3%) |
| $22,500 to $24,999 | 13 (0.7%) | 17 (1.0%) |
| $25,000 to $29,999 | 20 (1.0%) | 73 (4.2%) |
| $30,000 to $34,999 | 54 (2.8%) | 23 (1.3%) |
| $35,000 to $39,999 | 26 (1.3%) | 6 (0.4%) |
| $40,000 to $44,999 | 65 (3.3%) | 56 (3.2%) |
| $45,000 to $49,999 | 19 (1.0%) | 77 (4.4%) |
| $50,000 to $54,999 | 38 (1.9%) | 116 (6.7%) |
| $55,000 to $64,999 | 71 (3.6%) | 82 (4.7%) |
| $65,000 to $74,999 | 61 (3.1%) | 107 (6.2%) |
| $75,000 to $99,999 | 283 (14.5%) | 197 (11.4%) |
| $100,000+ | 869 (44.5%) | 443 (25.5%) |
| Total | 1,954 (100.0%) | 1,735 (100.0%) |
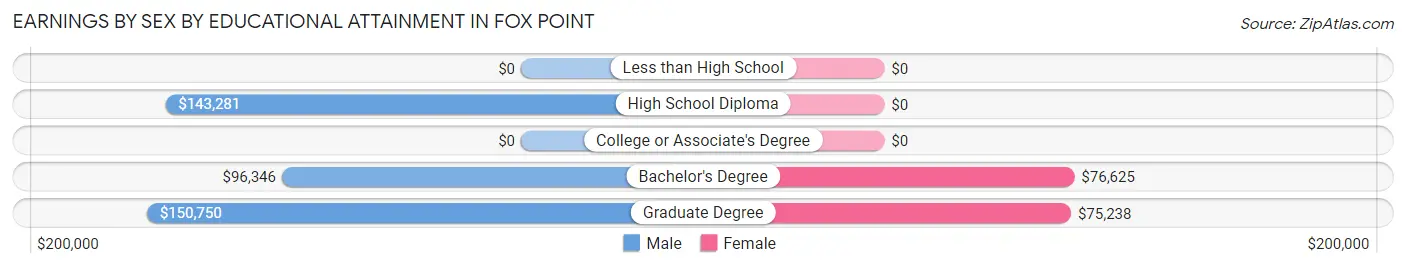
Earnings by Sex by Educational Attainment in Fox Point
Average earnings in Fox Point are $97,297 for men and $69,519 for women, a difference of 28.5%. Men with an educational attainment of graduate degree enjoy the highest average annual earnings of $150,750, while those with bachelor's degree education earn the least with $96,346. Women with an educational attainment of bachelor's degree earn the most with the average annual earnings of $76,625, while those with graduate degree education have the smallest earnings of $75,238.
| Educational Attainment | Male Income | Female Income |
| Less than High School | - | - |
| High School Diploma | $143,281 | $0 |
| College or Associate's Degree | - | - |
| Bachelor's Degree | $96,346 | $76,625 |
| Graduate Degree | $150,750 | $75,238 |
| Total | $97,297 | $69,519 |
Family Income in Fox Point
Family Income Brackets in Fox Point
According to the Fox Point family income data, there are 695 families falling into the $200,000+ income range, which is the most common income bracket and makes up 40.2% of all families.
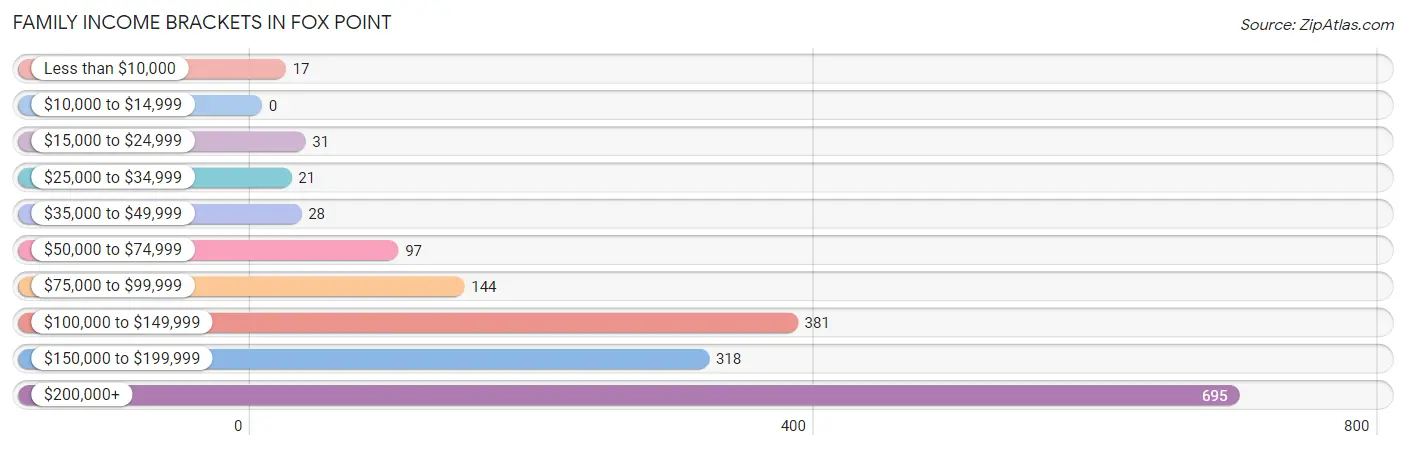
| Income Bracket | # Families | % Families |
| Less than $10,000 | 17 | 1.0% |
| $10,000 to $14,999 | 0 | 0.0% |
| $15,000 to $24,999 | 31 | 1.8% |
| $25,000 to $34,999 | 21 | 1.2% |
| $35,000 to $49,999 | 28 | 1.6% |
| $50,000 to $74,999 | 97 | 5.6% |
| $75,000 to $99,999 | 144 | 8.3% |
| $100,000 to $149,999 | 381 | 22.0% |
| $150,000 to $199,999 | 318 | 18.4% |
| $200,000+ | 695 | 40.2% |
Family Income by Famaliy Size in Fox Point
6-person families (73 | 4.2%) account for the highest median family income in Fox Point with $250,001 per family, while 2-person families (715 | 41.3%) have the highest median income of $75,729 per family member.
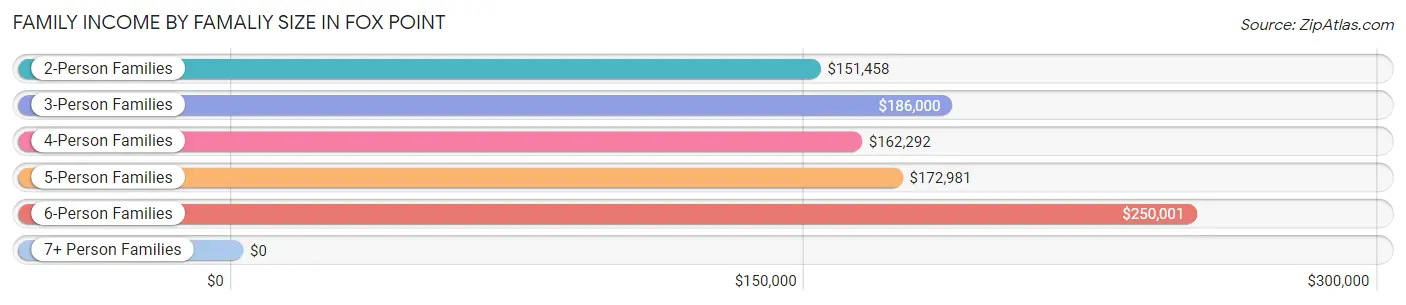
| Income Bracket | # Families | Median Income |
| 2-Person Families | 715 (41.3%) | $151,458 |
| 3-Person Families | 428 (24.7%) | $186,000 |
| 4-Person Families | 385 (22.3%) | $162,292 |
| 5-Person Families | 129 (7.5%) | $172,981 |
| 6-Person Families | 73 (4.2%) | $250,001 |
| 7+ Person Families | 0 (0.0%) | $0 |
| Total | 1,730 (100.0%) | $166,635 |
Family Income by Number of Earners in Fox Point
The median family income in Fox Point is $166,635, with families comprising 3+ earners (233) having the highest median family income of $213,683, while families with no earners (210) have the lowest median family income of $85,500, accounting for 13.5% and 12.1% of families, respectively.
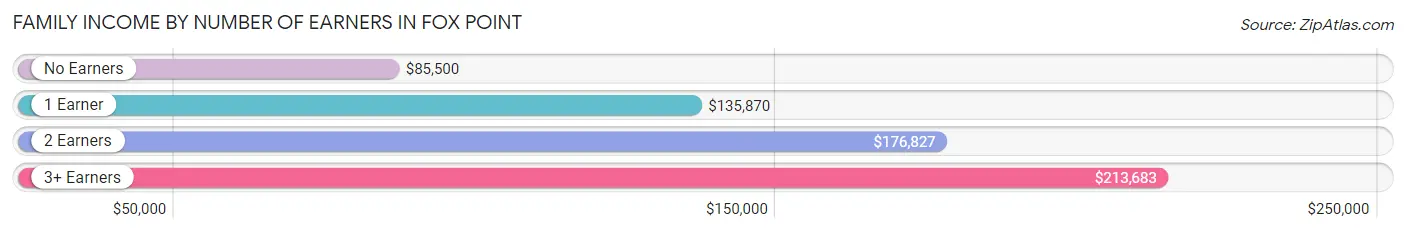
| Number of Earners | # Families | Median Income |
| No Earners | 210 (12.1%) | $85,500 |
| 1 Earner | 458 (26.5%) | $135,870 |
| 2 Earners | 829 (47.9%) | $176,827 |
| 3+ Earners | 233 (13.5%) | $213,683 |
| Total | 1,730 (100.0%) | $166,635 |
Household Income in Fox Point
Household Income Brackets in Fox Point
With 791 households falling in the category, the $200,000+ income range is the most frequent in Fox Point, accounting for 29.5% of all households. In contrast, only 5 households (0.2%) fall into the $10,000 to $14,999 income bracket, making it the least populous group.
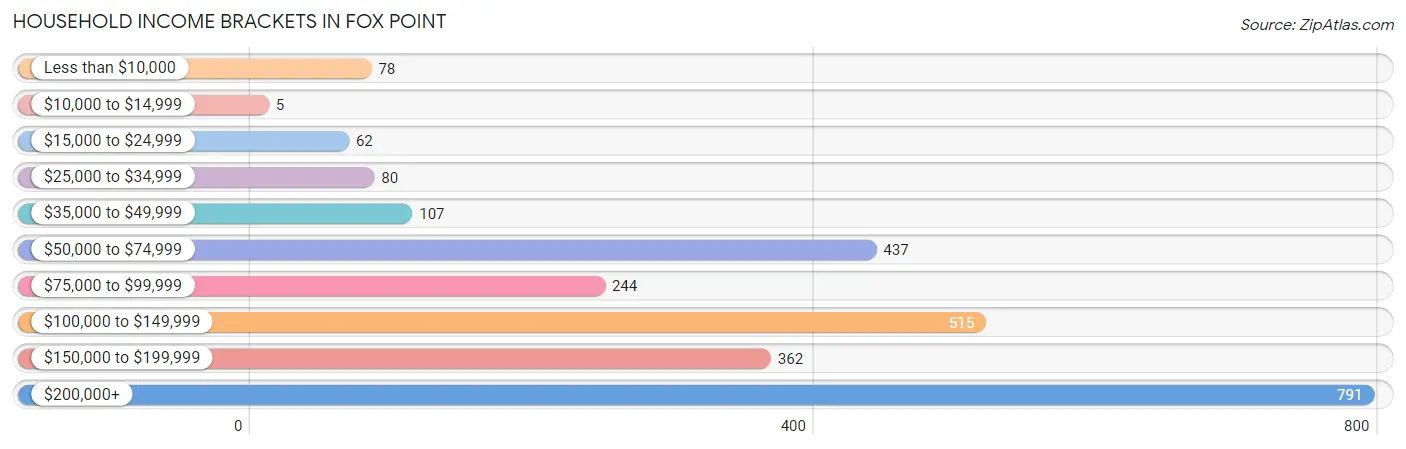
| Income Bracket | # Households | % Households |
| Less than $10,000 | 78 | 2.9% |
| $10,000 to $14,999 | 5 | 0.2% |
| $15,000 to $24,999 | 62 | 2.3% |
| $25,000 to $34,999 | 80 | 3.0% |
| $35,000 to $49,999 | 107 | 4.0% |
| $50,000 to $74,999 | 437 | 16.3% |
| $75,000 to $99,999 | 244 | 9.1% |
| $100,000 to $149,999 | 515 | 19.2% |
| $150,000 to $199,999 | 362 | 13.5% |
| $200,000+ | 791 | 29.5% |
Household Income by Householder Age in Fox Point
The median household income in Fox Point is $130,865, with the highest median household income of $168,047 found in the 45 to 64 years age bracket for the primary householder. A total of 1,072 households (40.0%) fall into this category. Meanwhile, the 15 to 24 years age bracket for the primary householder has the lowest median household income of $0, with 43 households (1.6%) in this group.
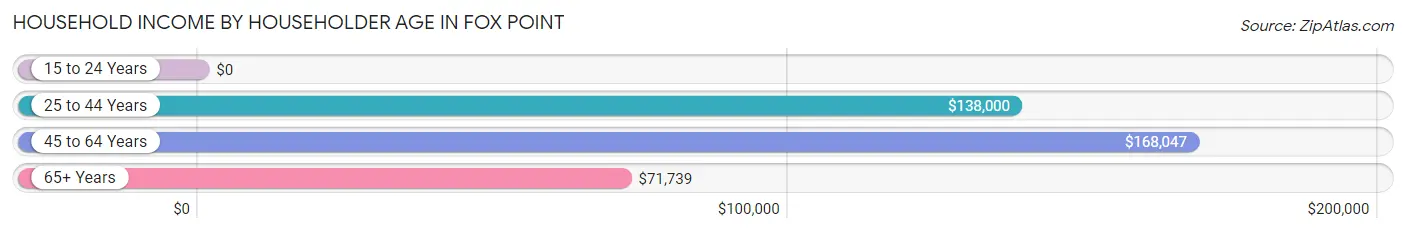
| Income Bracket | # Households | Median Income |
| 15 to 24 Years | 43 (1.6%) | $0 |
| 25 to 44 Years | 656 (24.5%) | $138,000 |
| 45 to 64 Years | 1,072 (40.0%) | $168,047 |
| 65+ Years | 911 (34.0%) | $71,739 |
| Total | 2,682 (100.0%) | $130,865 |
Poverty in Fox Point
Income Below Poverty by Sex and Age in Fox Point
With 1.6% poverty level for males and 4.4% for females among the residents of Fox Point, 25 to 34 year old males and 75 year old and over females are the most vulnerable to poverty, with 22 males (9.8%) and 89 females (23.7%) in their respective age groups living below the poverty level.
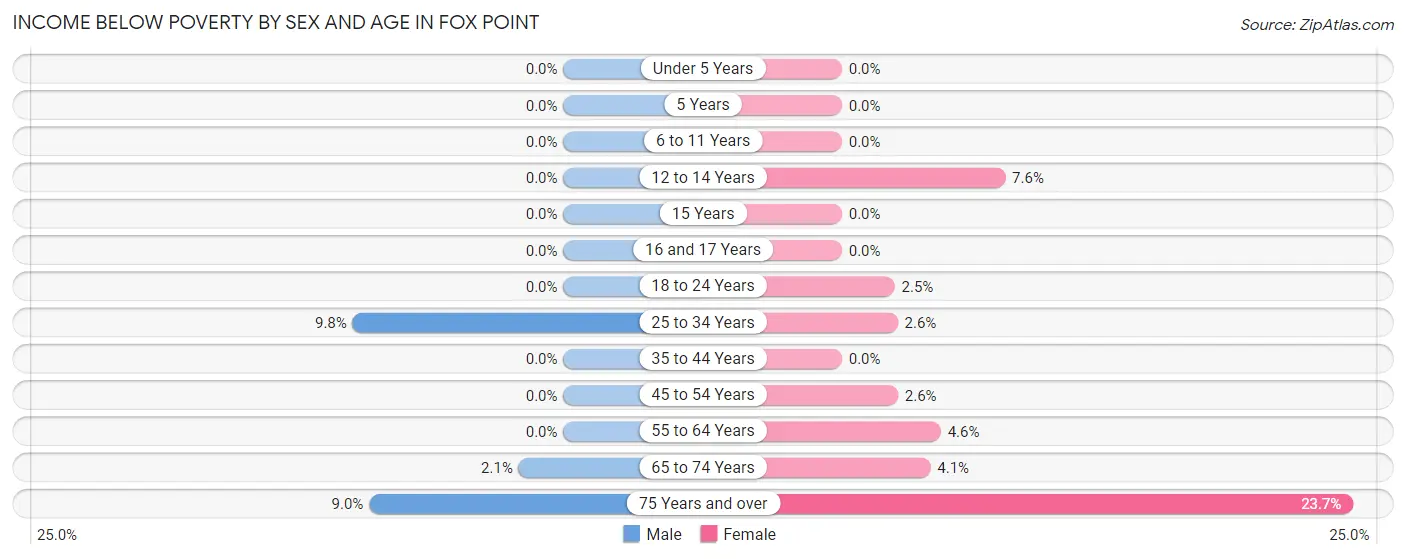
| Age Bracket | Male | Female |
| Under 5 Years | 0 (0.0%) | 0 (0.0%) |
| 5 Years | 0 (0.0%) | 0 (0.0%) |
| 6 to 11 Years | 0 (0.0%) | 0 (0.0%) |
| 12 to 14 Years | 0 (0.0%) | 5 (7.6%) |
| 15 Years | 0 (0.0%) | 0 (0.0%) |
| 16 and 17 Years | 0 (0.0%) | 0 (0.0%) |
| 18 to 24 Years | 0 (0.0%) | 6 (2.5%) |
| 25 to 34 Years | 22 (9.8%) | 5 (2.6%) |
| 35 to 44 Years | 0 (0.0%) | 0 (0.0%) |
| 45 to 54 Years | 0 (0.0%) | 12 (2.6%) |
| 55 to 64 Years | 0 (0.0%) | 19 (4.6%) |
| 65 to 74 Years | 10 (2.1%) | 18 (4.1%) |
| 75 Years and over | 20 (9.0%) | 89 (23.7%) |
| Total | 52 (1.6%) | 154 (4.4%) |
Income Above Poverty by Sex and Age in Fox Point
According to the poverty statistics in Fox Point, males aged under 5 years and females aged under 5 years are the age groups that are most secure financially, with 100.0% of males and 100.0% of females in these age groups living above the poverty line.
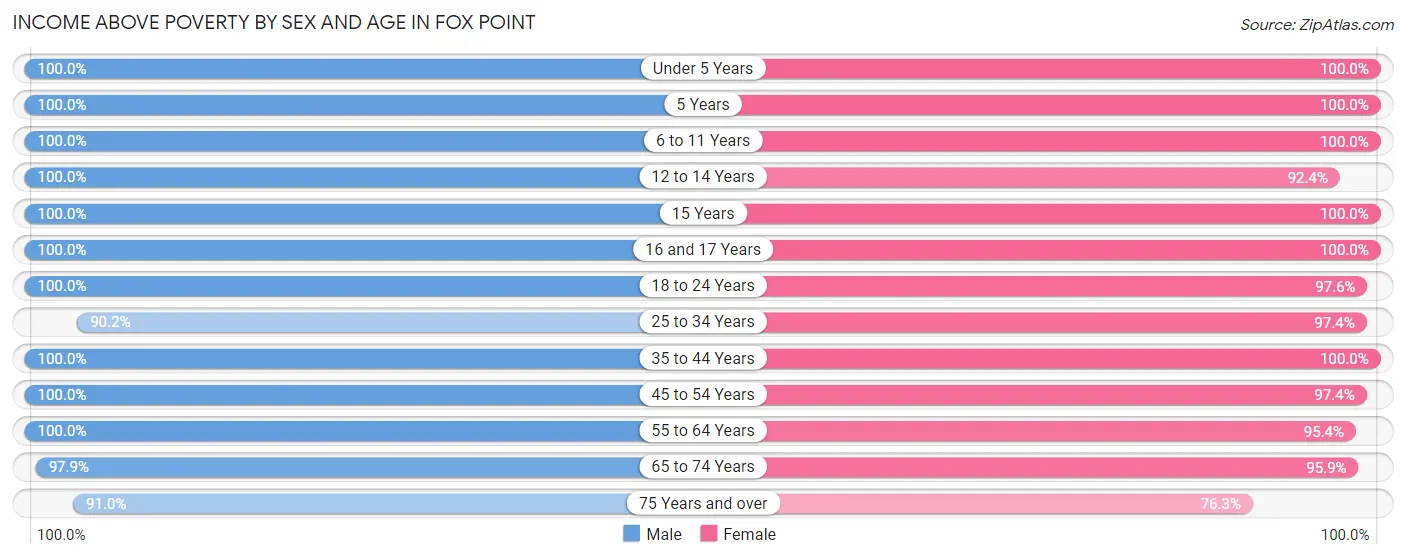
| Age Bracket | Male | Female |
| Under 5 Years | 213 (100.0%) | 248 (100.0%) |
| 5 Years | 14 (100.0%) | 73 (100.0%) |
| 6 to 11 Years | 260 (100.0%) | 367 (100.0%) |
| 12 to 14 Years | 176 (100.0%) | 61 (92.4%) |
| 15 Years | 39 (100.0%) | 42 (100.0%) |
| 16 and 17 Years | 56 (100.0%) | 81 (100.0%) |
| 18 to 24 Years | 176 (100.0%) | 239 (97.6%) |
| 25 to 34 Years | 203 (90.2%) | 188 (97.4%) |
| 35 to 44 Years | 402 (100.0%) | 471 (100.0%) |
| 45 to 54 Years | 516 (100.0%) | 450 (97.4%) |
| 55 to 64 Years | 392 (100.0%) | 395 (95.4%) |
| 65 to 74 Years | 472 (97.9%) | 420 (95.9%) |
| 75 Years and over | 202 (91.0%) | 286 (76.3%) |
| Total | 3,121 (98.4%) | 3,321 (95.6%) |
Income Below Poverty Among Married-Couple Families in Fox Point
The poverty statistics for married-couple families in Fox Point show that 1.2% or 19 of the total 1,559 families live below the poverty line. Families with no children have the highest poverty rate of 2.4%, comprising of 19 families. On the other hand, families with 1 or 2 children have the lowest poverty rate of 0.0%, which includes 0 families.
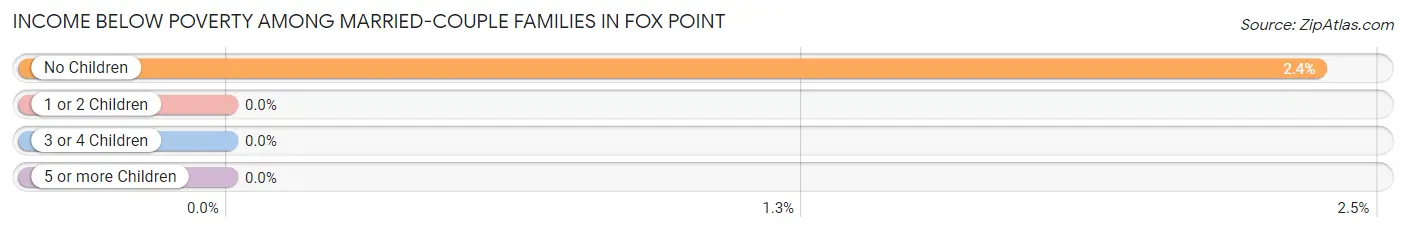
| Children | Above Poverty | Below Poverty |
| No Children | 784 (97.6%) | 19 (2.4%) |
| 1 or 2 Children | 593 (100.0%) | 0 (0.0%) |
| 3 or 4 Children | 163 (100.0%) | 0 (0.0%) |
| 5 or more Children | 0 (0.0%) | 0 (0.0%) |
| Total | 1,540 (98.8%) | 19 (1.2%) |
Income Below Poverty Among Single-Parent Households in Fox Point
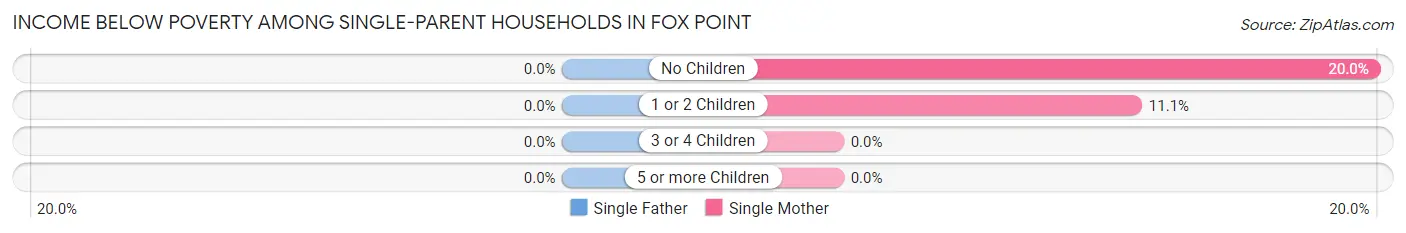
| Children | Single Father | Single Mother |
| No Children | 0 (0.0%) | 9 (20.0%) |
| 1 or 2 Children | 0 (0.0%) | 4 (11.1%) |
| 3 or 4 Children | 0 (0.0%) | 0 (0.0%) |
| 5 or more Children | 0 (0.0%) | 0 (0.0%) |
| Total | 0 (0.0%) | 13 (16.1%) |
Income Below Poverty Among Married-Couple vs Single-Parent Households in Fox Point
The poverty data for Fox Point shows that 19 of the married-couple family households (1.2%) and 13 of the single-parent households (7.6%) are living below the poverty level. Within the married-couple family households, those with no children have the highest poverty rate, with 19 households (2.4%) falling below the poverty line. Among the single-parent households, those with no children have the highest poverty rate, with 9 household (8.0%) living below poverty.
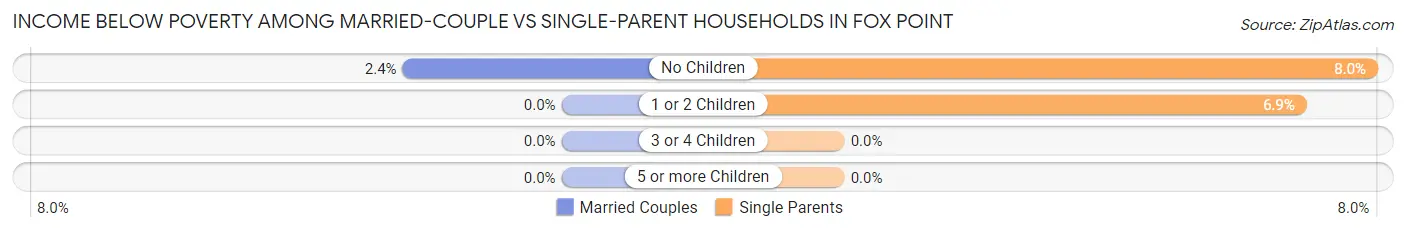
| Children | Married-Couple Families | Single-Parent Households |
| No Children | 19 (2.4%) | 9 (8.0%) |
| 1 or 2 Children | 0 (0.0%) | 4 (6.9%) |
| 3 or 4 Children | 0 (0.0%) | 0 (0.0%) |
| 5 or more Children | 0 (0.0%) | 0 (0.0%) |
| Total | 19 (1.2%) | 13 (7.6%) |
Race in Fox Point
The most populous races in Fox Point are White / Caucasian (5,629 | 82.7%), Asian (443 | 6.5%), and Two or more Races (434 | 6.4%).
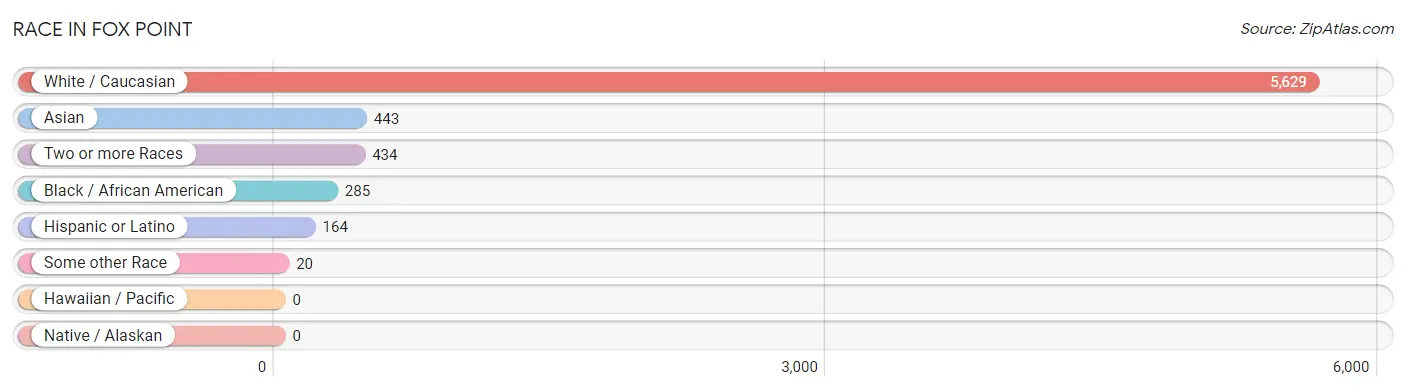
| Race | # Population | % Population |
| Asian | 443 | 6.5% |
| Black / African American | 285 | 4.2% |
| Hawaiian / Pacific | 0 | 0.0% |
| Hispanic or Latino | 164 | 2.4% |
| Native / Alaskan | 0 | 0.0% |
| White / Caucasian | 5,629 | 82.7% |
| Two or more Races | 434 | 6.4% |
| Some other Race | 20 | 0.3% |
| Total | 6,811 | 100.0% |
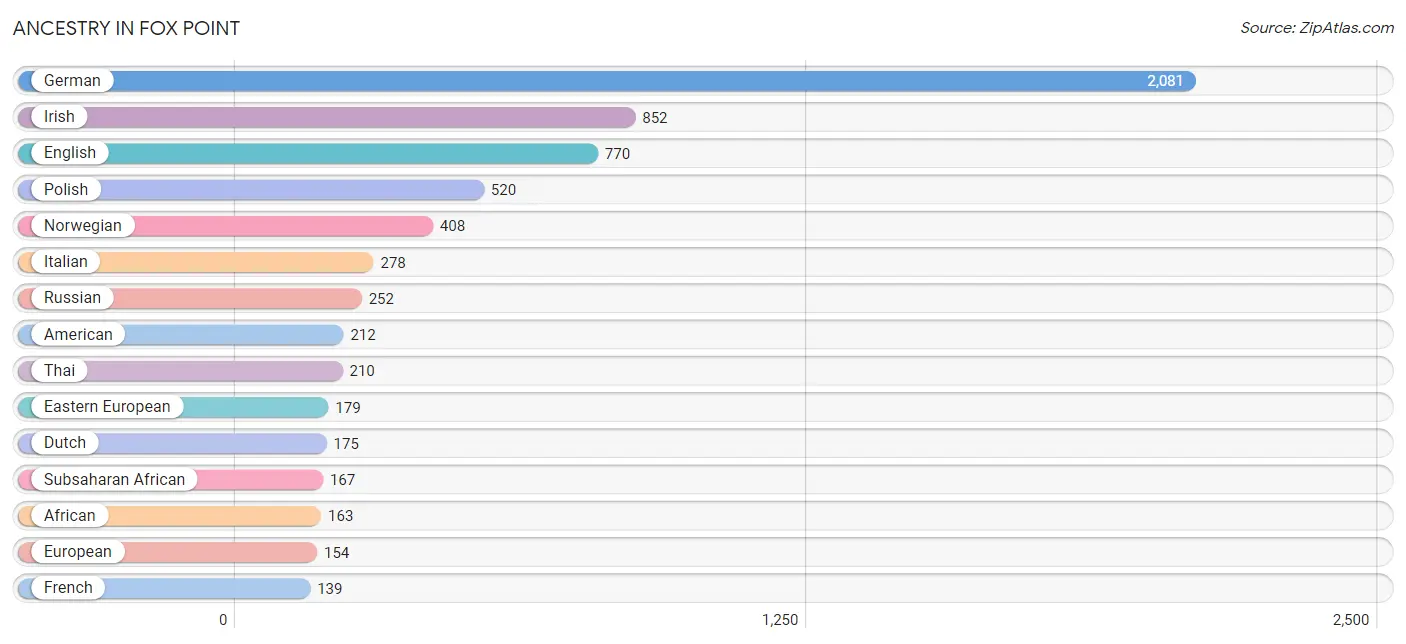
Ancestry in Fox Point
The most populous ancestries reported in Fox Point are German (2,081 | 30.5%), Irish (852 | 12.5%), English (770 | 11.3%), Polish (520 | 7.6%), and Norwegian (408 | 6.0%), together accounting for 68.0% of all Fox Point residents.
| Ancestry | # Population | % Population |
| African | 163 | 2.4% |
| American | 212 | 3.1% |
| Arab | 47 | 0.7% |
| Armenian | 31 | 0.5% |
| Australian | 15 | 0.2% |
| Austrian | 50 | 0.7% |
| Bangladeshi | 40 | 0.6% |
| Barbadian | 4 | 0.1% |
| Belgian | 13 | 0.2% |
| Bhutanese | 59 | 0.9% |
| British | 87 | 1.3% |
| Burmese | 5 | 0.1% |
| Canadian | 11 | 0.2% |
| Central American | 8 | 0.1% |
| Croatian | 28 | 0.4% |
| Czech | 82 | 1.2% |
| Czechoslovakian | 8 | 0.1% |
| Danish | 35 | 0.5% |
| Dutch | 175 | 2.6% |
| Eastern European | 179 | 2.6% |
| English | 770 | 11.3% |
| Estonian | 16 | 0.2% |
| European | 154 | 2.3% |
| Finnish | 43 | 0.6% |
| French | 139 | 2.0% |
| French Canadian | 24 | 0.4% |
| German | 2,081 | 30.5% |
| Greek | 7 | 0.1% |
| Hungarian | 24 | 0.4% |
| Icelander | 5 | 0.1% |
| Indian (Asian) | 95 | 1.4% |
| Irish | 852 | 12.5% |
| Iroquois | 7 | 0.1% |
| Israeli | 4 | 0.1% |
| Italian | 278 | 4.1% |
| Korean | 133 | 1.9% |
| Lithuanian | 109 | 1.6% |
| Mexican | 78 | 1.1% |
| Northern European | 15 | 0.2% |
| Norwegian | 408 | 6.0% |
| Palestinian | 31 | 0.5% |
| Peruvian | 6 | 0.1% |
| Polish | 520 | 7.6% |
| Portuguese | 6 | 0.1% |
| Puerto Rican | 37 | 0.5% |
| Romanian | 1 | 0.0% |
| Russian | 252 | 3.7% |
| Scandinavian | 45 | 0.7% |
| Scotch-Irish | 17 | 0.3% |
| Scottish | 67 | 1.0% |
| Serbian | 5 | 0.1% |
| Slovak | 5 | 0.1% |
| South African | 4 | 0.1% |
| South American | 6 | 0.1% |
| Spaniard | 5 | 0.1% |
| Spanish | 19 | 0.3% |
| Sri Lankan | 69 | 1.0% |
| Subsaharan African | 167 | 2.5% |
| Swedish | 86 | 1.3% |
| Swiss | 104 | 1.5% |
| Thai | 210 | 3.1% |
| Turkish | 27 | 0.4% |
| Ukrainian | 68 | 1.0% |
| Welsh | 6 | 0.1% | View All 64 Rows |
Immigrants in Fox Point
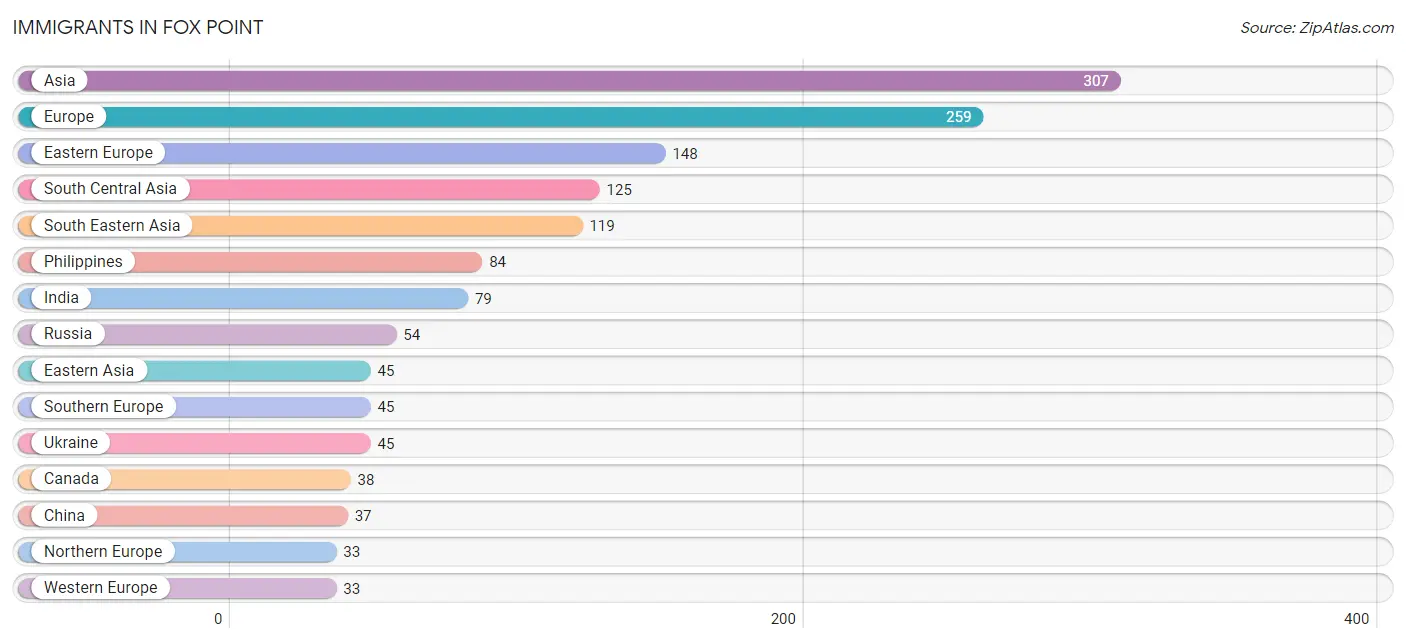
The most numerous immigrant groups reported in Fox Point came from Asia (307 | 4.5%), Europe (259 | 3.8%), Eastern Europe (148 | 2.2%), South Central Asia (125 | 1.8%), and South Eastern Asia (119 | 1.8%), together accounting for 14.1% of all Fox Point residents.
| Immigration Origin | # Population | % Population |
| Africa | 20 | 0.3% |
| Asia | 307 | 4.5% |
| Australia | 8 | 0.1% |
| Austria | 8 | 0.1% |
| Bangladesh | 19 | 0.3% |
| Canada | 38 | 0.6% |
| China | 37 | 0.5% |
| Croatia | 18 | 0.3% |
| Eastern Africa | 11 | 0.2% |
| Eastern Asia | 45 | 0.7% |
| Eastern Europe | 148 | 2.2% |
| Europe | 259 | 3.8% |
| Germany | 21 | 0.3% |
| India | 79 | 1.2% |
| Ireland | 9 | 0.1% |
| Italy | 31 | 0.5% |
| Japan | 8 | 0.1% |
| Laos | 16 | 0.2% |
| Latin America | 6 | 0.1% |
| Netherlands | 4 | 0.1% |
| Northern Europe | 33 | 0.5% |
| Oceania | 8 | 0.1% |
| Peru | 6 | 0.1% |
| Philippines | 84 | 1.2% |
| Russia | 54 | 0.8% |
| South Africa | 9 | 0.1% |
| South America | 6 | 0.1% |
| South Central Asia | 125 | 1.8% |
| South Eastern Asia | 119 | 1.8% |
| Southern Europe | 45 | 0.7% |
| Spain | 14 | 0.2% |
| Sri Lanka | 16 | 0.2% |
| Turkey | 18 | 0.3% |
| Ukraine | 45 | 0.7% |
| Uzbekistan | 11 | 0.2% |
| Vietnam | 19 | 0.3% |
| Western Asia | 18 | 0.3% |
| Western Europe | 33 | 0.5% | View All 38 Rows |
Sex and Age in Fox Point
Sex and Age in Fox Point
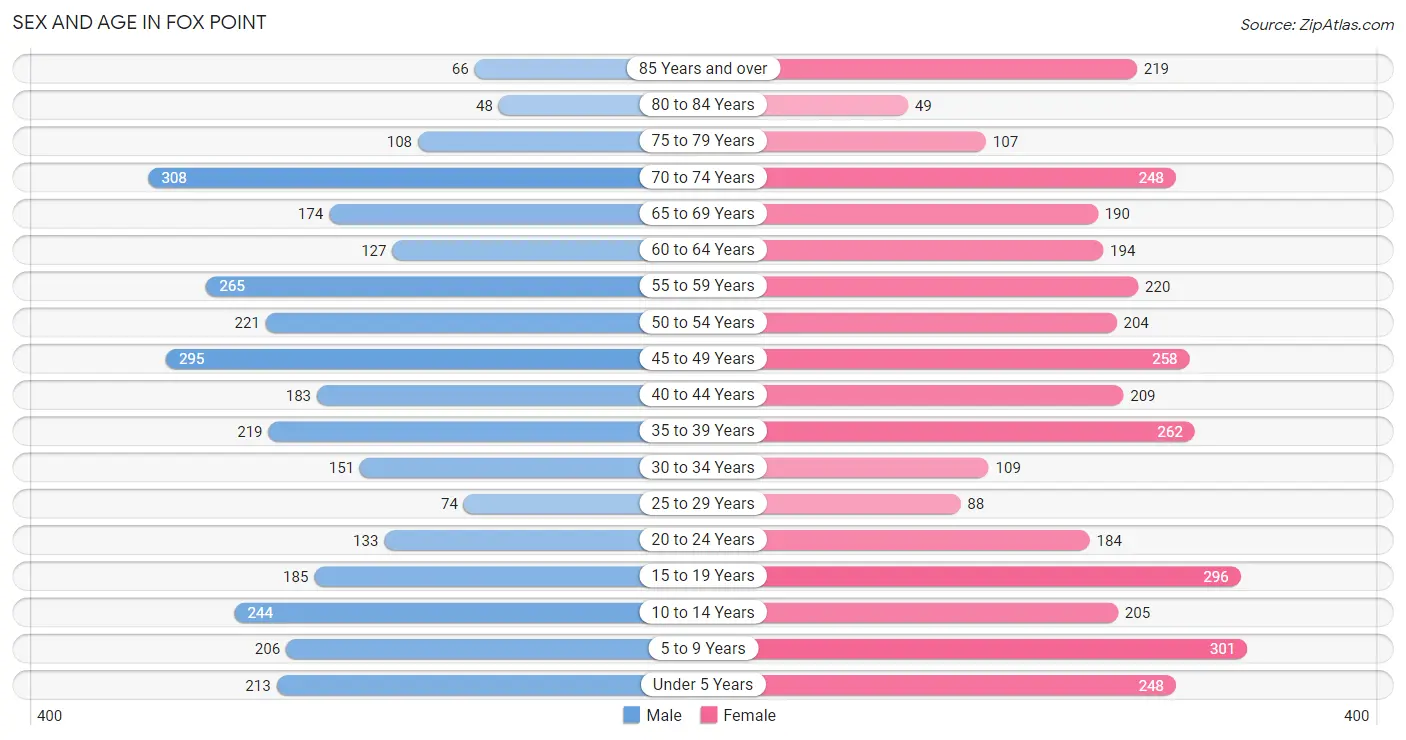
The most populous age groups in Fox Point are 70 to 74 Years (308 | 9.6%) for men and 5 to 9 Years (301 | 8.4%) for women.
| Age Bracket | Male | Female |
| Under 5 Years | 213 (6.6%) | 248 (6.9%) |
| 5 to 9 Years | 206 (6.4%) | 301 (8.4%) |
| 10 to 14 Years | 244 (7.6%) | 205 (5.7%) |
| 15 to 19 Years | 185 (5.8%) | 296 (8.2%) |
| 20 to 24 Years | 133 (4.1%) | 184 (5.1%) |
| 25 to 29 Years | 74 (2.3%) | 88 (2.5%) |
| 30 to 34 Years | 151 (4.7%) | 109 (3.0%) |
| 35 to 39 Years | 219 (6.8%) | 262 (7.3%) |
| 40 to 44 Years | 183 (5.7%) | 209 (5.8%) |
| 45 to 49 Years | 295 (9.2%) | 258 (7.2%) |
| 50 to 54 Years | 221 (6.9%) | 204 (5.7%) |
| 55 to 59 Years | 265 (8.2%) | 220 (6.1%) |
| 60 to 64 Years | 127 (3.9%) | 194 (5.4%) |
| 65 to 69 Years | 174 (5.4%) | 190 (5.3%) |
| 70 to 74 Years | 308 (9.6%) | 248 (6.9%) |
| 75 to 79 Years | 108 (3.4%) | 107 (3.0%) |
| 80 to 84 Years | 48 (1.5%) | 49 (1.4%) |
| 85 Years and over | 66 (2.1%) | 219 (6.1%) |
| Total | 3,220 (100.0%) | 3,591 (100.0%) |
Families and Households in Fox Point
Median Family Size in Fox Point
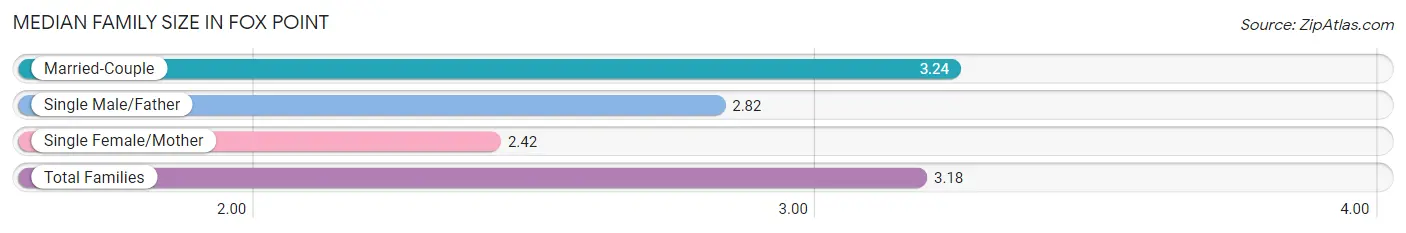
The median family size in Fox Point is 3.18 persons per family, with married-couple families (1,559 | 90.1%) accounting for the largest median family size of 3.24 persons per family. On the other hand, single female/mother families (81 | 4.7%) represent the smallest median family size with 2.42 persons per family.
| Family Type | # Families | Family Size |
| Married-Couple | 1,559 (90.1%) | 3.24 |
| Single Male/Father | 90 (5.2%) | 2.82 |
| Single Female/Mother | 81 (4.7%) | 2.42 |
| Total Families | 1,730 (100.0%) | 3.18 |
Median Household Size in Fox Point
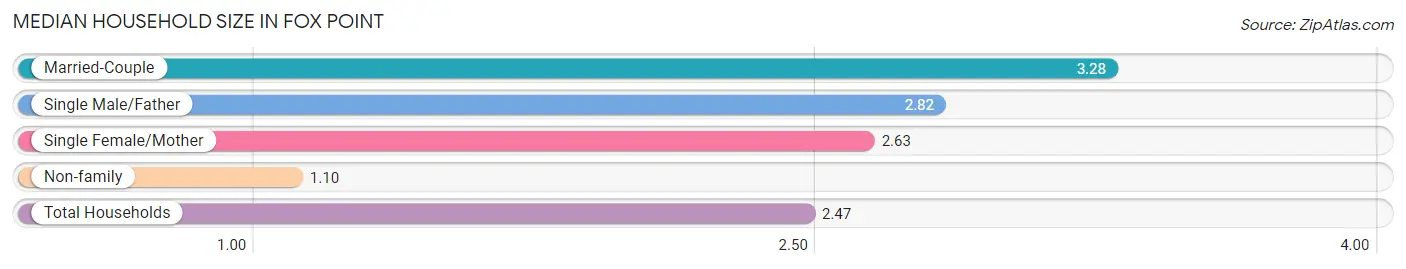
The median household size in Fox Point is 2.47 persons per household, with married-couple households (1,559 | 58.1%) accounting for the largest median household size of 3.28 persons per household. non-family households (952 | 35.5%) represent the smallest median household size with 1.10 persons per household.
| Household Type | # Households | Household Size |
| Married-Couple | 1,559 (58.1%) | 3.28 |
| Single Male/Father | 90 (3.4%) | 2.82 |
| Single Female/Mother | 81 (3.0%) | 2.63 |
| Non-family | 952 (35.5%) | 1.10 |
| Total Households | 2,682 (100.0%) | 2.47 |
Household Size by Marriage Status in Fox Point
Out of a total of 2,682 households in Fox Point, 1,730 (64.5%) are family households, while 952 (35.5%) are nonfamily households. The most numerous type of family households are 2-person households, comprising 698, and the most common type of nonfamily households are 1-person households, comprising 868.
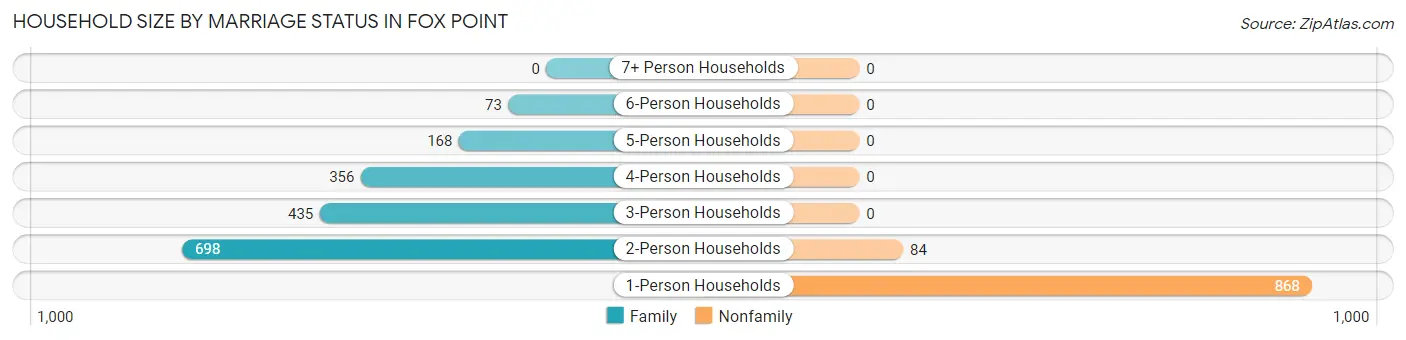
| Household Size | Family Households | Nonfamily Households |
| 1-Person Households | - | 868 (32.4%) |
| 2-Person Households | 698 (26.0%) | 84 (3.1%) |
| 3-Person Households | 435 (16.2%) | 0 (0.0%) |
| 4-Person Households | 356 (13.3%) | 0 (0.0%) |
| 5-Person Households | 168 (6.3%) | 0 (0.0%) |
| 6-Person Households | 73 (2.7%) | 0 (0.0%) |
| 7+ Person Households | 0 (0.0%) | 0 (0.0%) |
| Total | 1,730 (64.5%) | 952 (35.5%) |
Female Fertility in Fox Point
Fertility by Age in Fox Point
Average fertility rate in Fox Point is 58.0 births per 1,000 women. Women in the age bracket of 35 to 50 years have the highest fertility rate with 82.0 births per 1,000 women. Women in the age bracket of 35 to 50 years acount for 76.2% of all women with births.
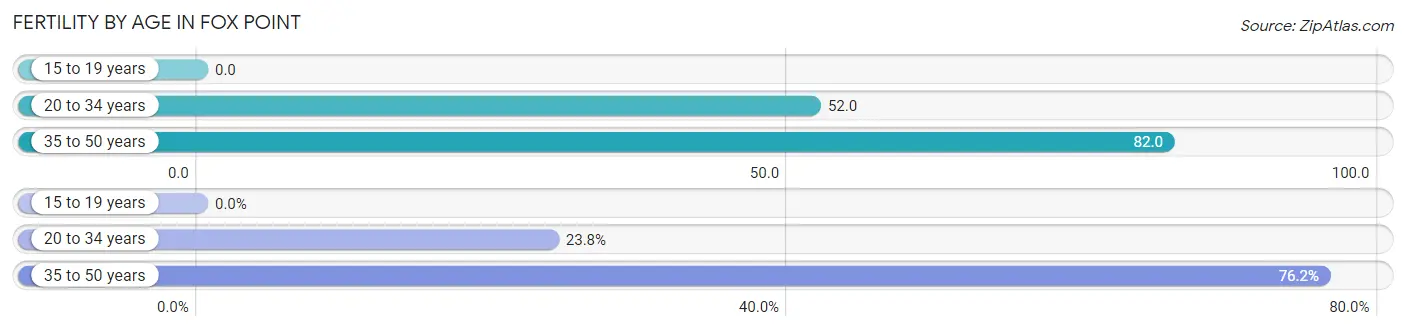
| Age Bracket | Women with Births | Births / 1,000 Women |
| 15 to 19 years | 0 (0.0%) | 0.0 |
| 20 to 34 years | 20 (23.8%) | 52.0 |
| 35 to 50 years | 64 (76.2%) | 82.0 |
| Total | 84 (100.0%) | 58.0 |
Fertility by Age by Marriage Status in Fox Point
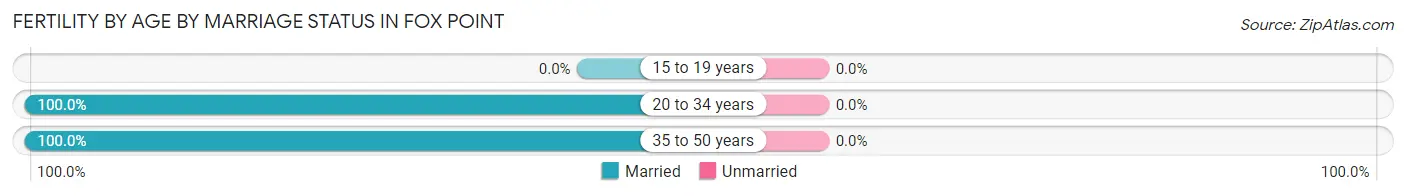
| Age Bracket | Married | Unmarried |
| 15 to 19 years | 0 (0.0%) | 0 (0.0%) |
| 20 to 34 years | 20 (100.0%) | 0 (0.0%) |
| 35 to 50 years | 64 (100.0%) | 0 (0.0%) |
| Total | 84 (100.0%) | 0 (0.0%) |
Fertility by Education in Fox Point
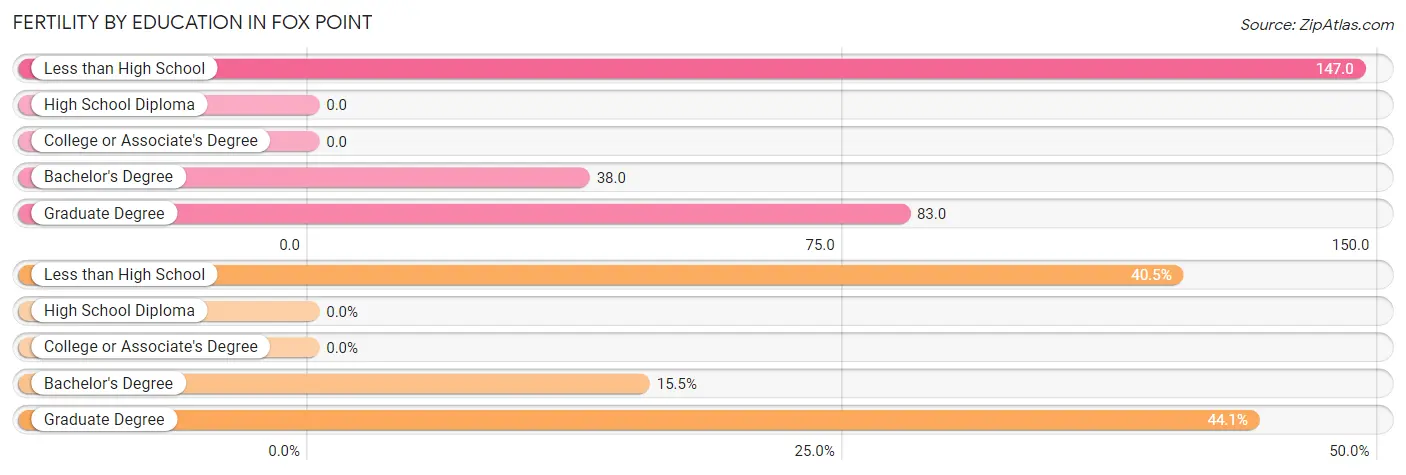
| Educational Attainment | Women with Births | Births / 1,000 Women |
| Less than High School | 34 (40.5%) | 147.0 |
| High School Diploma | 0 (0.0%) | 0.0 |
| College or Associate's Degree | 0 (0.0%) | 0.0 |
| Bachelor's Degree | 13 (15.5%) | 38.0 |
| Graduate Degree | 37 (44.1%) | 83.0 |
| Total | 84 (100.0%) | 58.0 |
Fertility by Education by Marriage Status in Fox Point
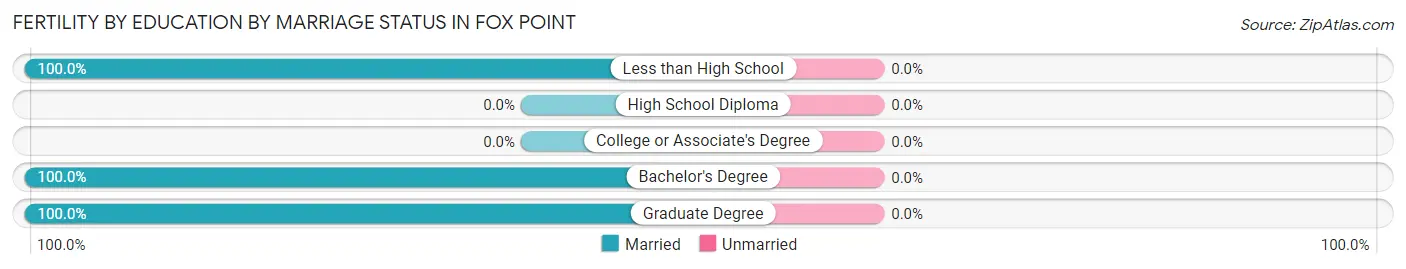
| Educational Attainment | Married | Unmarried |
| Less than High School | 34 (100.0%) | 0 (0.0%) |
| High School Diploma | 0 (0.0%) | 0 (0.0%) |
| College or Associate's Degree | 0 (0.0%) | 0 (0.0%) |
| Bachelor's Degree | 13 (100.0%) | 0 (0.0%) |
| Graduate Degree | 37 (100.0%) | 0 (0.0%) |
| Total | 84 (100.0%) | 0 (0.0%) |
Employment Characteristics in Fox Point
Employment by Class of Employer in Fox Point
Among the 3,172 employed individuals in Fox Point, private company employees (2,050 | 64.6%), not-for-profit organizations (582 | 18.3%), and self-employed (incorporated) (175 | 5.5%) make up the most common classes of employment.
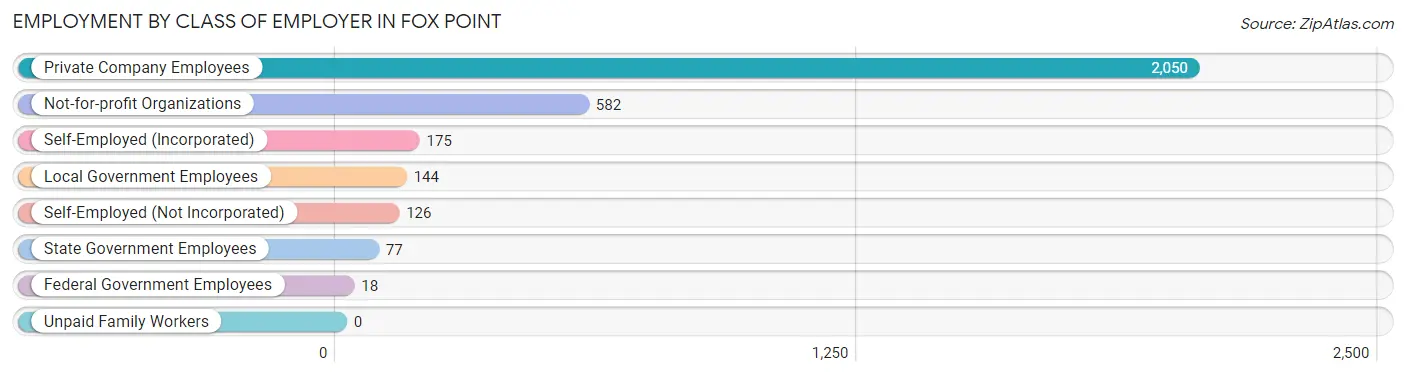
| Employer Class | # Employees | % Employees |
| Private Company Employees | 2,050 | 64.6% |
| Self-Employed (Incorporated) | 175 | 5.5% |
| Self-Employed (Not Incorporated) | 126 | 4.0% |
| Not-for-profit Organizations | 582 | 18.3% |
| Local Government Employees | 144 | 4.5% |
| State Government Employees | 77 | 2.4% |
| Federal Government Employees | 18 | 0.6% |
| Unpaid Family Workers | 0 | 0.0% |
| Total | 3,172 | 100.0% |
Employment Status by Age in Fox Point
According to the labor force statistics for Fox Point, out of the total population over 16 years of age (5,313), 63.3% or 3,363 individuals are in the labor force, with 0.4% or 13 of them unemployed. The age group with the highest labor force participation rate is 45 to 54 years, with 93.8% or 917 individuals in the labor force. Within the labor force, the 60 to 64 years age range has the highest percentage of unemployed individuals, with 4.2% or 9 of them being unemployed.
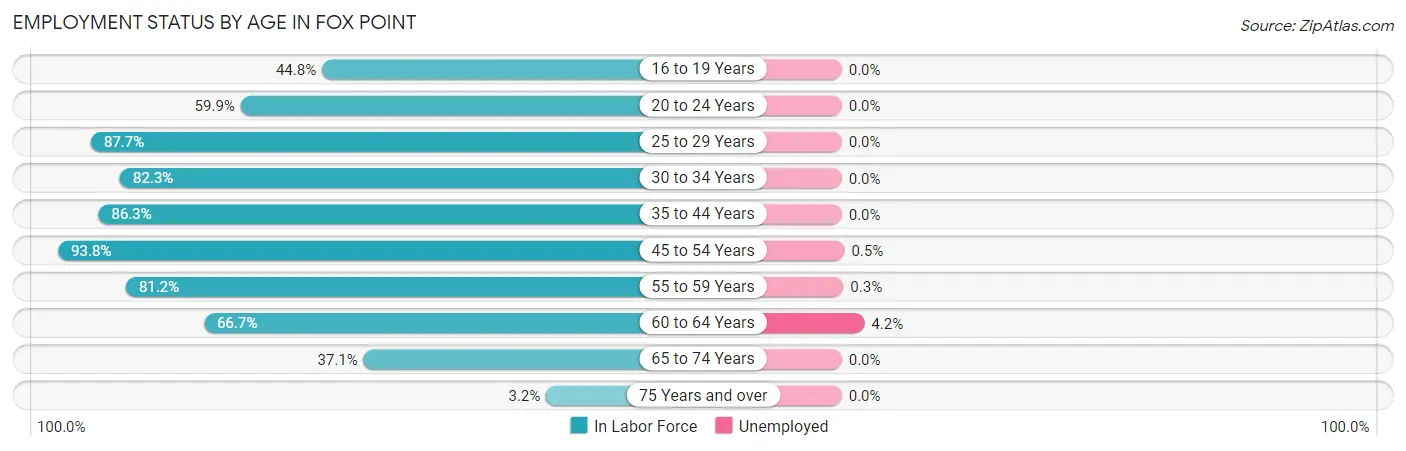
| Age Bracket | In Labor Force | Unemployed |
| 16 to 19 Years | 179 (44.8%) | 0 (0.0%) |
| 20 to 24 Years | 190 (59.9%) | 0 (0.0%) |
| 25 to 29 Years | 142 (87.7%) | 0 (0.0%) |
| 30 to 34 Years | 214 (82.3%) | 0 (0.0%) |
| 35 to 44 Years | 753 (86.3%) | 0 (0.0%) |
| 45 to 54 Years | 917 (93.8%) | 5 (0.5%) |
| 55 to 59 Years | 394 (81.2%) | 1 (0.3%) |
| 60 to 64 Years | 214 (66.7%) | 9 (4.2%) |
| 65 to 74 Years | 341 (37.1%) | 0 (0.0%) |
| 75 Years and over | 19 (3.2%) | 0 (0.0%) |
| Total | 3,363 (63.3%) | 13 (0.4%) |
Employment Status by Educational Attainment in Fox Point
According to labor force statistics for Fox Point, 85.5% of individuals (2,633) out of the total population between 25 and 64 years of age (3,079) are in the labor force, with 0.6% or 16 of them being unemployed. The group with the highest labor force participation rate are those with the educational attainment of bachelor's degree or higher, with 88.3% or 2,219 individuals in the labor force. Within the labor force, individuals with bachelor's degree or higher education have the highest percentage of unemployment, with 0.6% or 13 of them being unemployed.
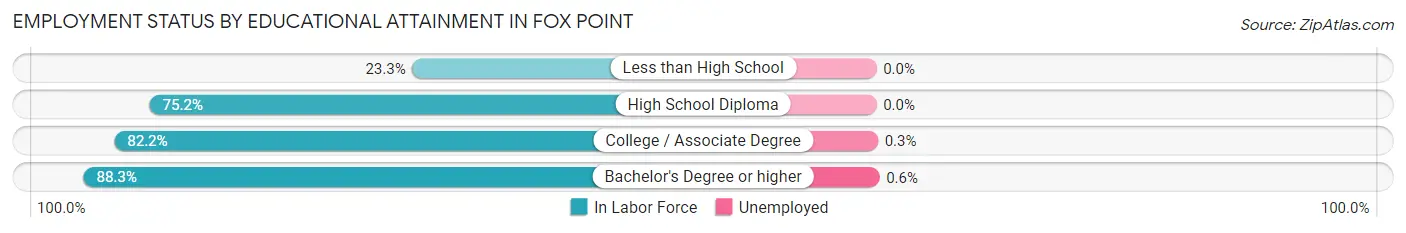
| Educational Attainment | In Labor Force | Unemployed |
| Less than High School | 17 (23.3%) | 0 (0.0%) |
| High School Diploma | 79 (75.2%) | 0 (0.0%) |
| College / Associate Degree | 319 (82.2%) | 1 (0.3%) |
| Bachelor's Degree or higher | 2,219 (88.3%) | 15 (0.6%) |
| Total | 2,633 (85.5%) | 18 (0.6%) |
Employment Occupations by Sex in Fox Point
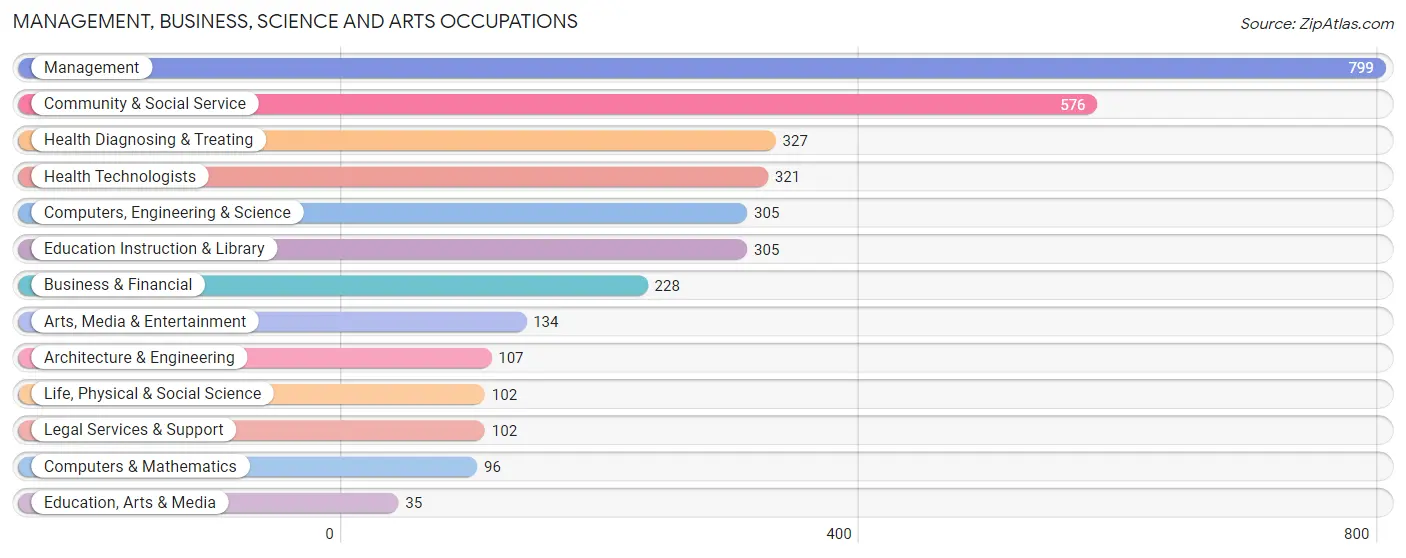
Management, Business, Science and Arts Occupations
The most common Management, Business, Science and Arts occupations in Fox Point are Management (799 | 23.9%), Community & Social Service (576 | 17.2%), Health Diagnosing & Treating (327 | 9.8%), Health Technologists (321 | 9.6%), and Computers, Engineering & Science (305 | 9.1%).
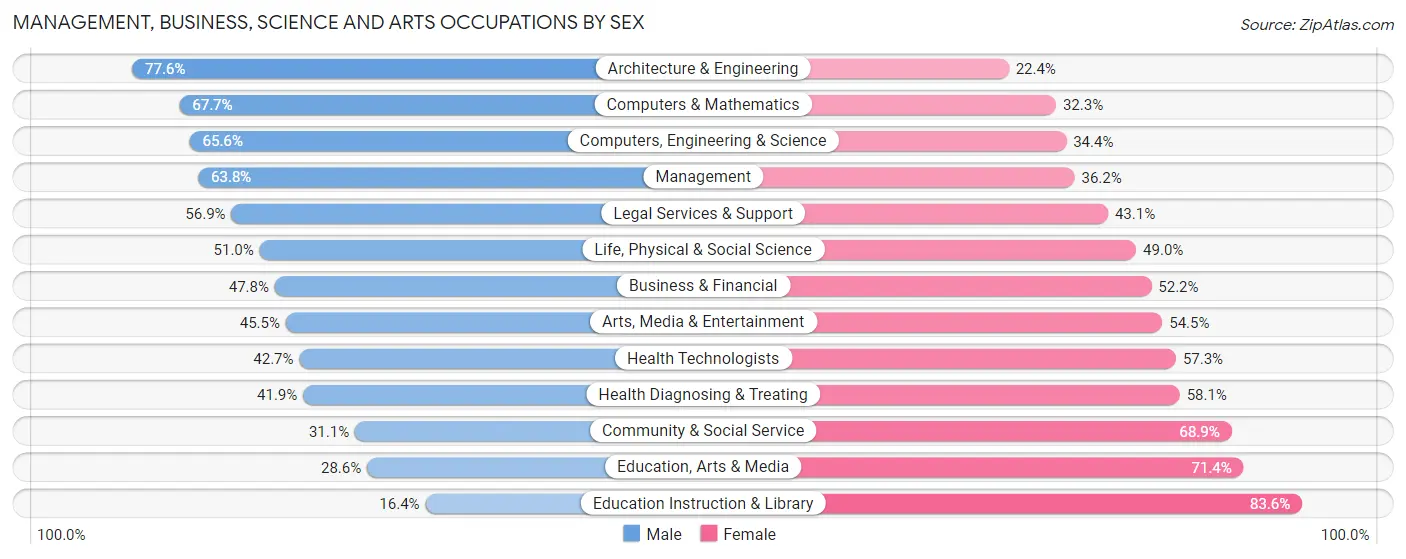
Management, Business, Science and Arts Occupations by Sex
Within the Management, Business, Science and Arts occupations in Fox Point, the most male-oriented occupations are Architecture & Engineering (77.6%), Computers & Mathematics (67.7%), and Computers, Engineering & Science (65.6%), while the most female-oriented occupations are Education Instruction & Library (83.6%), Education, Arts & Media (71.4%), and Community & Social Service (68.9%).
| Occupation | Male | Female |
| Management | 510 (63.8%) | 289 (36.2%) |
| Business & Financial | 109 (47.8%) | 119 (52.2%) |
| Computers, Engineering & Science | 200 (65.6%) | 105 (34.4%) |
| Computers & Mathematics | 65 (67.7%) | 31 (32.3%) |
| Architecture & Engineering | 83 (77.6%) | 24 (22.4%) |
| Life, Physical & Social Science | 52 (51.0%) | 50 (49.0%) |
| Community & Social Service | 179 (31.1%) | 397 (68.9%) |
| Education, Arts & Media | 10 (28.6%) | 25 (71.4%) |
| Legal Services & Support | 58 (56.9%) | 44 (43.1%) |
| Education Instruction & Library | 50 (16.4%) | 255 (83.6%) |
| Arts, Media & Entertainment | 61 (45.5%) | 73 (54.5%) |
| Health Diagnosing & Treating | 137 (41.9%) | 190 (58.1%) |
| Health Technologists | 137 (42.7%) | 184 (57.3%) |
| Total (Category) | 1,135 (50.8%) | 1,100 (49.2%) |
| Total (Overall) | 1,782 (53.2%) | 1,566 (46.8%) |
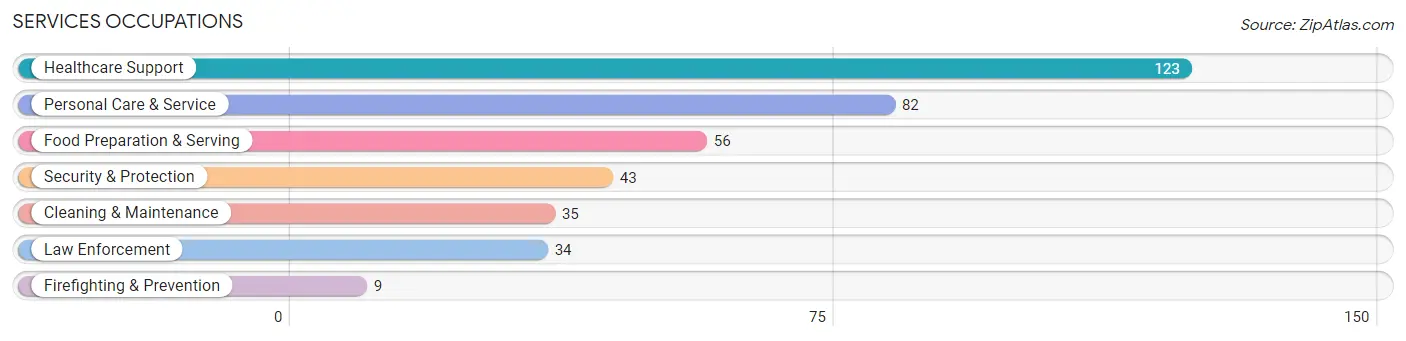
Services Occupations
The most common Services occupations in Fox Point are Healthcare Support (123 | 3.7%), Personal Care & Service (82 | 2.5%), Food Preparation & Serving (56 | 1.7%), Security & Protection (43 | 1.3%), and Cleaning & Maintenance (35 | 1.1%).
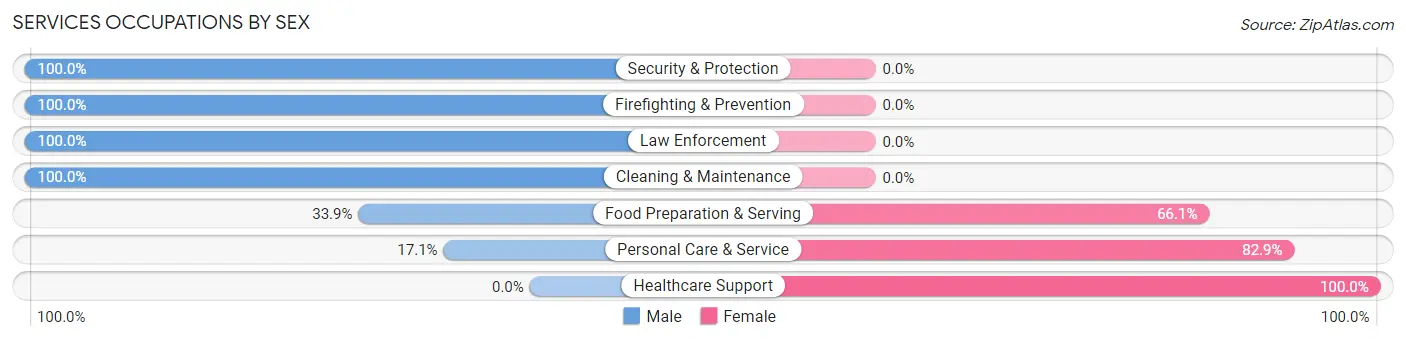
Services Occupations by Sex
Within the Services occupations in Fox Point, the most male-oriented occupations are Security & Protection (100.0%), Firefighting & Prevention (100.0%), and Law Enforcement (100.0%), while the most female-oriented occupations are Healthcare Support (100.0%), Personal Care & Service (82.9%), and Food Preparation & Serving (66.1%).
| Occupation | Male | Female |
| Healthcare Support | 0 (0.0%) | 123 (100.0%) |
| Security & Protection | 43 (100.0%) | 0 (0.0%) |
| Firefighting & Prevention | 9 (100.0%) | 0 (0.0%) |
| Law Enforcement | 34 (100.0%) | 0 (0.0%) |
| Food Preparation & Serving | 19 (33.9%) | 37 (66.1%) |
| Cleaning & Maintenance | 35 (100.0%) | 0 (0.0%) |
| Personal Care & Service | 14 (17.1%) | 68 (82.9%) |
| Total (Category) | 111 (32.7%) | 228 (67.3%) |
| Total (Overall) | 1,782 (53.2%) | 1,566 (46.8%) |
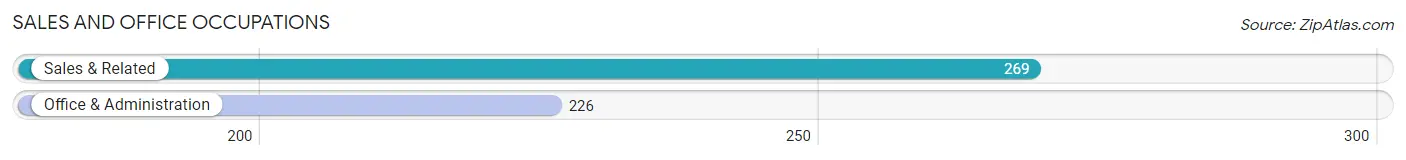
Sales and Office Occupations
The most common Sales and Office occupations in Fox Point are Sales & Related (269 | 8.0%), and Office & Administration (226 | 6.8%).
Sales and Office Occupations by Sex
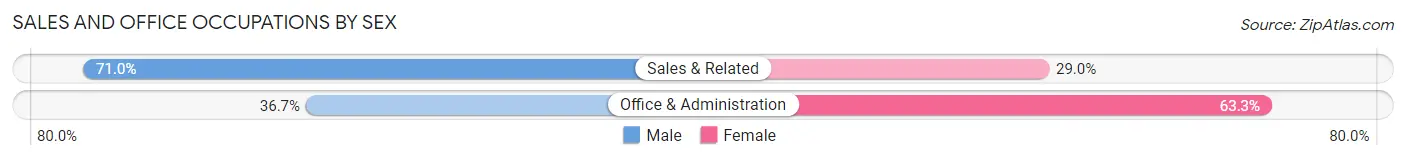
| Occupation | Male | Female |
| Sales & Related | 191 (71.0%) | 78 (29.0%) |
| Office & Administration | 83 (36.7%) | 143 (63.3%) |
| Total (Category) | 274 (55.3%) | 221 (44.7%) |
| Total (Overall) | 1,782 (53.2%) | 1,566 (46.8%) |
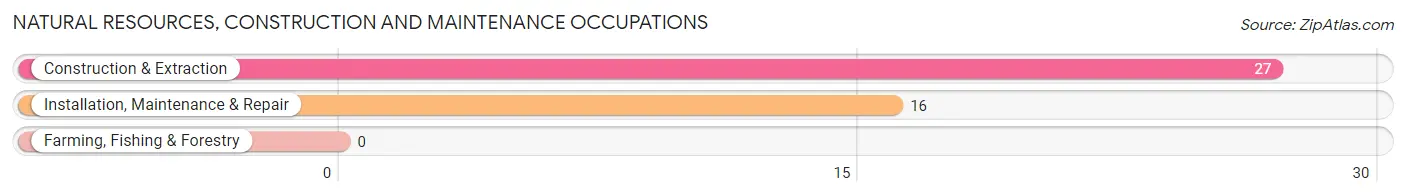
Natural Resources, Construction and Maintenance Occupations
The most common Natural Resources, Construction and Maintenance occupations in Fox Point are Construction & Extraction (27 | 0.8%), and Installation, Maintenance & Repair (16 | 0.5%).
Natural Resources, Construction and Maintenance Occupations by Sex
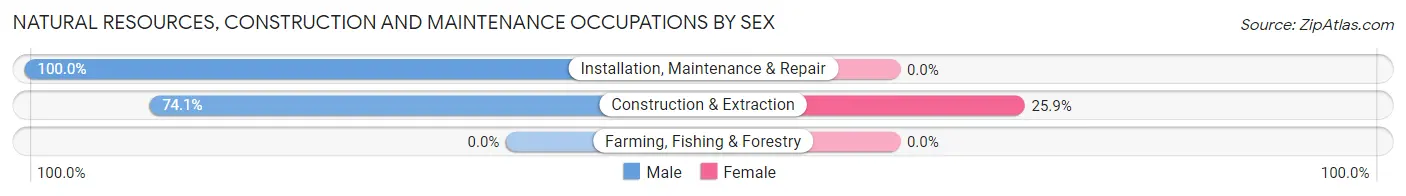
| Occupation | Male | Female |
| Farming, Fishing & Forestry | 0 (0.0%) | 0 (0.0%) |
| Construction & Extraction | 20 (74.1%) | 7 (25.9%) |
| Installation, Maintenance & Repair | 16 (100.0%) | 0 (0.0%) |
| Total (Category) | 36 (83.7%) | 7 (16.3%) |
| Total (Overall) | 1,782 (53.2%) | 1,566 (46.8%) |
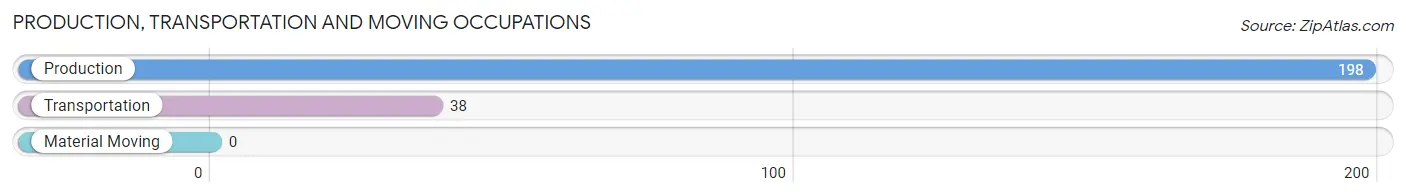
Production, Transportation and Moving Occupations
The most common Production, Transportation and Moving occupations in Fox Point are Production (198 | 5.9%), and Transportation (38 | 1.1%).
Production, Transportation and Moving Occupations by Sex
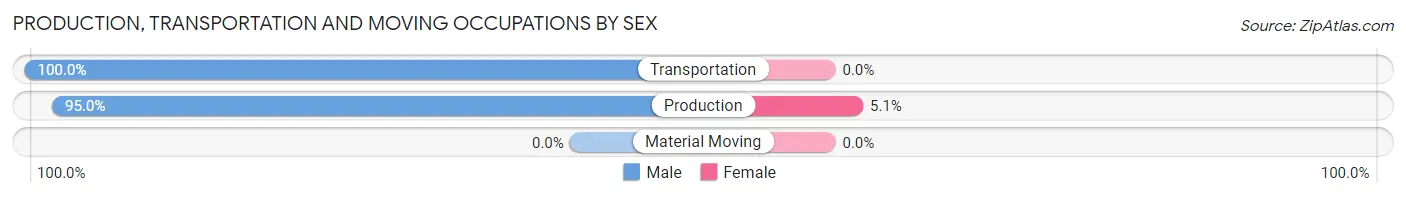
| Occupation | Male | Female |
| Production | 188 (95.0%) | 10 (5.1%) |
| Transportation | 38 (100.0%) | 0 (0.0%) |
| Material Moving | 0 (0.0%) | 0 (0.0%) |
| Total (Category) | 226 (95.8%) | 10 (4.2%) |
| Total (Overall) | 1,782 (53.2%) | 1,566 (46.8%) |
Employment Industries by Sex in Fox Point
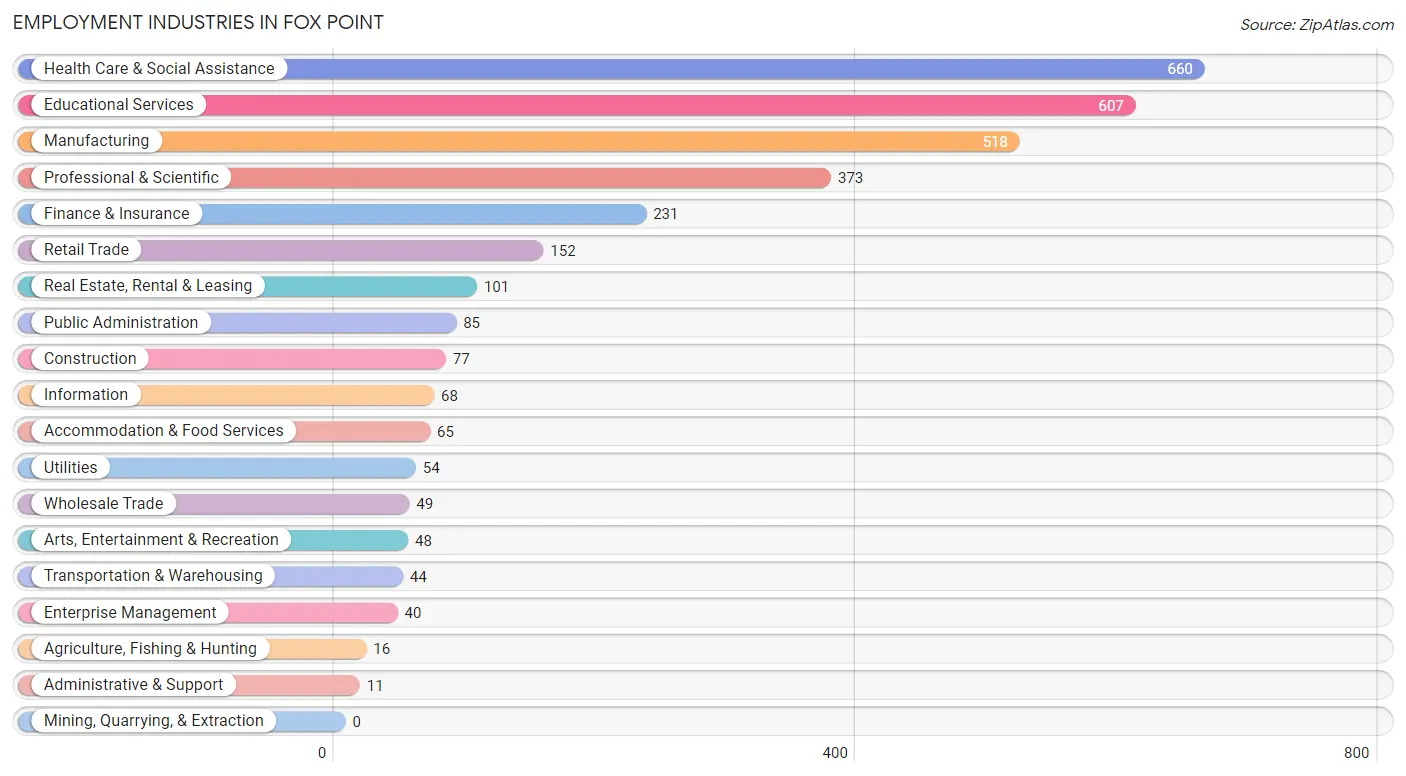
Employment Industries in Fox Point
The major employment industries in Fox Point include Health Care & Social Assistance (660 | 19.7%), Educational Services (607 | 18.1%), Manufacturing (518 | 15.5%), Professional & Scientific (373 | 11.1%), and Finance & Insurance (231 | 6.9%).
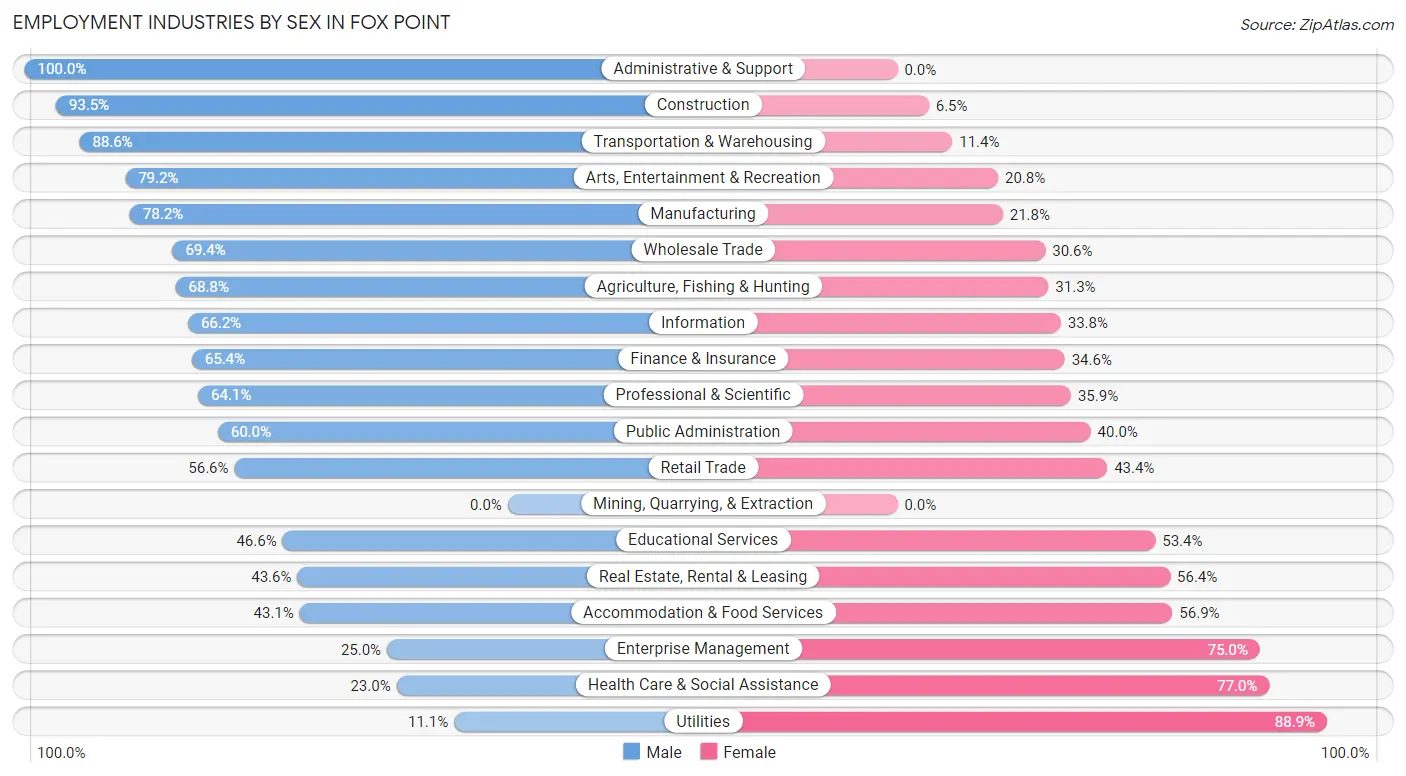
Employment Industries by Sex in Fox Point
The Fox Point industries that see more men than women are Administrative & Support (100.0%), Construction (93.5%), and Transportation & Warehousing (88.6%), whereas the industries that tend to have a higher number of women are Utilities (88.9%), Health Care & Social Assistance (77.0%), and Enterprise Management (75.0%).
| Industry | Male | Female |
| Agriculture, Fishing & Hunting | 11 (68.8%) | 5 (31.2%) |
| Mining, Quarrying, & Extraction | 0 (0.0%) | 0 (0.0%) |
| Construction | 72 (93.5%) | 5 (6.5%) |
| Manufacturing | 405 (78.2%) | 113 (21.8%) |
| Wholesale Trade | 34 (69.4%) | 15 (30.6%) |
| Retail Trade | 86 (56.6%) | 66 (43.4%) |
| Transportation & Warehousing | 39 (88.6%) | 5 (11.4%) |
| Utilities | 6 (11.1%) | 48 (88.9%) |
| Information | 45 (66.2%) | 23 (33.8%) |
| Finance & Insurance | 151 (65.4%) | 80 (34.6%) |
| Real Estate, Rental & Leasing | 44 (43.6%) | 57 (56.4%) |
| Professional & Scientific | 239 (64.1%) | 134 (35.9%) |
| Enterprise Management | 10 (25.0%) | 30 (75.0%) |
| Administrative & Support | 11 (100.0%) | 0 (0.0%) |
| Educational Services | 283 (46.6%) | 324 (53.4%) |
| Health Care & Social Assistance | 152 (23.0%) | 508 (77.0%) |
| Arts, Entertainment & Recreation | 38 (79.2%) | 10 (20.8%) |
| Accommodation & Food Services | 28 (43.1%) | 37 (56.9%) |
| Public Administration | 51 (60.0%) | 34 (40.0%) |
| Total | 1,782 (53.2%) | 1,566 (46.8%) |
Education in Fox Point
School Enrollment in Fox Point
The most common levels of schooling among the 1,879 students in Fox Point are elementary school (442 | 23.5%), middle school (371 | 19.7%), and high school (337 | 17.9%).
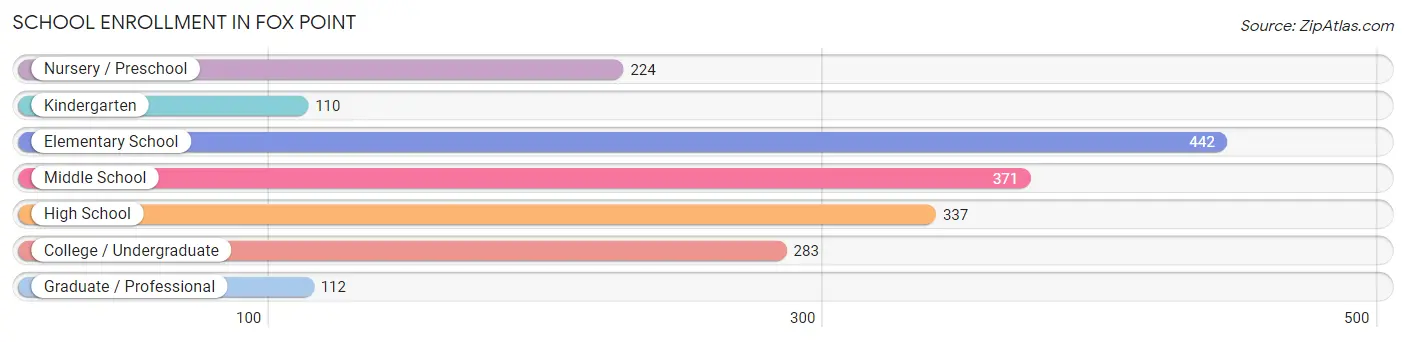
| School Level | # Students | % Students |
| Nursery / Preschool | 224 | 11.9% |
| Kindergarten | 110 | 5.9% |
| Elementary School | 442 | 23.5% |
| Middle School | 371 | 19.7% |
| High School | 337 | 17.9% |
| College / Undergraduate | 283 | 15.1% |
| Graduate / Professional | 112 | 6.0% |
| Total | 1,879 | 100.0% |
School Enrollment by Age by Funding Source in Fox Point
Out of a total of 1,879 students who are enrolled in schools in Fox Point, 690 (36.7%) attend a private institution, while the remaining 1,189 (63.3%) are enrolled in public schools. The age group of 20 to 24 year olds has the highest likelihood of being enrolled in private schools, with 109 (64.5% in the age bracket) enrolled. Conversely, the age group of 10 to 14 year olds has the lowest likelihood of being enrolled in a private school, with 372 (82.9% in the age bracket) attending a public institution.
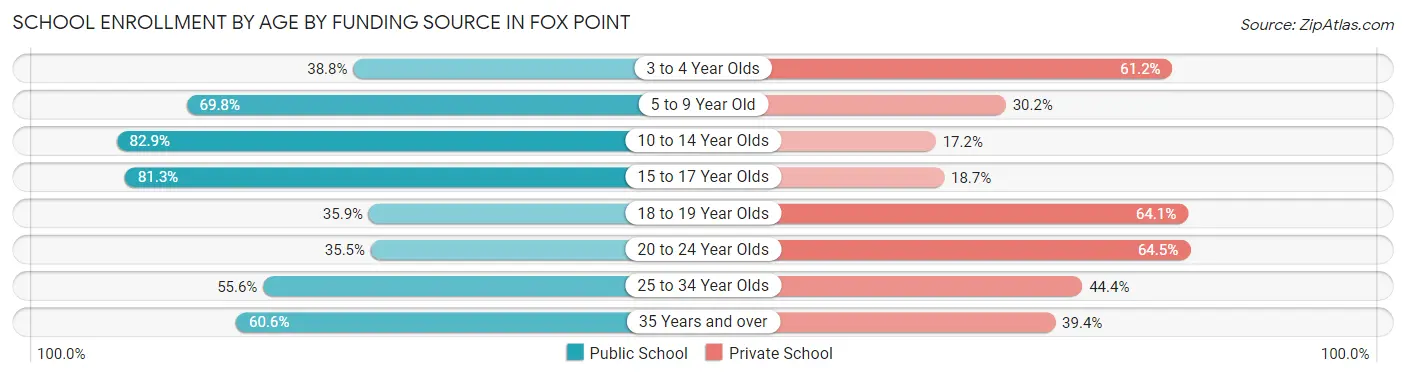
| Age Bracket | Public School | Private School |
| 3 to 4 Year Olds | 88 (38.8%) | 139 (61.2%) |
| 5 to 9 Year Old | 354 (69.8%) | 153 (30.2%) |
| 10 to 14 Year Olds | 372 (82.9%) | 77 (17.2%) |
| 15 to 17 Year Olds | 174 (81.3%) | 40 (18.7%) |
| 18 to 19 Year Olds | 66 (35.9%) | 118 (64.1%) |
| 20 to 24 Year Olds | 60 (35.5%) | 109 (64.5%) |
| 25 to 34 Year Olds | 35 (55.6%) | 28 (44.4%) |
| 35 Years and over | 40 (60.6%) | 26 (39.4%) |
| Total | 1,189 (63.3%) | 690 (36.7%) |
Educational Attainment by Field of Study in Fox Point
Business (602 | 16.1%), science & technology (404 | 10.8%), social sciences (393 | 10.5%), education (341 | 9.1%), and engineering (309 | 8.3%) are the most common fields of study among 3,740 individuals in Fox Point who have obtained a bachelor's degree or higher.
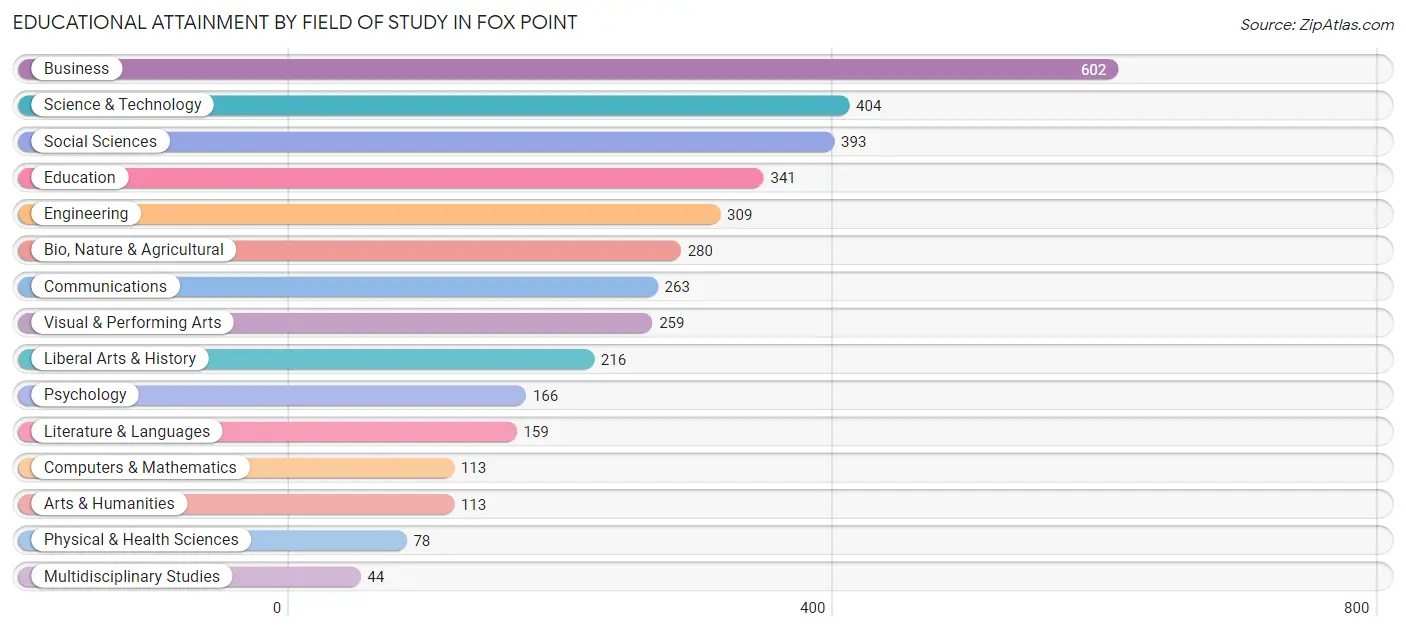
| Field of Study | # Graduates | % Graduates |
| Computers & Mathematics | 113 | 3.0% |
| Bio, Nature & Agricultural | 280 | 7.5% |
| Physical & Health Sciences | 78 | 2.1% |
| Psychology | 166 | 4.4% |
| Social Sciences | 393 | 10.5% |
| Engineering | 309 | 8.3% |
| Multidisciplinary Studies | 44 | 1.2% |
| Science & Technology | 404 | 10.8% |
| Business | 602 | 16.1% |
| Education | 341 | 9.1% |
| Literature & Languages | 159 | 4.3% |
| Liberal Arts & History | 216 | 5.8% |
| Visual & Performing Arts | 259 | 6.9% |
| Communications | 263 | 7.0% |
| Arts & Humanities | 113 | 3.0% |
| Total | 3,740 | 100.0% |
Transportation & Commute in Fox Point
Vehicle Availability by Sex in Fox Point
The most prevalent vehicle ownership categories in Fox Point are males with 2 vehicles (804, accounting for 50.1%) and females with 2 vehicles (818, making up 53.7%).
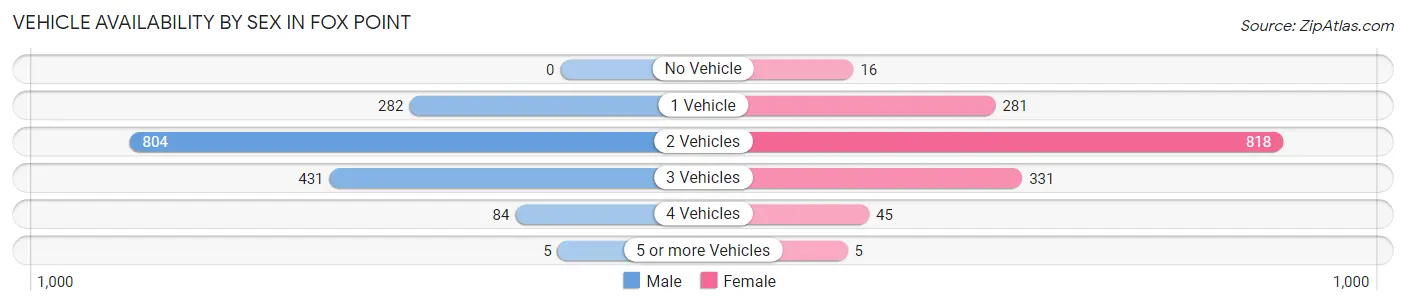
| Vehicles Available | Male | Female |
| No Vehicle | 0 (0.0%) | 16 (1.1%) |
| 1 Vehicle | 282 (17.6%) | 281 (18.8%) |
| 2 Vehicles | 804 (50.1%) | 818 (54.7%) |
| 3 Vehicles | 431 (26.8%) | 331 (22.1%) |
| 4 Vehicles | 84 (5.2%) | 45 (3.0%) |
| 5 or more Vehicles | 5 (0.3%) | 5 (0.3%) |
| Total | 1,606 (100.0%) | 1,496 (100.0%) |
Commute Time in Fox Point
The most frequently occuring commute durations in Fox Point are 30 to 34 minutes (464 commuters, 20.0%), 20 to 24 minutes (387 commuters, 16.7%), and 15 to 19 minutes (337 commuters, 14.5%).
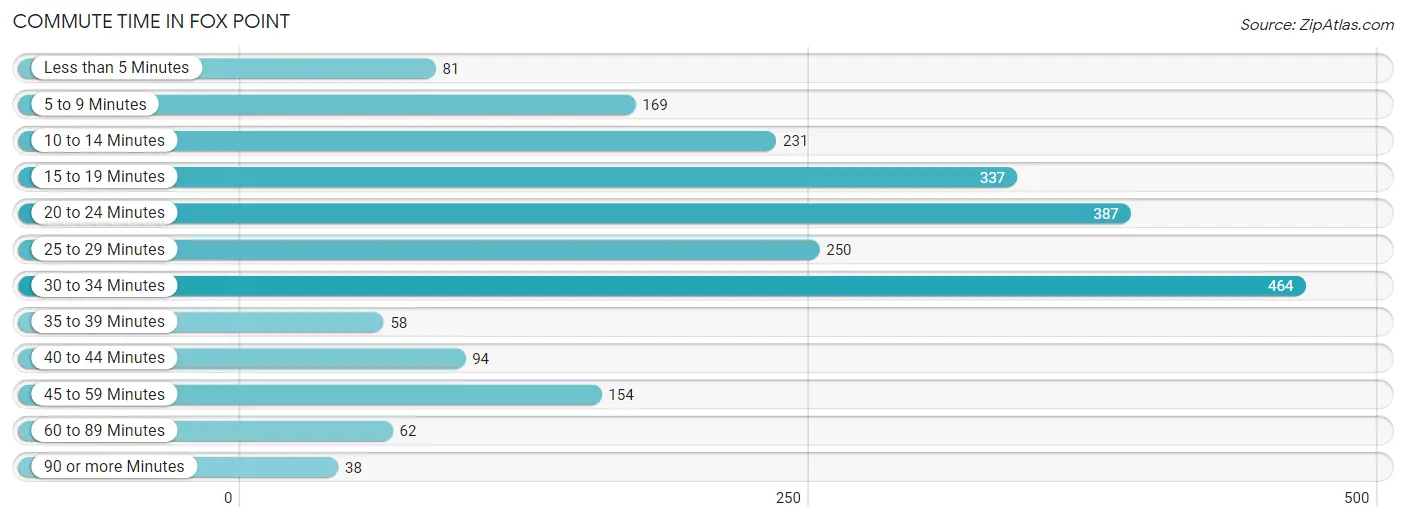
| Commute Time | # Commuters | % Commuters |
| Less than 5 Minutes | 81 | 3.5% |
| 5 to 9 Minutes | 169 | 7.3% |
| 10 to 14 Minutes | 231 | 9.9% |
| 15 to 19 Minutes | 337 | 14.5% |
| 20 to 24 Minutes | 387 | 16.7% |
| 25 to 29 Minutes | 250 | 10.7% |
| 30 to 34 Minutes | 464 | 20.0% |
| 35 to 39 Minutes | 58 | 2.5% |
| 40 to 44 Minutes | 94 | 4.0% |
| 45 to 59 Minutes | 154 | 6.6% |
| 60 to 89 Minutes | 62 | 2.7% |
| 90 or more Minutes | 38 | 1.6% |
Commute Time by Sex in Fox Point
The most common commute times in Fox Point are 20 to 24 minutes (236 commuters, 19.8%) for males and 30 to 34 minutes (282 commuters, 24.9%) for females.
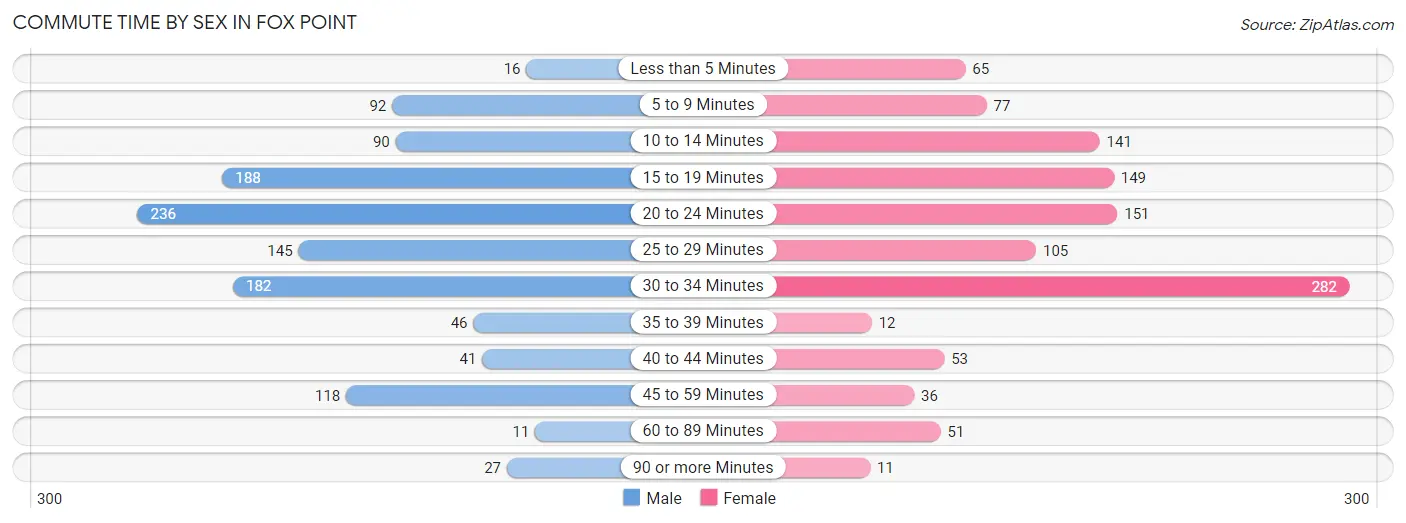
| Commute Time | Male | Female |
| Less than 5 Minutes | 16 (1.3%) | 65 (5.7%) |
| 5 to 9 Minutes | 92 (7.7%) | 77 (6.8%) |
| 10 to 14 Minutes | 90 (7.5%) | 141 (12.4%) |
| 15 to 19 Minutes | 188 (15.8%) | 149 (13.2%) |
| 20 to 24 Minutes | 236 (19.8%) | 151 (13.3%) |
| 25 to 29 Minutes | 145 (12.2%) | 105 (9.3%) |
| 30 to 34 Minutes | 182 (15.3%) | 282 (24.9%) |
| 35 to 39 Minutes | 46 (3.9%) | 12 (1.1%) |
| 40 to 44 Minutes | 41 (3.4%) | 53 (4.7%) |
| 45 to 59 Minutes | 118 (9.9%) | 36 (3.2%) |
| 60 to 89 Minutes | 11 (0.9%) | 51 (4.5%) |
| 90 or more Minutes | 27 (2.3%) | 11 (1.0%) |
Time of Departure to Work by Sex in Fox Point
The most frequent times of departure to work in Fox Point are 7:30 AM to 7:59 AM (286, 24.0%) for males and 8:00 AM to 8:29 AM (220, 19.4%) for females.
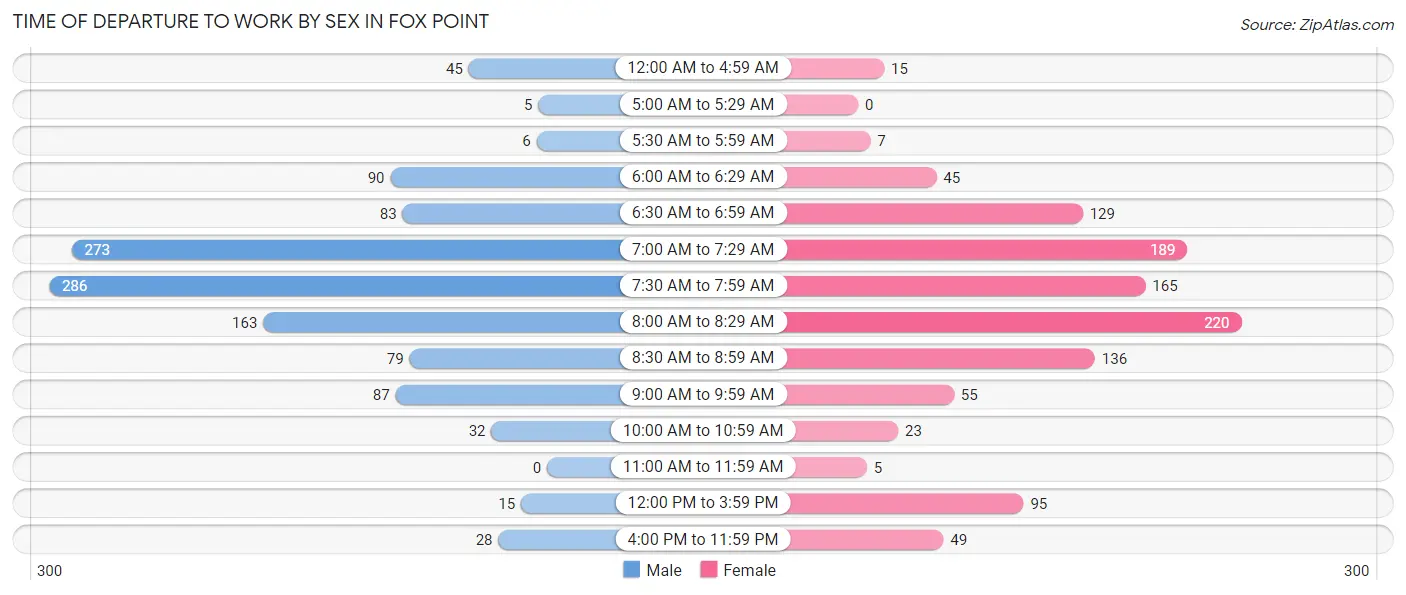
| Time of Departure | Male | Female |
| 12:00 AM to 4:59 AM | 45 (3.8%) | 15 (1.3%) |
| 5:00 AM to 5:29 AM | 5 (0.4%) | 0 (0.0%) |
| 5:30 AM to 5:59 AM | 6 (0.5%) | 7 (0.6%) |
| 6:00 AM to 6:29 AM | 90 (7.5%) | 45 (4.0%) |
| 6:30 AM to 6:59 AM | 83 (7.0%) | 129 (11.4%) |
| 7:00 AM to 7:29 AM | 273 (22.9%) | 189 (16.7%) |
| 7:30 AM to 7:59 AM | 286 (24.0%) | 165 (14.6%) |
| 8:00 AM to 8:29 AM | 163 (13.7%) | 220 (19.4%) |
| 8:30 AM to 8:59 AM | 79 (6.6%) | 136 (12.0%) |
| 9:00 AM to 9:59 AM | 87 (7.3%) | 55 (4.9%) |
| 10:00 AM to 10:59 AM | 32 (2.7%) | 23 (2.0%) |
| 11:00 AM to 11:59 AM | 0 (0.0%) | 5 (0.4%) |
| 12:00 PM to 3:59 PM | 15 (1.3%) | 95 (8.4%) |
| 4:00 PM to 11:59 PM | 28 (2.4%) | 49 (4.3%) |
| Total | 1,192 (100.0%) | 1,133 (100.0%) |
Housing Occupancy in Fox Point
Occupancy by Ownership in Fox Point
Of the total 2,682 dwellings in Fox Point, owner-occupied units account for 2,143 (79.9%), while renter-occupied units make up 539 (20.1%).
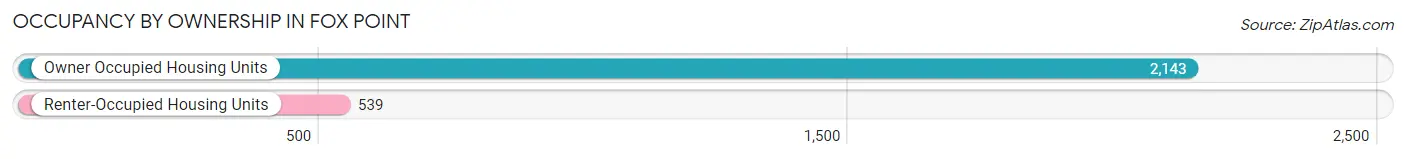
| Occupancy | # Housing Units | % Housing Units |
| Owner Occupied Housing Units | 2,143 | 79.9% |
| Renter-Occupied Housing Units | 539 | 20.1% |
| Total Occupied Housing Units | 2,682 | 100.0% |
Occupancy by Household Size in Fox Point
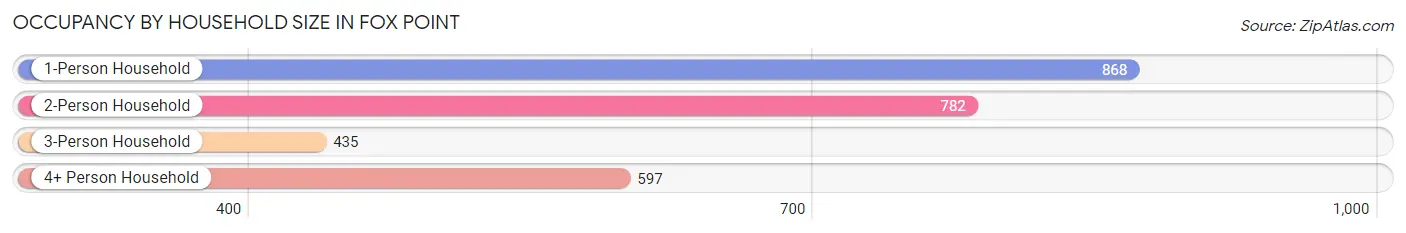
| Household Size | # Housing Units | % Housing Units |
| 1-Person Household | 868 | 32.4% |
| 2-Person Household | 782 | 29.2% |
| 3-Person Household | 435 | 16.2% |
| 4+ Person Household | 597 | 22.3% |
| Total Housing Units | 2,682 | 100.0% |
Occupancy by Ownership by Household Size in Fox Point
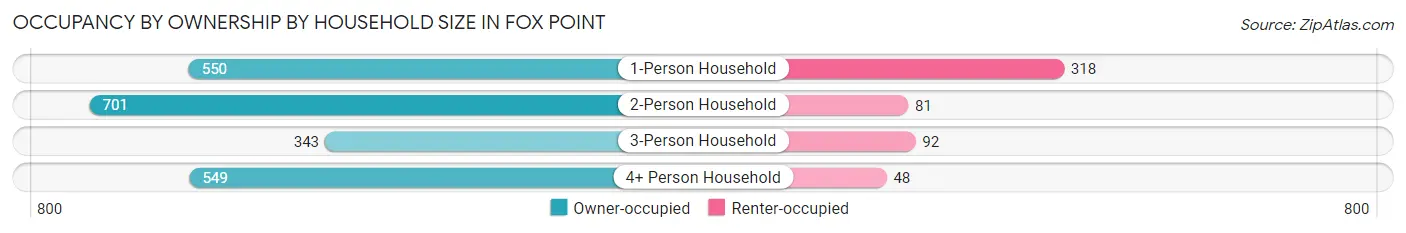
| Household Size | Owner-occupied | Renter-occupied |
| 1-Person Household | 550 (63.4%) | 318 (36.6%) |
| 2-Person Household | 701 (89.6%) | 81 (10.4%) |
| 3-Person Household | 343 (78.8%) | 92 (21.1%) |
| 4+ Person Household | 549 (92.0%) | 48 (8.0%) |
| Total Housing Units | 2,143 (79.9%) | 539 (20.1%) |
Occupancy by Educational Attainment in Fox Point
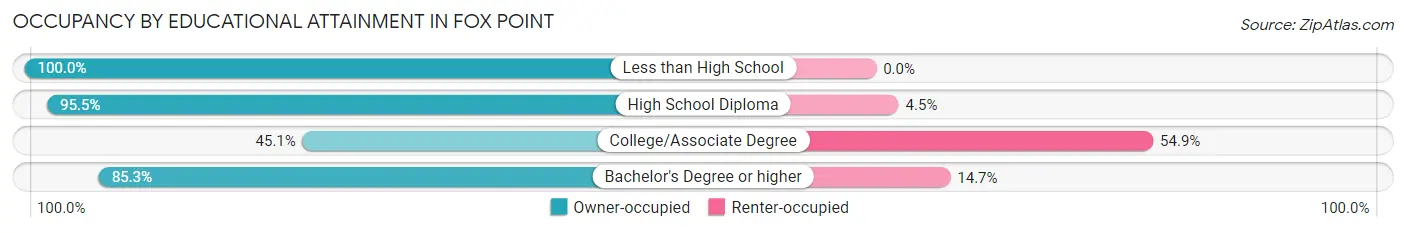
| Household Size | Owner-occupied | Renter-occupied |
| Less than High School | 56 (100.0%) | 0 (0.0%) |
| High School Diploma | 214 (95.5%) | 10 (4.5%) |
| College/Associate Degree | 197 (45.1%) | 240 (54.9%) |
| Bachelor's Degree or higher | 1,676 (85.3%) | 289 (14.7%) |
Occupancy by Age of Householder in Fox Point
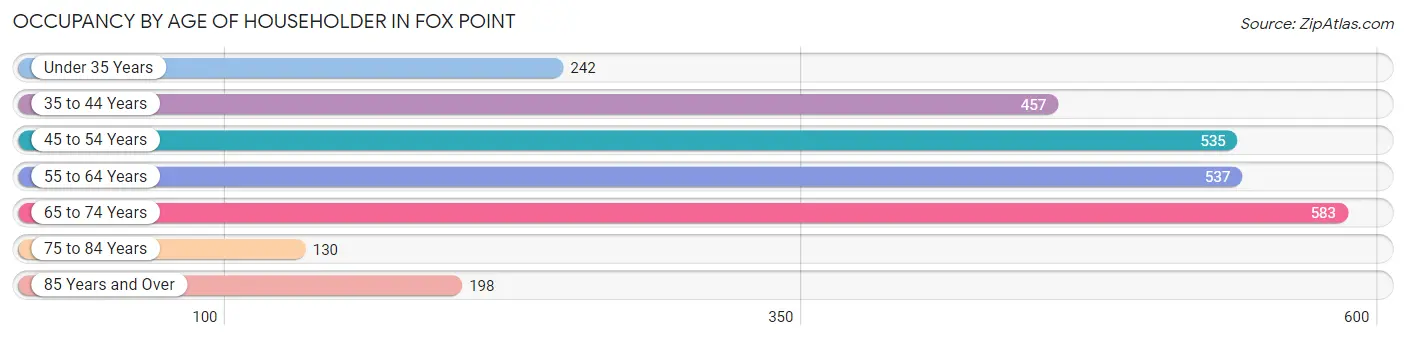
| Age Bracket | # Households | % Households |
| Under 35 Years | 242 | 9.0% |
| 35 to 44 Years | 457 | 17.0% |
| 45 to 54 Years | 535 | 20.0% |
| 55 to 64 Years | 537 | 20.0% |
| 65 to 74 Years | 583 | 21.7% |
| 75 to 84 Years | 130 | 4.9% |
| 85 Years and Over | 198 | 7.4% |
| Total | 2,682 | 100.0% |
Housing Finances in Fox Point
Median Income by Occupancy in Fox Point
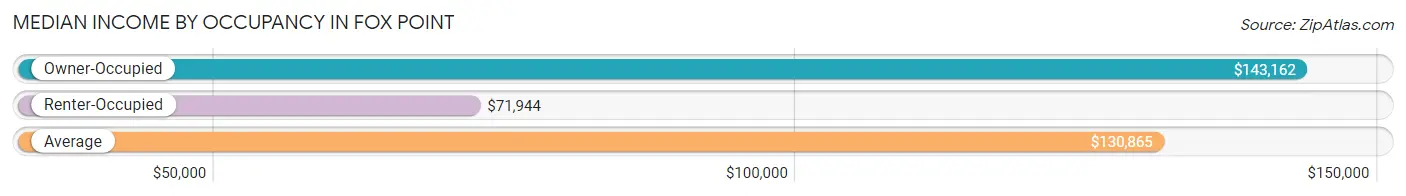
| Occupancy Type | # Households | Median Income |
| Owner-Occupied | 2,143 (79.9%) | $143,162 |
| Renter-Occupied | 539 (20.1%) | $71,944 |
| Average | 2,682 (100.0%) | $130,865 |
Occupancy by Householder Income Bracket in Fox Point
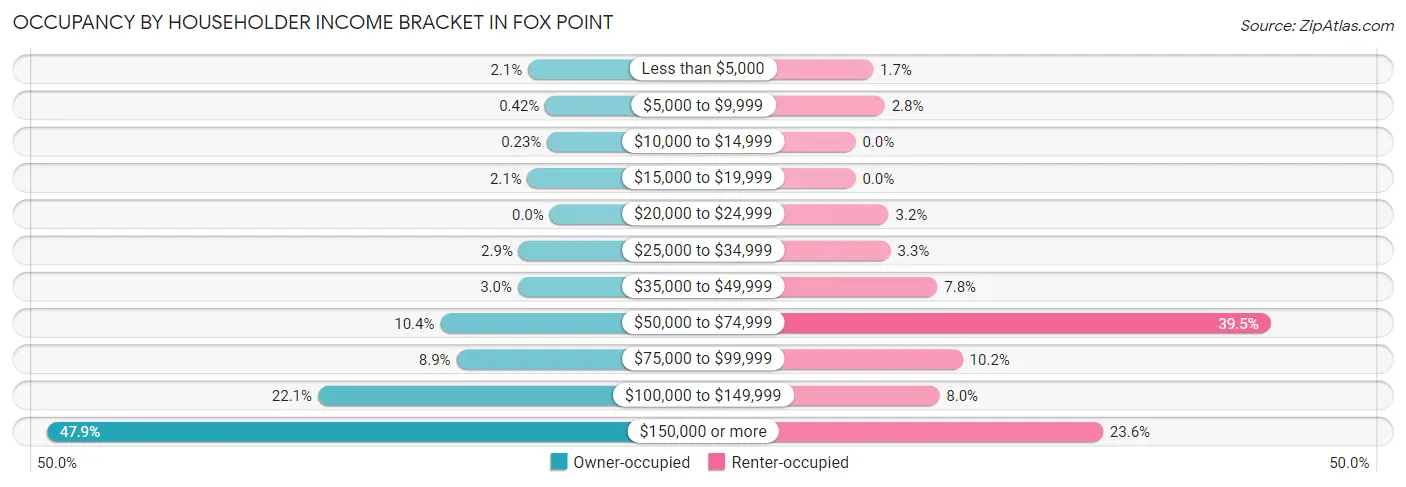
| Income Bracket | Owner-occupied | Renter-occupied |
| Less than $5,000 | 44 (2.1%) | 9 (1.7%) |
| $5,000 to $9,999 | 9 (0.4%) | 15 (2.8%) |
| $10,000 to $14,999 | 5 (0.2%) | 0 (0.0%) |
| $15,000 to $19,999 | 45 (2.1%) | 0 (0.0%) |
| $20,000 to $24,999 | 0 (0.0%) | 17 (3.2%) |
| $25,000 to $34,999 | 63 (2.9%) | 18 (3.3%) |
| $35,000 to $49,999 | 65 (3.0%) | 42 (7.8%) |
| $50,000 to $74,999 | 223 (10.4%) | 213 (39.5%) |
| $75,000 to $99,999 | 190 (8.9%) | 55 (10.2%) |
| $100,000 to $149,999 | 473 (22.1%) | 43 (8.0%) |
| $150,000 or more | 1,026 (47.9%) | 127 (23.6%) |
| Total | 2,143 (100.0%) | 539 (100.0%) |
Monthly Housing Cost Tiers in Fox Point
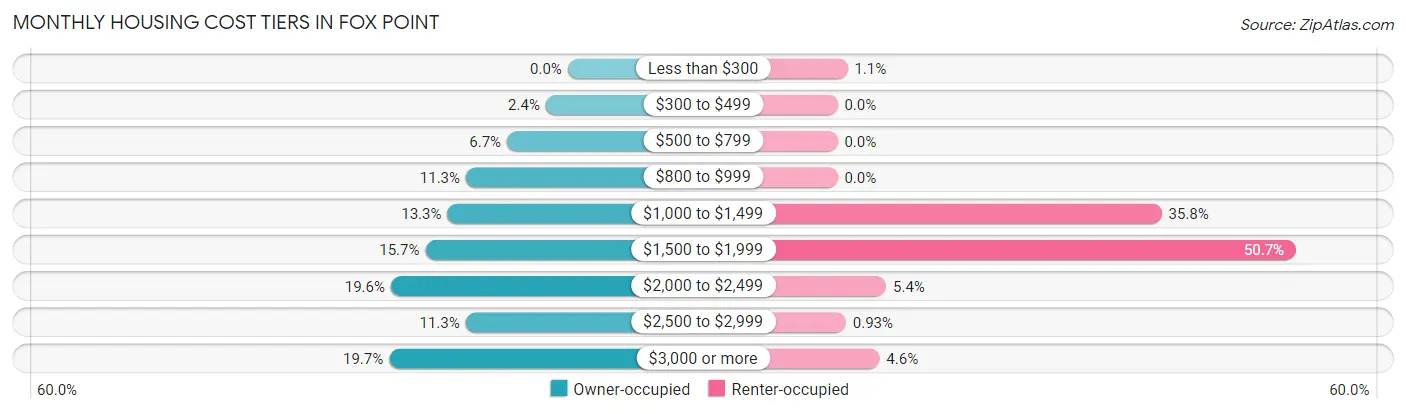
| Monthly Cost | Owner-occupied | Renter-occupied |
| Less than $300 | 0 (0.0%) | 6 (1.1%) |
| $300 to $499 | 52 (2.4%) | 0 (0.0%) |
| $500 to $799 | 144 (6.7%) | 0 (0.0%) |
| $800 to $999 | 241 (11.3%) | 0 (0.0%) |
| $1,000 to $1,499 | 285 (13.3%) | 193 (35.8%) |
| $1,500 to $1,999 | 337 (15.7%) | 273 (50.6%) |
| $2,000 to $2,499 | 419 (19.6%) | 29 (5.4%) |
| $2,500 to $2,999 | 242 (11.3%) | 5 (0.9%) |
| $3,000 or more | 423 (19.7%) | 25 (4.6%) |
| Total | 2,143 (100.0%) | 539 (100.0%) |
Physical Housing Characteristics in Fox Point
Housing Structures in Fox Point
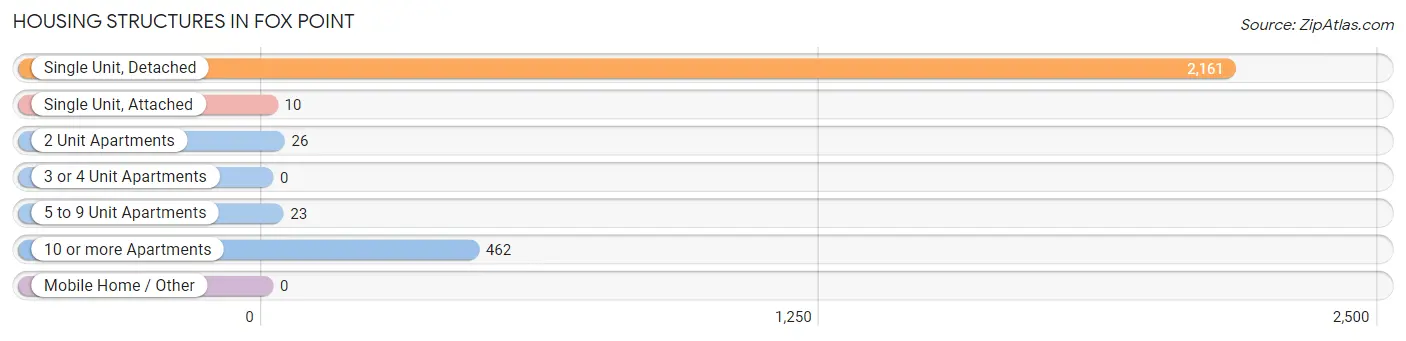
| Structure Type | # Housing Units | % Housing Units |
| Single Unit, Detached | 2,161 | 80.6% |
| Single Unit, Attached | 10 | 0.4% |
| 2 Unit Apartments | 26 | 1.0% |
| 3 or 4 Unit Apartments | 0 | 0.0% |
| 5 to 9 Unit Apartments | 23 | 0.9% |
| 10 or more Apartments | 462 | 17.2% |
| Mobile Home / Other | 0 | 0.0% |
| Total | 2,682 | 100.0% |
Housing Structures by Occupancy in Fox Point
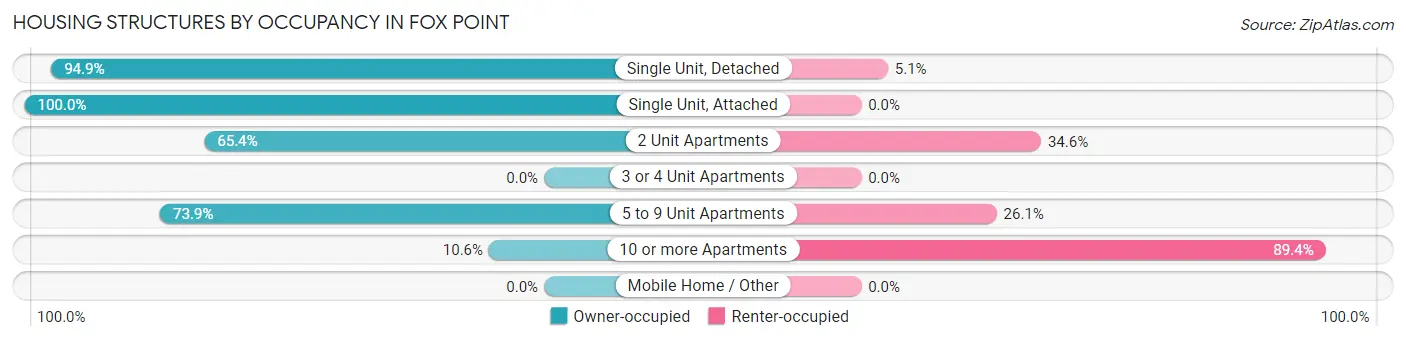
| Structure Type | Owner-occupied | Renter-occupied |
| Single Unit, Detached | 2,050 (94.9%) | 111 (5.1%) |
| Single Unit, Attached | 10 (100.0%) | 0 (0.0%) |
| 2 Unit Apartments | 17 (65.4%) | 9 (34.6%) |
| 3 or 4 Unit Apartments | 0 (0.0%) | 0 (0.0%) |
| 5 to 9 Unit Apartments | 17 (73.9%) | 6 (26.1%) |
| 10 or more Apartments | 49 (10.6%) | 413 (89.4%) |
| Mobile Home / Other | 0 (0.0%) | 0 (0.0%) |
| Total | 2,143 (79.9%) | 539 (20.1%) |
Housing Structures by Number of Rooms in Fox Point
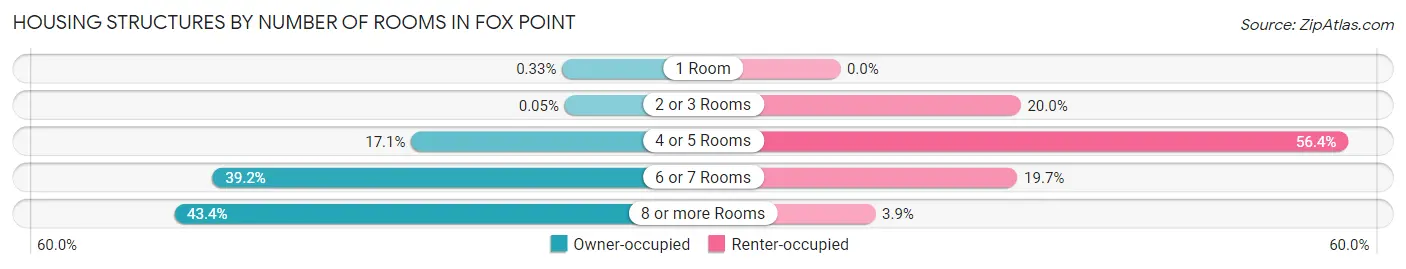
| Number of Rooms | Owner-occupied | Renter-occupied |
| 1 Room | 7 (0.3%) | 0 (0.0%) |
| 2 or 3 Rooms | 1 (0.1%) | 108 (20.0%) |
| 4 or 5 Rooms | 366 (17.1%) | 304 (56.4%) |
| 6 or 7 Rooms | 839 (39.2%) | 106 (19.7%) |
| 8 or more Rooms | 930 (43.4%) | 21 (3.9%) |
| Total | 2,143 (100.0%) | 539 (100.0%) |
Housing Structure by Heating Type in Fox Point
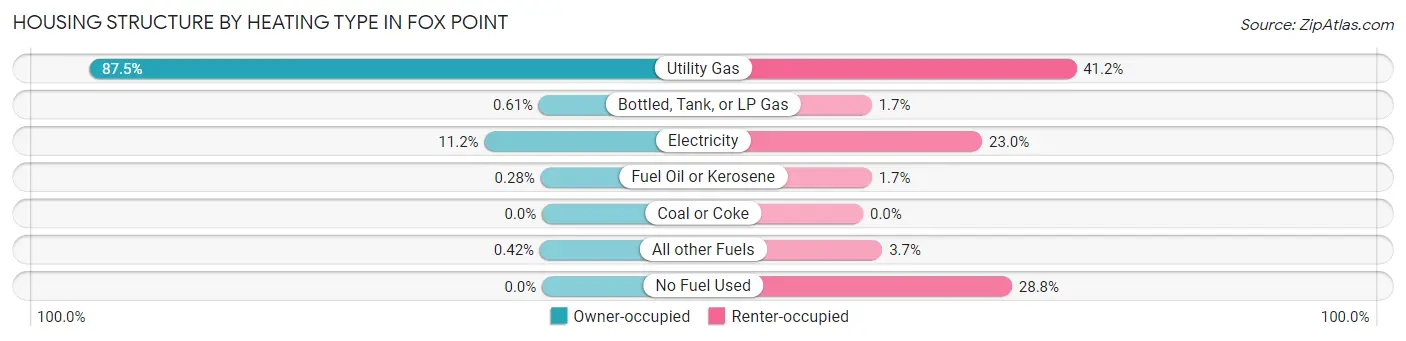
| Heating Type | Owner-occupied | Renter-occupied |
| Utility Gas | 1,876 (87.5%) | 222 (41.2%) |
| Bottled, Tank, or LP Gas | 13 (0.6%) | 9 (1.7%) |
| Electricity | 239 (11.2%) | 124 (23.0%) |
| Fuel Oil or Kerosene | 6 (0.3%) | 9 (1.7%) |
| Coal or Coke | 0 (0.0%) | 0 (0.0%) |
| All other Fuels | 9 (0.4%) | 20 (3.7%) |
| No Fuel Used | 0 (0.0%) | 155 (28.8%) |
| Total | 2,143 (100.0%) | 539 (100.0%) |
Household Vehicle Usage in Fox Point
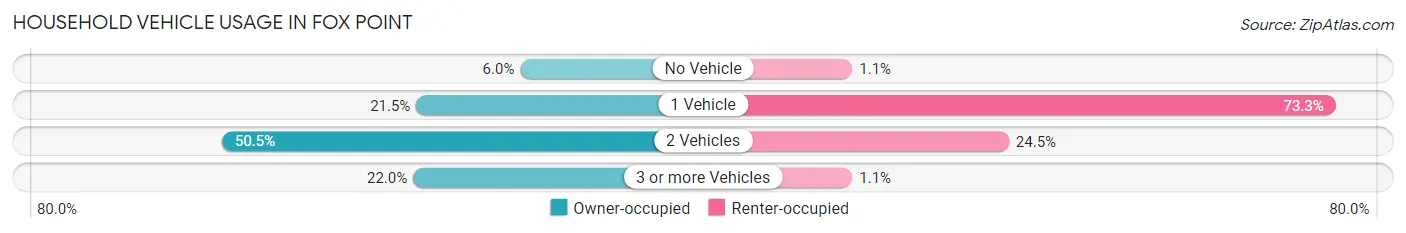
| Vehicles per Household | Owner-occupied | Renter-occupied |
| No Vehicle | 128 (6.0%) | 6 (1.1%) |
| 1 Vehicle | 461 (21.5%) | 395 (73.3%) |
| 2 Vehicles | 1,083 (50.5%) | 132 (24.5%) |
| 3 or more Vehicles | 471 (22.0%) | 6 (1.1%) |
| Total | 2,143 (100.0%) | 539 (100.0%) |
Real Estate & Mortgages in Fox Point
Real Estate and Mortgage Overview in Fox Point
| Characteristic | Without Mortgage | With Mortgage |
| Housing Units | 879 | 1,264 |
| Median Property Value | $346,700 | $402,600 |
| Median Household Income | $98,472 | $700 |
| Monthly Housing Costs | $1,019 | $329 |
| Real Estate Taxes | $7,400 | $7 |
Property Value by Mortgage Status in Fox Point
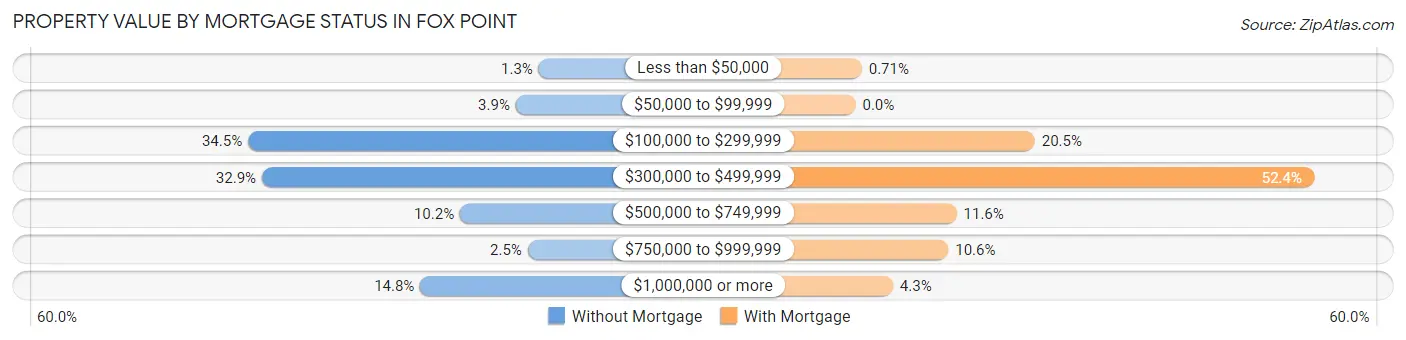
| Property Value | Without Mortgage | With Mortgage |
| Less than $50,000 | 11 (1.3%) | 9 (0.7%) |
| $50,000 to $99,999 | 34 (3.9%) | 0 (0.0%) |
| $100,000 to $299,999 | 303 (34.5%) | 259 (20.5%) |
| $300,000 to $499,999 | 289 (32.9%) | 662 (52.4%) |
| $500,000 to $749,999 | 90 (10.2%) | 146 (11.6%) |
| $750,000 to $999,999 | 22 (2.5%) | 134 (10.6%) |
| $1,000,000 or more | 130 (14.8%) | 54 (4.3%) |
| Total | 879 (100.0%) | 1,264 (100.0%) |
Household Income by Mortgage Status in Fox Point
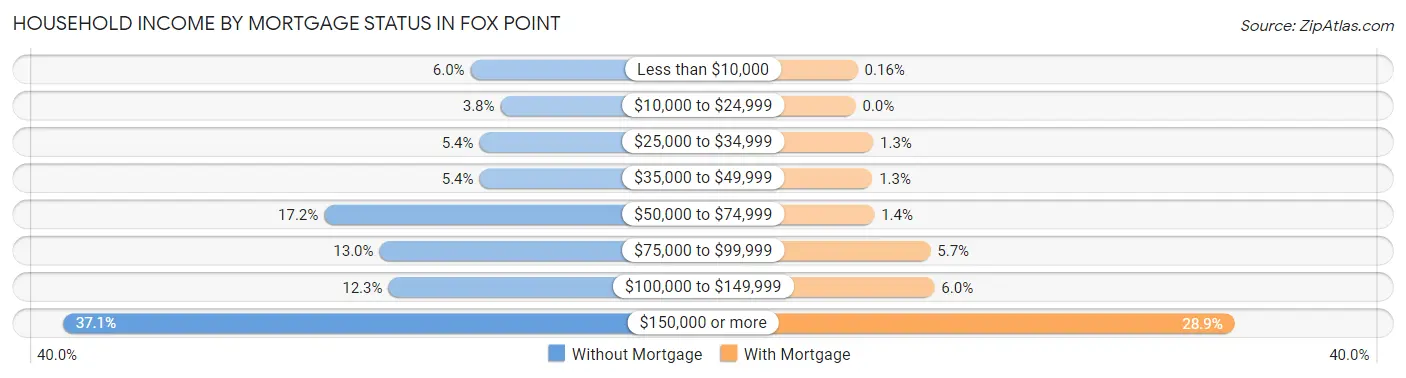
| Household Income | Without Mortgage | With Mortgage |
| Less than $10,000 | 53 (6.0%) | 2 (0.2%) |
| $10,000 to $24,999 | 33 (3.7%) | 0 (0.0%) |
| $25,000 to $34,999 | 47 (5.3%) | 17 (1.3%) |
| $35,000 to $49,999 | 47 (5.3%) | 16 (1.3%) |
| $50,000 to $74,999 | 151 (17.2%) | 18 (1.4%) |
| $75,000 to $99,999 | 114 (13.0%) | 72 (5.7%) |
| $100,000 to $149,999 | 108 (12.3%) | 76 (6.0%) |
| $150,000 or more | 326 (37.1%) | 365 (28.9%) |
| Total | 879 (100.0%) | 1,264 (100.0%) |
Property Value to Household Income Ratio in Fox Point
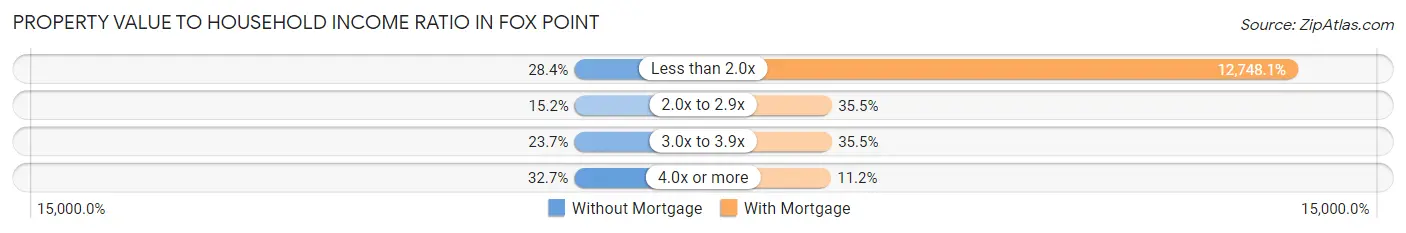
| Value-to-Income Ratio | Without Mortgage | With Mortgage |
| Less than 2.0x | 250 (28.4%) | 161,136 (12,748.1%) |
| 2.0x to 2.9x | 134 (15.2%) | 449 (35.5%) |
| 3.0x to 3.9x | 208 (23.7%) | 449 (35.5%) |
| 4.0x or more | 287 (32.7%) | 141 (11.2%) |
| Total | 879 (100.0%) | 1,264 (100.0%) |
Real Estate Taxes by Mortgage Status in Fox Point
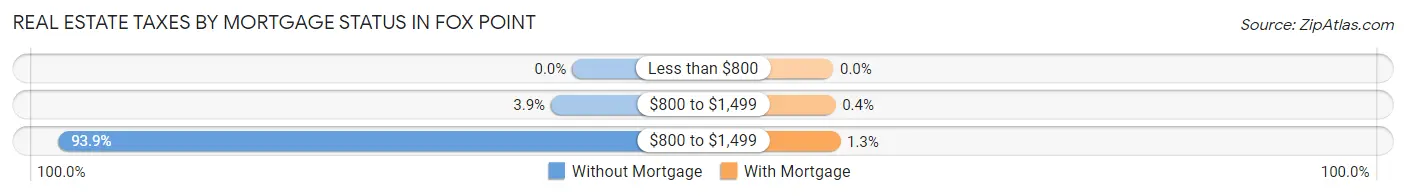
| Property Taxes | Without Mortgage | With Mortgage |
| Less than $800 | 0 (0.0%) | 0 (0.0%) |
| $800 to $1,499 | 34 (3.9%) | 5 (0.4%) |
| $800 to $1,499 | 825 (93.9%) | 16 (1.3%) |
| Total | 879 (100.0%) | 1,264 (100.0%) |
Health & Disability in Fox Point
Health Insurance Coverage by Age in Fox Point
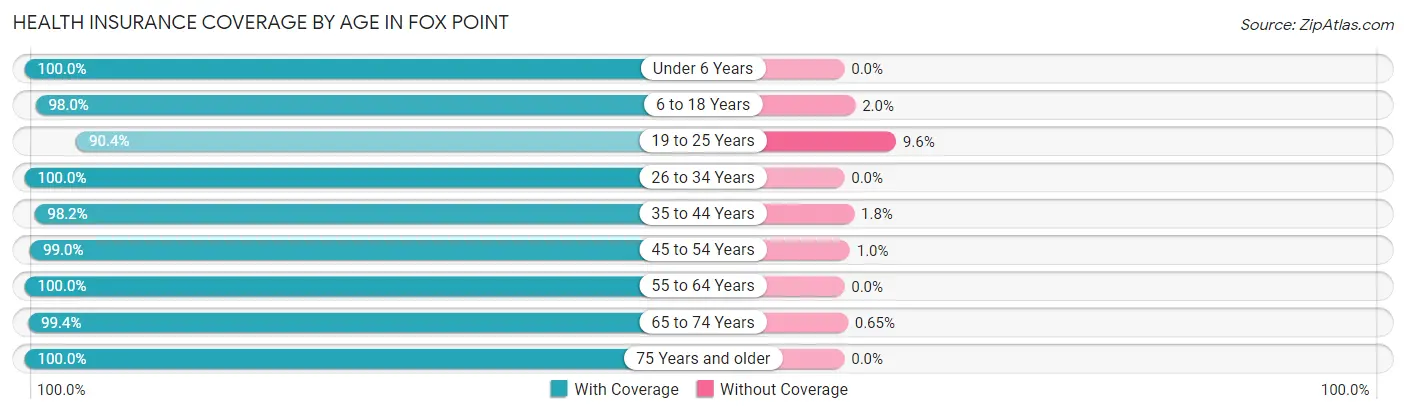
| Age Bracket | With Coverage | Without Coverage |
| Under 6 Years | 548 (100.0%) | 0 (0.0%) |
| 6 to 18 Years | 1,253 (98.0%) | 26 (2.0%) |
| 19 to 25 Years | 376 (90.4%) | 40 (9.6%) |
| 26 to 34 Years | 394 (100.0%) | 0 (0.0%) |
| 35 to 44 Years | 857 (98.2%) | 16 (1.8%) |
| 45 to 54 Years | 968 (99.0%) | 10 (1.0%) |
| 55 to 64 Years | 806 (100.0%) | 0 (0.0%) |
| 65 to 74 Years | 914 (99.4%) | 6 (0.6%) |
| 75 Years and older | 597 (100.0%) | 0 (0.0%) |
| Total | 6,713 (98.6%) | 98 (1.4%) |
Health Insurance Coverage by Citizenship Status in Fox Point
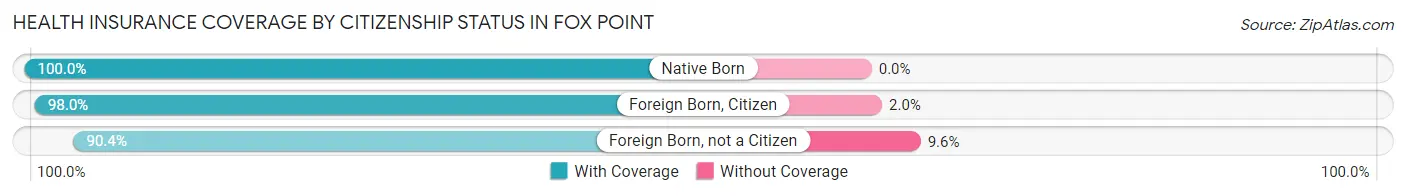
| Citizenship Status | With Coverage | Without Coverage |
| Native Born | 548 (100.0%) | 0 (0.0%) |
| Foreign Born, Citizen | 1,253 (98.0%) | 26 (2.0%) |
| Foreign Born, not a Citizen | 376 (90.4%) | 40 (9.6%) |
Health Insurance Coverage by Household Income in Fox Point
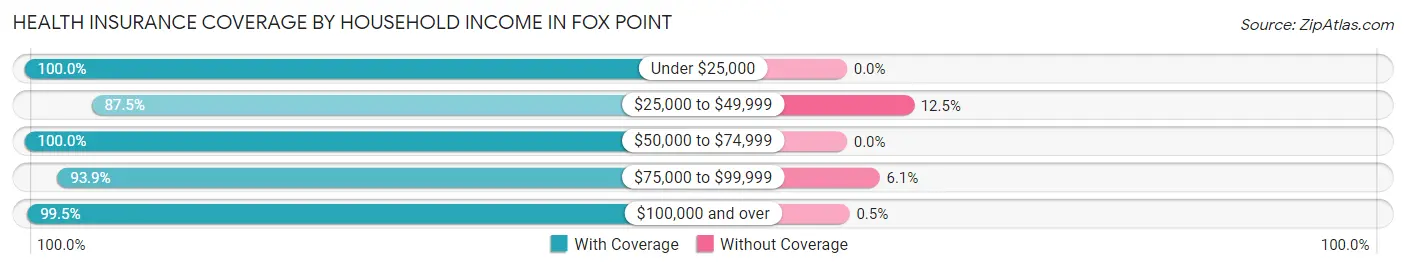
| Household Income | With Coverage | Without Coverage |
| Under $25,000 | 217 (100.0%) | 0 (0.0%) |
| $25,000 to $49,999 | 244 (87.5%) | 35 (12.5%) |
| $50,000 to $74,999 | 647 (100.0%) | 0 (0.0%) |
| $75,000 to $99,999 | 443 (93.9%) | 29 (6.1%) |
| $100,000 and over | 4,984 (99.5%) | 25 (0.5%) |
Public vs Private Health Insurance Coverage by Age in Fox Point
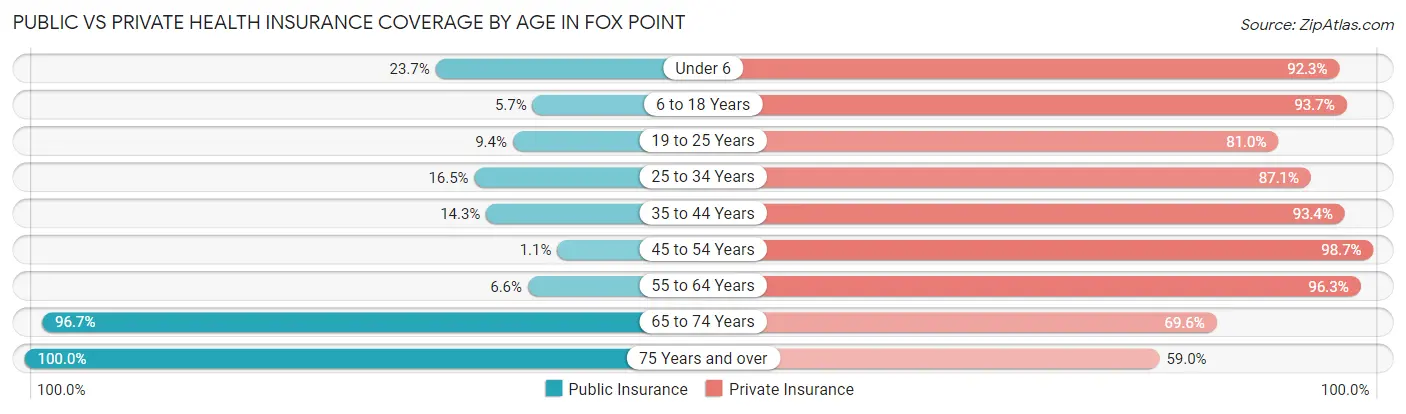
| Age Bracket | Public Insurance | Private Insurance |
| Under 6 | 130 (23.7%) | 506 (92.3%) |
| 6 to 18 Years | 73 (5.7%) | 1,198 (93.7%) |
| 19 to 25 Years | 39 (9.4%) | 337 (81.0%) |
| 25 to 34 Years | 65 (16.5%) | 343 (87.1%) |
| 35 to 44 Years | 125 (14.3%) | 815 (93.4%) |
| 45 to 54 Years | 11 (1.1%) | 965 (98.7%) |
| 55 to 64 Years | 53 (6.6%) | 776 (96.3%) |
| 65 to 74 Years | 890 (96.7%) | 640 (69.6%) |
| 75 Years and over | 597 (100.0%) | 352 (59.0%) |
| Total | 1,983 (29.1%) | 5,932 (87.1%) |
Disability Status by Sex by Age in Fox Point
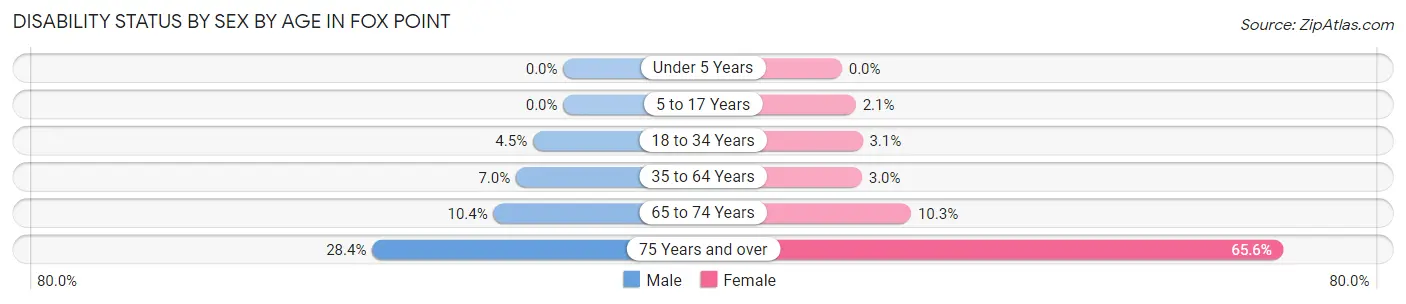
| Age Bracket | Male | Female |
| Under 5 Years | 0 (0.0%) | 0 (0.0%) |
| 5 to 17 Years | 0 (0.0%) | 13 (2.1%) |
| 18 to 34 Years | 20 (4.5%) | 17 (3.1%) |
| 35 to 64 Years | 92 (7.0%) | 40 (3.0%) |
| 65 to 74 Years | 50 (10.4%) | 45 (10.3%) |
| 75 Years and over | 63 (28.4%) | 246 (65.6%) |
Disability Class by Sex by Age in Fox Point
Disability Class: Hearing Difficulty
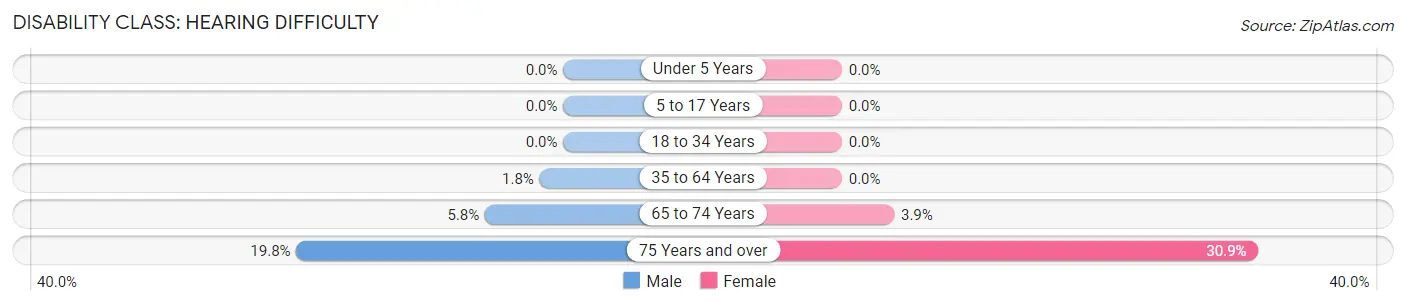
| Age Bracket | Male | Female |
| Under 5 Years | 0 (0.0%) | 0 (0.0%) |
| 5 to 17 Years | 0 (0.0%) | 0 (0.0%) |
| 18 to 34 Years | 0 (0.0%) | 0 (0.0%) |
| 35 to 64 Years | 23 (1.8%) | 0 (0.0%) |
| 65 to 74 Years | 28 (5.8%) | 17 (3.9%) |
| 75 Years and over | 44 (19.8%) | 116 (30.9%) |
Disability Class: Vision Difficulty
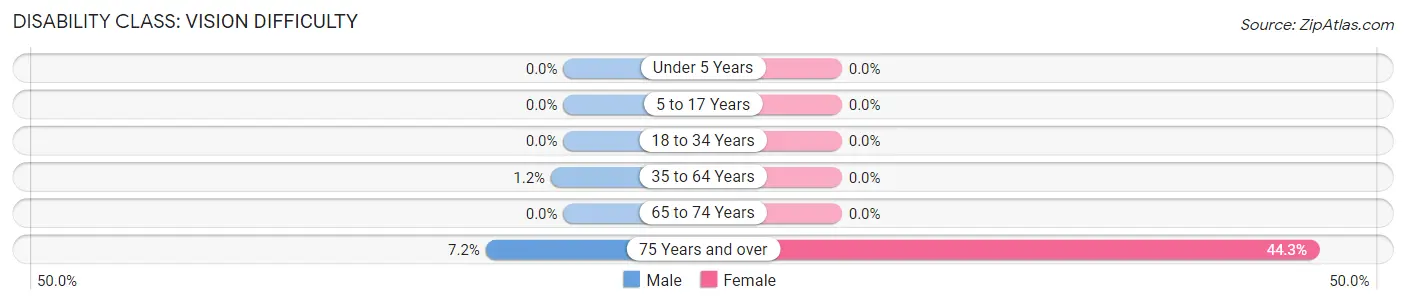
| Age Bracket | Male | Female |
| Under 5 Years | 0 (0.0%) | 0 (0.0%) |
| 5 to 17 Years | 0 (0.0%) | 0 (0.0%) |
| 18 to 34 Years | 0 (0.0%) | 0 (0.0%) |
| 35 to 64 Years | 15 (1.1%) | 0 (0.0%) |
| 65 to 74 Years | 0 (0.0%) | 0 (0.0%) |
| 75 Years and over | 16 (7.2%) | 166 (44.3%) |
Disability Class: Cognitive Difficulty
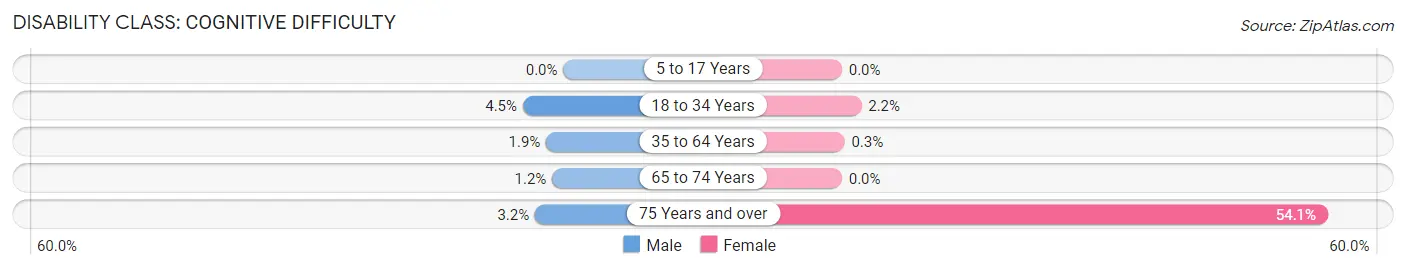
| Age Bracket | Male | Female |
| 5 to 17 Years | 0 (0.0%) | 0 (0.0%) |
| 18 to 34 Years | 20 (4.5%) | 12 (2.2%) |
| 35 to 64 Years | 25 (1.9%) | 4 (0.3%) |
| 65 to 74 Years | 6 (1.2%) | 0 (0.0%) |
| 75 Years and over | 7 (3.2%) | 203 (54.1%) |
Disability Class: Ambulatory Difficulty
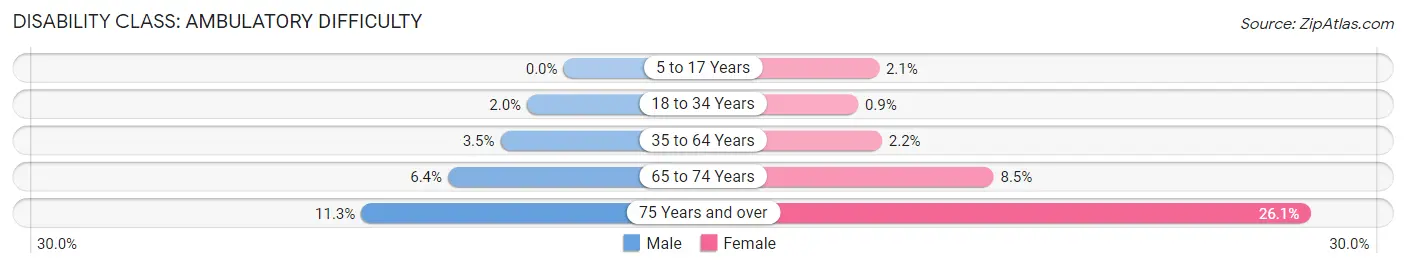
| Age Bracket | Male | Female |
| 5 to 17 Years | 0 (0.0%) | 13 (2.1%) |
| 18 to 34 Years | 9 (2.0%) | 5 (0.9%) |
| 35 to 64 Years | 46 (3.5%) | 30 (2.2%) |
| 65 to 74 Years | 31 (6.4%) | 37 (8.5%) |
| 75 Years and over | 25 (11.3%) | 98 (26.1%) |
Disability Class: Self-Care Difficulty
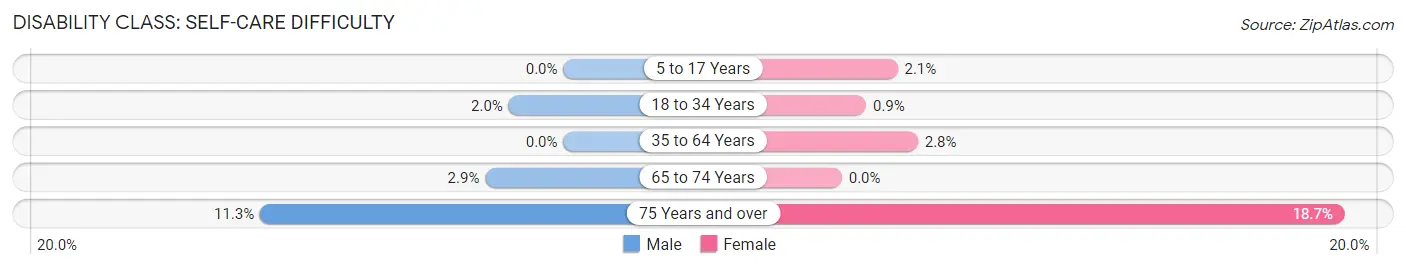
| Age Bracket | Male | Female |
| 5 to 17 Years | 0 (0.0%) | 13 (2.1%) |
| 18 to 34 Years | 9 (2.0%) | 5 (0.9%) |
| 35 to 64 Years | 0 (0.0%) | 38 (2.8%) |
| 65 to 74 Years | 14 (2.9%) | 0 (0.0%) |
| 75 Years and over | 25 (11.3%) | 70 (18.7%) |
Technology Access in Fox Point
Computing Device Access in Fox Point
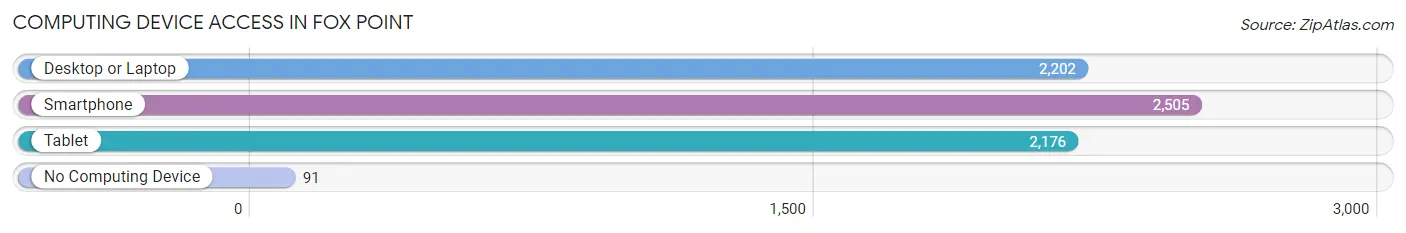
| Device Type | # Households | % Households |
| Desktop or Laptop | 2,202 | 82.1% |
| Smartphone | 2,505 | 93.4% |
| Tablet | 2,176 | 81.1% |
| No Computing Device | 91 | 3.4% |
| Total | 2,682 | 100.0% |
Internet Access in Fox Point
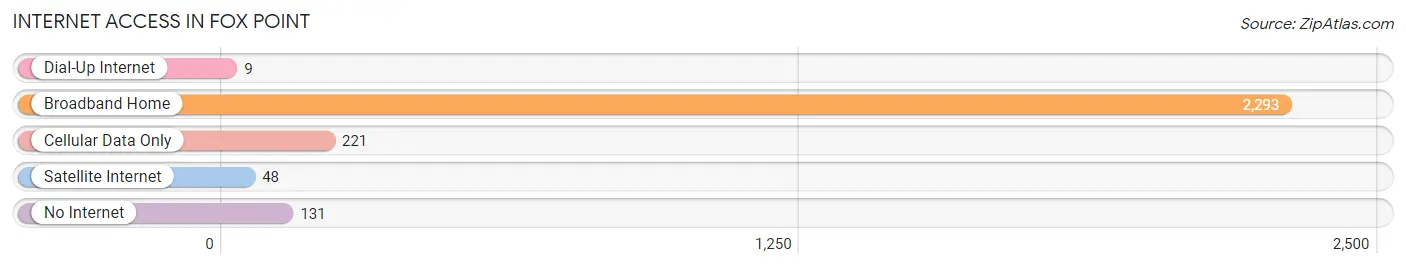
| Internet Type | # Households | % Households |
| Dial-Up Internet | 9 | 0.3% |
| Broadband Home | 2,293 | 85.5% |
| Cellular Data Only | 221 | 8.2% |
| Satellite Internet | 48 | 1.8% |
| No Internet | 131 | 4.9% |
| Total | 2,682 | 100.0% |
Fox Point Summary
History
Fox Point is a village located in Milwaukee County, Wisconsin. It is situated on the western shore of Lake Michigan, just north of Milwaukee. The village was first settled in 1835 by a group of German immigrants, who named it “Fox Point” after the foxes that roamed the area. The village was officially incorporated in 1951.
Fox Point has a rich history of industry and commerce. In the late 19th century, the village was home to a number of factories, including a tannery, a brickyard, and a paper mill. The paper mill was the largest employer in the village, and it provided jobs for many of the residents. In the early 20th century, the village was home to a number of small businesses, including a grocery store, a bakery, and a blacksmith shop.
Geography
Fox Point is located in Milwaukee County, Wisconsin. It is situated on the western shore of Lake Michigan, just north of Milwaukee. The village is bordered by the city of Bayside to the north, the city of Glendale to the east, and the city of Whitefish Bay to the south. The village covers an area of 2.2 square miles, and it has a population of 6,845 people, as of the 2010 census.
The village is located on a peninsula, which is surrounded by Lake Michigan on three sides. The village is home to several parks, including Fox Point Park, which offers a beach, picnic areas, and a playground. The village also has a number of trails, including the Fox Point Trail, which runs along the lakefront.
Economy
Fox Point is a primarily residential community, and the village does not have a large industrial base. The village is home to a number of small businesses, including restaurants, retail stores, and professional services. The village is also home to a number of corporate offices, including those of Northwestern Mutual and ManpowerGroup.
The village is served by the Milwaukee County Transit System, which provides bus service to the village and the surrounding area. The village is also served by the Milwaukee County Airport, which is located just south of the village.
Demographics
As of the 2010 census, the population of Fox Point was 6,845 people. The racial makeup of the village was 87.3% White, 5.2% African American, 0.7% Native American, 2.7% Asian, 0.1% Pacific Islander, 1.3% from other races, and 2.9% from two or more races. Hispanic or Latino of any race were 4.2% of the population.
The median household income in Fox Point was $90,945, and the median family income was $106,945. The per capita income for the village was $45,945. About 4.2% of families and 5.3% of the population were below the poverty line, including 6.2% of those under age 18 and 4.2% of those age 65 or over.
Common Questions
What is Per Capita Income in Fox Point?
Per Capita income in Fox Point is $91,650.
What is the Median Family Income in Fox Point?
Median Family Income in Fox Point is $166,635.
What is the Median Household income in Fox Point?
Median Household Income in Fox Point is $130,865.
What is Income or Wage Gap in Fox Point?
Income or Wage Gap in Fox Point is 40.4%.
Women in Fox Point earn 59.6 cents for every dollar earned by a man.
What is Inequality or Gini Index in Fox Point?
Inequality or Gini Index in Fox Point is 0.56.
What is the Total Population of Fox Point?
Total Population of Fox Point is 6,811.
What is the Total Male Population of Fox Point?
Total Male Population of Fox Point is 3,220.
What is the Total Female Population of Fox Point?
Total Female Population of Fox Point is 3,591.
What is the Ratio of Males per 100 Females in Fox Point?
There are 89.67 Males per 100 Females in Fox Point.
What is the Ratio of Females per 100 Males in Fox Point?
There are 111.52 Females per 100 Males in Fox Point.
What is the Median Population Age in Fox Point?
Median Population Age in Fox Point is 43.9 Years.
What is the Average Family Size in Fox Point
Average Family Size in Fox Point is 3.2 People.
What is the Average Household Size in Fox Point
Average Household Size in Fox Point is 2.5 People.
How Large is the Labor Force in Fox Point?
There are 3,363 People in the Labor Forcein in Fox Point.
What is the Percentage of People in the Labor Force in Fox Point?
63.3% of People are in the Labor Force in Fox Point.
What is the Unemployment Rate in Fox Point?
Unemployment Rate in Fox Point is 0.4%.