Sandy Hook, WI Map & Demographics
Sandy Hook Map
Sandy Hook Overview
$43,500
PER CAPITA INCOME
$76,402
AVG FAMILY INCOME
$76,288
AVG HOUSEHOLD INCOME
0.35
INEQUALITY / GINI INDEX
261
TOTAL POPULATION
125
MALE POPULATION
136
FEMALE POPULATION
91.91
MALES / 100 FEMALES
108.80
FEMALES / 100 MALES
34.3
MEDIAN AGE
2.6
AVG FAMILY SIZE
2.5
AVG HOUSEHOLD SIZE
185
LABOR FORCE [ PEOPLE ]
75.2%
PERCENT IN LABOR FORCE
4.3%
UNEMPLOYMENT RATE
Income in Sandy Hook
Income Overview in Sandy Hook
Per Capita Income in Sandy Hook is $43,500, while median incomes of families and households are $76,402 and $76,288 respectively.
| Characteristic | Number | Measure |
| Per Capita Income | 261 | $43,500 |
| Median Family Income | 93 | $76,402 |
| Mean Family Income | 93 | $112,626 |
| Median Household Income | 104 | $76,288 |
| Mean Household Income | 104 | $108,417 |
| Income Deficit | 93 | $0 |
| Wage / Income Gap (%) | 261 | 0.00% |
| Wage / Income Gap ($) | 261 | 100.00¢ per $1 |
| Gini / Inequality Index | 261 | 0.35 |
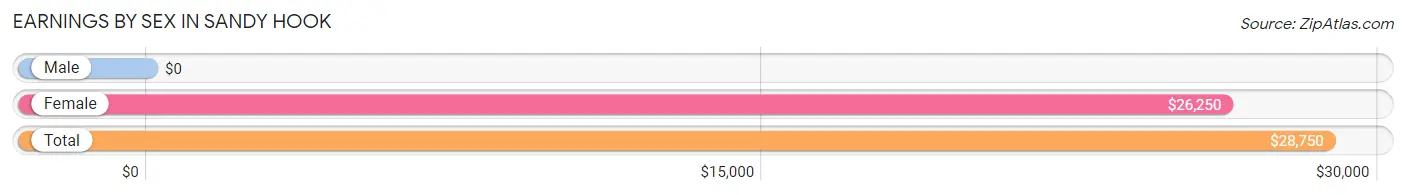
Earnings by Sex in Sandy Hook
| Sex | Number | Average Earnings |
| Male | 92 (47.2%) | $0 |
| Female | 103 (52.8%) | $26,250 |
| Total | 195 (100.0%) | $28,750 |
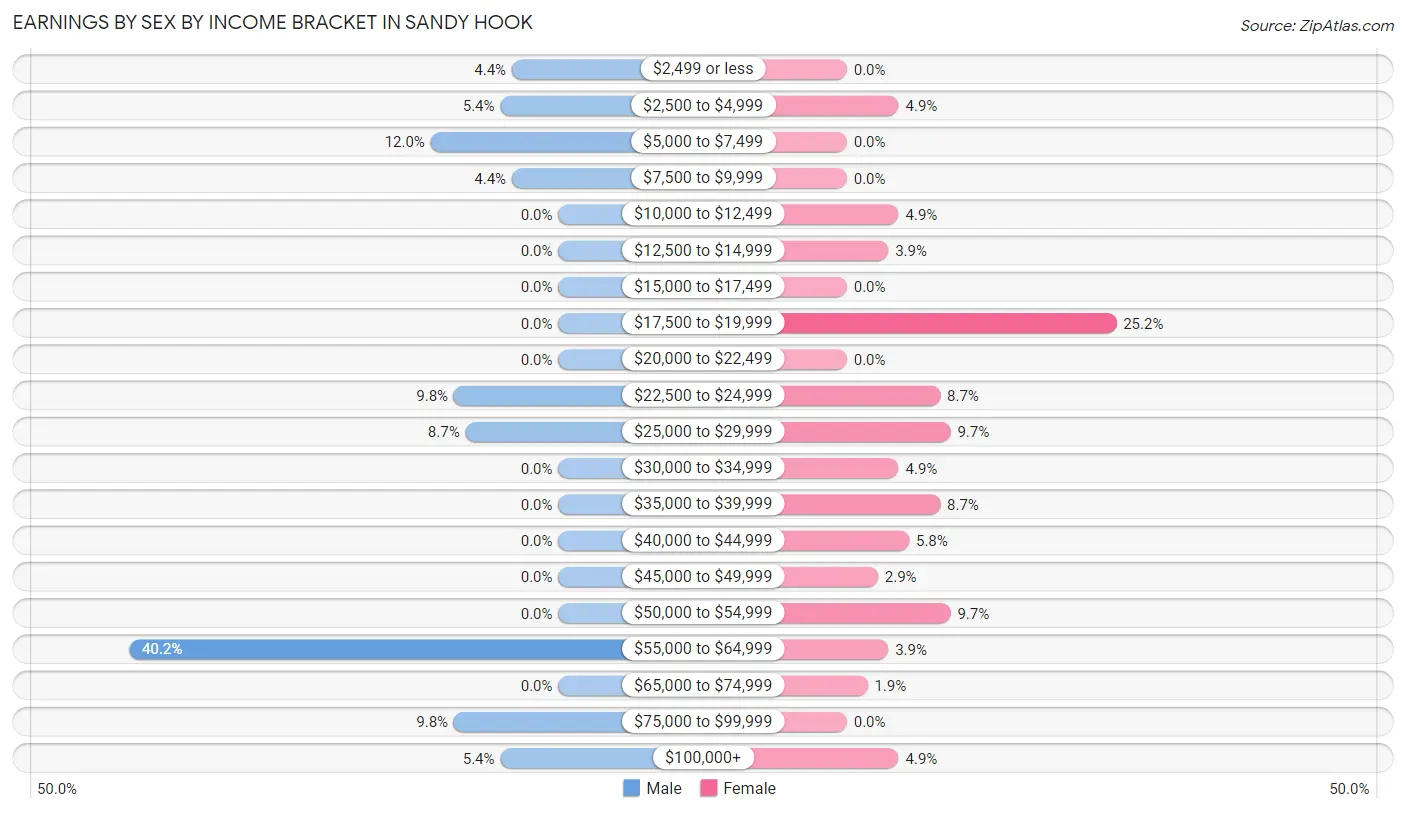
Earnings by Sex by Income Bracket in Sandy Hook
The most common earnings brackets in Sandy Hook are $55,000 to $64,999 for men (37 | 40.2%) and $17,500 to $19,999 for women (26 | 25.2%).
| Income | Male | Female |
| $2,499 or less | 4 (4.3%) | 0 (0.0%) |
| $2,500 to $4,999 | 5 (5.4%) | 5 (4.9%) |
| $5,000 to $7,499 | 11 (12.0%) | 0 (0.0%) |
| $7,500 to $9,999 | 4 (4.3%) | 0 (0.0%) |
| $10,000 to $12,499 | 0 (0.0%) | 5 (4.9%) |
| $12,500 to $14,999 | 0 (0.0%) | 4 (3.9%) |
| $15,000 to $17,499 | 0 (0.0%) | 0 (0.0%) |
| $17,500 to $19,999 | 0 (0.0%) | 26 (25.2%) |
| $20,000 to $22,499 | 0 (0.0%) | 0 (0.0%) |
| $22,500 to $24,999 | 9 (9.8%) | 9 (8.7%) |
| $25,000 to $29,999 | 8 (8.7%) | 10 (9.7%) |
| $30,000 to $34,999 | 0 (0.0%) | 5 (4.9%) |
| $35,000 to $39,999 | 0 (0.0%) | 9 (8.7%) |
| $40,000 to $44,999 | 0 (0.0%) | 6 (5.8%) |
| $45,000 to $49,999 | 0 (0.0%) | 3 (2.9%) |
| $50,000 to $54,999 | 0 (0.0%) | 10 (9.7%) |
| $55,000 to $64,999 | 37 (40.2%) | 4 (3.9%) |
| $65,000 to $74,999 | 0 (0.0%) | 2 (1.9%) |
| $75,000 to $99,999 | 9 (9.8%) | 0 (0.0%) |
| $100,000+ | 5 (5.4%) | 5 (4.9%) |
| Total | 92 (100.0%) | 103 (100.0%) |
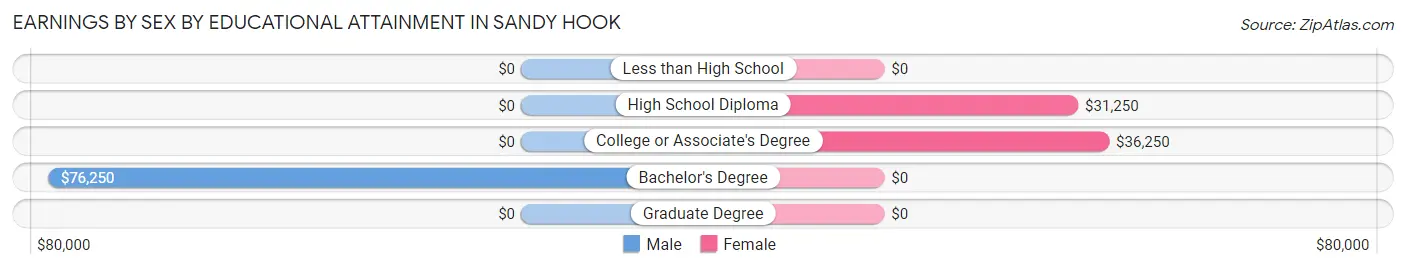
Earnings by Sex by Educational Attainment in Sandy Hook
Average earnings in Sandy Hook are $58,068 for men and $27,000 for women, a difference of 53.5%. Men with an educational attainment of bachelor's degree enjoy the highest average annual earnings of $76,250, while those with bachelor's degree education earn the least with $76,250. Women with an educational attainment of college or associate's degree earn the most with the average annual earnings of $36,250, while those with high school diploma education have the smallest earnings of $31,250.
| Educational Attainment | Male Income | Female Income |
| Less than High School | - | - |
| High School Diploma | - | - |
| College or Associate's Degree | - | - |
| Bachelor's Degree | $76,250 | $0 |
| Graduate Degree | - | - |
| Total | $58,068 | $27,000 |
Family Income in Sandy Hook
Family Income Brackets in Sandy Hook
According to the Sandy Hook family income data, there are 37 families falling into the $75,000 to $99,999 income range, which is the most common income bracket and makes up 39.8% of all families.
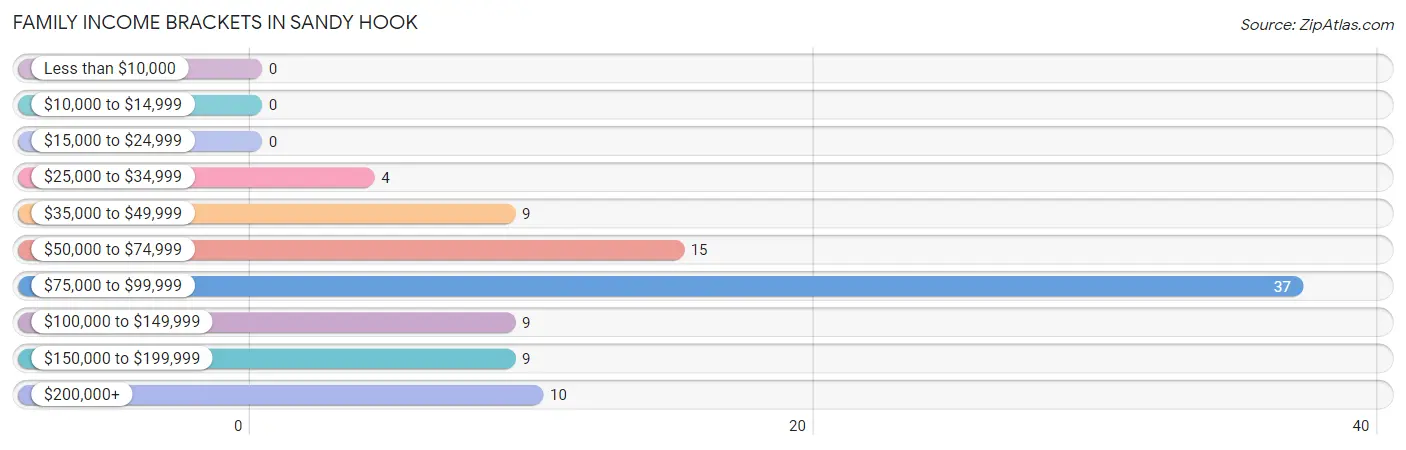
| Income Bracket | # Families | % Families |
| Less than $10,000 | 0 | 0.0% |
| $10,000 to $14,999 | 0 | 0.0% |
| $15,000 to $24,999 | 0 | 0.0% |
| $25,000 to $34,999 | 4 | 4.3% |
| $35,000 to $49,999 | 9 | 9.7% |
| $50,000 to $74,999 | 15 | 16.1% |
| $75,000 to $99,999 | 37 | 39.8% |
| $100,000 to $149,999 | 9 | 9.7% |
| $150,000 to $199,999 | 9 | 9.7% |
| $200,000+ | 10 | 10.8% |
Family Income by Famaliy Size in Sandy Hook
3-person families (20 | 21.5%) account for the highest median family income in Sandy Hook with $102,500 per family, while 2-person families (57 | 61.3%) have the highest median income of $37,898 per family member.
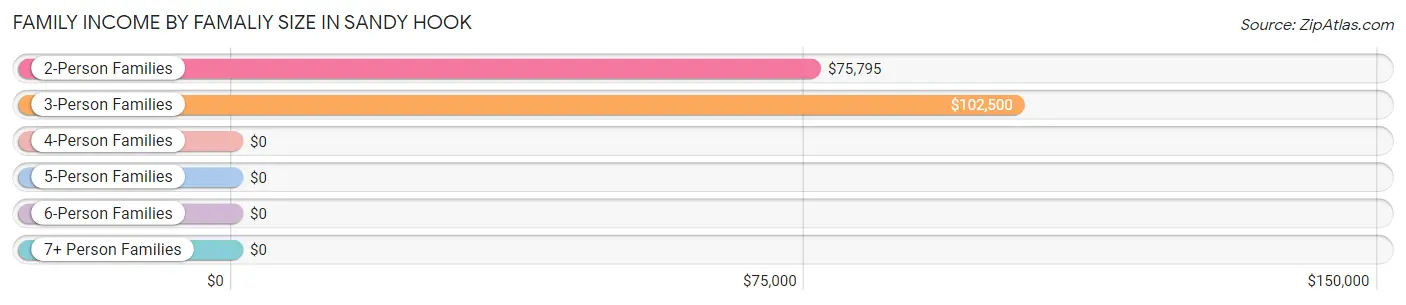
| Income Bracket | # Families | Median Income |
| 2-Person Families | 57 (61.3%) | $75,795 |
| 3-Person Families | 20 (21.5%) | $102,500 |
| 4-Person Families | 13 (14.0%) | $0 |
| 5-Person Families | 0 (0.0%) | $0 |
| 6-Person Families | 3 (3.2%) | $0 |
| 7+ Person Families | 0 (0.0%) | $0 |
| Total | 93 (100.0%) | $76,402 |
Family Income by Number of Earners in Sandy Hook
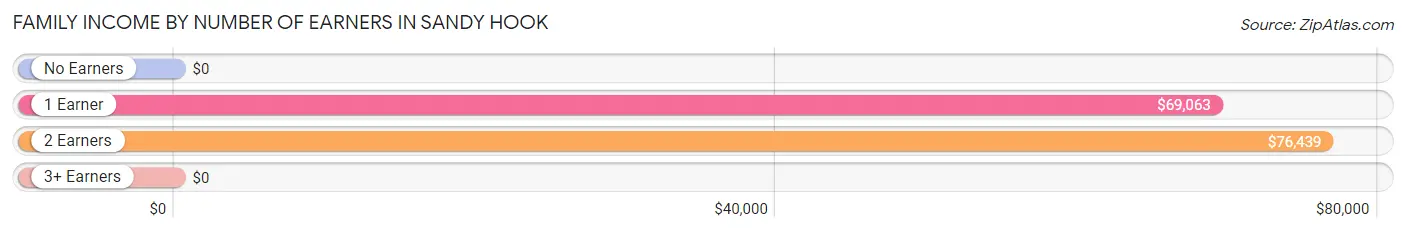
| Number of Earners | # Families | Median Income |
| No Earners | 0 (0.0%) | $0 |
| 1 Earner | 23 (24.7%) | $69,063 |
| 2 Earners | 56 (60.2%) | $76,439 |
| 3+ Earners | 14 (15.0%) | $0 |
| Total | 93 (100.0%) | $76,402 |
Household Income in Sandy Hook
Household Income Brackets in Sandy Hook
With 41 households falling in the category, the $75,000 to $99,999 income range is the most frequent in Sandy Hook, accounting for 39.4% of all households.
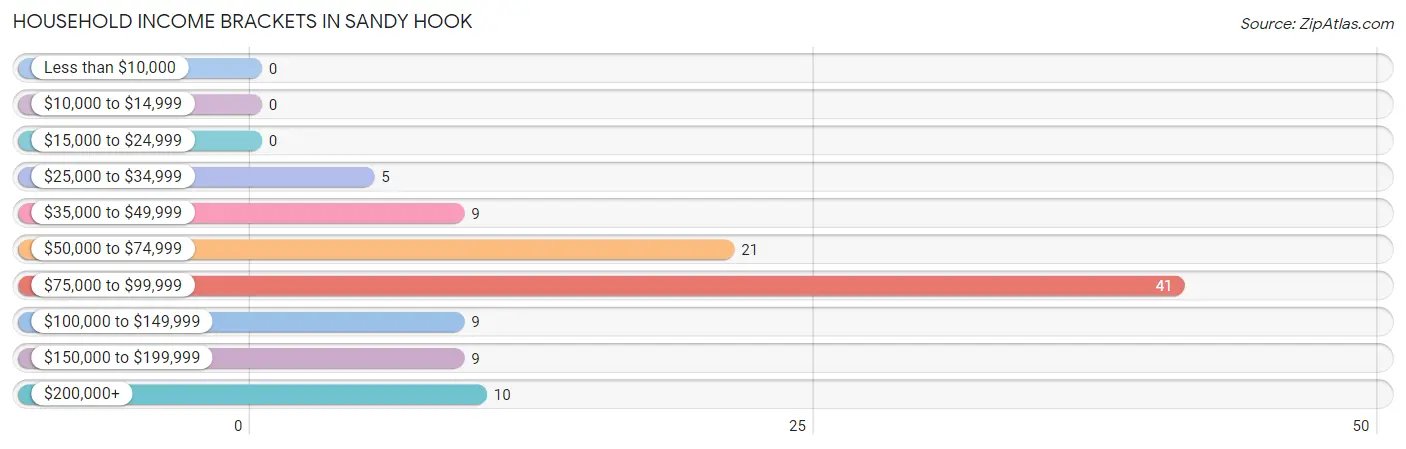
| Income Bracket | # Households | % Households |
| Less than $10,000 | 0 | 0.0% |
| $10,000 to $14,999 | 0 | 0.0% |
| $15,000 to $24,999 | 0 | 0.0% |
| $25,000 to $34,999 | 5 | 4.8% |
| $35,000 to $49,999 | 9 | 8.7% |
| $50,000 to $74,999 | 21 | 20.2% |
| $75,000 to $99,999 | 41 | 39.4% |
| $100,000 to $149,999 | 9 | 8.7% |
| $150,000 to $199,999 | 9 | 8.7% |
| $200,000+ | 10 | 9.6% |
Household Income by Householder Age in Sandy Hook
The median household income in Sandy Hook is $76,288, with the highest median household income of $95,625 found in the 45 to 64 years age bracket for the primary householder. A total of 32 households (30.8%) fall into this category.
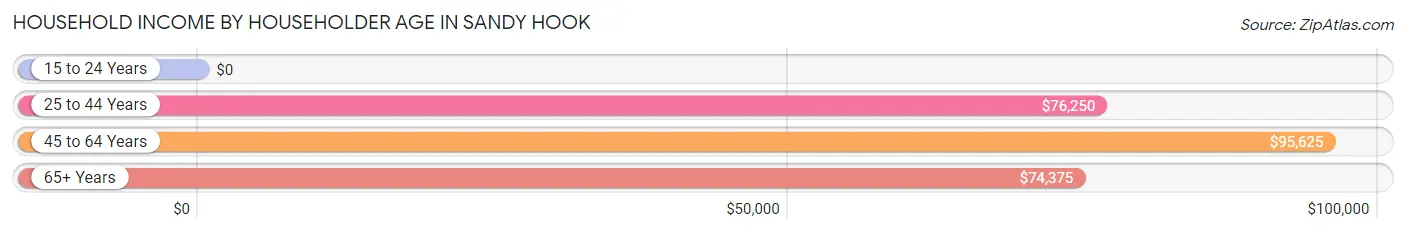
| Income Bracket | # Households | Median Income |
| 15 to 24 Years | 0 (0.0%) | $0 |
| 25 to 44 Years | 51 (49.0%) | $76,250 |
| 45 to 64 Years | 32 (30.8%) | $95,625 |
| 65+ Years | 21 (20.2%) | $74,375 |
| Total | 104 (100.0%) | $76,288 |
Poverty in Sandy Hook
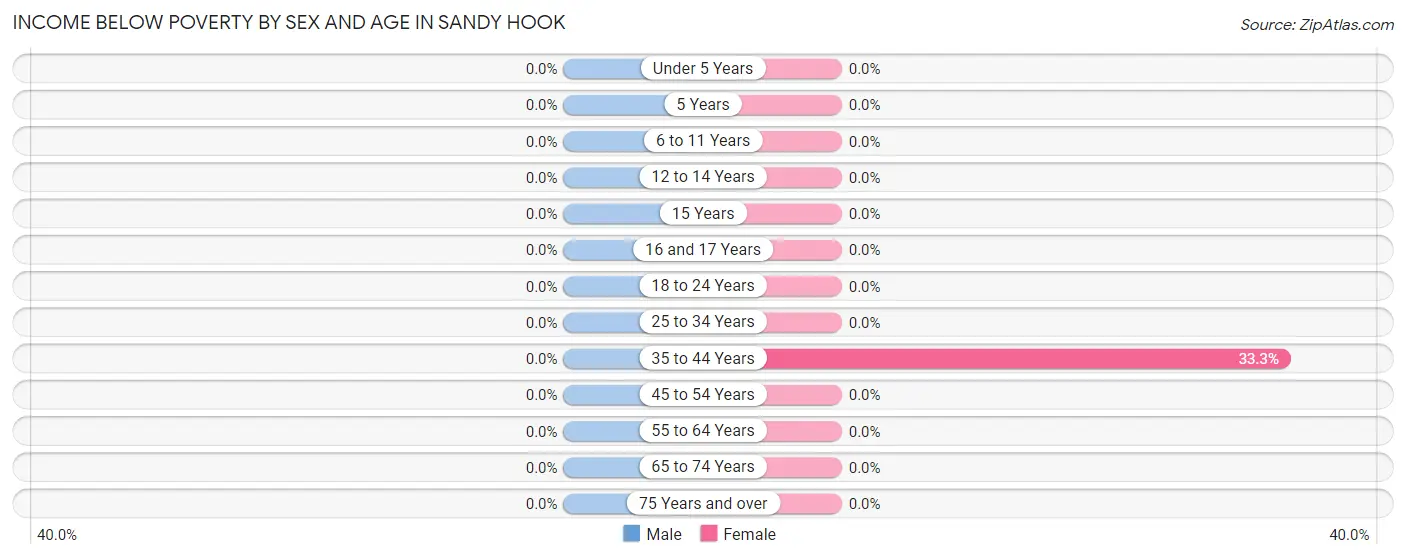
Income Below Poverty by Sex and Age in Sandy Hook
| Age Bracket | Male | Female |
| Under 5 Years | 0 (0.0%) | 0 (0.0%) |
| 5 Years | 0 (0.0%) | 0 (0.0%) |
| 6 to 11 Years | 0 (0.0%) | 0 (0.0%) |
| 12 to 14 Years | 0 (0.0%) | 0 (0.0%) |
| 15 Years | 0 (0.0%) | 0 (0.0%) |
| 16 and 17 Years | 0 (0.0%) | 0 (0.0%) |
| 18 to 24 Years | 0 (0.0%) | 0 (0.0%) |
| 25 to 34 Years | 0 (0.0%) | 0 (0.0%) |
| 35 to 44 Years | 0 (0.0%) | 4 (33.3%) |
| 45 to 54 Years | 0 (0.0%) | 0 (0.0%) |
| 55 to 64 Years | 0 (0.0%) | 0 (0.0%) |
| 65 to 74 Years | 0 (0.0%) | 0 (0.0%) |
| 75 Years and over | 0 (0.0%) | 0 (0.0%) |
| Total | 0 (0.0%) | 4 (2.9%) |
Income Above Poverty by Sex and Age in Sandy Hook
According to the poverty statistics in Sandy Hook, males aged 16 and 17 years and females aged under 5 years are the age groups that are most secure financially, with 100.0% of males and 100.0% of females in these age groups living above the poverty line.
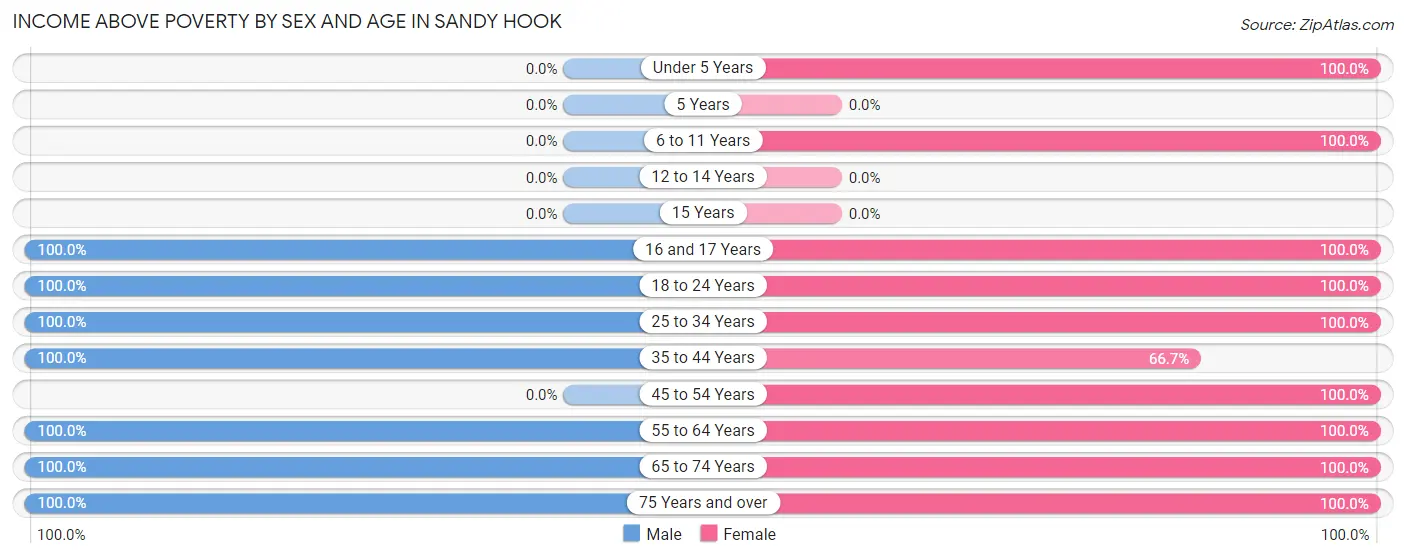
| Age Bracket | Male | Female |
| Under 5 Years | 0 (0.0%) | 7 (100.0%) |
| 5 Years | 0 (0.0%) | 0 (0.0%) |
| 6 to 11 Years | 0 (0.0%) | 8 (100.0%) |
| 12 to 14 Years | 0 (0.0%) | 0 (0.0%) |
| 15 Years | 0 (0.0%) | 0 (0.0%) |
| 16 and 17 Years | 5 (100.0%) | 5 (100.0%) |
| 18 to 24 Years | 13 (100.0%) | 15 (100.0%) |
| 25 to 34 Years | 50 (100.0%) | 31 (100.0%) |
| 35 to 44 Years | 9 (100.0%) | 8 (66.7%) |
| 45 to 54 Years | 0 (0.0%) | 10 (100.0%) |
| 55 to 64 Years | 15 (100.0%) | 32 (100.0%) |
| 65 to 74 Years | 29 (100.0%) | 7 (100.0%) |
| 75 Years and over | 4 (100.0%) | 9 (100.0%) |
| Total | 125 (100.0%) | 132 (97.1%) |
Income Below Poverty Among Married-Couple Families in Sandy Hook
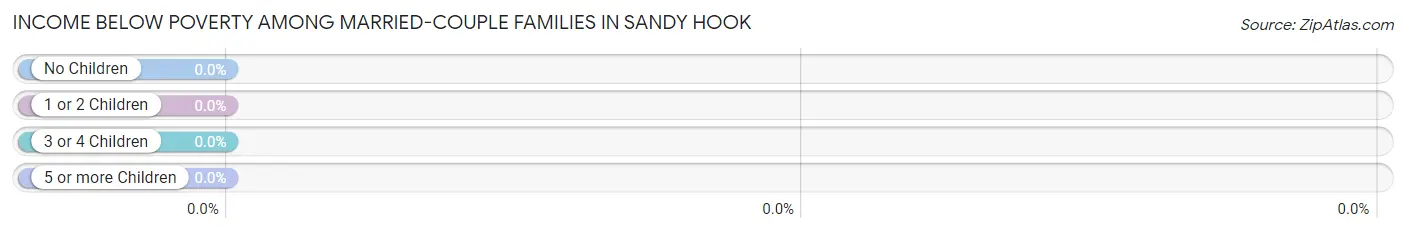
| Children | Above Poverty | Below Poverty |
| No Children | 70 (100.0%) | 0 (0.0%) |
| 1 or 2 Children | 14 (100.0%) | 0 (0.0%) |
| 3 or 4 Children | 0 (0.0%) | 0 (0.0%) |
| 5 or more Children | 0 (0.0%) | 0 (0.0%) |
| Total | 84 (100.0%) | 0 (0.0%) |
Income Below Poverty Among Single-Parent Households in Sandy Hook
| Children | Single Father | Single Mother |
| No Children | 0 (0.0%) | 0 (0.0%) |
| 1 or 2 Children | 0 (0.0%) | 0 (0.0%) |
| 3 or 4 Children | 0 (0.0%) | 0 (0.0%) |
| 5 or more Children | 0 (0.0%) | 0 (0.0%) |
| Total | 0 (0.0%) | 0 (0.0%) |
Income Below Poverty Among Married-Couple vs Single-Parent Households in Sandy Hook
| Children | Married-Couple Families | Single-Parent Households |
| No Children | 0 (0.0%) | 0 (0.0%) |
| 1 or 2 Children | 0 (0.0%) | 0 (0.0%) |
| 3 or 4 Children | 0 (0.0%) | 0 (0.0%) |
| 5 or more Children | 0 (0.0%) | 0 (0.0%) |
| Total | 0 (0.0%) | 0 (0.0%) |
Race in Sandy Hook
The most populous races in Sandy Hook are , and White / Caucasian (261 | 100.0%).
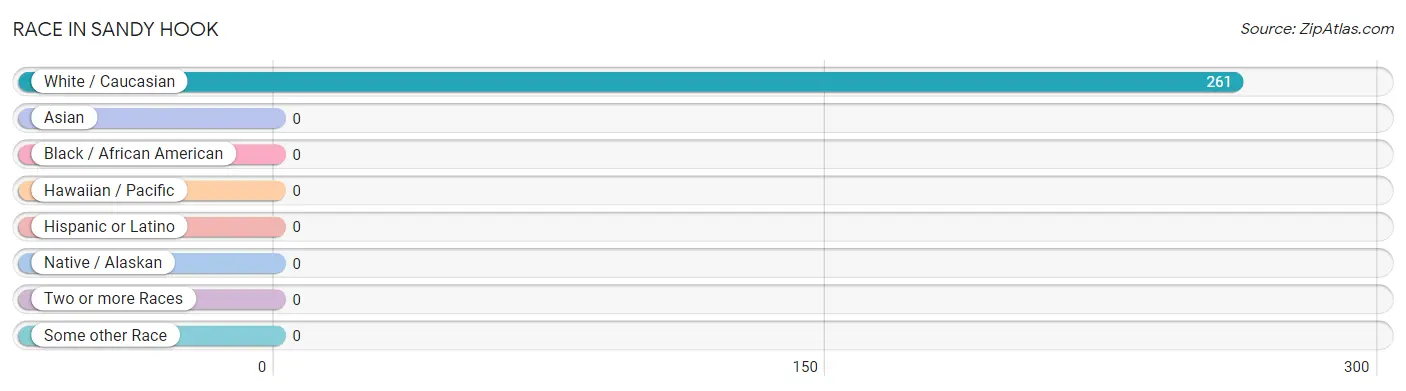
| Race | # Population | % Population |
| Asian | 0 | 0.0% |
| Black / African American | 0 | 0.0% |
| Hawaiian / Pacific | 0 | 0.0% |
| Hispanic or Latino | 0 | 0.0% |
| Native / Alaskan | 0 | 0.0% |
| White / Caucasian | 261 | 100.0% |
| Two or more Races | 0 | 0.0% |
| Some other Race | 0 | 0.0% |
| Total | 261 | 100.0% |
Ancestry in Sandy Hook
The most populous ancestries reported in Sandy Hook are German (104 | 39.9%), American (31 | 11.9%), Irish (28 | 10.7%), Dutch (14 | 5.4%), and Italian (13 | 5.0%), together accounting for 72.8% of all Sandy Hook residents.
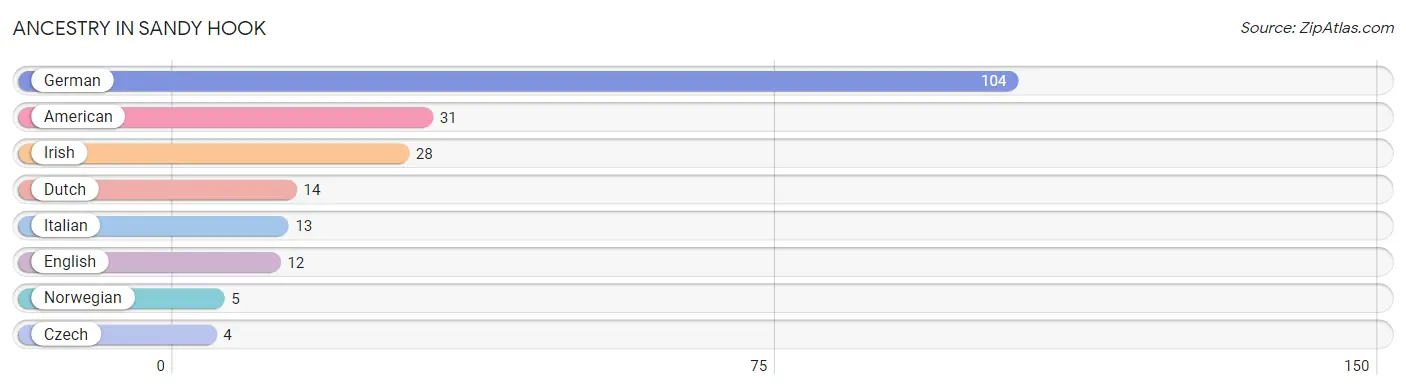
| Ancestry | # Population | % Population |
| American | 31 | 11.9% |
| Czech | 4 | 1.5% |
| Dutch | 14 | 5.4% |
| English | 12 | 4.6% |
| German | 104 | 39.9% |
| Irish | 28 | 10.7% |
| Italian | 13 | 5.0% |
| Norwegian | 5 | 1.9% | View All 8 Rows |
Immigrants in Sandy Hook

| Immigration Origin | # Population | % Population | View All 0 Rows |
Sex and Age in Sandy Hook
Sex and Age in Sandy Hook
The most populous age groups in Sandy Hook are 30 to 34 Years (42 | 33.6%) for men and 30 to 34 Years (31 | 22.8%) for women.
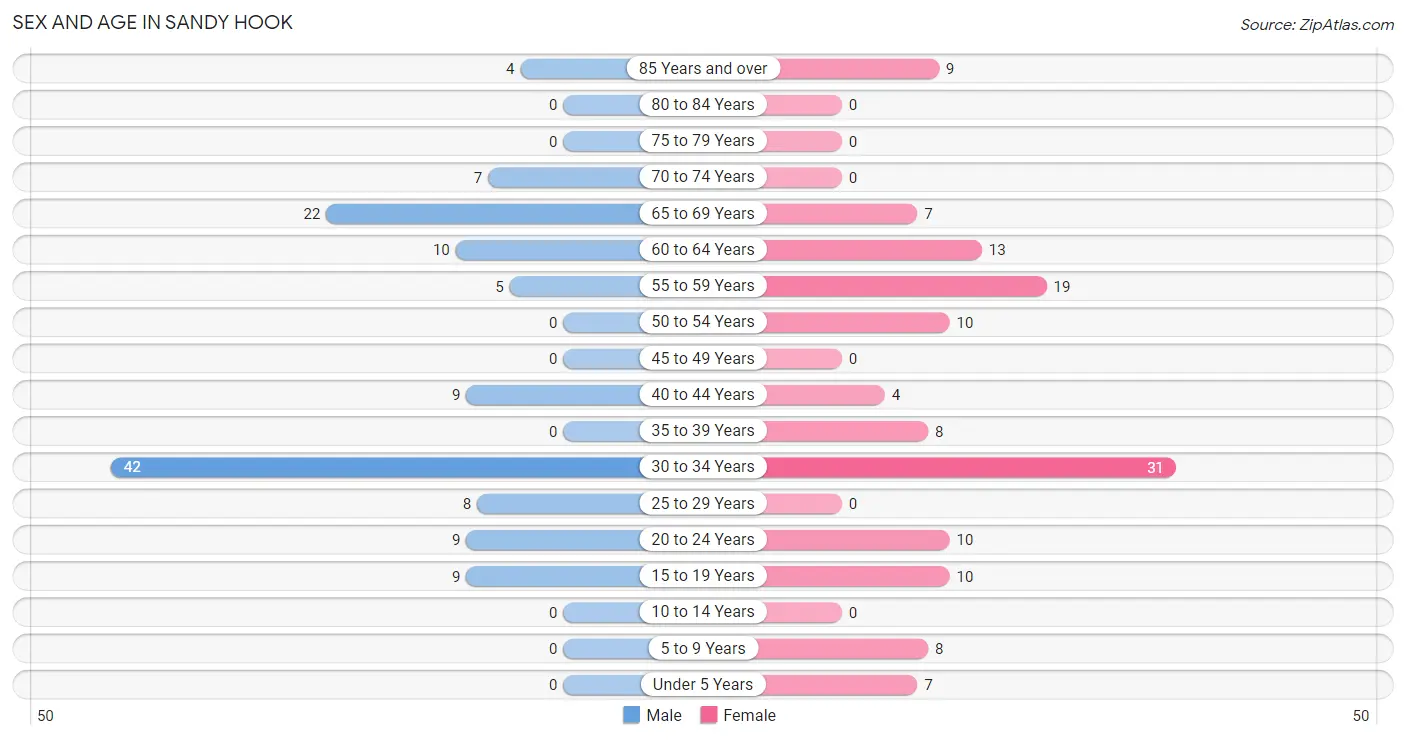
| Age Bracket | Male | Female |
| Under 5 Years | 0 (0.0%) | 7 (5.1%) |
| 5 to 9 Years | 0 (0.0%) | 8 (5.9%) |
| 10 to 14 Years | 0 (0.0%) | 0 (0.0%) |
| 15 to 19 Years | 9 (7.2%) | 10 (7.3%) |
| 20 to 24 Years | 9 (7.2%) | 10 (7.3%) |
| 25 to 29 Years | 8 (6.4%) | 0 (0.0%) |
| 30 to 34 Years | 42 (33.6%) | 31 (22.8%) |
| 35 to 39 Years | 0 (0.0%) | 8 (5.9%) |
| 40 to 44 Years | 9 (7.2%) | 4 (2.9%) |
| 45 to 49 Years | 0 (0.0%) | 0 (0.0%) |
| 50 to 54 Years | 0 (0.0%) | 10 (7.3%) |
| 55 to 59 Years | 5 (4.0%) | 19 (14.0%) |
| 60 to 64 Years | 10 (8.0%) | 13 (9.6%) |
| 65 to 69 Years | 22 (17.6%) | 7 (5.1%) |
| 70 to 74 Years | 7 (5.6%) | 0 (0.0%) |
| 75 to 79 Years | 0 (0.0%) | 0 (0.0%) |
| 80 to 84 Years | 0 (0.0%) | 0 (0.0%) |
| 85 Years and over | 4 (3.2%) | 9 (6.6%) |
| Total | 125 (100.0%) | 136 (100.0%) |
Families and Households in Sandy Hook
Median Family Size in Sandy Hook
The median family size in Sandy Hook is 2.60 persons per family, with single male/father families (4 | 4.3%) accounting for the largest median family size of 4.25 persons per family. On the other hand, single female/mother families (5 | 5.4%) represent the smallest median family size with 2.00 persons per family.
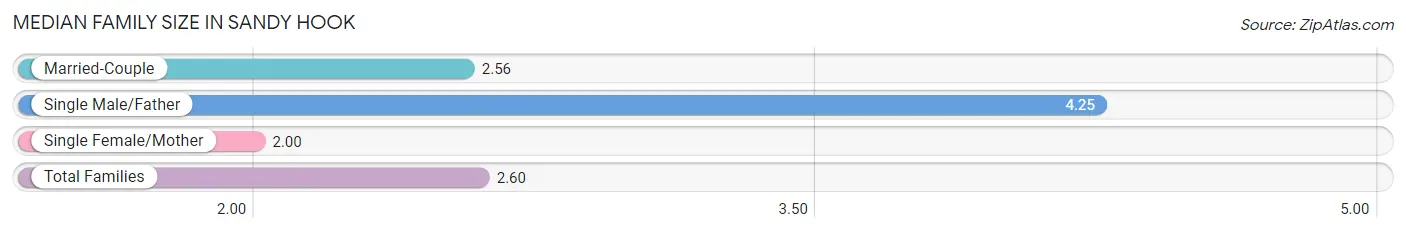
| Family Type | # Families | Family Size |
| Married-Couple | 84 (90.3%) | 2.56 |
| Single Male/Father | 4 (4.3%) | 4.25 |
| Single Female/Mother | 5 (5.4%) | 2.00 |
| Total Families | 93 (100.0%) | 2.60 |
Median Household Size in Sandy Hook
The median household size in Sandy Hook is 2.51 persons per household, with single male/father households (4 | 3.8%) accounting for the largest median household size of 5.25 persons per household. non-family households (11 | 10.6%) represent the smallest median household size with 1.36 persons per household.
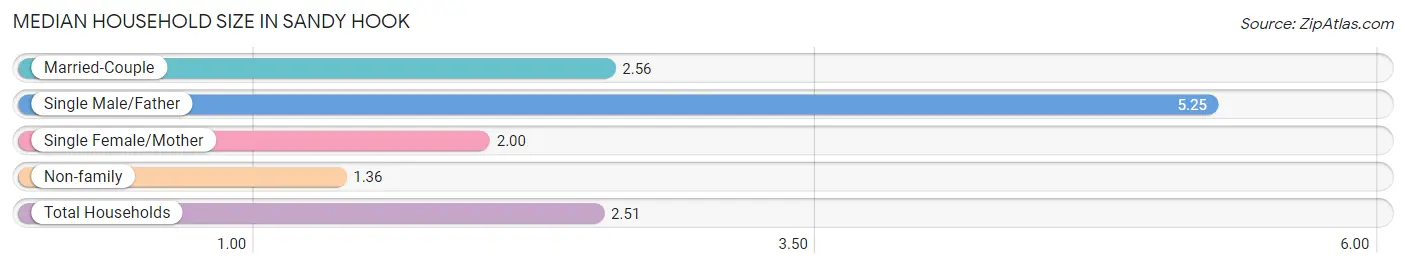
| Household Type | # Households | Household Size |
| Married-Couple | 84 (80.8%) | 2.56 |
| Single Male/Father | 4 (3.8%) | 5.25 |
| Single Female/Mother | 5 (4.8%) | 2.00 |
| Non-family | 11 (10.6%) | 1.36 |
| Total Households | 104 (100.0%) | 2.51 |
Household Size by Marriage Status in Sandy Hook
Out of a total of 104 households in Sandy Hook, 93 (89.4%) are family households, while 11 (10.6%) are nonfamily households. The most numerous type of family households are 2-person households, comprising 57, and the most common type of nonfamily households are 1-person households, comprising 7.
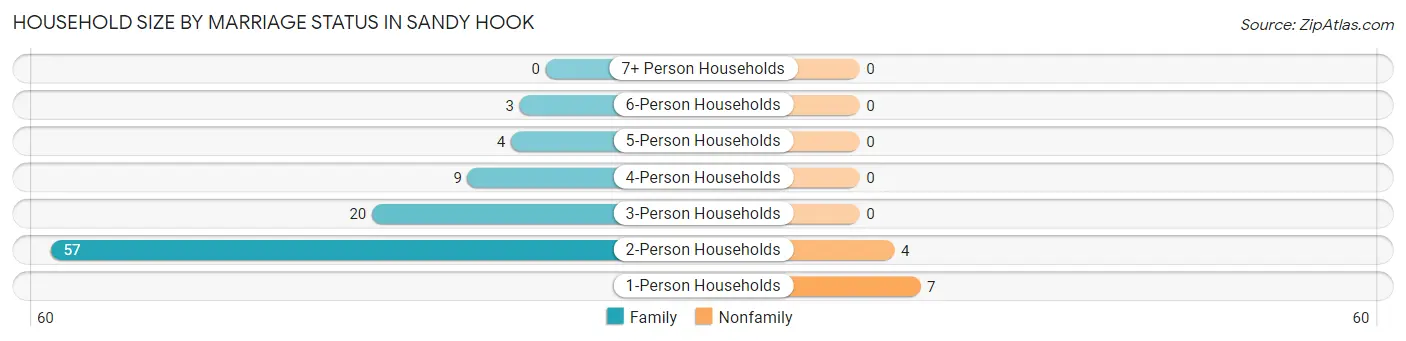
| Household Size | Family Households | Nonfamily Households |
| 1-Person Households | - | 7 (6.7%) |
| 2-Person Households | 57 (54.8%) | 4 (3.8%) |
| 3-Person Households | 20 (19.2%) | 0 (0.0%) |
| 4-Person Households | 9 (8.6%) | 0 (0.0%) |
| 5-Person Households | 4 (3.8%) | 0 (0.0%) |
| 6-Person Households | 3 (2.9%) | 0 (0.0%) |
| 7+ Person Households | 0 (0.0%) | 0 (0.0%) |
| Total | 93 (89.4%) | 11 (10.6%) |
Female Fertility in Sandy Hook
Fertility by Age in Sandy Hook
| Age Bracket | Women with Births | Births / 1,000 Women |
| 15 to 19 years | 0 (0.0%) | 0.0 |
| 20 to 34 years | 0 (0.0%) | 0.0 |
| 35 to 50 years | 0 (0.0%) | 0.0 |
| Total | 0 (0.0%) | 0.0 |
Fertility by Age by Marriage Status in Sandy Hook
| Age Bracket | Married | Unmarried |
| 15 to 19 years | 0 (0.0%) | 0 (0.0%) |
| 20 to 34 years | 0 (0.0%) | 0 (0.0%) |
| 35 to 50 years | 0 (0.0%) | 0 (0.0%) |
| Total | 0 (0.0%) | 0 (0.0%) |
Fertility by Education in Sandy Hook
| Educational Attainment | Women with Births | Births / 1,000 Women |
| Less than High School | 0 (0.0%) | 0.0 |
| High School Diploma | 0 (0.0%) | 0.0 |
| College or Associate's Degree | 0 (0.0%) | 0.0 |
| Bachelor's Degree | 0 (0.0%) | 0.0 |
| Graduate Degree | 0 (0.0%) | 0.0 |
| Total | 0 (0.0%) | 0.0 |
Fertility by Education by Marriage Status in Sandy Hook
| Educational Attainment | Married | Unmarried |
| Less than High School | 0 (0.0%) | 0 (0.0%) |
| High School Diploma | 0 (0.0%) | 0 (0.0%) |
| College or Associate's Degree | 0 (0.0%) | 0 (0.0%) |
| Bachelor's Degree | 0 (0.0%) | 0 (0.0%) |
| Graduate Degree | 0 (0.0%) | 0 (0.0%) |
| Total | 0 (0.0%) | 0 (0.0%) |
Employment Characteristics in Sandy Hook
Employment by Class of Employer in Sandy Hook
Among the 171 employed individuals in Sandy Hook, private company employees (86 | 50.3%), self-employed (not incorporated) (38 | 22.2%), and federal government employees (26 | 15.2%) make up the most common classes of employment.
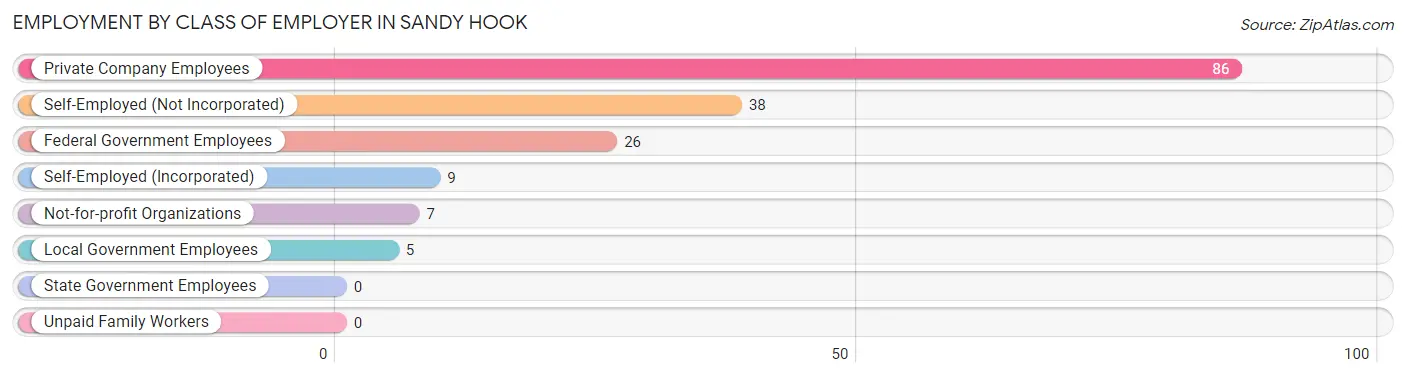
| Employer Class | # Employees | % Employees |
| Private Company Employees | 86 | 50.3% |
| Self-Employed (Incorporated) | 9 | 5.3% |
| Self-Employed (Not Incorporated) | 38 | 22.2% |
| Not-for-profit Organizations | 7 | 4.1% |
| Local Government Employees | 5 | 2.9% |
| State Government Employees | 0 | 0.0% |
| Federal Government Employees | 26 | 15.2% |
| Unpaid Family Workers | 0 | 0.0% |
| Total | 171 | 100.0% |
Employment Status by Age in Sandy Hook
According to the labor force statistics for Sandy Hook, out of the total population over 16 years of age (246), 75.2% or 185 individuals are in the labor force, with 4.3% or 8 of them unemployed. The age group with the highest labor force participation rate is 20 to 24 years, with 100.0% or 19 individuals in the labor force. Within the labor force, the 16 to 19 years age range has the highest percentage of unemployed individuals, with 44.4% or 4 of them being unemployed.
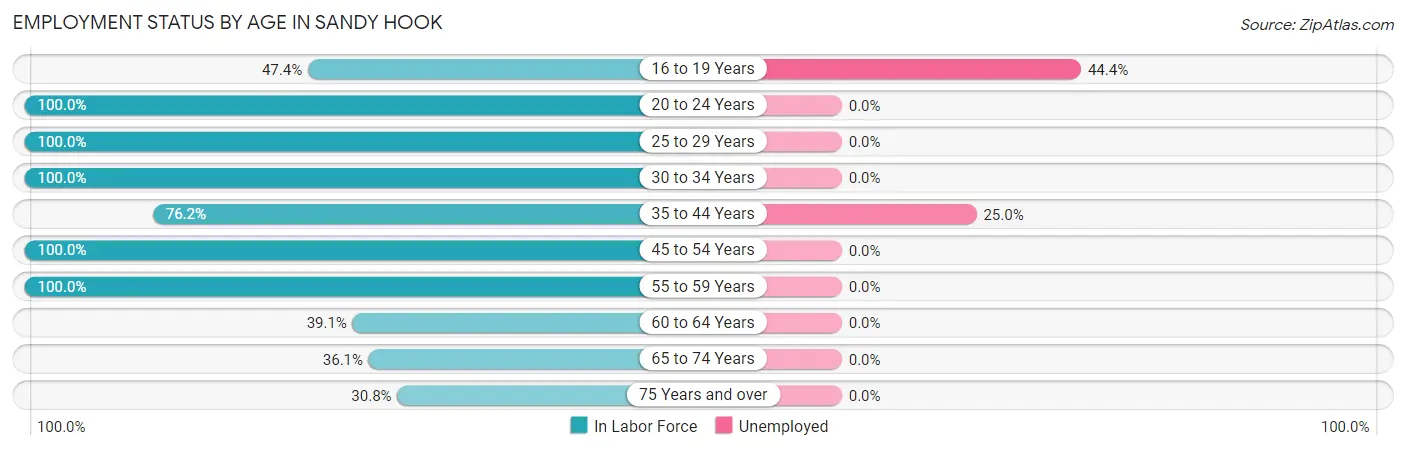
| Age Bracket | In Labor Force | Unemployed |
| 16 to 19 Years | 9 (47.4%) | 4 (44.4%) |
| 20 to 24 Years | 19 (100.0%) | 0 (0.0%) |
| 25 to 29 Years | 8 (100.0%) | 0 (0.0%) |
| 30 to 34 Years | 73 (100.0%) | 0 (0.0%) |
| 35 to 44 Years | 16 (76.2%) | 4 (25.0%) |
| 45 to 54 Years | 10 (100.0%) | 0 (0.0%) |
| 55 to 59 Years | 24 (100.0%) | 0 (0.0%) |
| 60 to 64 Years | 9 (39.1%) | 0 (0.0%) |
| 65 to 74 Years | 13 (36.1%) | 0 (0.0%) |
| 75 Years and over | 4 (30.8%) | 0 (0.0%) |
| Total | 185 (75.2%) | 8 (4.3%) |
Employment Status by Educational Attainment in Sandy Hook
According to labor force statistics for Sandy Hook, 88.1% of individuals (140) out of the total population between 25 and 64 years of age (159) are in the labor force, with 2.9% or 4 of them being unemployed. The group with the highest labor force participation rate are those with the educational attainment of less than high school, with 100.0% or 59 individuals in the labor force. Within the labor force, individuals with college / associate degree education have the highest percentage of unemployment, with 12.1% or 4 of them being unemployed.
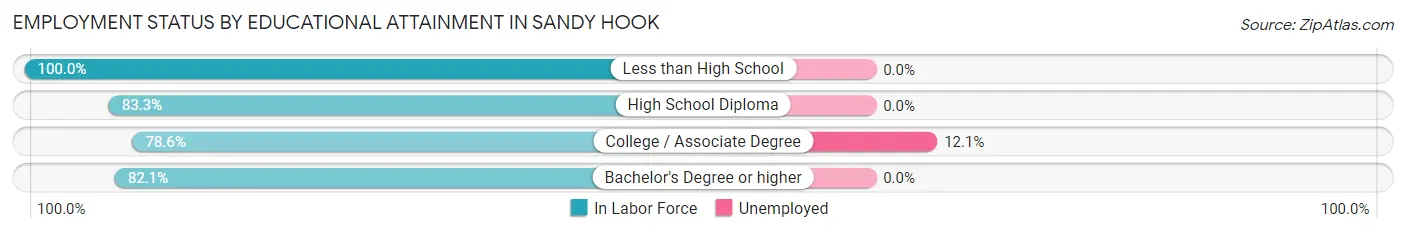
| Educational Attainment | In Labor Force | Unemployed |
| Less than High School | 59 (100.0%) | 0 (0.0%) |
| High School Diploma | 25 (83.3%) | 0 (0.0%) |
| College / Associate Degree | 33 (78.6%) | 5 (12.1%) |
| Bachelor's Degree or higher | 23 (82.1%) | 0 (0.0%) |
| Total | 140 (88.1%) | 5 (2.9%) |
Employment Occupations by Sex in Sandy Hook
Management, Business, Science and Arts Occupations
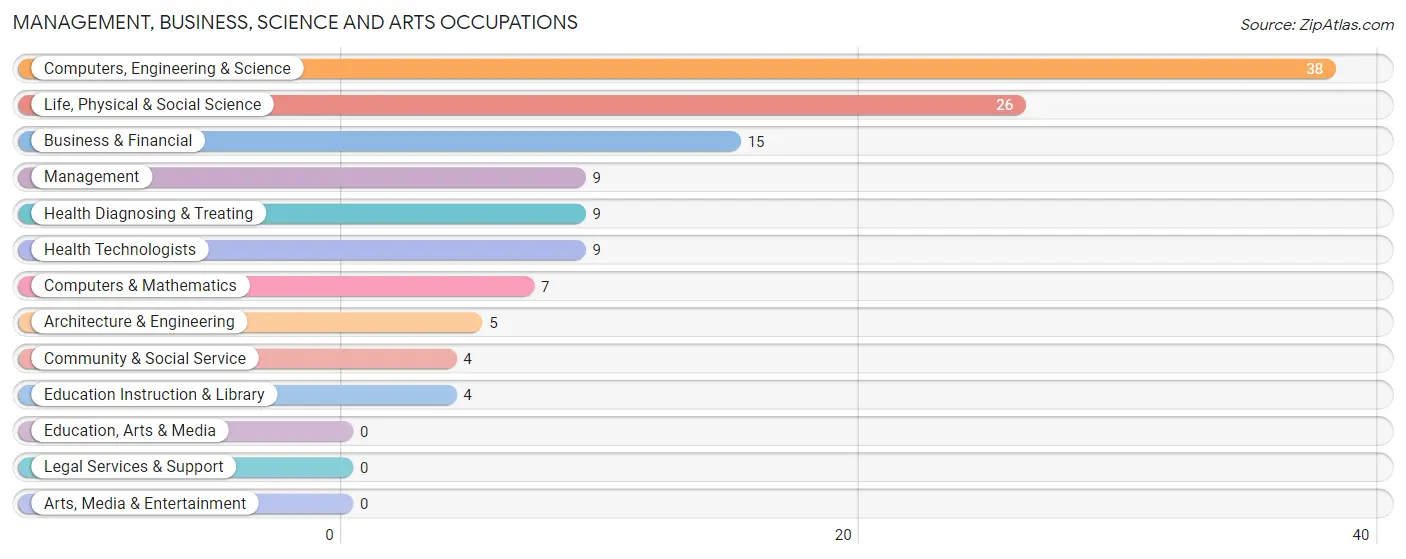
The most common Management, Business, Science and Arts occupations in Sandy Hook are Computers, Engineering & Science (38 | 21.5%), Life, Physical & Social Science (26 | 14.7%), Business & Financial (15 | 8.5%), Management (9 | 5.1%), and Health Diagnosing & Treating (9 | 5.1%).
Management, Business, Science and Arts Occupations by Sex
Within the Management, Business, Science and Arts occupations in Sandy Hook, the most male-oriented occupations are Architecture & Engineering (100.0%), Computers & Mathematics (71.4%), and Management (44.4%), while the most female-oriented occupations are Life, Physical & Social Science (100.0%), Community & Social Service (100.0%), and Education Instruction & Library (100.0%).
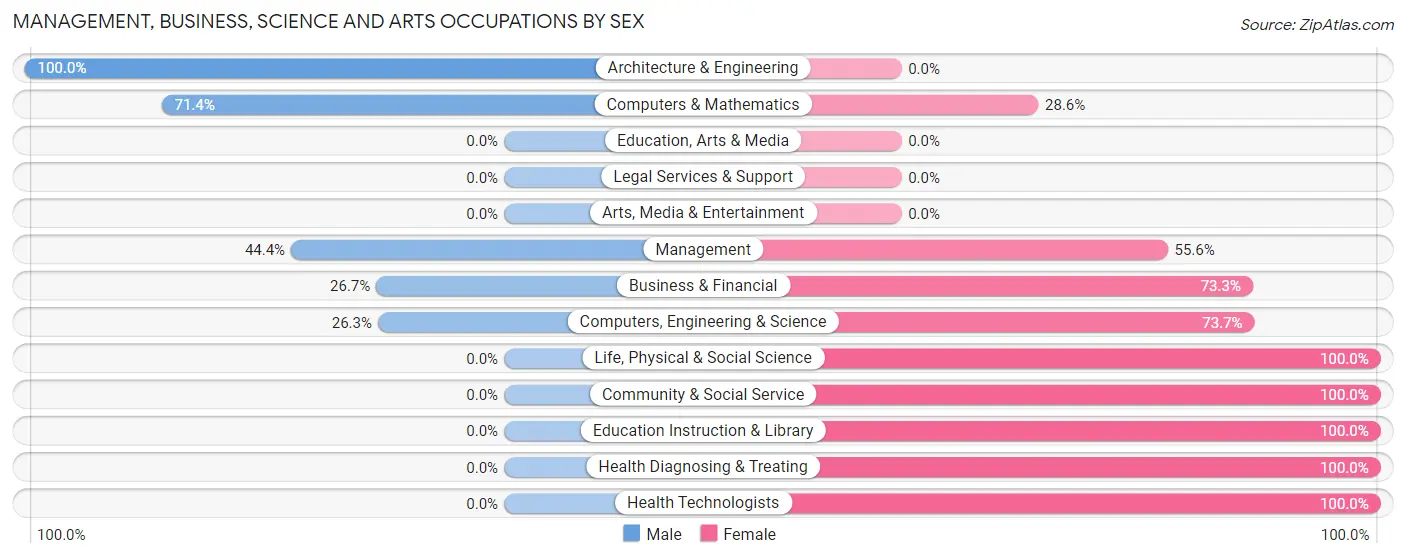
| Occupation | Male | Female |
| Management | 4 (44.4%) | 5 (55.6%) |
| Business & Financial | 4 (26.7%) | 11 (73.3%) |
| Computers, Engineering & Science | 10 (26.3%) | 28 (73.7%) |
| Computers & Mathematics | 5 (71.4%) | 2 (28.6%) |
| Architecture & Engineering | 5 (100.0%) | 0 (0.0%) |
| Life, Physical & Social Science | 0 (0.0%) | 26 (100.0%) |
| Community & Social Service | 0 (0.0%) | 4 (100.0%) |
| Education, Arts & Media | 0 (0.0%) | 0 (0.0%) |
| Legal Services & Support | 0 (0.0%) | 0 (0.0%) |
| Education Instruction & Library | 0 (0.0%) | 4 (100.0%) |
| Arts, Media & Entertainment | 0 (0.0%) | 0 (0.0%) |
| Health Diagnosing & Treating | 0 (0.0%) | 9 (100.0%) |
| Health Technologists | 0 (0.0%) | 9 (100.0%) |
| Total (Category) | 18 (24.0%) | 57 (76.0%) |
| Total (Overall) | 78 (44.1%) | 99 (55.9%) |
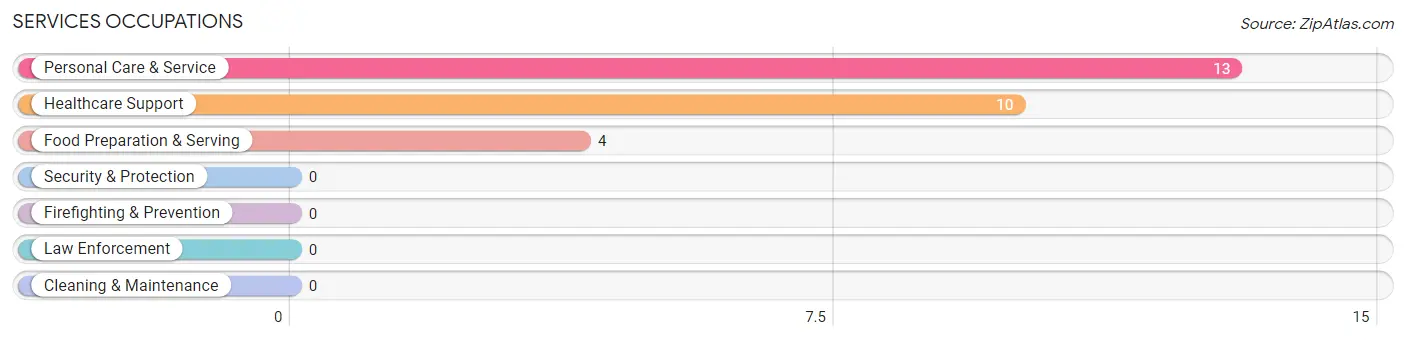
Services Occupations
The most common Services occupations in Sandy Hook are Personal Care & Service (13 | 7.3%), Healthcare Support (10 | 5.7%), and Food Preparation & Serving (4 | 2.3%).
Services Occupations by Sex
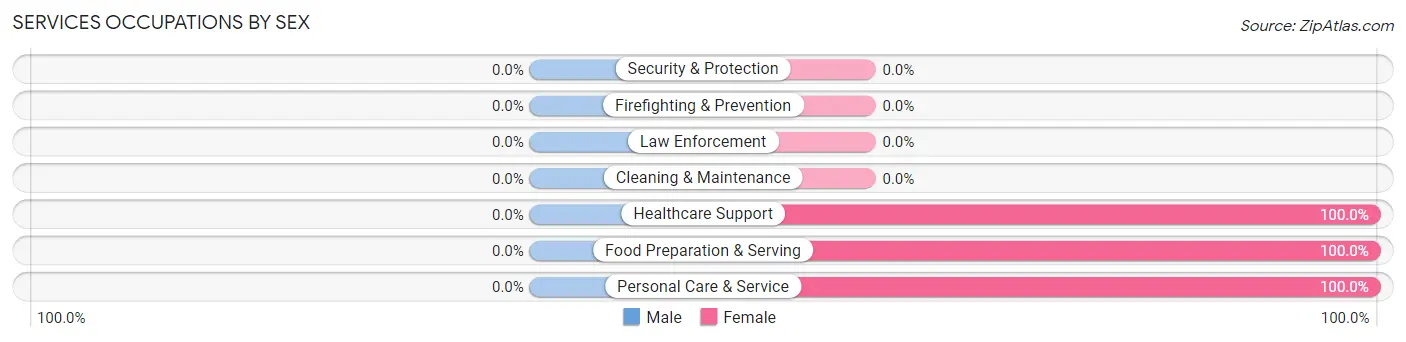
| Occupation | Male | Female |
| Healthcare Support | 0 (0.0%) | 10 (100.0%) |
| Security & Protection | 0 (0.0%) | 0 (0.0%) |
| Firefighting & Prevention | 0 (0.0%) | 0 (0.0%) |
| Law Enforcement | 0 (0.0%) | 0 (0.0%) |
| Food Preparation & Serving | 0 (0.0%) | 4 (100.0%) |
| Cleaning & Maintenance | 0 (0.0%) | 0 (0.0%) |
| Personal Care & Service | 0 (0.0%) | 13 (100.0%) |
| Total (Category) | 0 (0.0%) | 27 (100.0%) |
| Total (Overall) | 78 (44.1%) | 99 (55.9%) |
Sales and Office Occupations
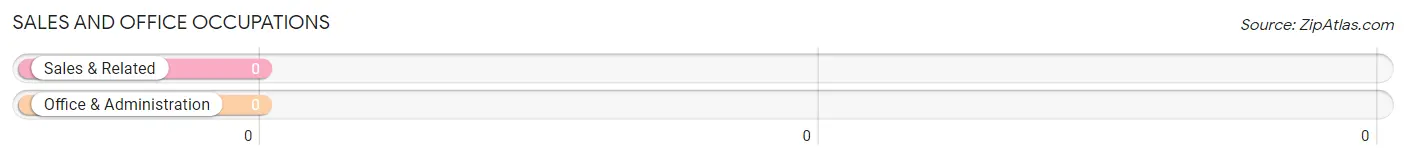
Sales and Office Occupations by Sex
| Occupation | Male | Female |
| Sales & Related | 0 (0.0%) | 0 (0.0%) |
| Office & Administration | 0 (0.0%) | 0 (0.0%) |
| Total (Category) | 0 (0.0%) | 0 (0.0%) |
| Total (Overall) | 78 (44.1%) | 99 (55.9%) |
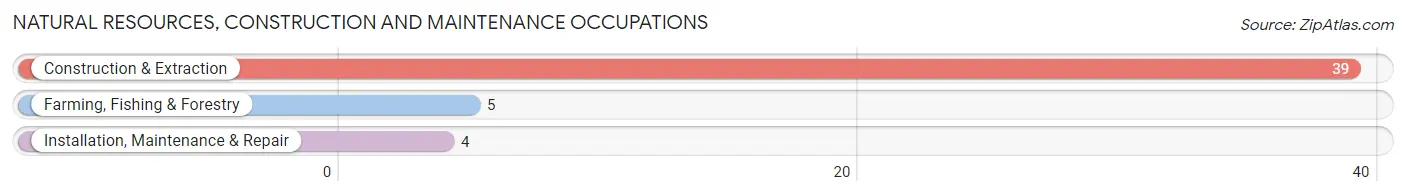
Natural Resources, Construction and Maintenance Occupations
The most common Natural Resources, Construction and Maintenance occupations in Sandy Hook are Construction & Extraction (39 | 22.0%), Farming, Fishing & Forestry (5 | 2.8%), and Installation, Maintenance & Repair (4 | 2.3%).
Natural Resources, Construction and Maintenance Occupations by Sex
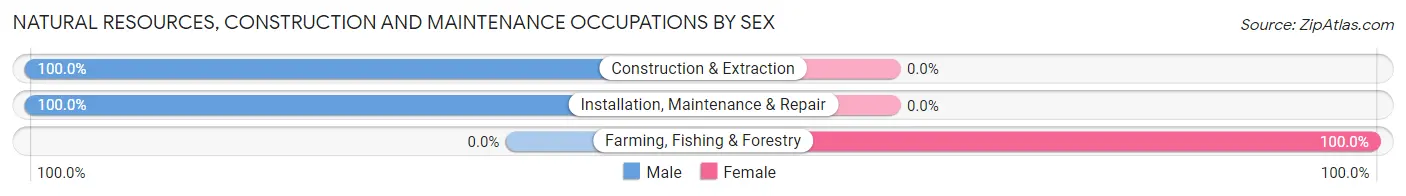
| Occupation | Male | Female |
| Farming, Fishing & Forestry | 0 (0.0%) | 5 (100.0%) |
| Construction & Extraction | 39 (100.0%) | 0 (0.0%) |
| Installation, Maintenance & Repair | 4 (100.0%) | 0 (0.0%) |
| Total (Category) | 43 (89.6%) | 5 (10.4%) |
| Total (Overall) | 78 (44.1%) | 99 (55.9%) |
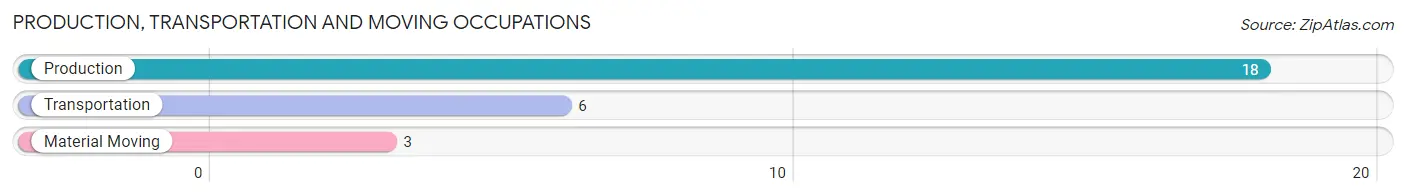
Production, Transportation and Moving Occupations
The most common Production, Transportation and Moving occupations in Sandy Hook are Production (18 | 10.2%), Transportation (6 | 3.4%), and Material Moving (3 | 1.7%).
Production, Transportation and Moving Occupations by Sex
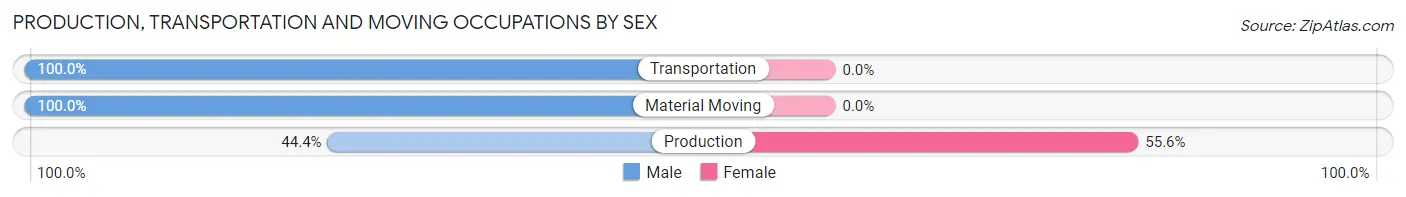
| Occupation | Male | Female |
| Production | 8 (44.4%) | 10 (55.6%) |
| Transportation | 6 (100.0%) | 0 (0.0%) |
| Material Moving | 3 (100.0%) | 0 (0.0%) |
| Total (Category) | 17 (63.0%) | 10 (37.0%) |
| Total (Overall) | 78 (44.1%) | 99 (55.9%) |
Employment Industries by Sex in Sandy Hook
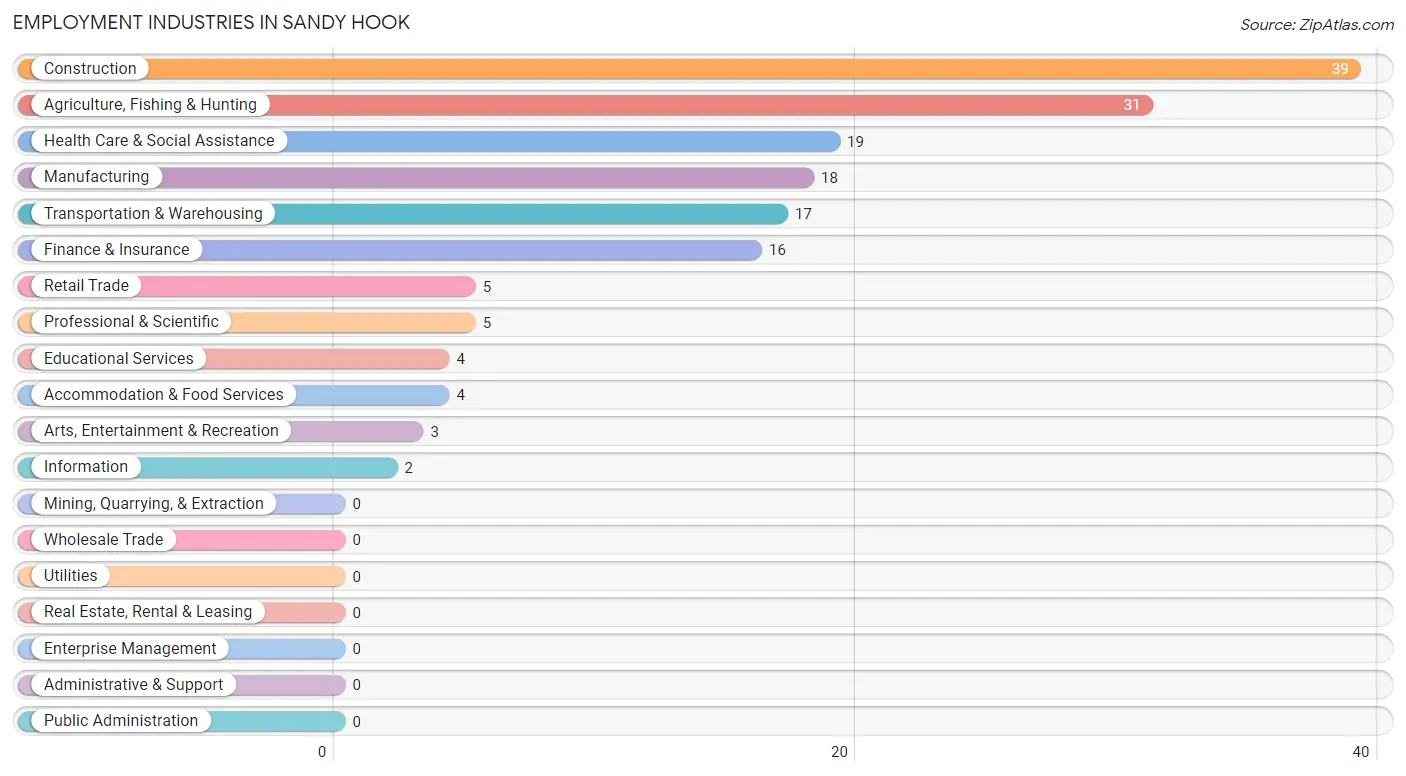
Employment Industries in Sandy Hook
The major employment industries in Sandy Hook include Construction (39 | 22.0%), Agriculture, Fishing & Hunting (31 | 17.5%), Health Care & Social Assistance (19 | 10.7%), Manufacturing (18 | 10.2%), and Transportation & Warehousing (17 | 9.6%).
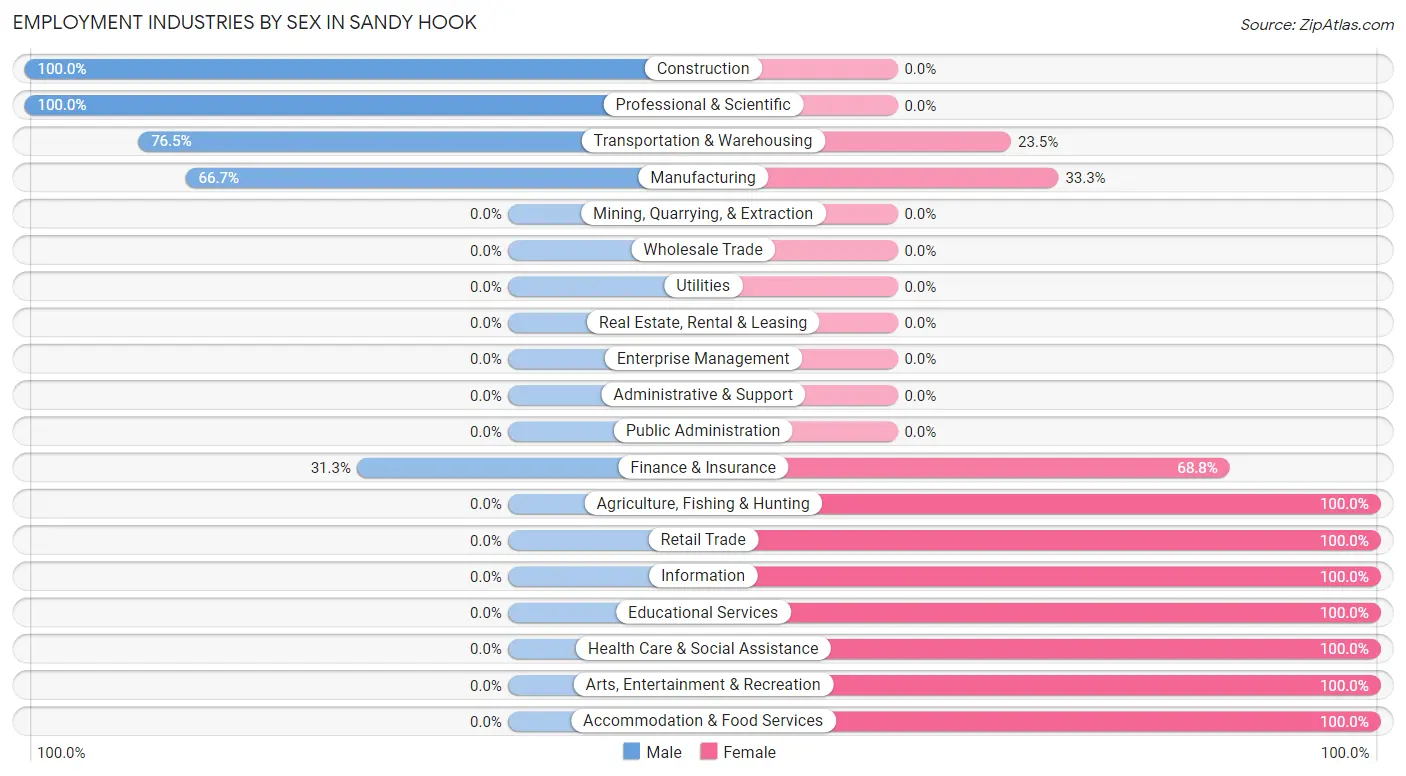
Employment Industries by Sex in Sandy Hook
The Sandy Hook industries that see more men than women are Construction (100.0%), Professional & Scientific (100.0%), and Transportation & Warehousing (76.5%), whereas the industries that tend to have a higher number of women are Agriculture, Fishing & Hunting (100.0%), Retail Trade (100.0%), and Information (100.0%).
| Industry | Male | Female |
| Agriculture, Fishing & Hunting | 0 (0.0%) | 31 (100.0%) |
| Mining, Quarrying, & Extraction | 0 (0.0%) | 0 (0.0%) |
| Construction | 39 (100.0%) | 0 (0.0%) |
| Manufacturing | 12 (66.7%) | 6 (33.3%) |
| Wholesale Trade | 0 (0.0%) | 0 (0.0%) |
| Retail Trade | 0 (0.0%) | 5 (100.0%) |
| Transportation & Warehousing | 13 (76.5%) | 4 (23.5%) |
| Utilities | 0 (0.0%) | 0 (0.0%) |
| Information | 0 (0.0%) | 2 (100.0%) |
| Finance & Insurance | 5 (31.2%) | 11 (68.8%) |
| Real Estate, Rental & Leasing | 0 (0.0%) | 0 (0.0%) |
| Professional & Scientific | 5 (100.0%) | 0 (0.0%) |
| Enterprise Management | 0 (0.0%) | 0 (0.0%) |
| Administrative & Support | 0 (0.0%) | 0 (0.0%) |
| Educational Services | 0 (0.0%) | 4 (100.0%) |
| Health Care & Social Assistance | 0 (0.0%) | 19 (100.0%) |
| Arts, Entertainment & Recreation | 0 (0.0%) | 3 (100.0%) |
| Accommodation & Food Services | 0 (0.0%) | 4 (100.0%) |
| Public Administration | 0 (0.0%) | 0 (0.0%) |
| Total | 78 (44.1%) | 99 (55.9%) |
Education in Sandy Hook
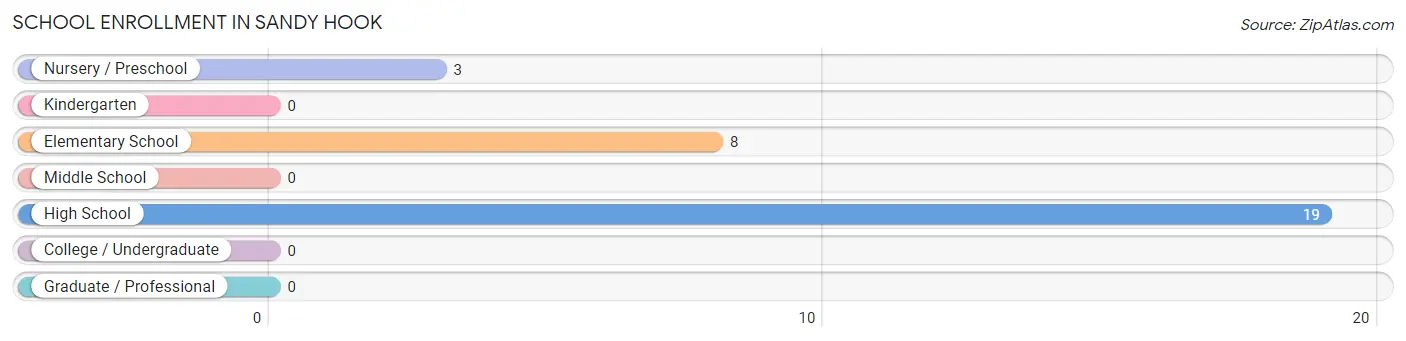
School Enrollment in Sandy Hook
The most common levels of schooling among the 30 students in Sandy Hook are high school (19 | 63.3%), elementary school (8 | 26.7%), and nursery / preschool (3 | 10.0%).
| School Level | # Students | % Students |
| Nursery / Preschool | 3 | 10.0% |
| Kindergarten | 0 | 0.0% |
| Elementary School | 8 | 26.7% |
| Middle School | 0 | 0.0% |
| High School | 19 | 63.3% |
| College / Undergraduate | 0 | 0.0% |
| Graduate / Professional | 0 | 0.0% |
| Total | 30 | 100.0% |
School Enrollment by Age by Funding Source in Sandy Hook
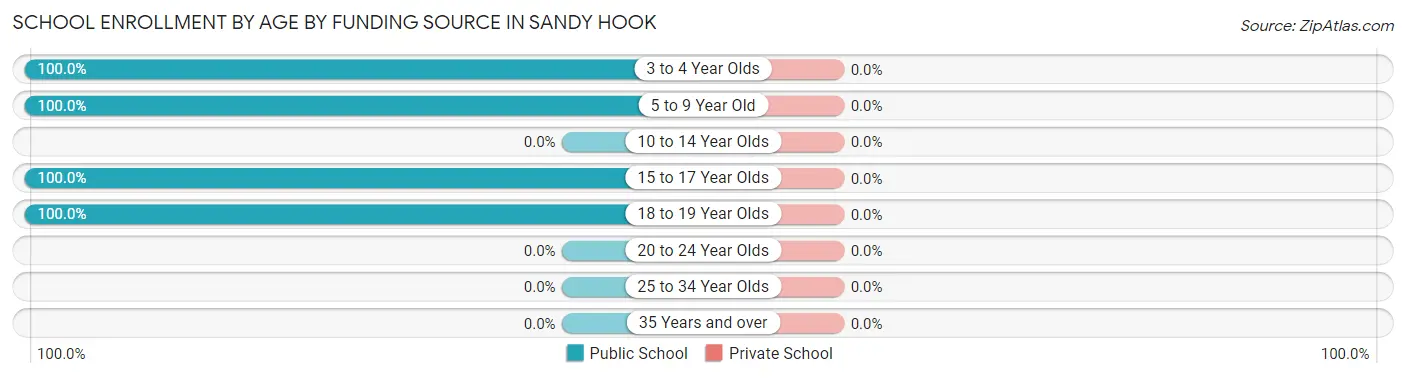
| Age Bracket | Public School | Private School |
| 3 to 4 Year Olds | 3 (100.0%) | 0 (0.0%) |
| 5 to 9 Year Old | 8 (100.0%) | 0 (0.0%) |
| 10 to 14 Year Olds | 0 (0.0%) | 0 (0.0%) |
| 15 to 17 Year Olds | 10 (100.0%) | 0 (0.0%) |
| 18 to 19 Year Olds | 9 (100.0%) | 0 (0.0%) |
| 20 to 24 Year Olds | 0 (0.0%) | 0 (0.0%) |
| 25 to 34 Year Olds | 0 (0.0%) | 0 (0.0%) |
| 35 Years and over | 0 (0.0%) | 0 (0.0%) |
| Total | 30 (100.0%) | 0 (0.0%) |
Educational Attainment by Field of Study in Sandy Hook
Computers & mathematics (10 | 21.7%), business (9 | 19.6%), visual & performing arts (9 | 19.6%), physical & health sciences (5 | 10.9%), and engineering (5 | 10.9%) are the most common fields of study among 46 individuals in Sandy Hook who have obtained a bachelor's degree or higher.
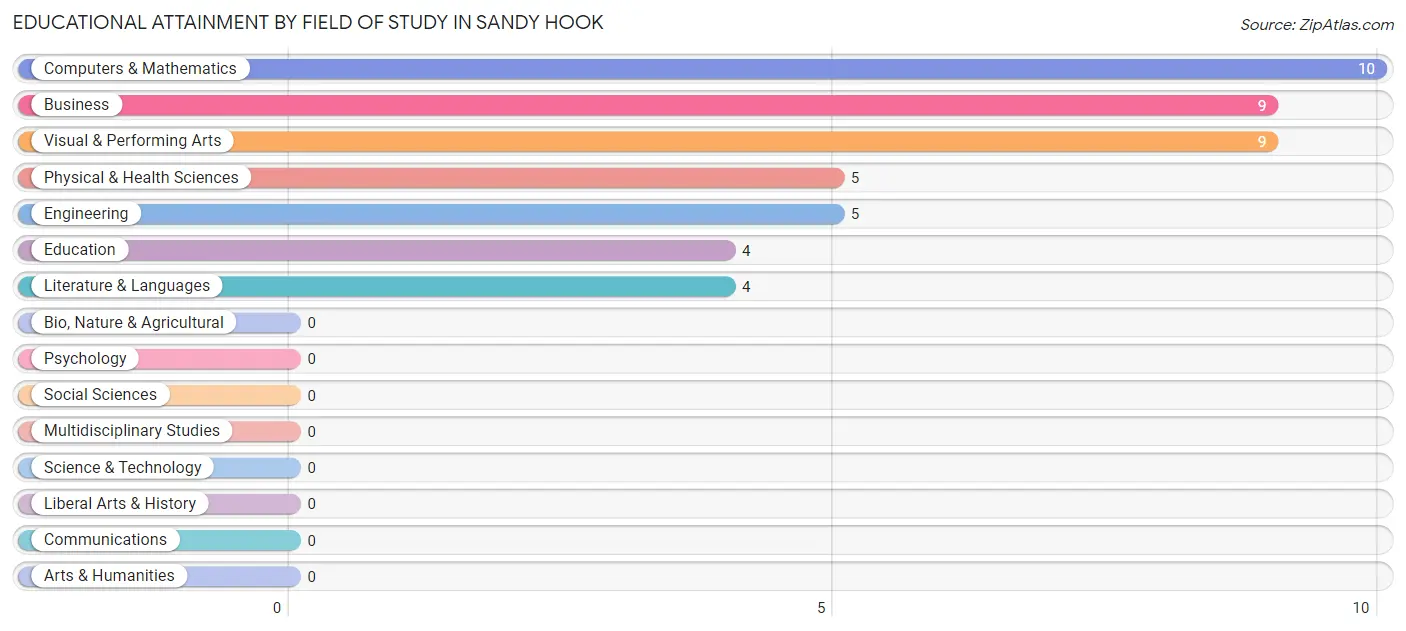
| Field of Study | # Graduates | % Graduates |
| Computers & Mathematics | 10 | 21.7% |
| Bio, Nature & Agricultural | 0 | 0.0% |
| Physical & Health Sciences | 5 | 10.9% |
| Psychology | 0 | 0.0% |
| Social Sciences | 0 | 0.0% |
| Engineering | 5 | 10.9% |
| Multidisciplinary Studies | 0 | 0.0% |
| Science & Technology | 0 | 0.0% |
| Business | 9 | 19.6% |
| Education | 4 | 8.7% |
| Literature & Languages | 4 | 8.7% |
| Liberal Arts & History | 0 | 0.0% |
| Visual & Performing Arts | 9 | 19.6% |
| Communications | 0 | 0.0% |
| Arts & Humanities | 0 | 0.0% |
| Total | 46 | 100.0% |
Transportation & Commute in Sandy Hook
Vehicle Availability by Sex in Sandy Hook
The most prevalent vehicle ownership categories in Sandy Hook are males with 2 vehicles (38, accounting for 52.8%) and females with 2 vehicles (40, making up 38.4%).
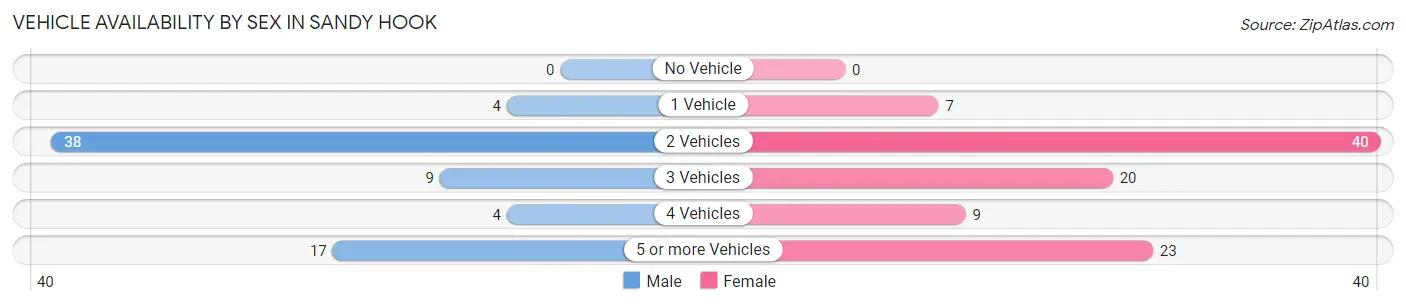
| Vehicles Available | Male | Female |
| No Vehicle | 0 (0.0%) | 0 (0.0%) |
| 1 Vehicle | 4 (5.6%) | 7 (7.1%) |
| 2 Vehicles | 38 (52.8%) | 40 (40.4%) |
| 3 Vehicles | 9 (12.5%) | 20 (20.2%) |
| 4 Vehicles | 4 (5.6%) | 9 (9.1%) |
| 5 or more Vehicles | 17 (23.6%) | 23 (23.2%) |
| Total | 72 (100.0%) | 99 (100.0%) |
Commute Time in Sandy Hook
The most frequently occuring commute durations in Sandy Hook are 10 to 14 minutes (48 commuters, 36.6%), 30 to 34 minutes (27 commuters, 20.6%), and 5 to 9 minutes (20 commuters, 15.3%).
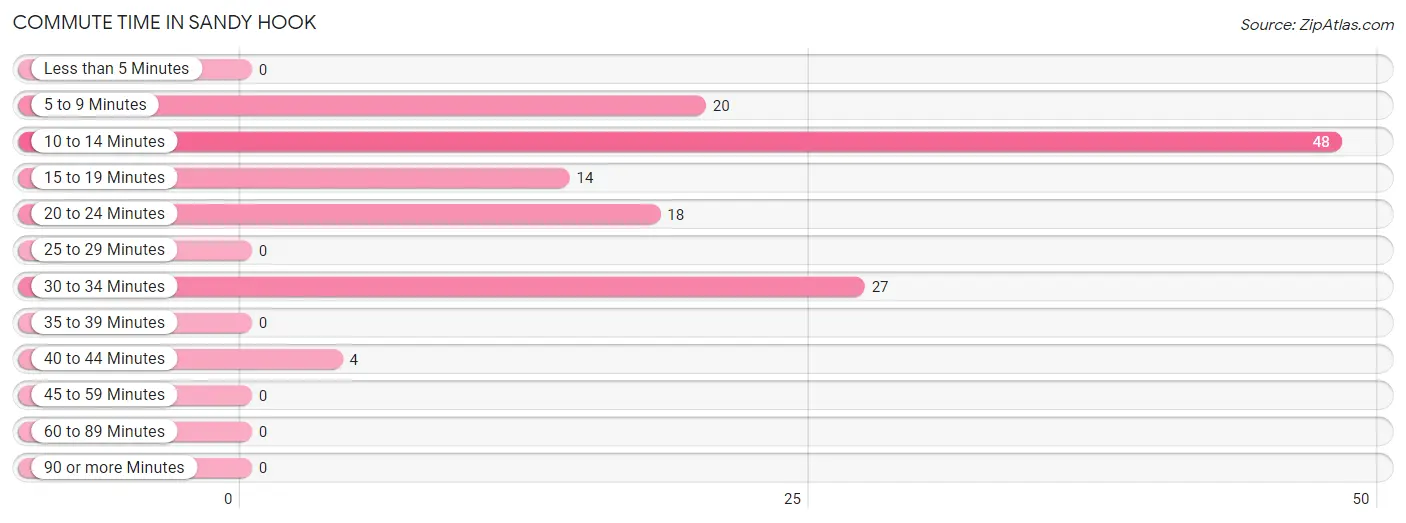
| Commute Time | # Commuters | % Commuters |
| Less than 5 Minutes | 0 | 0.0% |
| 5 to 9 Minutes | 20 | 15.3% |
| 10 to 14 Minutes | 48 | 36.6% |
| 15 to 19 Minutes | 14 | 10.7% |
| 20 to 24 Minutes | 18 | 13.7% |
| 25 to 29 Minutes | 0 | 0.0% |
| 30 to 34 Minutes | 27 | 20.6% |
| 35 to 39 Minutes | 0 | 0.0% |
| 40 to 44 Minutes | 4 | 3.0% |
| 45 to 59 Minutes | 0 | 0.0% |
| 60 to 89 Minutes | 0 | 0.0% |
| 90 or more Minutes | 0 | 0.0% |
Commute Time by Sex in Sandy Hook
The most common commute times in Sandy Hook are 30 to 34 minutes (13 commuters, 33.3%) for males and 10 to 14 minutes (39 commuters, 42.4%) for females.
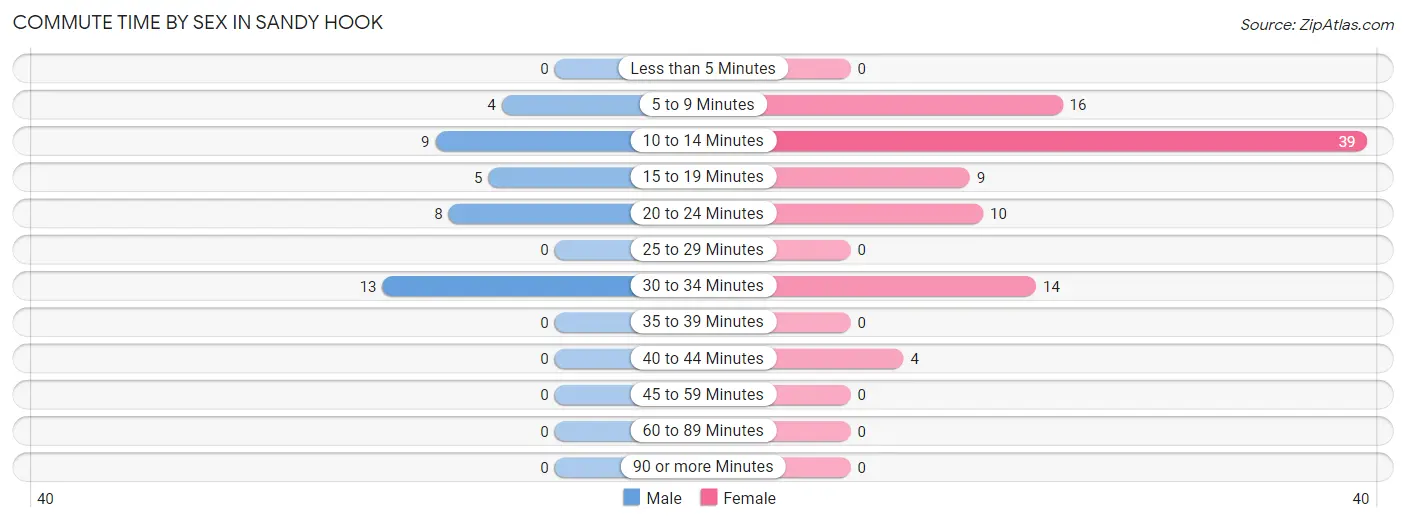
| Commute Time | Male | Female |
| Less than 5 Minutes | 0 (0.0%) | 0 (0.0%) |
| 5 to 9 Minutes | 4 (10.3%) | 16 (17.4%) |
| 10 to 14 Minutes | 9 (23.1%) | 39 (42.4%) |
| 15 to 19 Minutes | 5 (12.8%) | 9 (9.8%) |
| 20 to 24 Minutes | 8 (20.5%) | 10 (10.9%) |
| 25 to 29 Minutes | 0 (0.0%) | 0 (0.0%) |
| 30 to 34 Minutes | 13 (33.3%) | 14 (15.2%) |
| 35 to 39 Minutes | 0 (0.0%) | 0 (0.0%) |
| 40 to 44 Minutes | 0 (0.0%) | 4 (4.3%) |
| 45 to 59 Minutes | 0 (0.0%) | 0 (0.0%) |
| 60 to 89 Minutes | 0 (0.0%) | 0 (0.0%) |
| 90 or more Minutes | 0 (0.0%) | 0 (0.0%) |
Time of Departure to Work by Sex in Sandy Hook
The most frequent times of departure to work in Sandy Hook are 7:30 AM to 7:59 AM (18, 46.2%) for males and 8:00 AM to 8:29 AM (31, 33.7%) for females.

| Time of Departure | Male | Female |
| 12:00 AM to 4:59 AM | 0 (0.0%) | 6 (6.5%) |
| 5:00 AM to 5:29 AM | 0 (0.0%) | 4 (4.3%) |
| 5:30 AM to 5:59 AM | 0 (0.0%) | 14 (15.2%) |
| 6:00 AM to 6:29 AM | 0 (0.0%) | 5 (5.4%) |
| 6:30 AM to 6:59 AM | 0 (0.0%) | 0 (0.0%) |
| 7:00 AM to 7:29 AM | 0 (0.0%) | 0 (0.0%) |
| 7:30 AM to 7:59 AM | 18 (46.2%) | 15 (16.3%) |
| 8:00 AM to 8:29 AM | 0 (0.0%) | 31 (33.7%) |
| 8:30 AM to 8:59 AM | 0 (0.0%) | 10 (10.9%) |
| 9:00 AM to 9:59 AM | 17 (43.6%) | 3 (3.3%) |
| 10:00 AM to 10:59 AM | 0 (0.0%) | 0 (0.0%) |
| 11:00 AM to 11:59 AM | 0 (0.0%) | 0 (0.0%) |
| 12:00 PM to 3:59 PM | 4 (10.3%) | 0 (0.0%) |
| 4:00 PM to 11:59 PM | 0 (0.0%) | 4 (4.3%) |
| Total | 39 (100.0%) | 92 (100.0%) |
Housing Occupancy in Sandy Hook
Occupancy by Ownership in Sandy Hook
Of the total 104 dwellings in Sandy Hook, owner-occupied units account for 64 (61.5%), while renter-occupied units make up 40 (38.5%).
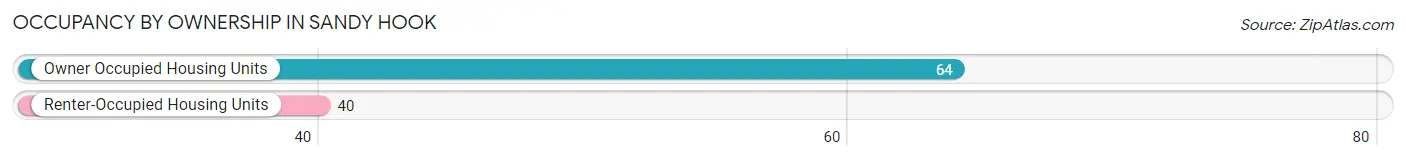
| Occupancy | # Housing Units | % Housing Units |
| Owner Occupied Housing Units | 64 | 61.5% |
| Renter-Occupied Housing Units | 40 | 38.5% |
| Total Occupied Housing Units | 104 | 100.0% |
Occupancy by Household Size in Sandy Hook
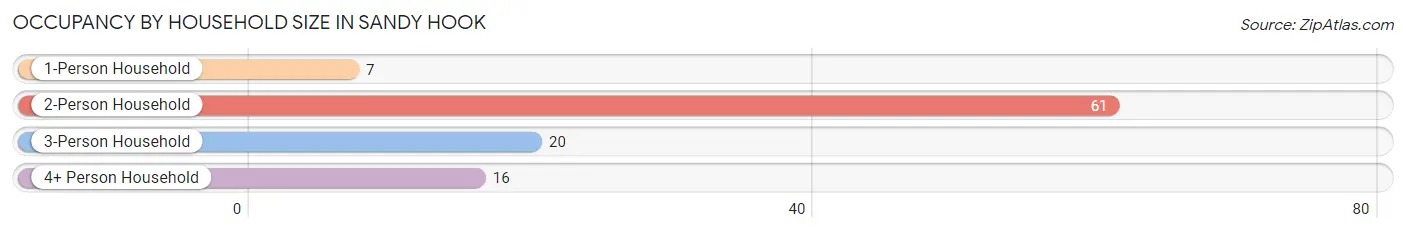
| Household Size | # Housing Units | % Housing Units |
| 1-Person Household | 7 | 6.7% |
| 2-Person Household | 61 | 58.7% |
| 3-Person Household | 20 | 19.2% |
| 4+ Person Household | 16 | 15.4% |
| Total Housing Units | 104 | 100.0% |
Occupancy by Ownership by Household Size in Sandy Hook
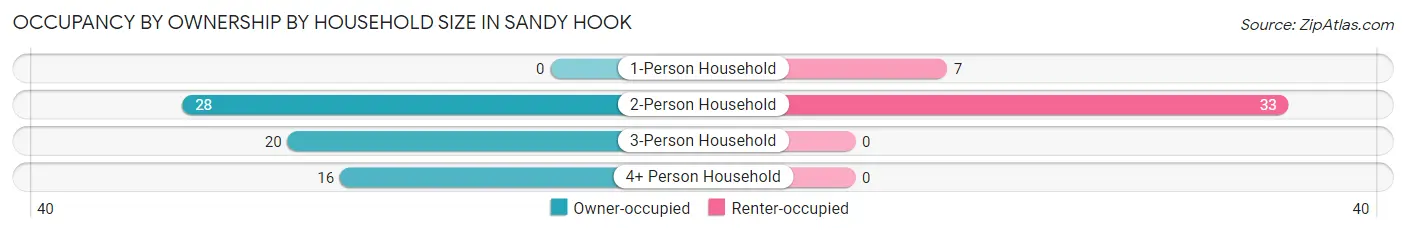
| Household Size | Owner-occupied | Renter-occupied |
| 1-Person Household | 0 (0.0%) | 7 (100.0%) |
| 2-Person Household | 28 (45.9%) | 33 (54.1%) |
| 3-Person Household | 20 (100.0%) | 0 (0.0%) |
| 4+ Person Household | 16 (100.0%) | 0 (0.0%) |
| Total Housing Units | 64 (61.5%) | 40 (38.5%) |
Occupancy by Educational Attainment in Sandy Hook
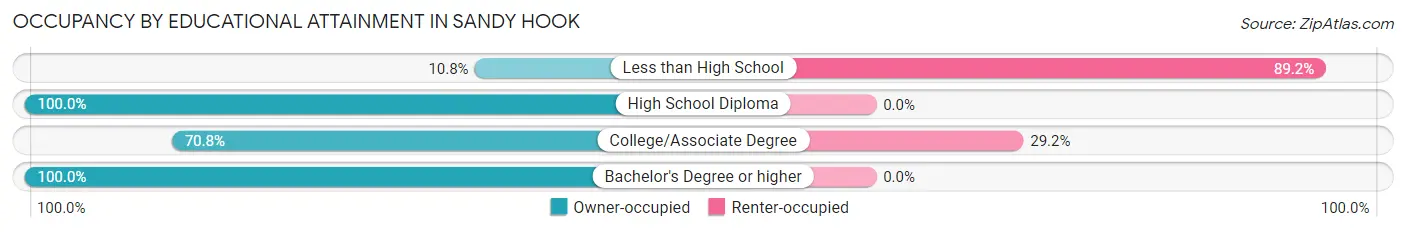
| Household Size | Owner-occupied | Renter-occupied |
| Less than High School | 4 (10.8%) | 33 (89.2%) |
| High School Diploma | 15 (100.0%) | 0 (0.0%) |
| College/Associate Degree | 17 (70.8%) | 7 (29.2%) |
| Bachelor's Degree or higher | 28 (100.0%) | 0 (0.0%) |
Occupancy by Age of Householder in Sandy Hook
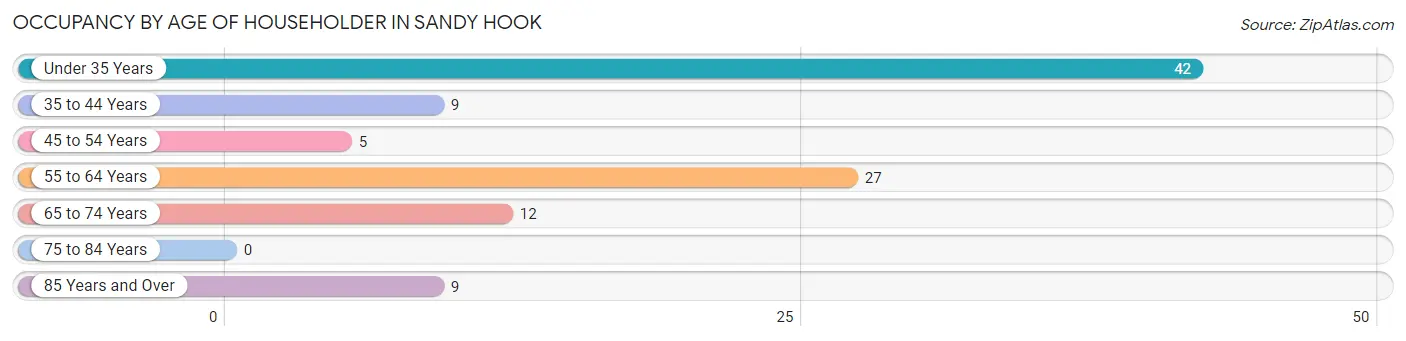
| Age Bracket | # Households | % Households |
| Under 35 Years | 42 | 40.4% |
| 35 to 44 Years | 9 | 8.6% |
| 45 to 54 Years | 5 | 4.8% |
| 55 to 64 Years | 27 | 26.0% |
| 65 to 74 Years | 12 | 11.5% |
| 75 to 84 Years | 0 | 0.0% |
| 85 Years and Over | 9 | 8.6% |
| Total | 104 | 100.0% |
Housing Finances in Sandy Hook
Median Income by Occupancy in Sandy Hook
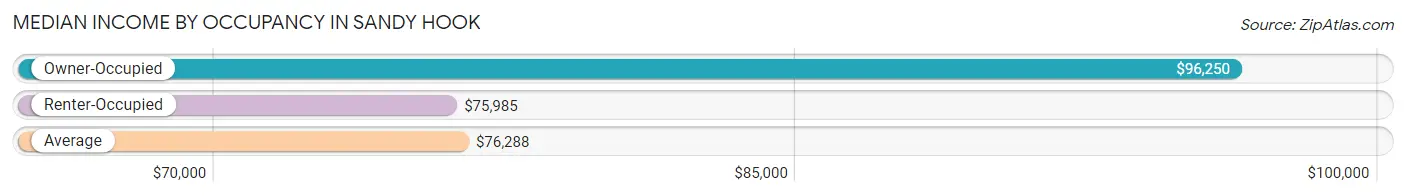
| Occupancy Type | # Households | Median Income |
| Owner-Occupied | 64 (61.5%) | $96,250 |
| Renter-Occupied | 40 (38.5%) | $75,985 |
| Average | 104 (100.0%) | $76,288 |
Occupancy by Householder Income Bracket in Sandy Hook
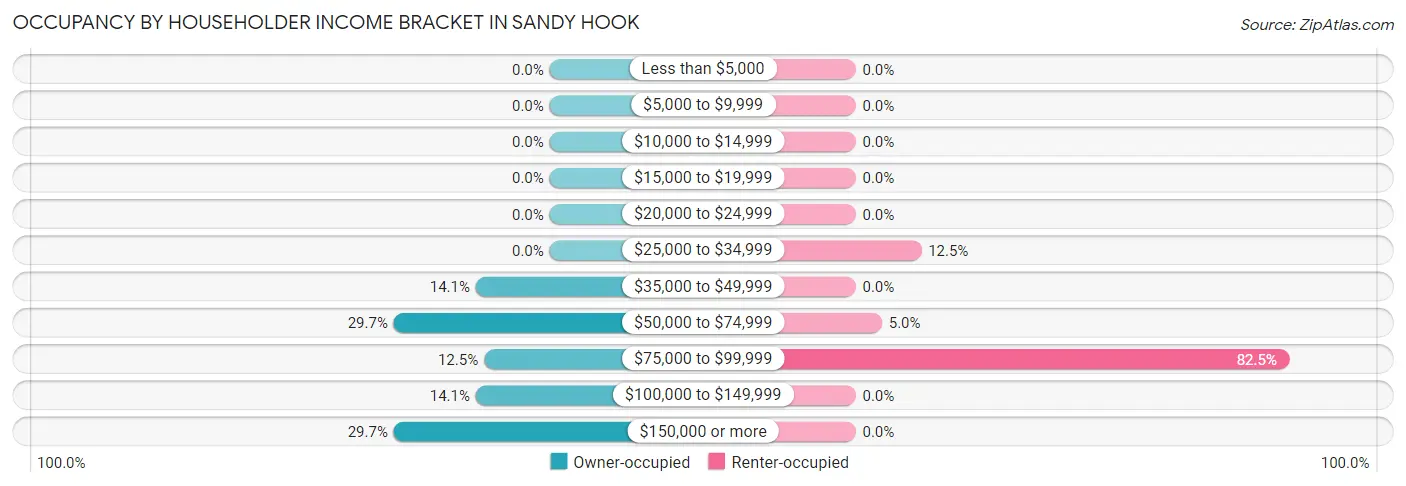
| Income Bracket | Owner-occupied | Renter-occupied |
| Less than $5,000 | 0 (0.0%) | 0 (0.0%) |
| $5,000 to $9,999 | 0 (0.0%) | 0 (0.0%) |
| $10,000 to $14,999 | 0 (0.0%) | 0 (0.0%) |
| $15,000 to $19,999 | 0 (0.0%) | 0 (0.0%) |
| $20,000 to $24,999 | 0 (0.0%) | 0 (0.0%) |
| $25,000 to $34,999 | 0 (0.0%) | 5 (12.5%) |
| $35,000 to $49,999 | 9 (14.1%) | 0 (0.0%) |
| $50,000 to $74,999 | 19 (29.7%) | 2 (5.0%) |
| $75,000 to $99,999 | 8 (12.5%) | 33 (82.5%) |
| $100,000 to $149,999 | 9 (14.1%) | 0 (0.0%) |
| $150,000 or more | 19 (29.7%) | 0 (0.0%) |
| Total | 64 (100.0%) | 40 (100.0%) |
Monthly Housing Cost Tiers in Sandy Hook
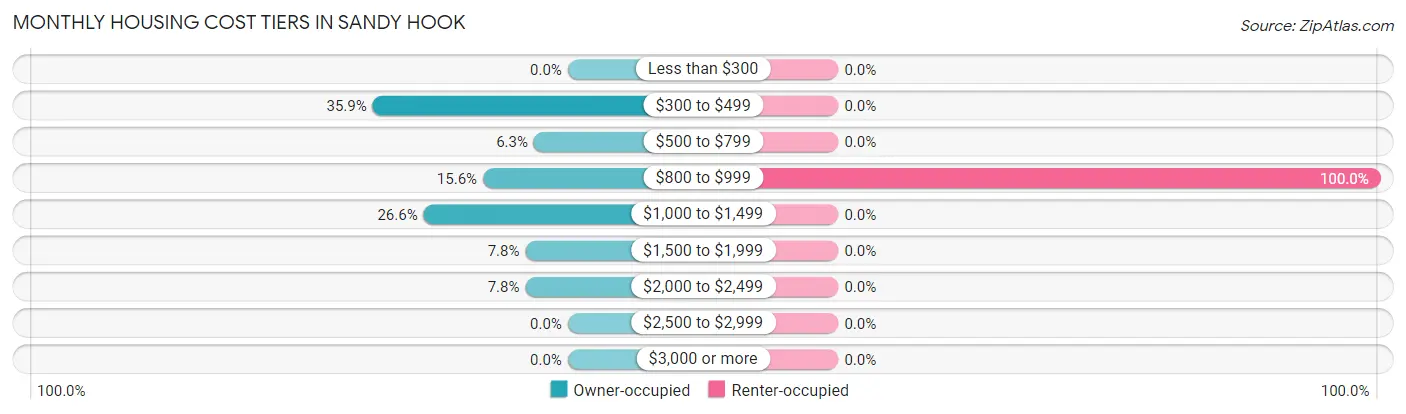
| Monthly Cost | Owner-occupied | Renter-occupied |
| Less than $300 | 0 (0.0%) | 0 (0.0%) |
| $300 to $499 | 23 (35.9%) | 0 (0.0%) |
| $500 to $799 | 4 (6.2%) | 0 (0.0%) |
| $800 to $999 | 10 (15.6%) | 40 (100.0%) |
| $1,000 to $1,499 | 17 (26.6%) | 0 (0.0%) |
| $1,500 to $1,999 | 5 (7.8%) | 0 (0.0%) |
| $2,000 to $2,499 | 5 (7.8%) | 0 (0.0%) |
| $2,500 to $2,999 | 0 (0.0%) | 0 (0.0%) |
| $3,000 or more | 0 (0.0%) | 0 (0.0%) |
| Total | 64 (100.0%) | 40 (100.0%) |
Physical Housing Characteristics in Sandy Hook
Housing Structures in Sandy Hook
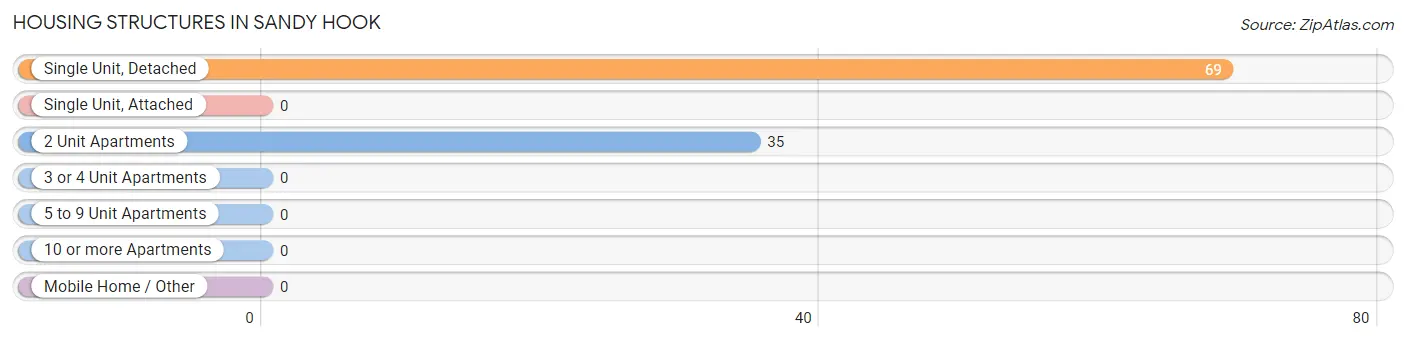
| Structure Type | # Housing Units | % Housing Units |
| Single Unit, Detached | 69 | 66.3% |
| Single Unit, Attached | 0 | 0.0% |
| 2 Unit Apartments | 35 | 33.7% |
| 3 or 4 Unit Apartments | 0 | 0.0% |
| 5 to 9 Unit Apartments | 0 | 0.0% |
| 10 or more Apartments | 0 | 0.0% |
| Mobile Home / Other | 0 | 0.0% |
| Total | 104 | 100.0% |
Housing Structures by Occupancy in Sandy Hook
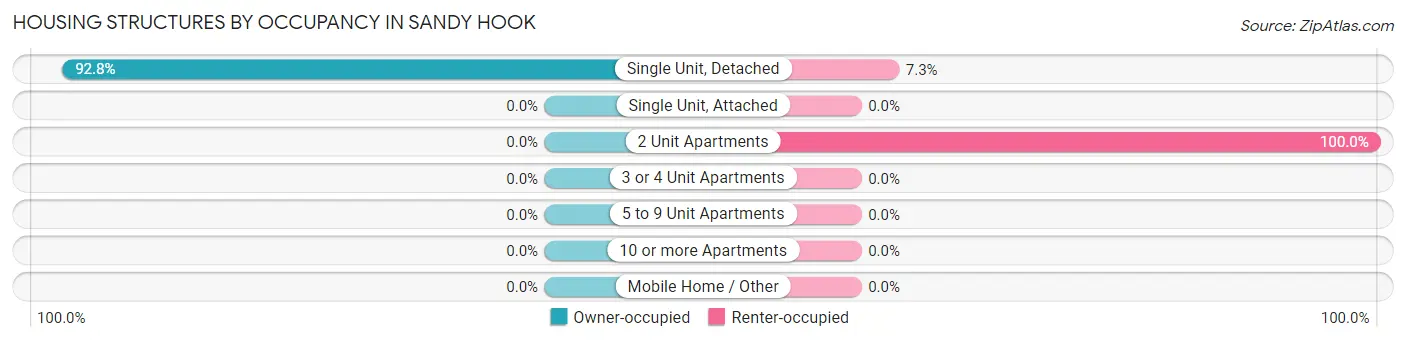
| Structure Type | Owner-occupied | Renter-occupied |
| Single Unit, Detached | 64 (92.7%) | 5 (7.2%) |
| Single Unit, Attached | 0 (0.0%) | 0 (0.0%) |
| 2 Unit Apartments | 0 (0.0%) | 35 (100.0%) |
| 3 or 4 Unit Apartments | 0 (0.0%) | 0 (0.0%) |
| 5 to 9 Unit Apartments | 0 (0.0%) | 0 (0.0%) |
| 10 or more Apartments | 0 (0.0%) | 0 (0.0%) |
| Mobile Home / Other | 0 (0.0%) | 0 (0.0%) |
| Total | 64 (61.5%) | 40 (38.5%) |
Housing Structures by Number of Rooms in Sandy Hook
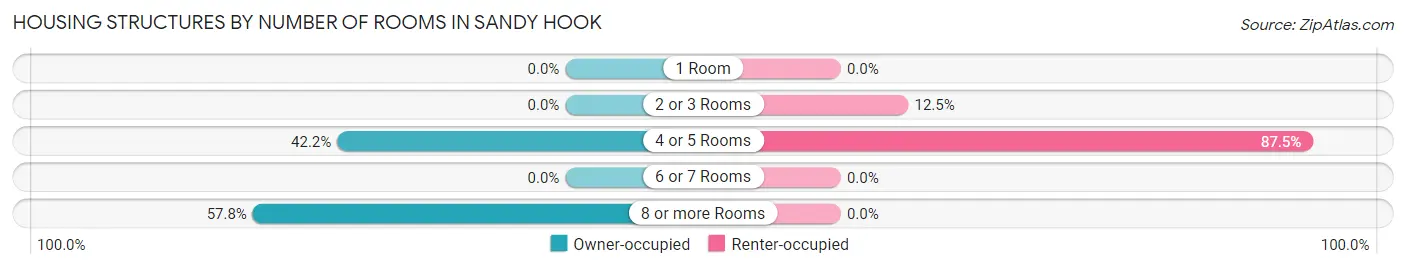
| Number of Rooms | Owner-occupied | Renter-occupied |
| 1 Room | 0 (0.0%) | 0 (0.0%) |
| 2 or 3 Rooms | 0 (0.0%) | 5 (12.5%) |
| 4 or 5 Rooms | 27 (42.2%) | 35 (87.5%) |
| 6 or 7 Rooms | 0 (0.0%) | 0 (0.0%) |
| 8 or more Rooms | 37 (57.8%) | 0 (0.0%) |
| Total | 64 (100.0%) | 40 (100.0%) |
Housing Structure by Heating Type in Sandy Hook
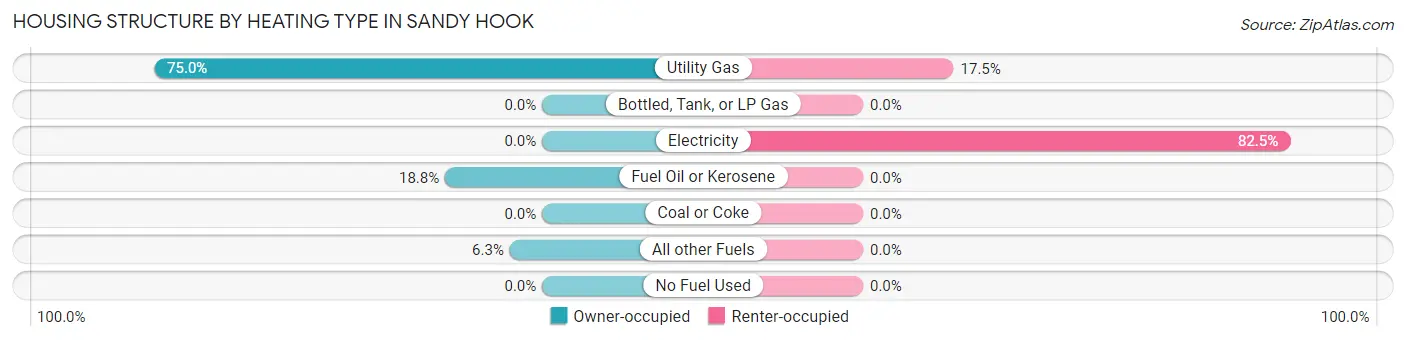
| Heating Type | Owner-occupied | Renter-occupied |
| Utility Gas | 48 (75.0%) | 7 (17.5%) |
| Bottled, Tank, or LP Gas | 0 (0.0%) | 0 (0.0%) |
| Electricity | 0 (0.0%) | 33 (82.5%) |
| Fuel Oil or Kerosene | 12 (18.8%) | 0 (0.0%) |
| Coal or Coke | 0 (0.0%) | 0 (0.0%) |
| All other Fuels | 4 (6.2%) | 0 (0.0%) |
| No Fuel Used | 0 (0.0%) | 0 (0.0%) |
| Total | 64 (100.0%) | 40 (100.0%) |
Household Vehicle Usage in Sandy Hook
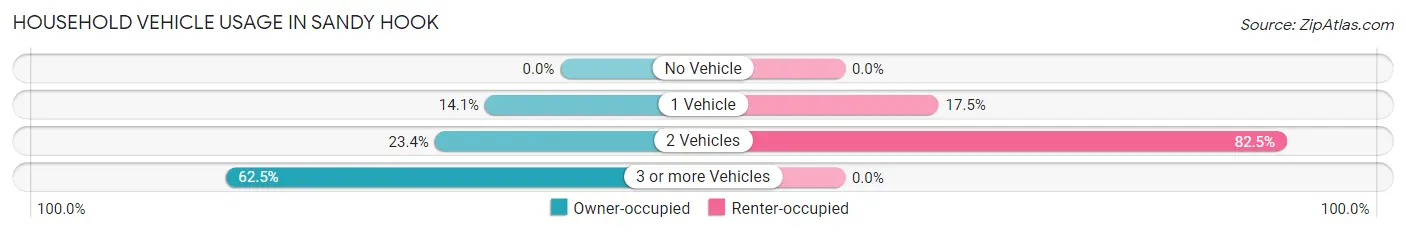
| Vehicles per Household | Owner-occupied | Renter-occupied |
| No Vehicle | 0 (0.0%) | 0 (0.0%) |
| 1 Vehicle | 9 (14.1%) | 7 (17.5%) |
| 2 Vehicles | 15 (23.4%) | 33 (82.5%) |
| 3 or more Vehicles | 40 (62.5%) | 0 (0.0%) |
| Total | 64 (100.0%) | 40 (100.0%) |
Real Estate & Mortgages in Sandy Hook
Real Estate and Mortgage Overview in Sandy Hook
| Characteristic | Without Mortgage | With Mortgage |
| Housing Units | 36 | 28 |
| Median Property Value | $203,800 | $163,900 |
| Median Household Income | $74,583 | $10 |
| Monthly Housing Costs | $478 | $0 |
| Real Estate Taxes | $2,667 | $0 |
Property Value by Mortgage Status in Sandy Hook
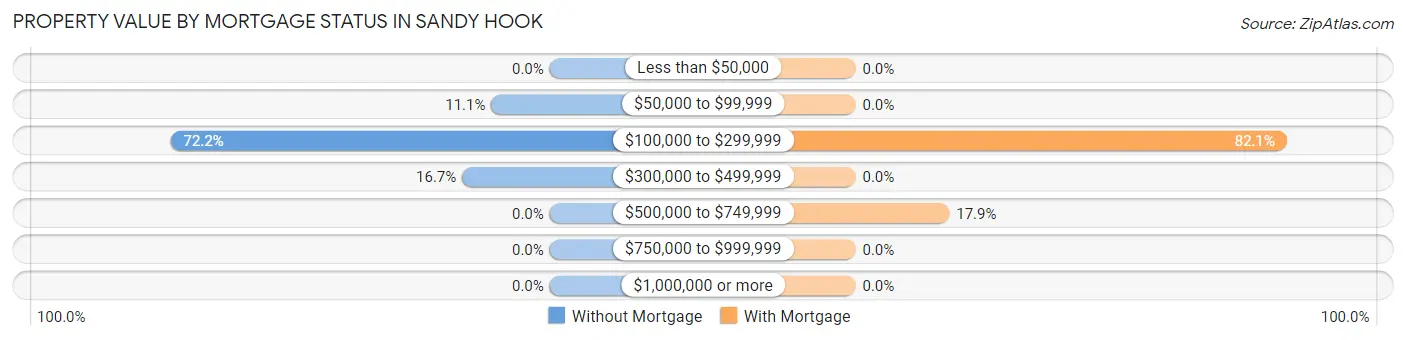
| Property Value | Without Mortgage | With Mortgage |
| Less than $50,000 | 0 (0.0%) | 0 (0.0%) |
| $50,000 to $99,999 | 4 (11.1%) | 0 (0.0%) |
| $100,000 to $299,999 | 26 (72.2%) | 23 (82.1%) |
| $300,000 to $499,999 | 6 (16.7%) | 0 (0.0%) |
| $500,000 to $749,999 | 0 (0.0%) | 5 (17.9%) |
| $750,000 to $999,999 | 0 (0.0%) | 0 (0.0%) |
| $1,000,000 or more | 0 (0.0%) | 0 (0.0%) |
| Total | 36 (100.0%) | 28 (100.0%) |
Household Income by Mortgage Status in Sandy Hook
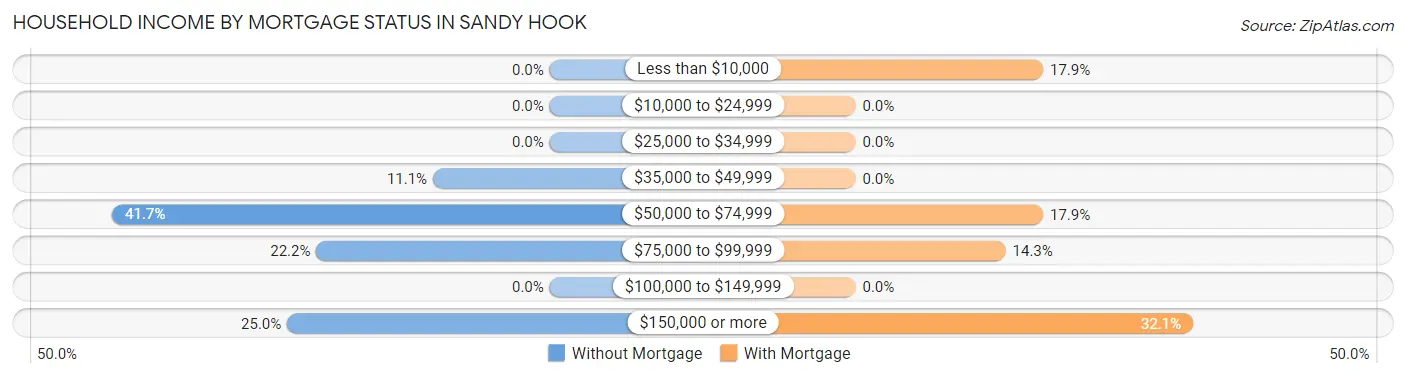
| Household Income | Without Mortgage | With Mortgage |
| Less than $10,000 | 0 (0.0%) | 5 (17.9%) |
| $10,000 to $24,999 | 0 (0.0%) | 0 (0.0%) |
| $25,000 to $34,999 | 0 (0.0%) | 0 (0.0%) |
| $35,000 to $49,999 | 4 (11.1%) | 0 (0.0%) |
| $50,000 to $74,999 | 15 (41.7%) | 5 (17.9%) |
| $75,000 to $99,999 | 8 (22.2%) | 4 (14.3%) |
| $100,000 to $149,999 | 0 (0.0%) | 0 (0.0%) |
| $150,000 or more | 9 (25.0%) | 9 (32.1%) |
| Total | 36 (100.0%) | 28 (100.0%) |
Property Value to Household Income Ratio in Sandy Hook
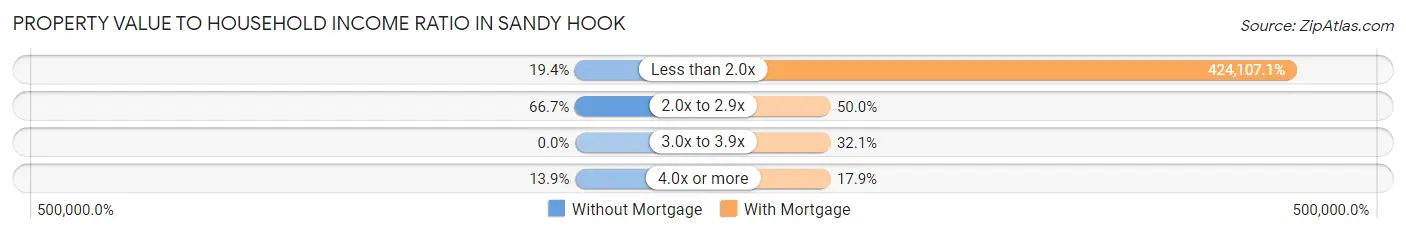
| Value-to-Income Ratio | Without Mortgage | With Mortgage |
| Less than 2.0x | 7 (19.4%) | 118,750 (424,107.1%) |
| 2.0x to 2.9x | 24 (66.7%) | 14 (50.0%) |
| 3.0x to 3.9x | 0 (0.0%) | 9 (32.1%) |
| 4.0x or more | 5 (13.9%) | 5 (17.9%) |
| Total | 36 (100.0%) | 28 (100.0%) |
Real Estate Taxes by Mortgage Status in Sandy Hook
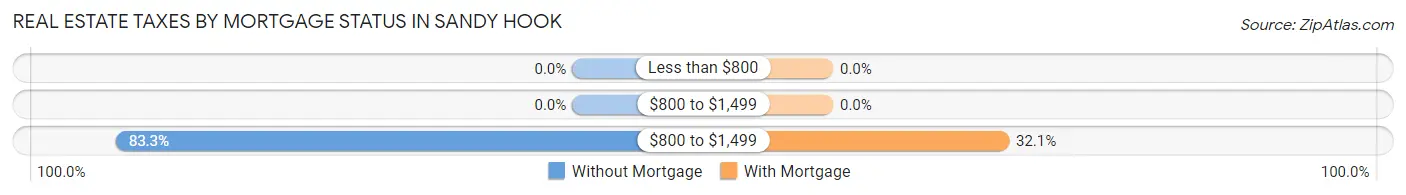
| Property Taxes | Without Mortgage | With Mortgage |
| Less than $800 | 0 (0.0%) | 0 (0.0%) |
| $800 to $1,499 | 0 (0.0%) | 0 (0.0%) |
| $800 to $1,499 | 30 (83.3%) | 9 (32.1%) |
| Total | 36 (100.0%) | 28 (100.0%) |
Health & Disability in Sandy Hook
Health Insurance Coverage by Age in Sandy Hook
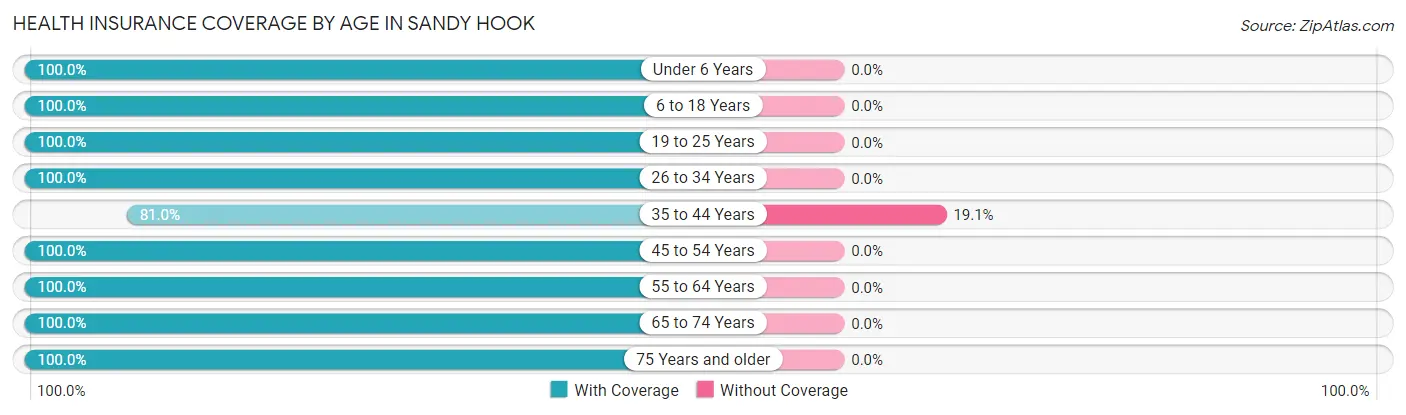
| Age Bracket | With Coverage | Without Coverage |
| Under 6 Years | 7 (100.0%) | 0 (0.0%) |
| 6 to 18 Years | 27 (100.0%) | 0 (0.0%) |
| 19 to 25 Years | 19 (100.0%) | 0 (0.0%) |
| 26 to 34 Years | 81 (100.0%) | 0 (0.0%) |
| 35 to 44 Years | 17 (80.9%) | 4 (19.1%) |
| 45 to 54 Years | 10 (100.0%) | 0 (0.0%) |
| 55 to 64 Years | 47 (100.0%) | 0 (0.0%) |
| 65 to 74 Years | 36 (100.0%) | 0 (0.0%) |
| 75 Years and older | 13 (100.0%) | 0 (0.0%) |
| Total | 257 (98.5%) | 4 (1.5%) |
Health Insurance Coverage by Citizenship Status in Sandy Hook
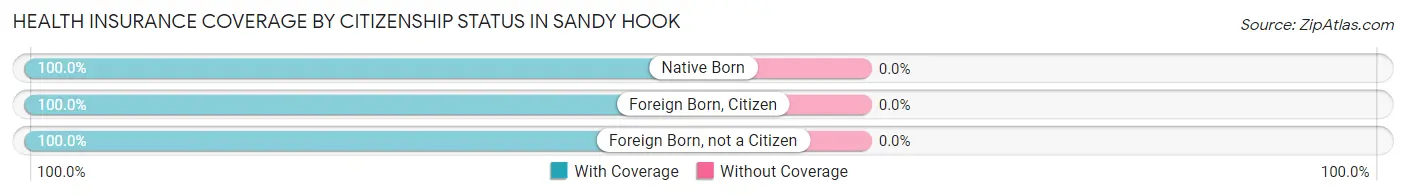
| Citizenship Status | With Coverage | Without Coverage |
| Native Born | 7 (100.0%) | 0 (0.0%) |
| Foreign Born, Citizen | 27 (100.0%) | 0 (0.0%) |
| Foreign Born, not a Citizen | 19 (100.0%) | 0 (0.0%) |
Health Insurance Coverage by Household Income in Sandy Hook
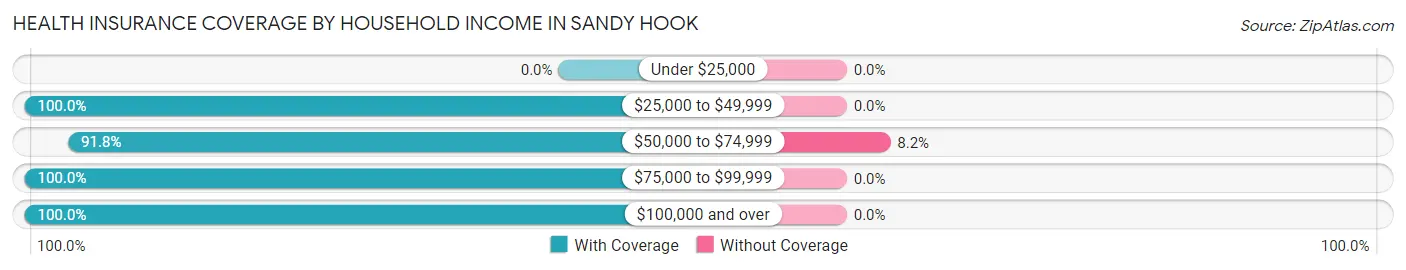
| Household Income | With Coverage | Without Coverage |
| Under $25,000 | 0 (0.0%) | 0 (0.0%) |
| $25,000 to $49,999 | 23 (100.0%) | 0 (0.0%) |
| $50,000 to $74,999 | 45 (91.8%) | 4 (8.2%) |
| $75,000 to $99,999 | 94 (100.0%) | 0 (0.0%) |
| $100,000 and over | 95 (100.0%) | 0 (0.0%) |
Public vs Private Health Insurance Coverage by Age in Sandy Hook
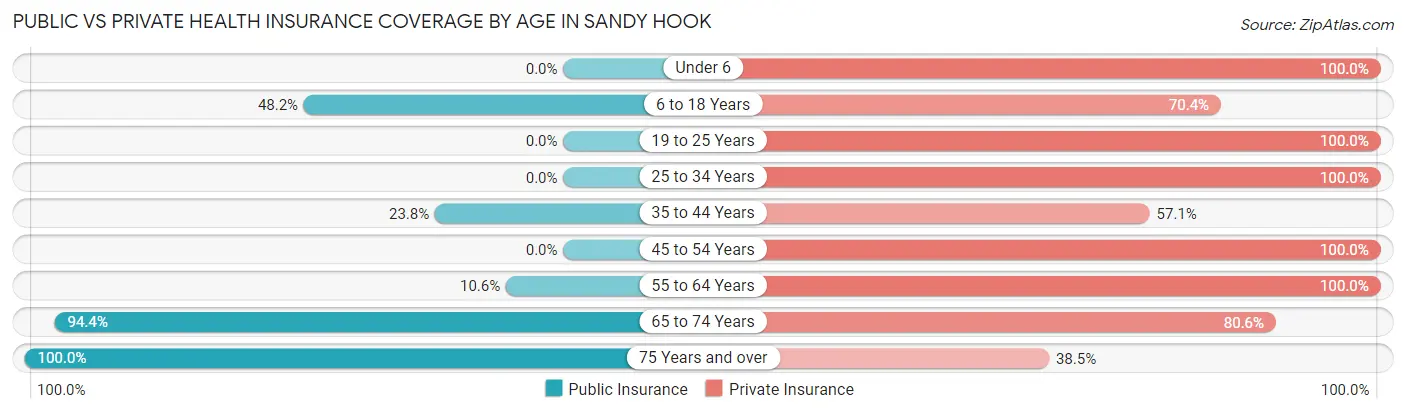
| Age Bracket | Public Insurance | Private Insurance |
| Under 6 | 0 (0.0%) | 7 (100.0%) |
| 6 to 18 Years | 13 (48.1%) | 19 (70.4%) |
| 19 to 25 Years | 0 (0.0%) | 19 (100.0%) |
| 25 to 34 Years | 0 (0.0%) | 81 (100.0%) |
| 35 to 44 Years | 5 (23.8%) | 12 (57.1%) |
| 45 to 54 Years | 0 (0.0%) | 10 (100.0%) |
| 55 to 64 Years | 5 (10.6%) | 47 (100.0%) |
| 65 to 74 Years | 34 (94.4%) | 29 (80.6%) |
| 75 Years and over | 13 (100.0%) | 5 (38.5%) |
| Total | 70 (26.8%) | 229 (87.7%) |
Disability Status by Sex by Age in Sandy Hook
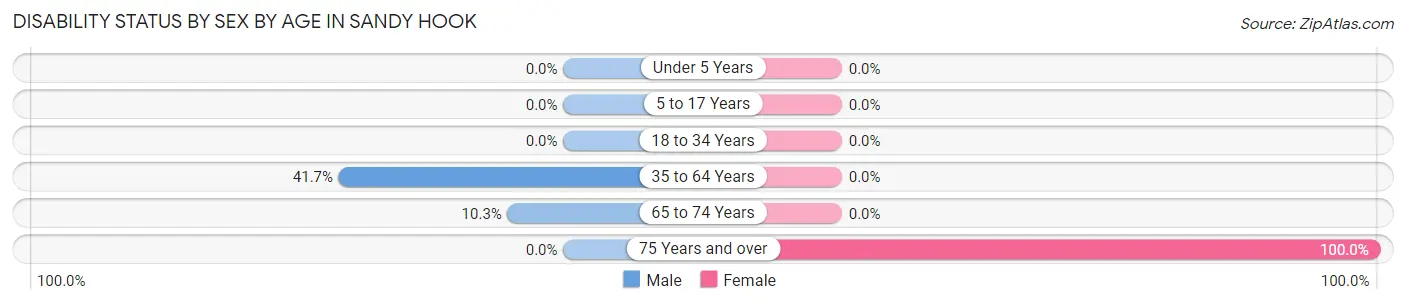
| Age Bracket | Male | Female |
| Under 5 Years | 0 (0.0%) | 0 (0.0%) |
| 5 to 17 Years | 0 (0.0%) | 0 (0.0%) |
| 18 to 34 Years | 0 (0.0%) | 0 (0.0%) |
| 35 to 64 Years | 10 (41.7%) | 0 (0.0%) |
| 65 to 74 Years | 3 (10.3%) | 0 (0.0%) |
| 75 Years and over | 0 (0.0%) | 9 (100.0%) |
Disability Class by Sex by Age in Sandy Hook
Disability Class: Hearing Difficulty
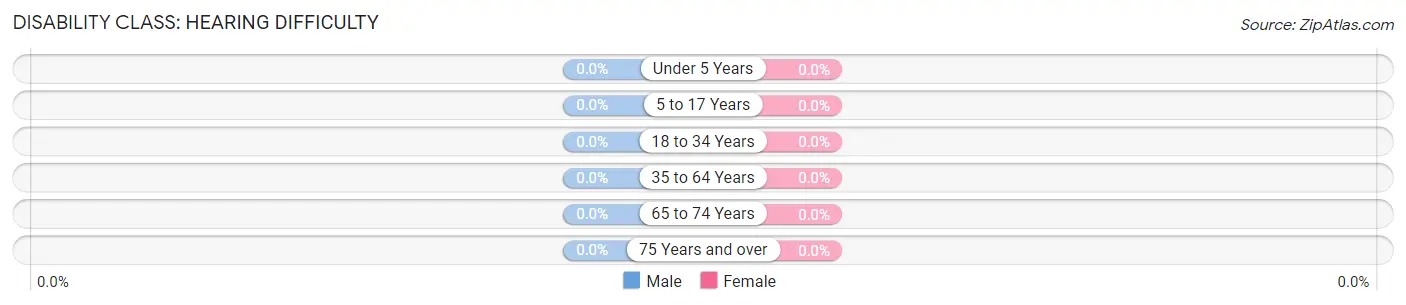
| Age Bracket | Male | Female |
| Under 5 Years | 0 (0.0%) | 0 (0.0%) |
| 5 to 17 Years | 0 (0.0%) | 0 (0.0%) |
| 18 to 34 Years | 0 (0.0%) | 0 (0.0%) |
| 35 to 64 Years | 0 (0.0%) | 0 (0.0%) |
| 65 to 74 Years | 0 (0.0%) | 0 (0.0%) |
| 75 Years and over | 0 (0.0%) | 0 (0.0%) |
Disability Class: Vision Difficulty
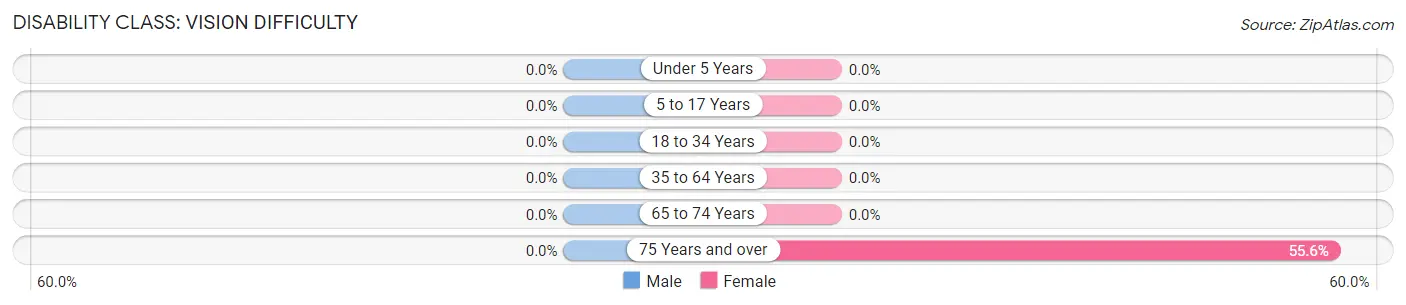
| Age Bracket | Male | Female |
| Under 5 Years | 0 (0.0%) | 0 (0.0%) |
| 5 to 17 Years | 0 (0.0%) | 0 (0.0%) |
| 18 to 34 Years | 0 (0.0%) | 0 (0.0%) |
| 35 to 64 Years | 0 (0.0%) | 0 (0.0%) |
| 65 to 74 Years | 0 (0.0%) | 0 (0.0%) |
| 75 Years and over | 0 (0.0%) | 5 (55.6%) |
Disability Class: Cognitive Difficulty
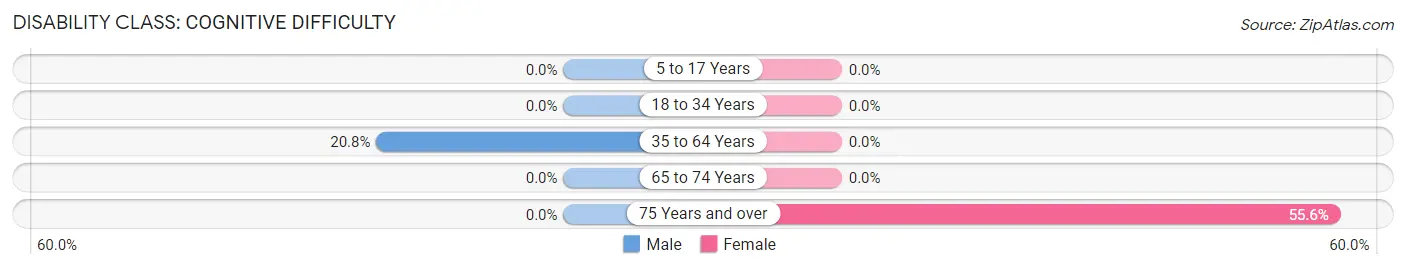
| Age Bracket | Male | Female |
| 5 to 17 Years | 0 (0.0%) | 0 (0.0%) |
| 18 to 34 Years | 0 (0.0%) | 0 (0.0%) |
| 35 to 64 Years | 5 (20.8%) | 0 (0.0%) |
| 65 to 74 Years | 0 (0.0%) | 0 (0.0%) |
| 75 Years and over | 0 (0.0%) | 5 (55.6%) |
Disability Class: Ambulatory Difficulty
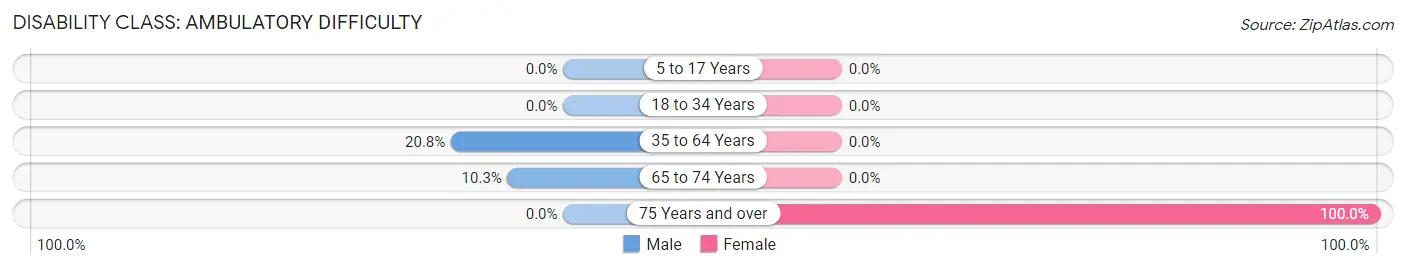
| Age Bracket | Male | Female |
| 5 to 17 Years | 0 (0.0%) | 0 (0.0%) |
| 18 to 34 Years | 0 (0.0%) | 0 (0.0%) |
| 35 to 64 Years | 5 (20.8%) | 0 (0.0%) |
| 65 to 74 Years | 3 (10.3%) | 0 (0.0%) |
| 75 Years and over | 0 (0.0%) | 9 (100.0%) |
Disability Class: Self-Care Difficulty
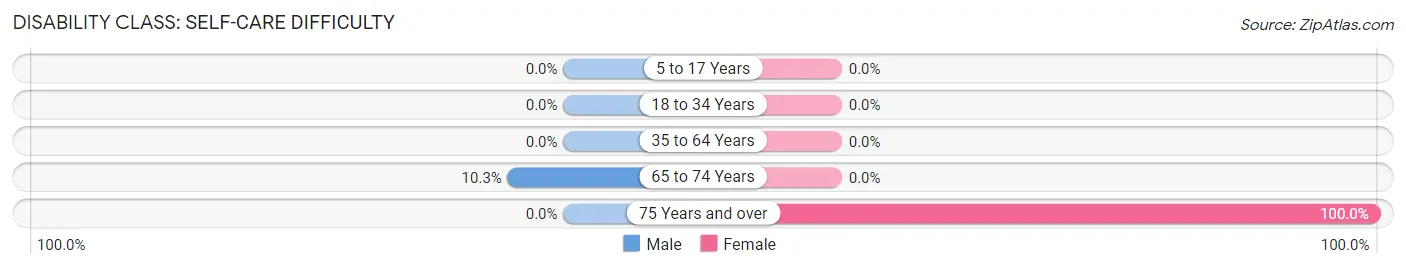
| Age Bracket | Male | Female |
| 5 to 17 Years | 0 (0.0%) | 0 (0.0%) |
| 18 to 34 Years | 0 (0.0%) | 0 (0.0%) |
| 35 to 64 Years | 0 (0.0%) | 0 (0.0%) |
| 65 to 74 Years | 3 (10.3%) | 0 (0.0%) |
| 75 Years and over | 0 (0.0%) | 9 (100.0%) |
Technology Access in Sandy Hook
Computing Device Access in Sandy Hook
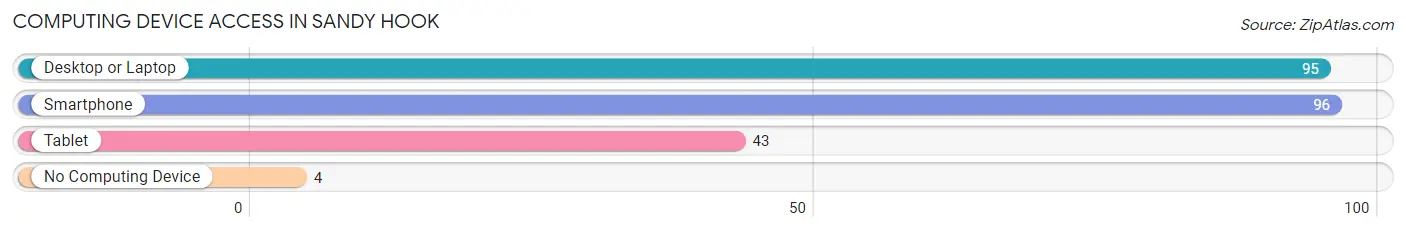
| Device Type | # Households | % Households |
| Desktop or Laptop | 95 | 91.3% |
| Smartphone | 96 | 92.3% |
| Tablet | 43 | 41.3% |
| No Computing Device | 4 | 3.8% |
| Total | 104 | 100.0% |
Internet Access in Sandy Hook
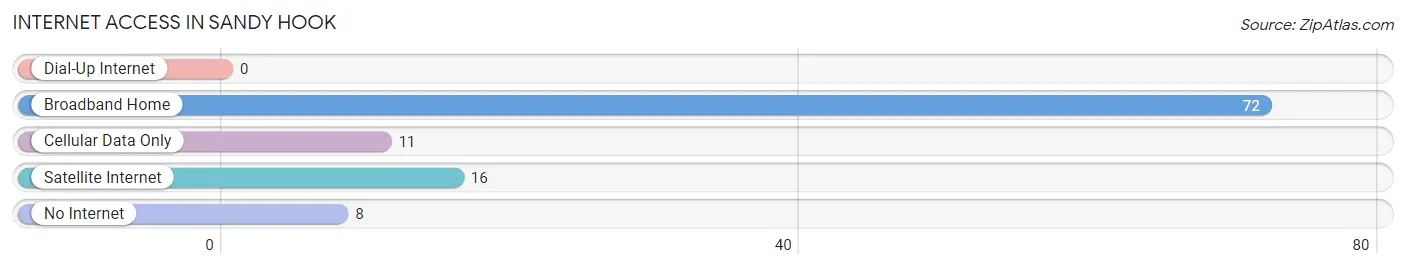
| Internet Type | # Households | % Households |
| Dial-Up Internet | 0 | 0.0% |
| Broadband Home | 72 | 69.2% |
| Cellular Data Only | 11 | 10.6% |
| Satellite Internet | 16 | 15.4% |
| No Internet | 8 | 7.7% |
| Total | 104 | 100.0% |
Sandy Hook Summary
Sandy Hook is a small unincorporated community located in the town of Washington in St. Croix County, Wisconsin, United States. It is situated on the banks of the St. Croix River, just south of the city of Hudson. The population of Sandy Hook was estimated to be around 200 in 2020.
History
Sandy Hook was first settled in the early 1800s by a group of French-Canadian fur traders. The area was originally known as “La Pointe” and was a popular trading post for the local Native American tribes. In 1837, the area was officially named Sandy Hook by the Wisconsin Territorial Legislature.
The area was primarily used for farming and logging until the late 19th century when the St. Croix River became a popular destination for recreational activities. The first hotel in Sandy Hook was built in 1891 and the area quickly became a popular summer destination for tourists.
In the early 20th century, Sandy Hook was home to a number of resorts and hotels, including the Sandy Hook Hotel, which was built in 1906. The hotel was a popular destination for tourists and was known for its luxurious accommodations and amenities.
Geography
Sandy Hook is located in the town of Washington in St. Croix County, Wisconsin. It is situated on the banks of the St. Croix River, just south of the city of Hudson. The area is characterized by rolling hills and wooded areas, with the St. Croix River providing a scenic backdrop.
The climate in Sandy Hook is typical of the Upper Midwest, with cold winters and warm summers. The average temperature in January is around 20°F (-7°C) and the average temperature in July is around 75°F (24°C).
Economy
Sandy Hook is primarily a residential community, with most of the population employed in the nearby cities of Hudson and New Richmond. The area is also home to a number of small businesses, including restaurants, retail stores, and a marina.
The area is also popular with tourists, who come to enjoy the scenic beauty of the St. Croix River and the many recreational activities available in the area.
Demographics
As of the 2010 census, the population of Sandy Hook was estimated to be around 200. The racial makeup of the community was 97.5% White, 0.5% African American, 0.5% Native American, 0.5% Asian, and 1.0% from other races.
The median household income in Sandy Hook was estimated to be around $50,000 in 2020. The median home value was estimated to be around $200,000. The median age of the population was estimated to be around 40 years old.
Common Questions
What is Per Capita Income in Sandy Hook?
Per Capita income in Sandy Hook is $43,500.
What is the Median Family Income in Sandy Hook?
Median Family Income in Sandy Hook is $76,402.
What is the Median Household income in Sandy Hook?
Median Household Income in Sandy Hook is $76,288.
What is Inequality or Gini Index in Sandy Hook?
Inequality or Gini Index in Sandy Hook is 0.35.
What is the Total Population of Sandy Hook?
Total Population of Sandy Hook is 261.
What is the Total Male Population of Sandy Hook?
Total Male Population of Sandy Hook is 125.
What is the Total Female Population of Sandy Hook?
Total Female Population of Sandy Hook is 136.
What is the Ratio of Males per 100 Females in Sandy Hook?
There are 91.91 Males per 100 Females in Sandy Hook.
What is the Ratio of Females per 100 Males in Sandy Hook?
There are 108.80 Females per 100 Males in Sandy Hook.
What is the Median Population Age in Sandy Hook?
Median Population Age in Sandy Hook is 34.3 Years.
What is the Average Family Size in Sandy Hook
Average Family Size in Sandy Hook is 2.6 People.
What is the Average Household Size in Sandy Hook
Average Household Size in Sandy Hook is 2.5 People.
How Large is the Labor Force in Sandy Hook?
There are 185 People in the Labor Forcein in Sandy Hook.
What is the Percentage of People in the Labor Force in Sandy Hook?
75.2% of People are in the Labor Force in Sandy Hook.
What is the Unemployment Rate in Sandy Hook?
Unemployment Rate in Sandy Hook is 4.3%.