Lake Ripley, WI Map & Demographics
Lake Ripley Map
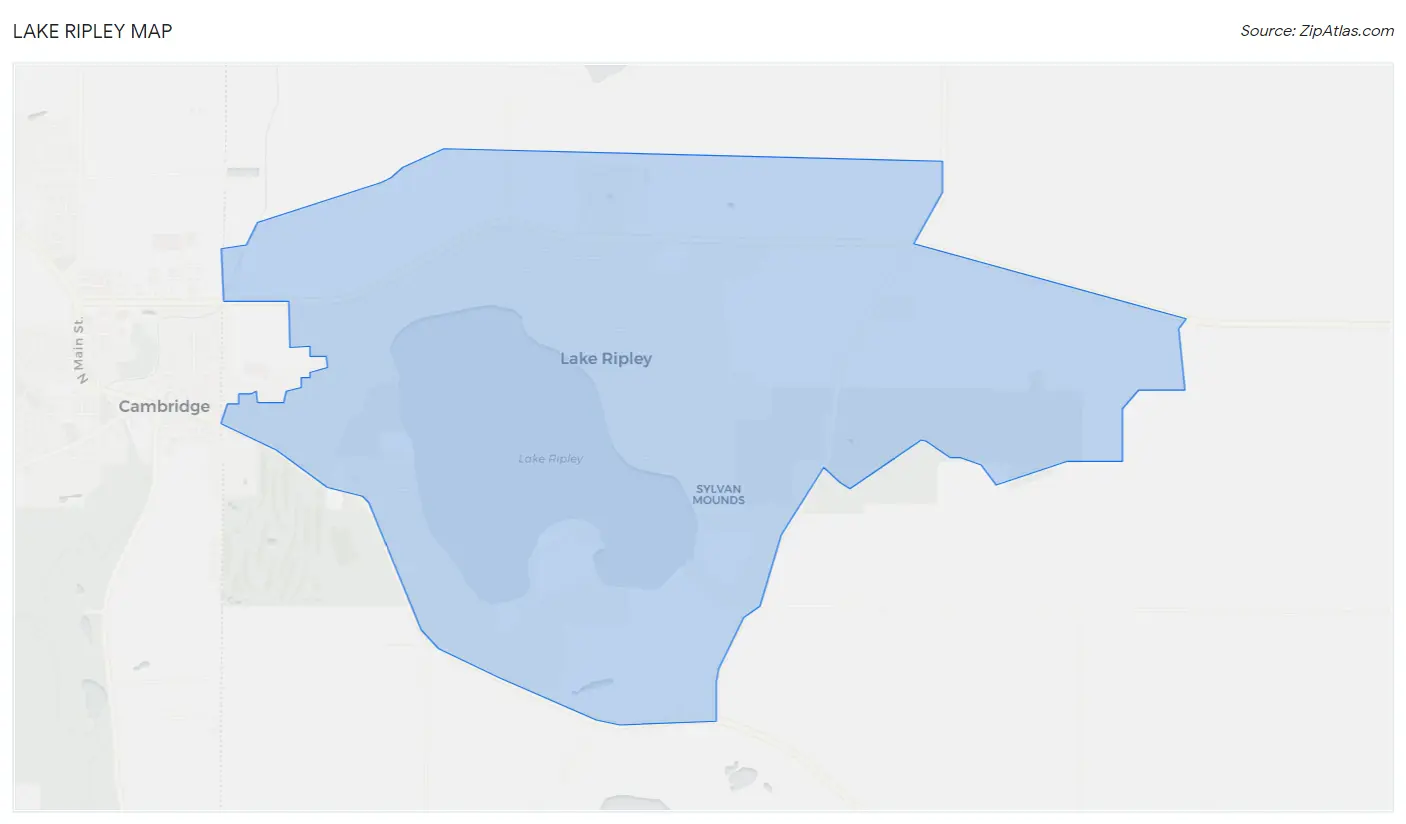
Lake Ripley Overview
$57,118
PER CAPITA INCOME
$135,170
AVG FAMILY INCOME
$118,478
AVG HOUSEHOLD INCOME
26.2%
WAGE / INCOME GAP [ % ]
73.8¢/ $1
WAGE / INCOME GAP [ $ ]
0.44
INEQUALITY / GINI INDEX
1,982
TOTAL POPULATION
870
MALE POPULATION
1,112
FEMALE POPULATION
78.24
MALES / 100 FEMALES
127.82
FEMALES / 100 MALES
51.8
MEDIAN AGE
2.9
AVG FAMILY SIZE
2.5
AVG HOUSEHOLD SIZE
1,145
LABOR FORCE [ PEOPLE ]
68.5%
PERCENT IN LABOR FORCE
7.2%
UNEMPLOYMENT RATE
Income in Lake Ripley
Income Overview in Lake Ripley
Per Capita Income in Lake Ripley is $57,118, while median incomes of families and households are $135,170 and $118,478 respectively.
| Characteristic | Number | Measure |
| Per Capita Income | 1,982 | $57,118 |
| Median Family Income | 595 | $135,170 |
| Mean Family Income | 595 | $155,126 |
| Median Household Income | 796 | $118,478 |
| Mean Household Income | 796 | $138,693 |
| Income Deficit | 595 | $0 |
| Wage / Income Gap (%) | 1,982 | 26.22% |
| Wage / Income Gap ($) | 1,982 | 73.78¢ per $1 |
| Gini / Inequality Index | 1,982 | 0.44 |
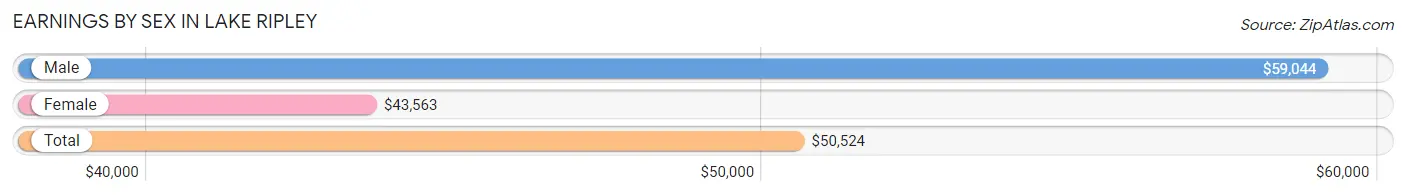
Earnings by Sex in Lake Ripley
Average Earnings in Lake Ripley are $50,524, $59,044 for men and $43,563 for women, a difference of 26.2%.
| Sex | Number | Average Earnings |
| Male | 465 (40.2%) | $59,044 |
| Female | 691 (59.8%) | $43,563 |
| Total | 1,156 (100.0%) | $50,524 |
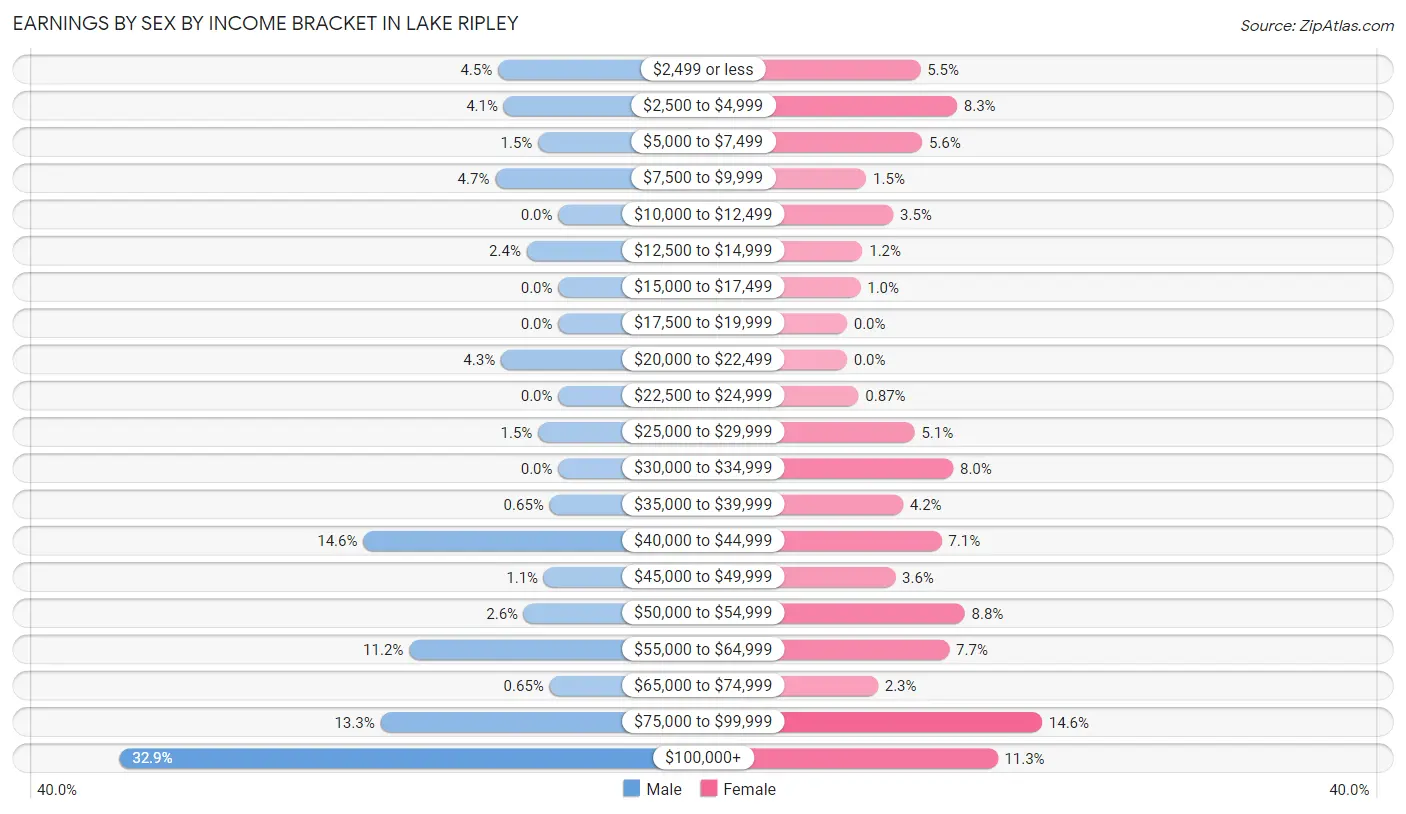
Earnings by Sex by Income Bracket in Lake Ripley
The most common earnings brackets in Lake Ripley are $100,000+ for men (153 | 32.9%) and $75,000 to $99,999 for women (101 | 14.6%).
| Income | Male | Female |
| $2,499 or less | 21 (4.5%) | 38 (5.5%) |
| $2,500 to $4,999 | 19 (4.1%) | 57 (8.3%) |
| $5,000 to $7,499 | 7 (1.5%) | 39 (5.6%) |
| $7,500 to $9,999 | 22 (4.7%) | 10 (1.5%) |
| $10,000 to $12,499 | 0 (0.0%) | 24 (3.5%) |
| $12,500 to $14,999 | 11 (2.4%) | 8 (1.2%) |
| $15,000 to $17,499 | 0 (0.0%) | 7 (1.0%) |
| $17,500 to $19,999 | 0 (0.0%) | 0 (0.0%) |
| $20,000 to $22,499 | 20 (4.3%) | 0 (0.0%) |
| $22,500 to $24,999 | 0 (0.0%) | 6 (0.9%) |
| $25,000 to $29,999 | 7 (1.5%) | 35 (5.1%) |
| $30,000 to $34,999 | 0 (0.0%) | 55 (8.0%) |
| $35,000 to $39,999 | 3 (0.6%) | 29 (4.2%) |
| $40,000 to $44,999 | 68 (14.6%) | 49 (7.1%) |
| $45,000 to $49,999 | 5 (1.1%) | 25 (3.6%) |
| $50,000 to $54,999 | 12 (2.6%) | 61 (8.8%) |
| $55,000 to $64,999 | 52 (11.2%) | 53 (7.7%) |
| $65,000 to $74,999 | 3 (0.6%) | 16 (2.3%) |
| $75,000 to $99,999 | 62 (13.3%) | 101 (14.6%) |
| $100,000+ | 153 (32.9%) | 78 (11.3%) |
| Total | 465 (100.0%) | 691 (100.0%) |
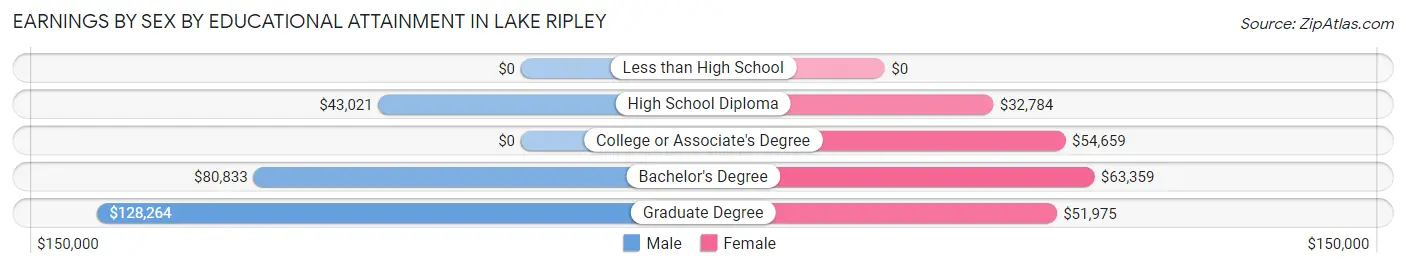
Earnings by Sex by Educational Attainment in Lake Ripley
Average earnings in Lake Ripley are $79,219 for men and $49,423 for women, a difference of 37.6%. Men with an educational attainment of graduate degree enjoy the highest average annual earnings of $128,264, while those with high school diploma education earn the least with $43,021. Women with an educational attainment of bachelor's degree earn the most with the average annual earnings of $63,359, while those with high school diploma education have the smallest earnings of $32,784.
| Educational Attainment | Male Income | Female Income |
| Less than High School | - | - |
| High School Diploma | $43,021 | $32,784 |
| College or Associate's Degree | - | - |
| Bachelor's Degree | $80,833 | $63,359 |
| Graduate Degree | $128,264 | $51,975 |
| Total | $79,219 | $49,423 |
Family Income in Lake Ripley
Family Income Brackets in Lake Ripley
According to the Lake Ripley family income data, there are 256 families falling into the $100,000 to $149,999 income range, which is the most common income bracket and makes up 43.0% of all families.
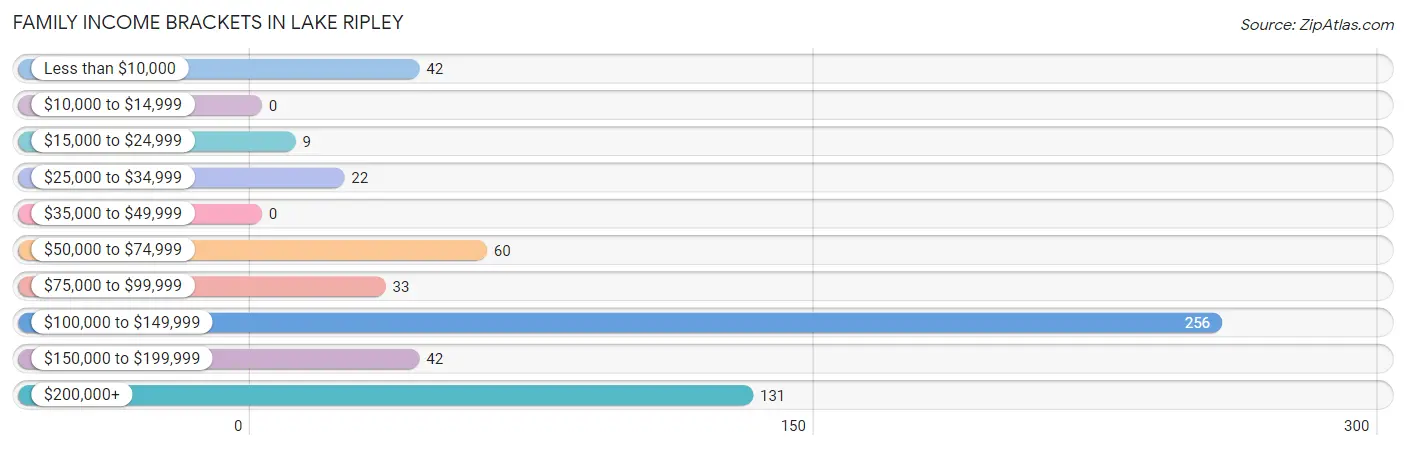
| Income Bracket | # Families | % Families |
| Less than $10,000 | 42 | 7.1% |
| $10,000 to $14,999 | 0 | 0.0% |
| $15,000 to $24,999 | 9 | 1.5% |
| $25,000 to $34,999 | 22 | 3.7% |
| $35,000 to $49,999 | 0 | 0.0% |
| $50,000 to $74,999 | 60 | 10.1% |
| $75,000 to $99,999 | 33 | 5.5% |
| $100,000 to $149,999 | 256 | 43.0% |
| $150,000 to $199,999 | 42 | 7.1% |
| $200,000+ | 131 | 22.0% |
Family Income by Famaliy Size in Lake Ripley
4-person families (90 | 15.1%) account for the highest median family income in Lake Ripley with $144,844 per family, while 2-person families (307 | 51.6%) have the highest median income of $63,368 per family member.
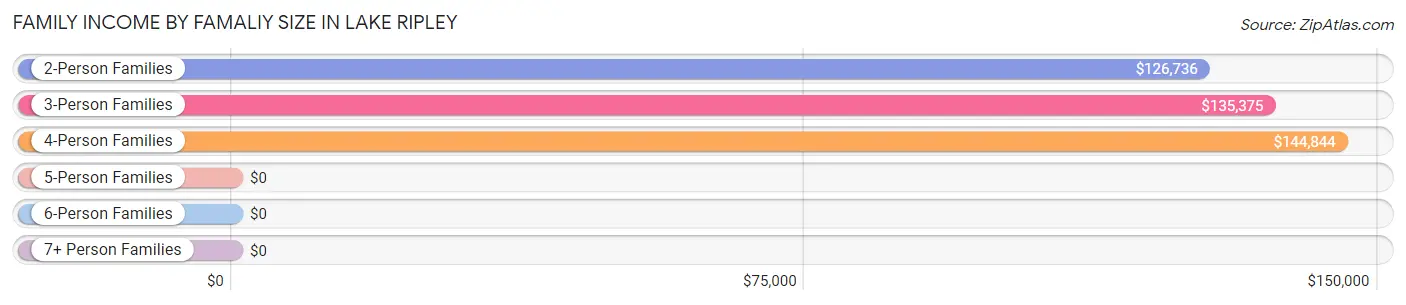
| Income Bracket | # Families | Median Income |
| 2-Person Families | 307 (51.6%) | $126,736 |
| 3-Person Families | 141 (23.7%) | $135,375 |
| 4-Person Families | 90 (15.1%) | $144,844 |
| 5-Person Families | 20 (3.4%) | $0 |
| 6-Person Families | 37 (6.2%) | $0 |
| 7+ Person Families | 0 (0.0%) | $0 |
| Total | 595 (100.0%) | $135,170 |
Family Income by Number of Earners in Lake Ripley
The median family income in Lake Ripley is $135,170, with families comprising 3+ earners (72) having the highest median family income of $148,000, while families with no earners (96) have the lowest median family income of $56,071, accounting for 12.1% and 16.1% of families, respectively.
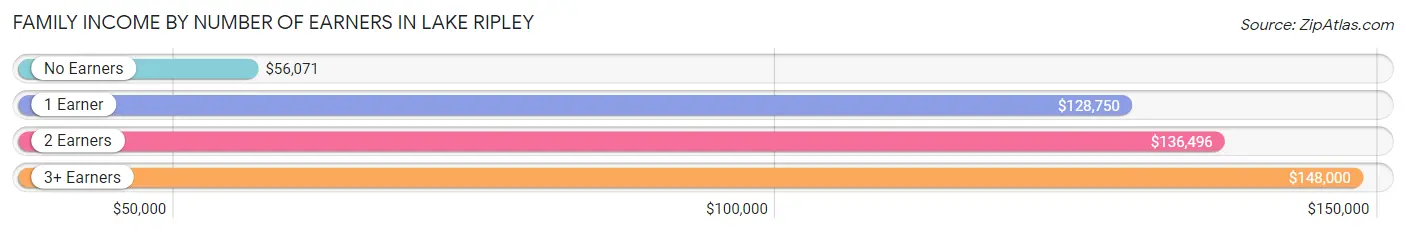
| Number of Earners | # Families | Median Income |
| No Earners | 96 (16.1%) | $56,071 |
| 1 Earner | 116 (19.5%) | $128,750 |
| 2 Earners | 311 (52.3%) | $136,496 |
| 3+ Earners | 72 (12.1%) | $148,000 |
| Total | 595 (100.0%) | $135,170 |
Household Income in Lake Ripley
Household Income Brackets in Lake Ripley
With 263 households falling in the category, the $100,000 to $149,999 income range is the most frequent in Lake Ripley, accounting for 33.0% of all households.
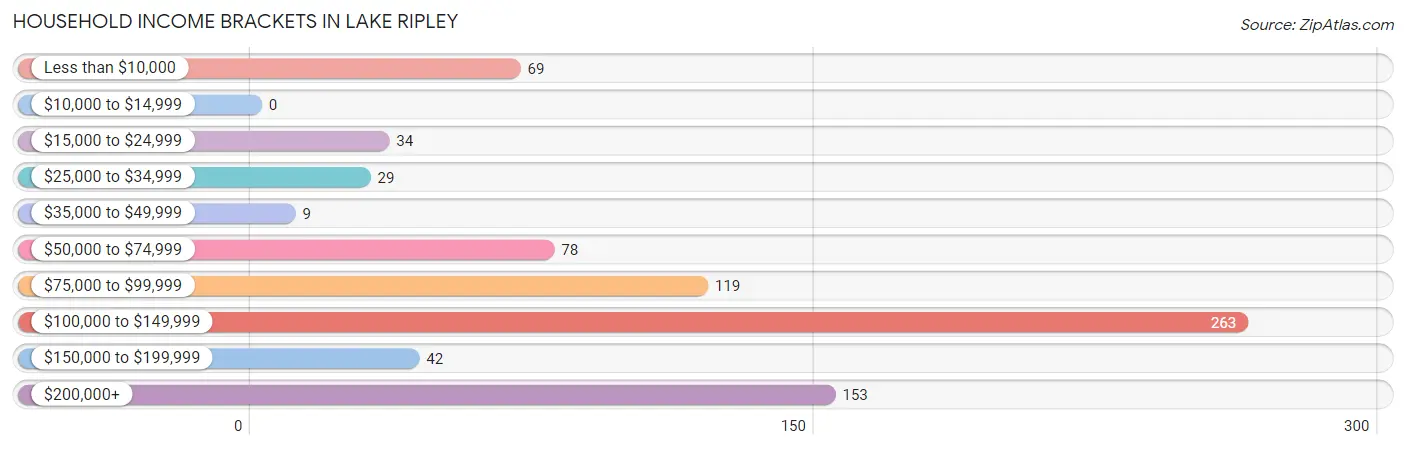
| Income Bracket | # Households | % Households |
| Less than $10,000 | 69 | 8.7% |
| $10,000 to $14,999 | 0 | 0.0% |
| $15,000 to $24,999 | 34 | 4.3% |
| $25,000 to $34,999 | 29 | 3.6% |
| $35,000 to $49,999 | 9 | 1.1% |
| $50,000 to $74,999 | 78 | 9.8% |
| $75,000 to $99,999 | 119 | 14.9% |
| $100,000 to $149,999 | 263 | 33.0% |
| $150,000 to $199,999 | 42 | 5.3% |
| $200,000+ | 153 | 19.2% |
Household Income by Householder Age in Lake Ripley
The median household income in Lake Ripley is $118,478, with the highest median household income of $148,875 found in the 25 to 44 years age bracket for the primary householder. A total of 105 households (13.2%) fall into this category.
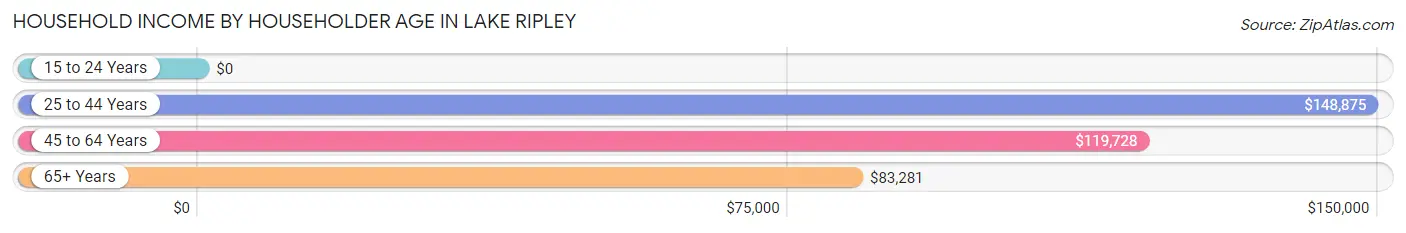
| Income Bracket | # Households | Median Income |
| 15 to 24 Years | 0 (0.0%) | $0 |
| 25 to 44 Years | 105 (13.2%) | $148,875 |
| 45 to 64 Years | 457 (57.4%) | $119,728 |
| 65+ Years | 234 (29.4%) | $83,281 |
| Total | 796 (100.0%) | $118,478 |
Poverty in Lake Ripley
Income Below Poverty by Sex and Age in Lake Ripley
With 9.9% poverty level for males and 8.5% for females among the residents of Lake Ripley, 12 to 14 year old males and under 5 year old females are the most vulnerable to poverty, with 23 males (43.4%) and 23 females (35.4%) in their respective age groups living below the poverty level.
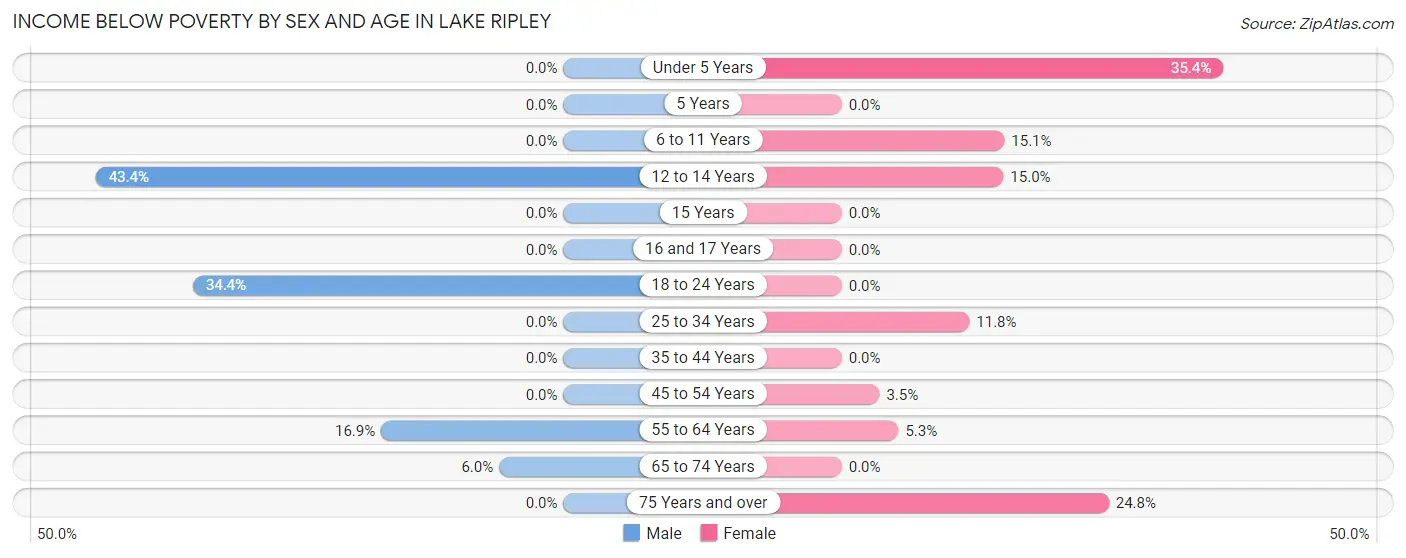
| Age Bracket | Male | Female |
| Under 5 Years | 0 (0.0%) | 23 (35.4%) |
| 5 Years | 0 (0.0%) | 0 (0.0%) |
| 6 to 11 Years | 0 (0.0%) | 8 (15.1%) |
| 12 to 14 Years | 23 (43.4%) | 6 (15.0%) |
| 15 Years | 0 (0.0%) | 0 (0.0%) |
| 16 and 17 Years | 0 (0.0%) | 0 (0.0%) |
| 18 to 24 Years | 22 (34.4%) | 0 (0.0%) |
| 25 to 34 Years | 0 (0.0%) | 9 (11.8%) |
| 35 to 44 Years | 0 (0.0%) | 0 (0.0%) |
| 45 to 54 Years | 0 (0.0%) | 7 (3.5%) |
| 55 to 64 Years | 33 (16.9%) | 14 (5.3%) |
| 65 to 74 Years | 8 (6.0%) | 0 (0.0%) |
| 75 Years and over | 0 (0.0%) | 28 (24.8%) |
| Total | 86 (9.9%) | 95 (8.5%) |
Income Above Poverty by Sex and Age in Lake Ripley
According to the poverty statistics in Lake Ripley, males aged under 5 years and females aged 16 and 17 years are the age groups that are most secure financially, with 100.0% of males and 100.0% of females in these age groups living above the poverty line.
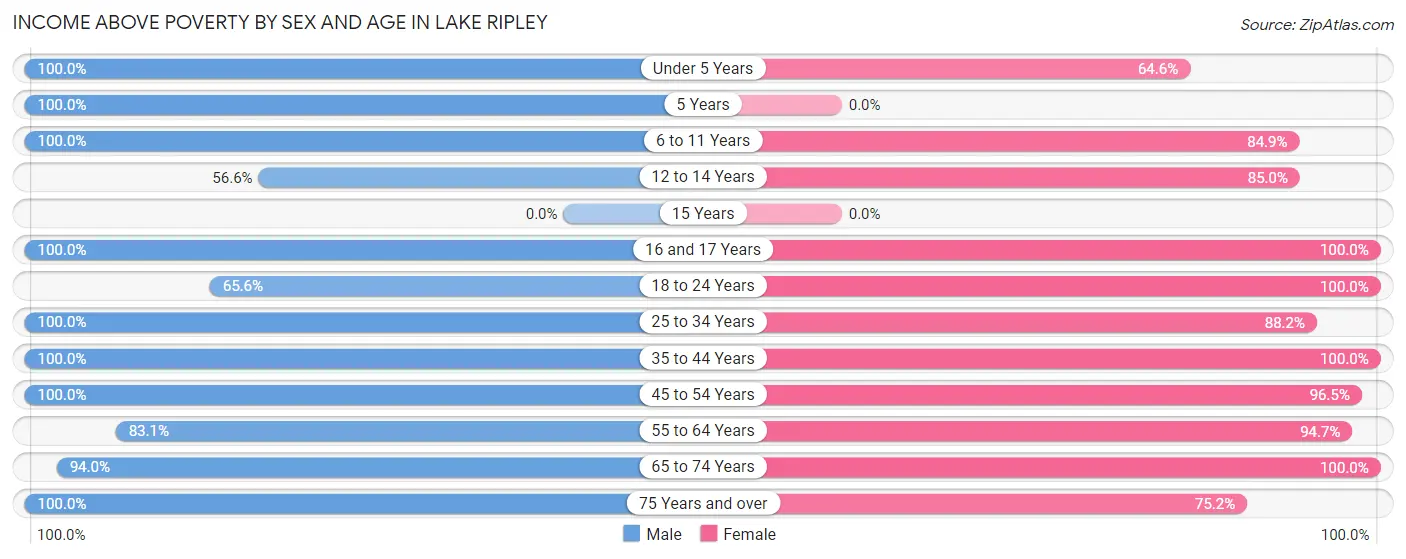
| Age Bracket | Male | Female |
| Under 5 Years | 35 (100.0%) | 42 (64.6%) |
| 5 Years | 10 (100.0%) | 0 (0.0%) |
| 6 to 11 Years | 54 (100.0%) | 45 (84.9%) |
| 12 to 14 Years | 30 (56.6%) | 34 (85.0%) |
| 15 Years | 0 (0.0%) | 0 (0.0%) |
| 16 and 17 Years | 21 (100.0%) | 32 (100.0%) |
| 18 to 24 Years | 42 (65.6%) | 60 (100.0%) |
| 25 to 34 Years | 41 (100.0%) | 67 (88.2%) |
| 35 to 44 Years | 57 (100.0%) | 105 (100.0%) |
| 45 to 54 Years | 183 (100.0%) | 193 (96.5%) |
| 55 to 64 Years | 162 (83.1%) | 252 (94.7%) |
| 65 to 74 Years | 126 (94.0%) | 102 (100.0%) |
| 75 Years and over | 23 (100.0%) | 85 (75.2%) |
| Total | 784 (90.1%) | 1,017 (91.5%) |
Income Below Poverty Among Married-Couple Families in Lake Ripley
The poverty statistics for married-couple families in Lake Ripley show that 6.4% or 33 of the total 519 families live below the poverty line. Families with 3 or 4 children have the highest poverty rate of 56.5%, comprising of 26 families. On the other hand, families with 1 or 2 children have the lowest poverty rate of 0.0%, which includes 0 families.
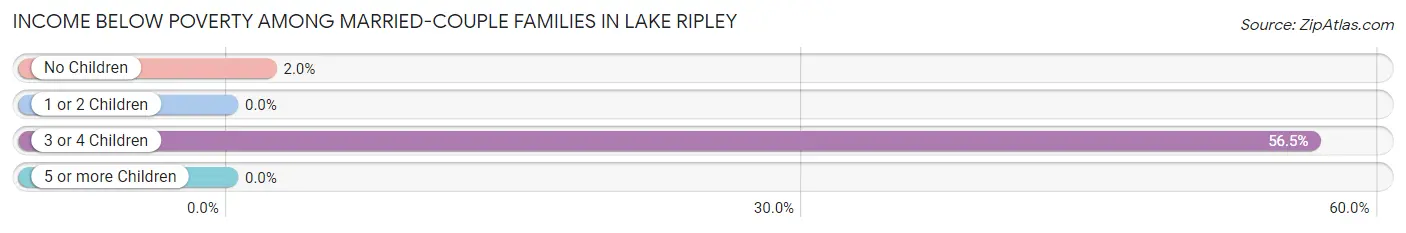
| Children | Above Poverty | Below Poverty |
| No Children | 342 (98.0%) | 7 (2.0%) |
| 1 or 2 Children | 124 (100.0%) | 0 (0.0%) |
| 3 or 4 Children | 20 (43.5%) | 26 (56.5%) |
| 5 or more Children | 0 (0.0%) | 0 (0.0%) |
| Total | 486 (93.6%) | 33 (6.4%) |
Income Below Poverty Among Single-Parent Households in Lake Ripley
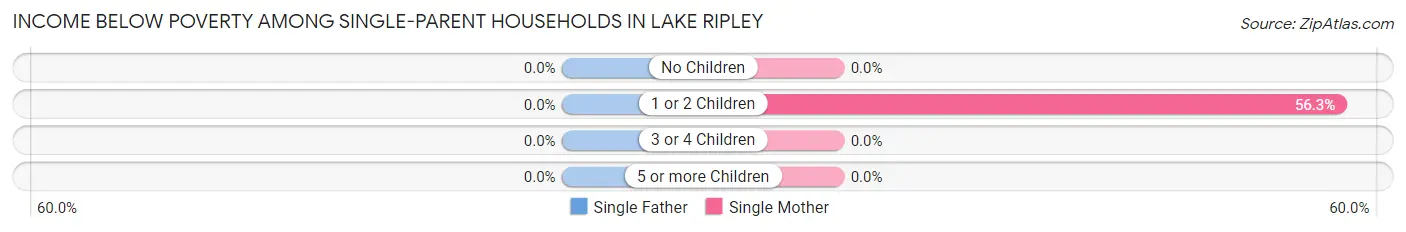
| Children | Single Father | Single Mother |
| No Children | 0 (0.0%) | 0 (0.0%) |
| 1 or 2 Children | 0 (0.0%) | 9 (56.2%) |
| 3 or 4 Children | 0 (0.0%) | 0 (0.0%) |
| 5 or more Children | 0 (0.0%) | 0 (0.0%) |
| Total | 0 (0.0%) | 9 (14.3%) |
Income Below Poverty Among Married-Couple vs Single-Parent Households in Lake Ripley
The poverty data for Lake Ripley shows that 33 of the married-couple family households (6.4%) and 9 of the single-parent households (11.8%) are living below the poverty level. Within the married-couple family households, those with 3 or 4 children have the highest poverty rate, with 26 households (56.5%) falling below the poverty line. Among the single-parent households, those with 1 or 2 children have the highest poverty rate, with 9 household (56.2%) living below poverty.
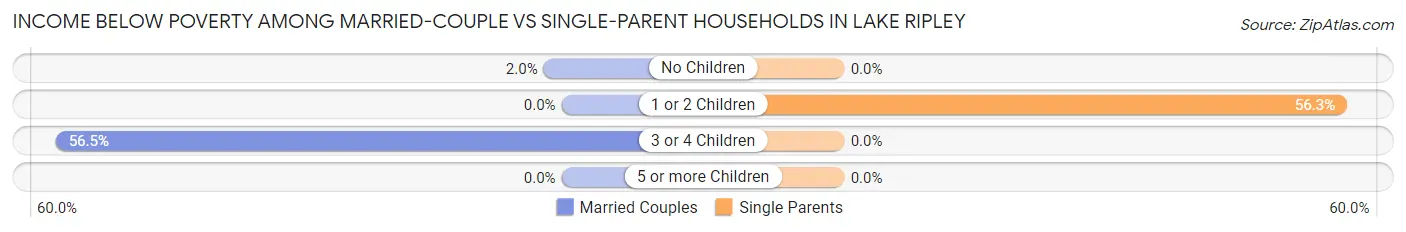
| Children | Married-Couple Families | Single-Parent Households |
| No Children | 7 (2.0%) | 0 (0.0%) |
| 1 or 2 Children | 0 (0.0%) | 9 (56.2%) |
| 3 or 4 Children | 26 (56.5%) | 0 (0.0%) |
| 5 or more Children | 0 (0.0%) | 0 (0.0%) |
| Total | 33 (6.4%) | 9 (11.8%) |
Race in Lake Ripley
The most populous races in Lake Ripley are White / Caucasian (1,865 | 94.1%), Two or more Races (67 | 3.4%), and Hispanic or Latino (50 | 2.5%).
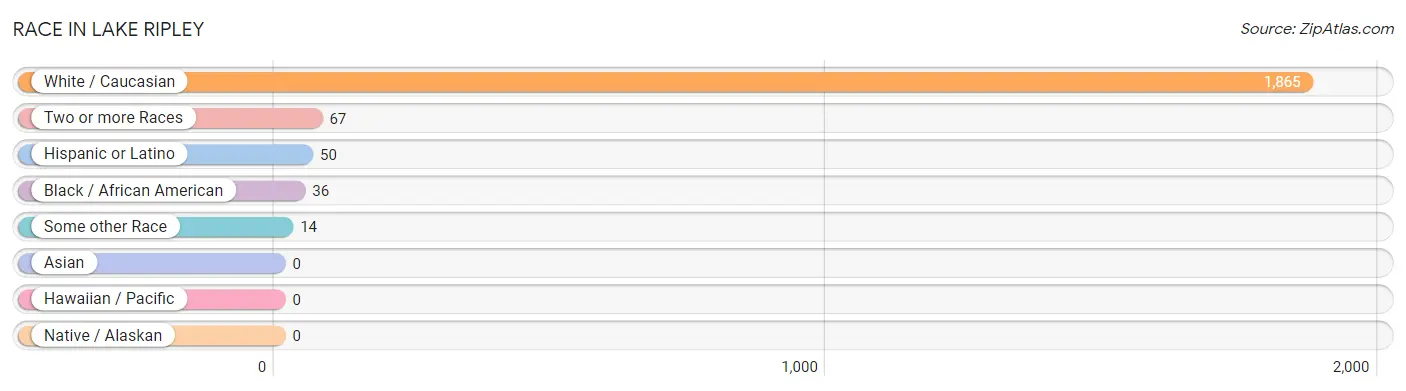
| Race | # Population | % Population |
| Asian | 0 | 0.0% |
| Black / African American | 36 | 1.8% |
| Hawaiian / Pacific | 0 | 0.0% |
| Hispanic or Latino | 50 | 2.5% |
| Native / Alaskan | 0 | 0.0% |
| White / Caucasian | 1,865 | 94.1% |
| Two or more Races | 67 | 3.4% |
| Some other Race | 14 | 0.7% |
| Total | 1,982 | 100.0% |
Ancestry in Lake Ripley
The most populous ancestries reported in Lake Ripley are German (773 | 39.0%), Irish (327 | 16.5%), Norwegian (220 | 11.1%), English (214 | 10.8%), and Swedish (126 | 6.4%), together accounting for 83.8% of all Lake Ripley residents.
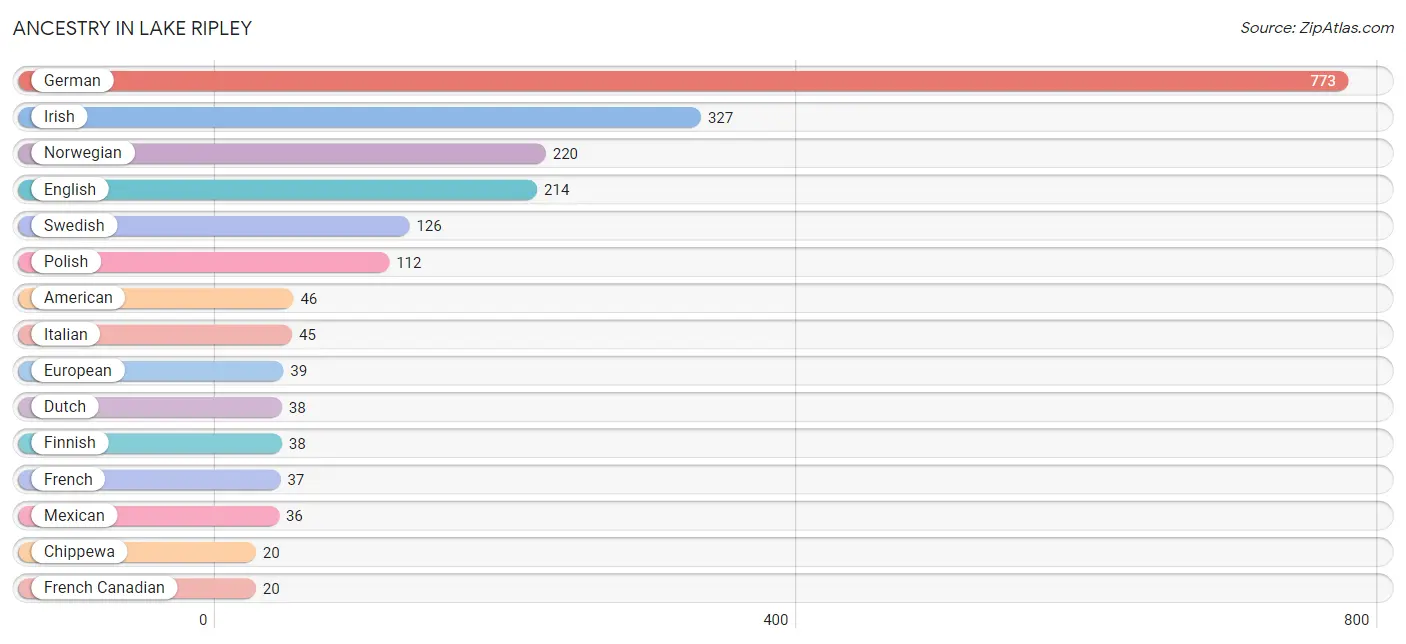
| Ancestry | # Population | % Population |
| American | 46 | 2.3% |
| Belgian | 4 | 0.2% |
| British | 11 | 0.5% |
| Chippewa | 20 | 1.0% |
| Colombian | 14 | 0.7% |
| Czech | 12 | 0.6% |
| Dutch | 38 | 1.9% |
| Eastern European | 5 | 0.3% |
| English | 214 | 10.8% |
| European | 39 | 2.0% |
| Finnish | 38 | 1.9% |
| French | 37 | 1.9% |
| French Canadian | 20 | 1.0% |
| German | 773 | 39.0% |
| Irish | 327 | 16.5% |
| Italian | 45 | 2.3% |
| Laotian | 20 | 1.0% |
| Lithuanian | 9 | 0.4% |
| Mexican | 36 | 1.8% |
| Norwegian | 220 | 11.1% |
| Polish | 112 | 5.7% |
| Scottish | 16 | 0.8% |
| Slovak | 11 | 0.5% |
| South American | 14 | 0.7% |
| Swedish | 126 | 6.4% |
| Swiss | 15 | 0.8% |
| Welsh | 11 | 0.5% | View All 27 Rows |
Immigrants in Lake Ripley
The most numerous immigrant groups reported in Lake Ripley came from Colombia (14 | 0.7%), Latin America (14 | 0.7%), and South America (14 | 0.7%), together accounting for 2.1% of all Lake Ripley residents.
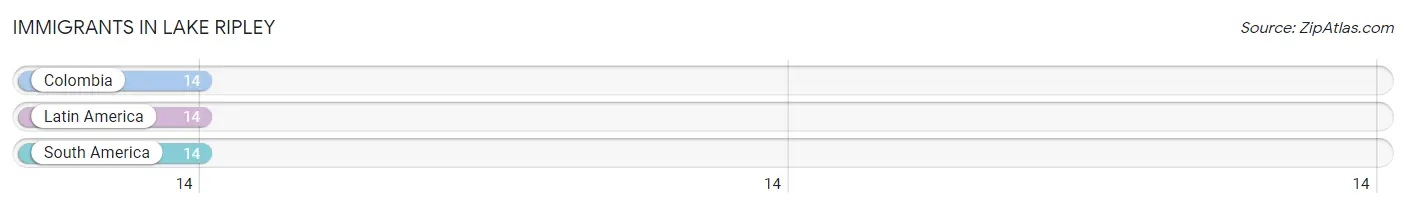
| Immigration Origin | # Population | % Population |
| Colombia | 14 | 0.7% |
| Latin America | 14 | 0.7% |
| South America | 14 | 0.7% | View All 3 Rows |
Sex and Age in Lake Ripley
Sex and Age in Lake Ripley
The most populous age groups in Lake Ripley are 60 to 64 Years (132 | 15.2%) for men and 55 to 59 Years (184 | 16.6%) for women.
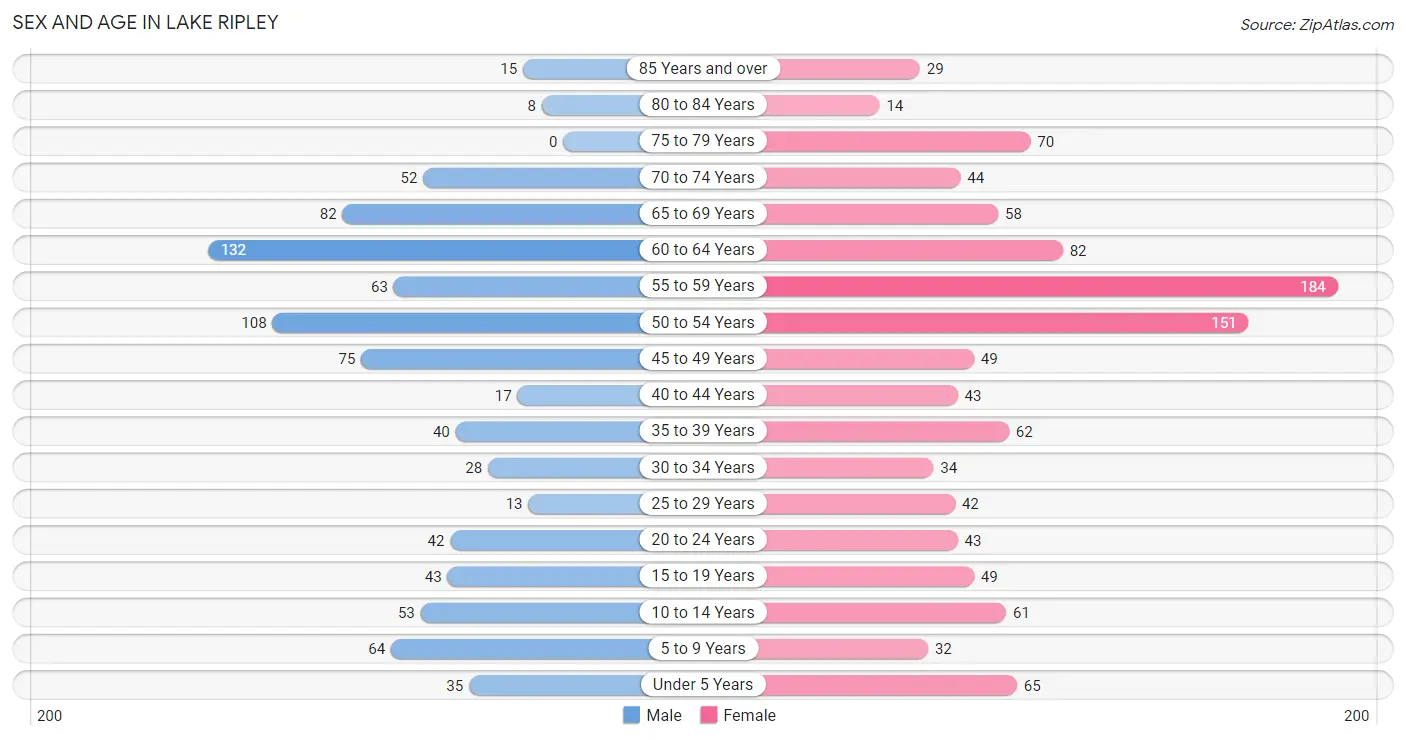
| Age Bracket | Male | Female |
| Under 5 Years | 35 (4.0%) | 65 (5.9%) |
| 5 to 9 Years | 64 (7.4%) | 32 (2.9%) |
| 10 to 14 Years | 53 (6.1%) | 61 (5.5%) |
| 15 to 19 Years | 43 (4.9%) | 49 (4.4%) |
| 20 to 24 Years | 42 (4.8%) | 43 (3.9%) |
| 25 to 29 Years | 13 (1.5%) | 42 (3.8%) |
| 30 to 34 Years | 28 (3.2%) | 34 (3.1%) |
| 35 to 39 Years | 40 (4.6%) | 62 (5.6%) |
| 40 to 44 Years | 17 (1.9%) | 43 (3.9%) |
| 45 to 49 Years | 75 (8.6%) | 49 (4.4%) |
| 50 to 54 Years | 108 (12.4%) | 151 (13.6%) |
| 55 to 59 Years | 63 (7.2%) | 184 (16.6%) |
| 60 to 64 Years | 132 (15.2%) | 82 (7.4%) |
| 65 to 69 Years | 82 (9.4%) | 58 (5.2%) |
| 70 to 74 Years | 52 (6.0%) | 44 (4.0%) |
| 75 to 79 Years | 0 (0.0%) | 70 (6.3%) |
| 80 to 84 Years | 8 (0.9%) | 14 (1.3%) |
| 85 Years and over | 15 (1.7%) | 29 (2.6%) |
| Total | 870 (100.0%) | 1,112 (100.0%) |
Families and Households in Lake Ripley
Median Family Size in Lake Ripley
The median family size in Lake Ripley is 2.91 persons per family, with single male/father families (13 | 2.2%) accounting for the largest median family size of 3.85 persons per family. On the other hand, married-couple families (519 | 87.2%) represent the smallest median family size with 2.83 persons per family.
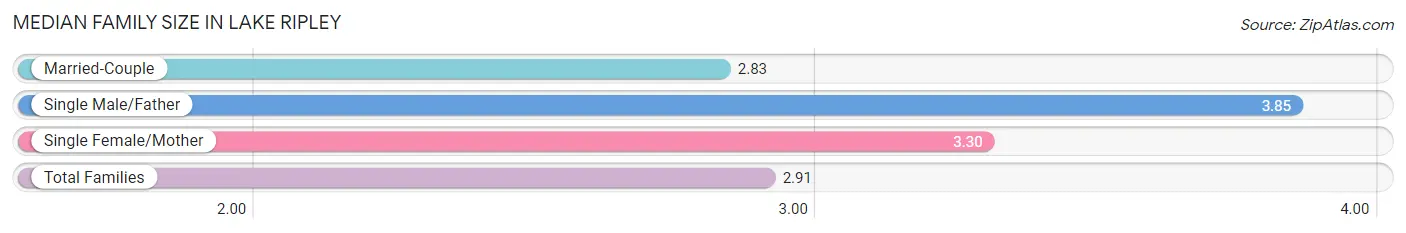
| Family Type | # Families | Family Size |
| Married-Couple | 519 (87.2%) | 2.83 |
| Single Male/Father | 13 (2.2%) | 3.85 |
| Single Female/Mother | 63 (10.6%) | 3.30 |
| Total Families | 595 (100.0%) | 2.91 |
Median Household Size in Lake Ripley
The median household size in Lake Ripley is 2.49 persons per household, with single male/father households (13 | 1.6%) accounting for the largest median household size of 4.77 persons per household. non-family households (201 | 25.3%) represent the smallest median household size with 1.02 persons per household.
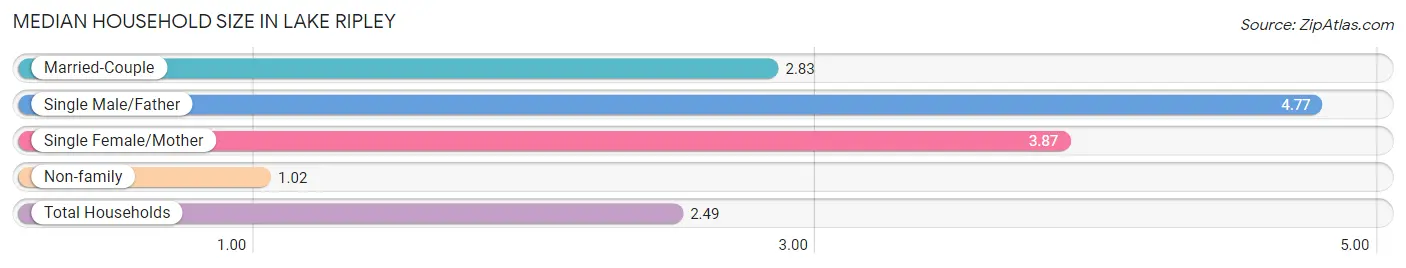
| Household Type | # Households | Household Size |
| Married-Couple | 519 (65.2%) | 2.83 |
| Single Male/Father | 13 (1.6%) | 4.77 |
| Single Female/Mother | 63 (7.9%) | 3.87 |
| Non-family | 201 (25.3%) | 1.02 |
| Total Households | 796 (100.0%) | 2.49 |
Household Size by Marriage Status in Lake Ripley
Out of a total of 796 households in Lake Ripley, 595 (74.8%) are family households, while 201 (25.3%) are nonfamily households. The most numerous type of family households are 2-person households, comprising 306, and the most common type of nonfamily households are 1-person households, comprising 198.
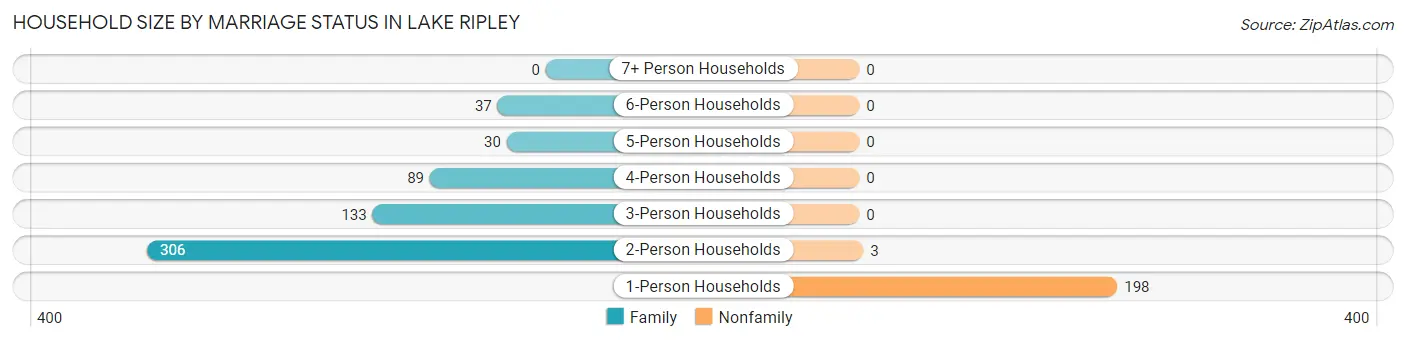
| Household Size | Family Households | Nonfamily Households |
| 1-Person Households | - | 198 (24.9%) |
| 2-Person Households | 306 (38.4%) | 3 (0.4%) |
| 3-Person Households | 133 (16.7%) | 0 (0.0%) |
| 4-Person Households | 89 (11.2%) | 0 (0.0%) |
| 5-Person Households | 30 (3.8%) | 0 (0.0%) |
| 6-Person Households | 37 (4.6%) | 0 (0.0%) |
| 7+ Person Households | 0 (0.0%) | 0 (0.0%) |
| Total | 595 (74.8%) | 201 (25.3%) |
Female Fertility in Lake Ripley
Fertility by Age in Lake Ripley
Average fertility rate in Lake Ripley is 105.0 births per 1,000 women. Women in the age bracket of 20 to 34 years have the highest fertility rate with 126.0 births per 1,000 women. Women in the age bracket of 35 to 50 years acount for 57.1% of all women with births.
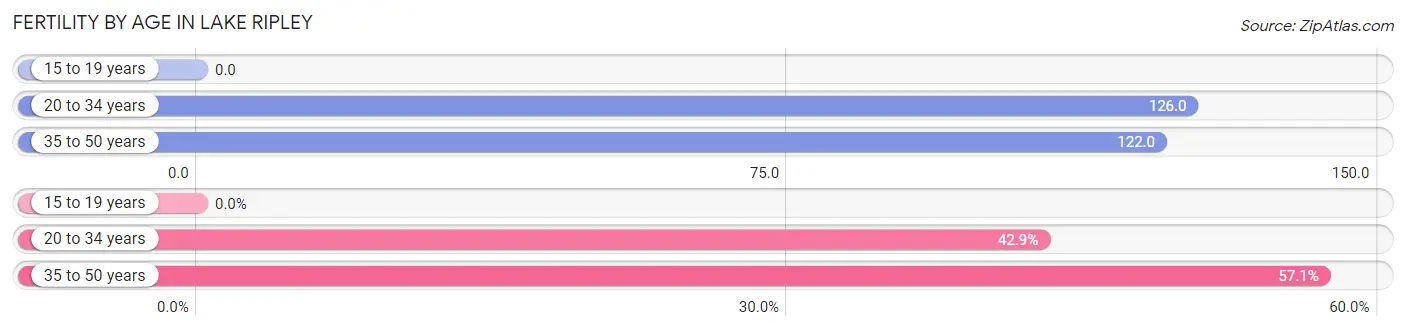
| Age Bracket | Women with Births | Births / 1,000 Women |
| 15 to 19 years | 0 (0.0%) | 0.0 |
| 20 to 34 years | 15 (42.9%) | 126.0 |
| 35 to 50 years | 20 (57.1%) | 122.0 |
| Total | 35 (100.0%) | 105.0 |
Fertility by Age by Marriage Status in Lake Ripley
65.7% of women with births (35) in Lake Ripley are married. The highest percentage of unmarried women with births falls into 20 to 34 years age bracket with 80.0% of them unmarried at the time of birth, while the lowest percentage of unmarried women with births belong to 35 to 50 years age bracket with 0.0% of them unmarried.
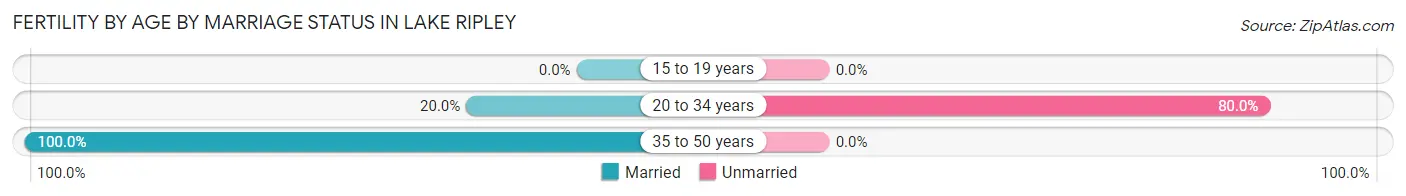
| Age Bracket | Married | Unmarried |
| 15 to 19 years | 0 (0.0%) | 0 (0.0%) |
| 20 to 34 years | 3 (20.0%) | 12 (80.0%) |
| 35 to 50 years | 20 (100.0%) | 0 (0.0%) |
| Total | 23 (65.7%) | 12 (34.3%) |
Fertility by Education in Lake Ripley
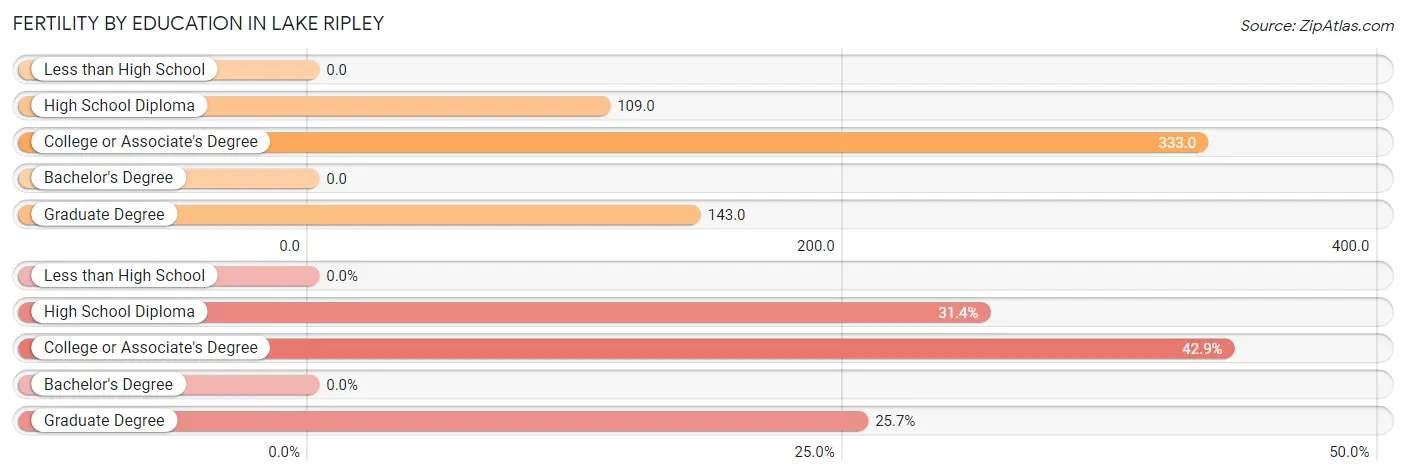
| Educational Attainment | Women with Births | Births / 1,000 Women |
| Less than High School | 0 (0.0%) | 0.0 |
| High School Diploma | 11 (31.4%) | 109.0 |
| College or Associate's Degree | 15 (42.9%) | 333.0 |
| Bachelor's Degree | 0 (0.0%) | 0.0 |
| Graduate Degree | 9 (25.7%) | 143.0 |
| Total | 35 (100.0%) | 105.0 |
Fertility by Education by Marriage Status in Lake Ripley
34.3% of women with births in Lake Ripley are unmarried. Women with the educational attainment of high school diploma are most likely to be married with 100.0% of them married at childbirth, while women with the educational attainment of college or associate's degree are least likely to be married with 80.0% of them unmarried at childbirth.
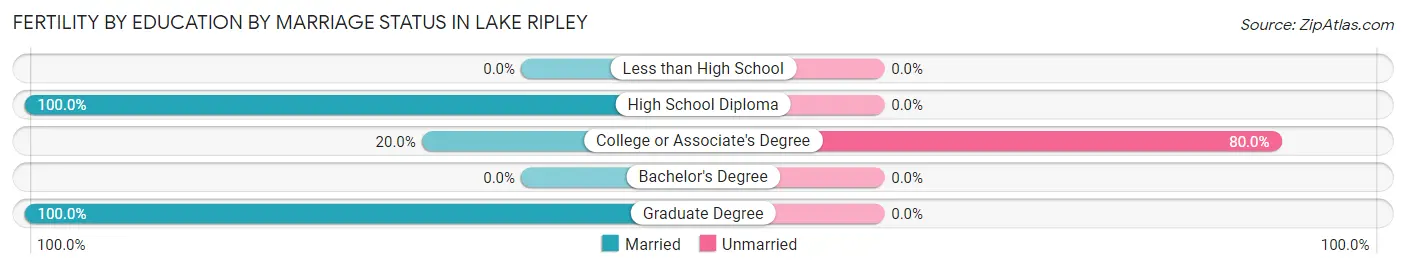
| Educational Attainment | Married | Unmarried |
| Less than High School | 0 (0.0%) | 0 (0.0%) |
| High School Diploma | 11 (100.0%) | 0 (0.0%) |
| College or Associate's Degree | 3 (20.0%) | 12 (80.0%) |
| Bachelor's Degree | 0 (0.0%) | 0 (0.0%) |
| Graduate Degree | 9 (100.0%) | 0 (0.0%) |
| Total | 23 (65.7%) | 12 (34.3%) |
Employment Characteristics in Lake Ripley
Employment by Class of Employer in Lake Ripley
Among the 1,045 employed individuals in Lake Ripley, private company employees (583 | 55.8%), local government employees (145 | 13.9%), and self-employed (not incorporated) (144 | 13.8%) make up the most common classes of employment.
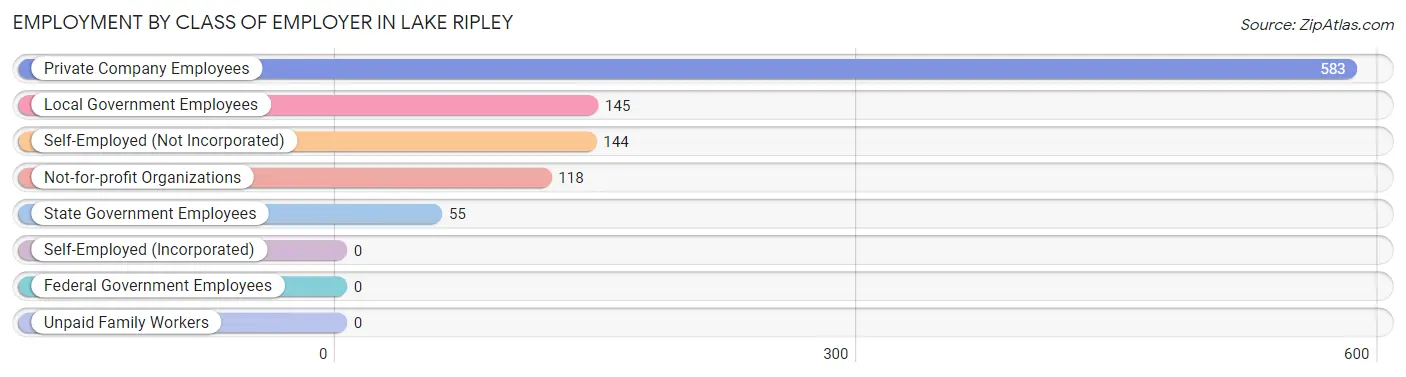
| Employer Class | # Employees | % Employees |
| Private Company Employees | 583 | 55.8% |
| Self-Employed (Incorporated) | 0 | 0.0% |
| Self-Employed (Not Incorporated) | 144 | 13.8% |
| Not-for-profit Organizations | 118 | 11.3% |
| Local Government Employees | 145 | 13.9% |
| State Government Employees | 55 | 5.3% |
| Federal Government Employees | 0 | 0.0% |
| Unpaid Family Workers | 0 | 0.0% |
| Total | 1,045 | 100.0% |
Employment Status by Age in Lake Ripley
According to the labor force statistics for Lake Ripley, out of the total population over 16 years of age (1,672), 68.5% or 1,145 individuals are in the labor force, with 7.2% or 82 of them unemployed. The age group with the highest labor force participation rate is 35 to 44 years, with 100.0% or 162 individuals in the labor force. Within the labor force, the 25 to 29 years age range has the highest percentage of unemployed individuals, with 100.0% or 33 of them being unemployed.
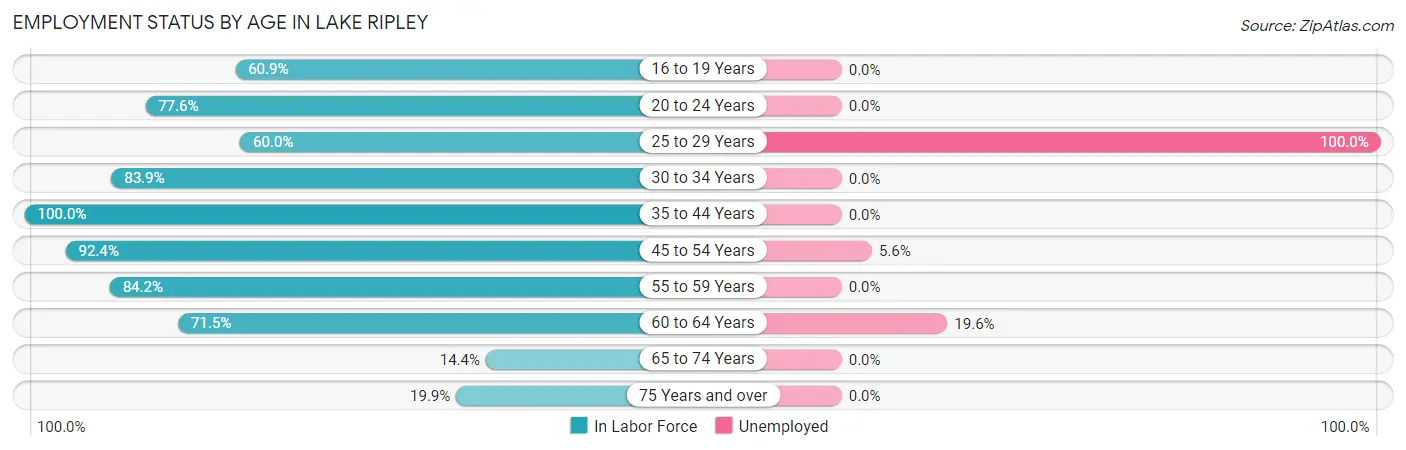
| Age Bracket | In Labor Force | Unemployed |
| 16 to 19 Years | 56 (60.9%) | 0 (0.0%) |
| 20 to 24 Years | 66 (77.6%) | 0 (0.0%) |
| 25 to 29 Years | 33 (60.0%) | 33 (100.0%) |
| 30 to 34 Years | 52 (83.9%) | 0 (0.0%) |
| 35 to 44 Years | 162 (100.0%) | 0 (0.0%) |
| 45 to 54 Years | 354 (92.4%) | 20 (5.6%) |
| 55 to 59 Years | 208 (84.2%) | 0 (0.0%) |
| 60 to 64 Years | 153 (71.5%) | 30 (19.6%) |
| 65 to 74 Years | 34 (14.4%) | 0 (0.0%) |
| 75 Years and over | 27 (19.9%) | 0 (0.0%) |
| Total | 1,145 (68.5%) | 82 (7.2%) |
Employment Status by Educational Attainment in Lake Ripley
According to labor force statistics for Lake Ripley, 85.7% of individuals (962) out of the total population between 25 and 64 years of age (1,123) are in the labor force, with 8.6% or 83 of them being unemployed. The group with the highest labor force participation rate are those with the educational attainment of less than high school, with 100.0% or 8 individuals in the labor force. Within the labor force, individuals with high school diploma education have the highest percentage of unemployment, with 18.4% or 33 of them being unemployed.
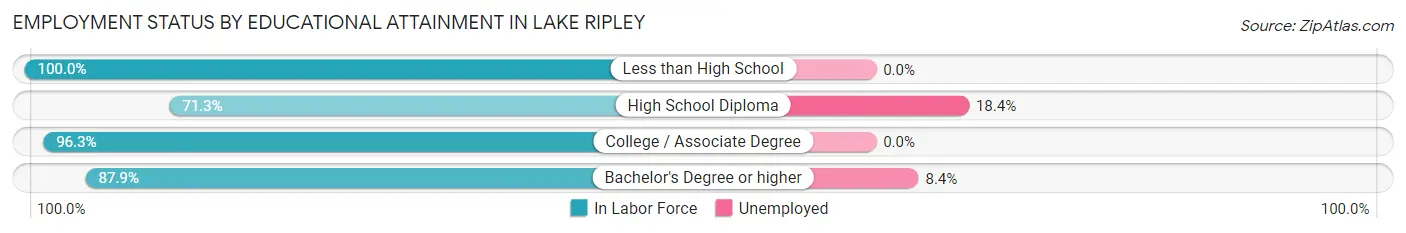
| Educational Attainment | In Labor Force | Unemployed |
| Less than High School | 8 (100.0%) | 0 (0.0%) |
| High School Diploma | 179 (71.3%) | 46 (18.4%) |
| College / Associate Degree | 181 (96.3%) | 0 (0.0%) |
| Bachelor's Degree or higher | 594 (87.9%) | 57 (8.4%) |
| Total | 962 (85.7%) | 97 (8.6%) |
Employment Occupations by Sex in Lake Ripley
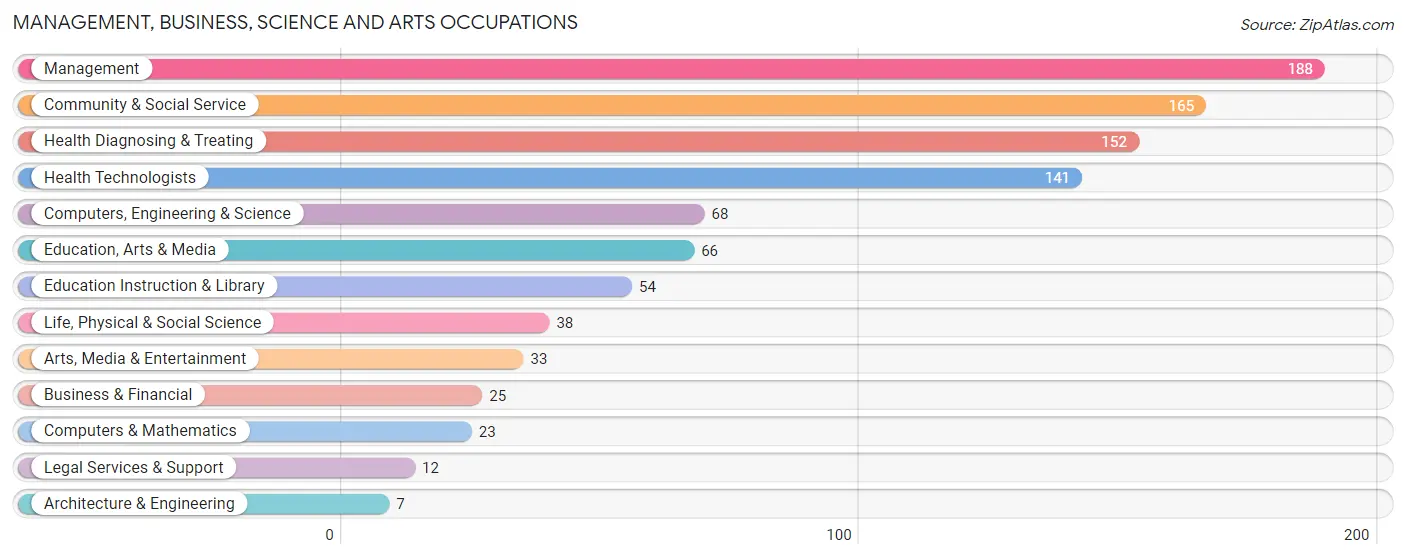
Management, Business, Science and Arts Occupations
The most common Management, Business, Science and Arts occupations in Lake Ripley are Management (188 | 17.7%), Community & Social Service (165 | 15.5%), Health Diagnosing & Treating (152 | 14.3%), Health Technologists (141 | 13.3%), and Computers, Engineering & Science (68 | 6.4%).
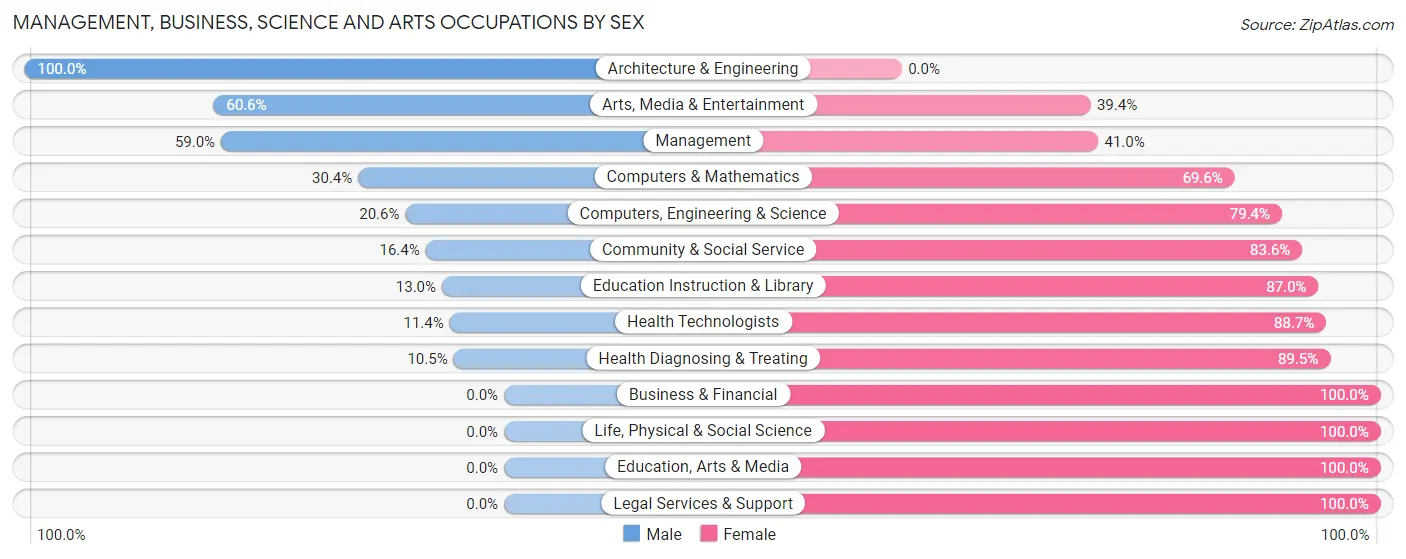
Management, Business, Science and Arts Occupations by Sex
Within the Management, Business, Science and Arts occupations in Lake Ripley, the most male-oriented occupations are Architecture & Engineering (100.0%), Arts, Media & Entertainment (60.6%), and Management (59.0%), while the most female-oriented occupations are Business & Financial (100.0%), Life, Physical & Social Science (100.0%), and Education, Arts & Media (100.0%).
| Occupation | Male | Female |
| Management | 111 (59.0%) | 77 (41.0%) |
| Business & Financial | 0 (0.0%) | 25 (100.0%) |
| Computers, Engineering & Science | 14 (20.6%) | 54 (79.4%) |
| Computers & Mathematics | 7 (30.4%) | 16 (69.6%) |
| Architecture & Engineering | 7 (100.0%) | 0 (0.0%) |
| Life, Physical & Social Science | 0 (0.0%) | 38 (100.0%) |
| Community & Social Service | 27 (16.4%) | 138 (83.6%) |
| Education, Arts & Media | 0 (0.0%) | 66 (100.0%) |
| Legal Services & Support | 0 (0.0%) | 12 (100.0%) |
| Education Instruction & Library | 7 (13.0%) | 47 (87.0%) |
| Arts, Media & Entertainment | 20 (60.6%) | 13 (39.4%) |
| Health Diagnosing & Treating | 16 (10.5%) | 136 (89.5%) |
| Health Technologists | 16 (11.4%) | 125 (88.6%) |
| Total (Category) | 168 (28.1%) | 430 (71.9%) |
| Total (Overall) | 443 (41.7%) | 619 (58.3%) |
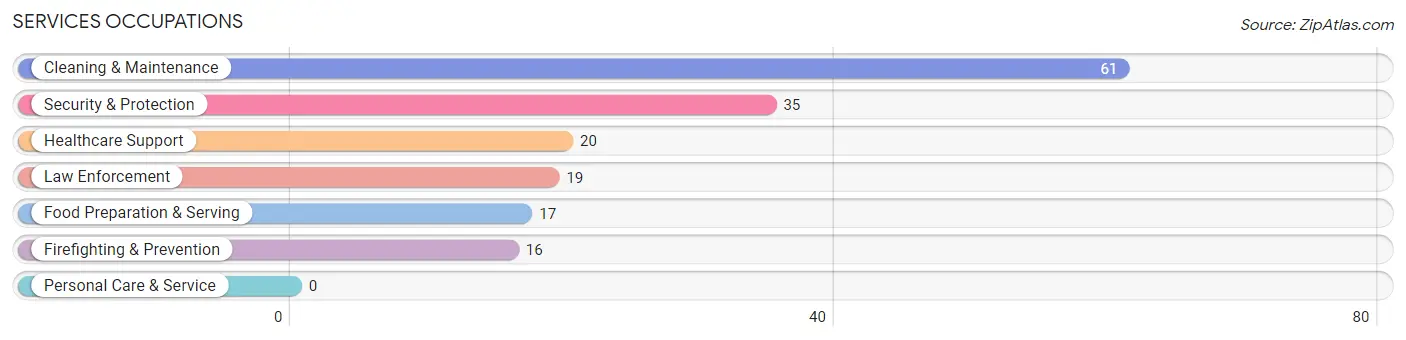
Services Occupations
The most common Services occupations in Lake Ripley are Cleaning & Maintenance (61 | 5.7%), Security & Protection (35 | 3.3%), Healthcare Support (20 | 1.9%), Law Enforcement (19 | 1.8%), and Food Preparation & Serving (17 | 1.6%).
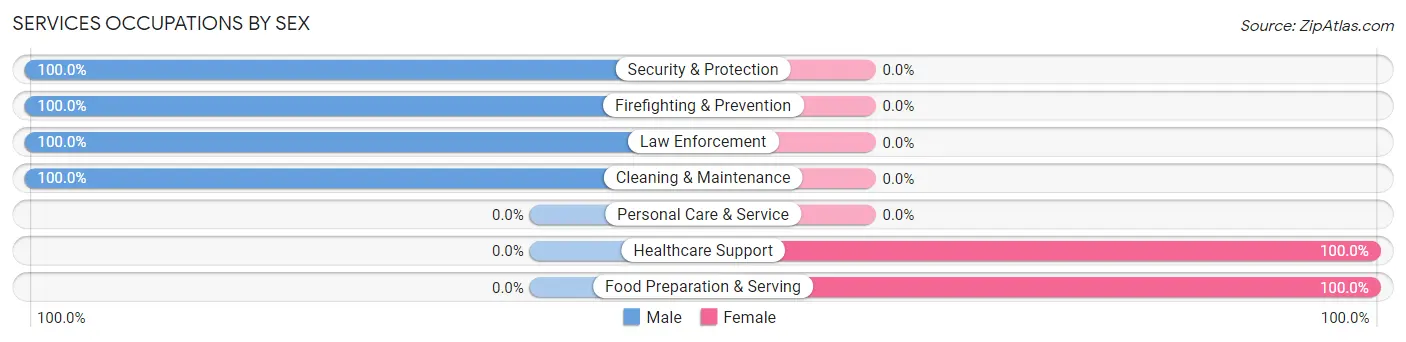
Services Occupations by Sex
Within the Services occupations in Lake Ripley, the most male-oriented occupations are Security & Protection (100.0%), Firefighting & Prevention (100.0%), and Law Enforcement (100.0%), while the most female-oriented occupations are Healthcare Support (100.0%), and Food Preparation & Serving (100.0%).
| Occupation | Male | Female |
| Healthcare Support | 0 (0.0%) | 20 (100.0%) |
| Security & Protection | 35 (100.0%) | 0 (0.0%) |
| Firefighting & Prevention | 16 (100.0%) | 0 (0.0%) |
| Law Enforcement | 19 (100.0%) | 0 (0.0%) |
| Food Preparation & Serving | 0 (0.0%) | 17 (100.0%) |
| Cleaning & Maintenance | 61 (100.0%) | 0 (0.0%) |
| Personal Care & Service | 0 (0.0%) | 0 (0.0%) |
| Total (Category) | 96 (72.2%) | 37 (27.8%) |
| Total (Overall) | 443 (41.7%) | 619 (58.3%) |
Sales and Office Occupations
The most common Sales and Office occupations in Lake Ripley are Sales & Related (121 | 11.4%), and Office & Administration (44 | 4.1%).
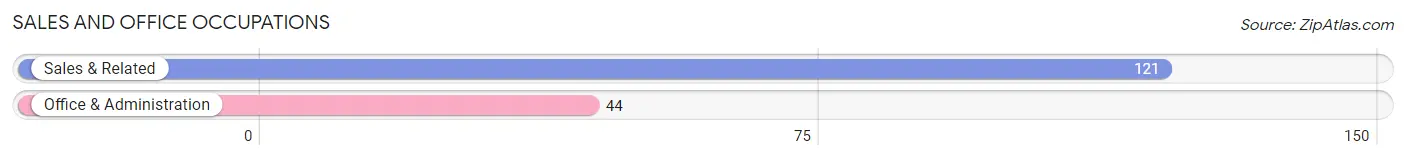
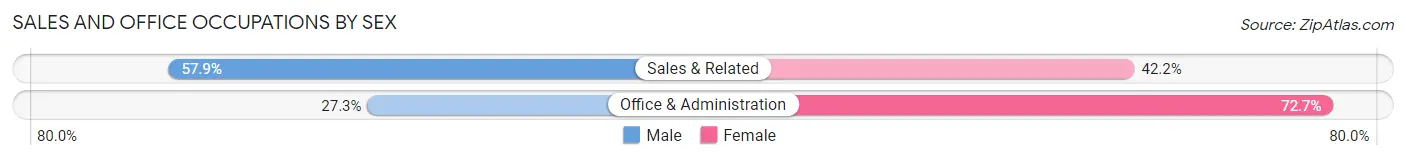
Sales and Office Occupations by Sex
| Occupation | Male | Female |
| Sales & Related | 70 (57.9%) | 51 (42.1%) |
| Office & Administration | 12 (27.3%) | 32 (72.7%) |
| Total (Category) | 82 (49.7%) | 83 (50.3%) |
| Total (Overall) | 443 (41.7%) | 619 (58.3%) |
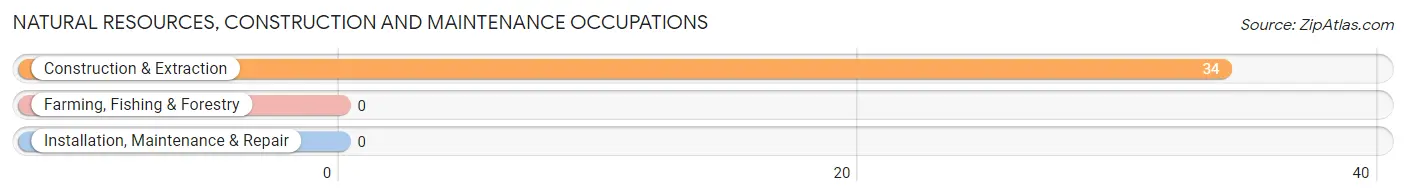
Natural Resources, Construction and Maintenance Occupations
The most common Natural Resources, Construction and Maintenance occupations in Lake Ripley are , and Construction & Extraction (34 | 3.2%).
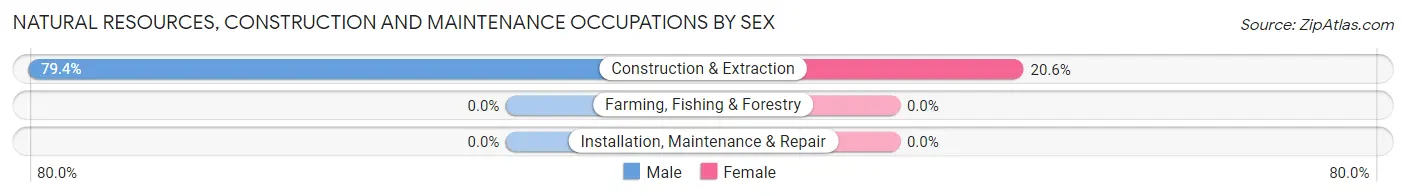
Natural Resources, Construction and Maintenance Occupations by Sex
| Occupation | Male | Female |
| Farming, Fishing & Forestry | 0 (0.0%) | 0 (0.0%) |
| Construction & Extraction | 27 (79.4%) | 7 (20.6%) |
| Installation, Maintenance & Repair | 0 (0.0%) | 0 (0.0%) |
| Total (Category) | 27 (79.4%) | 7 (20.6%) |
| Total (Overall) | 443 (41.7%) | 619 (58.3%) |
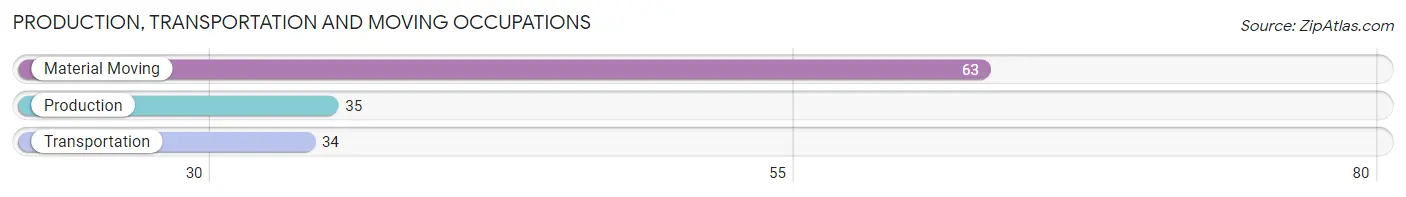
Production, Transportation and Moving Occupations
The most common Production, Transportation and Moving occupations in Lake Ripley are Material Moving (63 | 5.9%), Production (35 | 3.3%), and Transportation (34 | 3.2%).
Production, Transportation and Moving Occupations by Sex
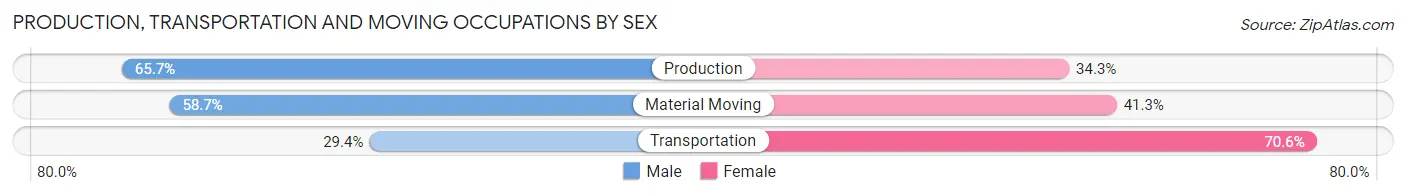
| Occupation | Male | Female |
| Production | 23 (65.7%) | 12 (34.3%) |
| Transportation | 10 (29.4%) | 24 (70.6%) |
| Material Moving | 37 (58.7%) | 26 (41.3%) |
| Total (Category) | 70 (53.0%) | 62 (47.0%) |
| Total (Overall) | 443 (41.7%) | 619 (58.3%) |
Employment Industries by Sex in Lake Ripley
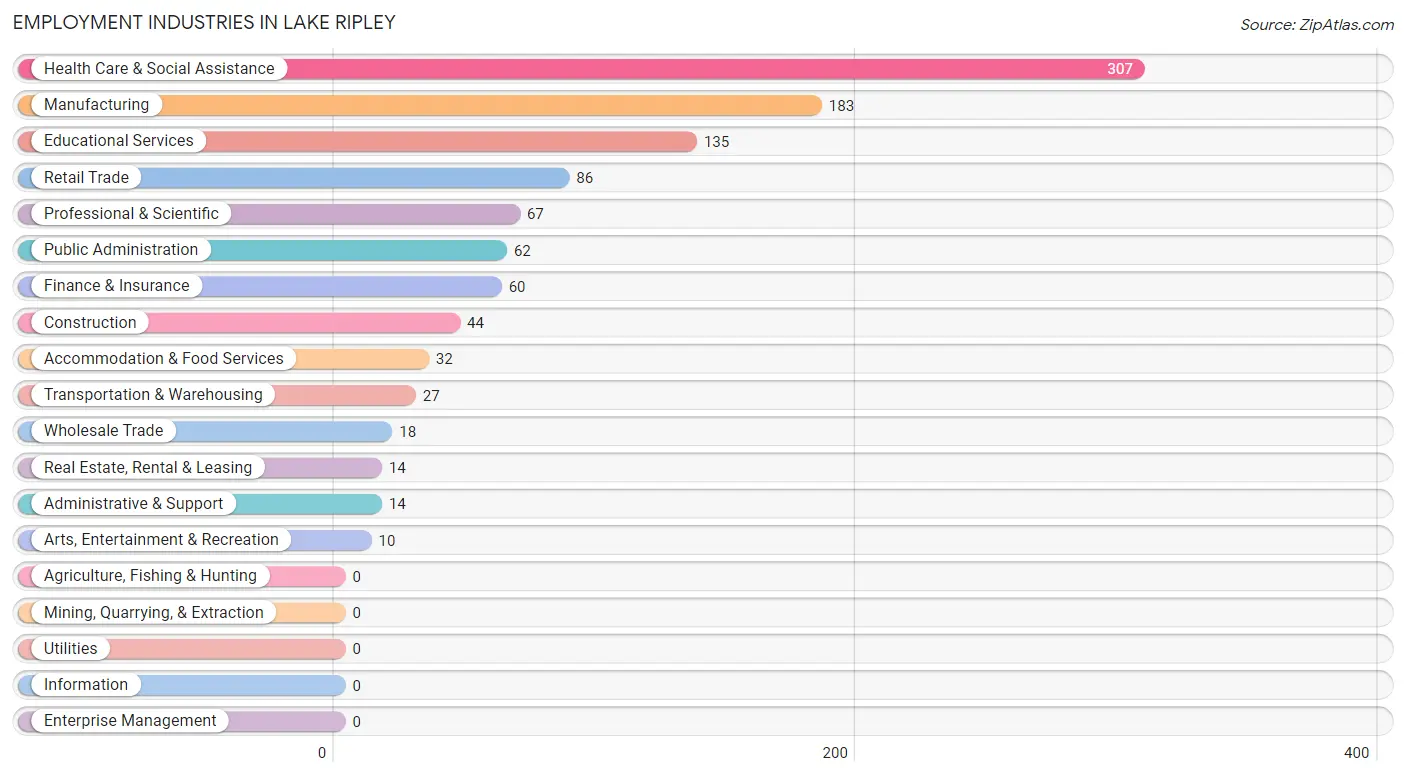
Employment Industries in Lake Ripley
The major employment industries in Lake Ripley include Health Care & Social Assistance (307 | 28.9%), Manufacturing (183 | 17.2%), Educational Services (135 | 12.7%), Retail Trade (86 | 8.1%), and Professional & Scientific (67 | 6.3%).
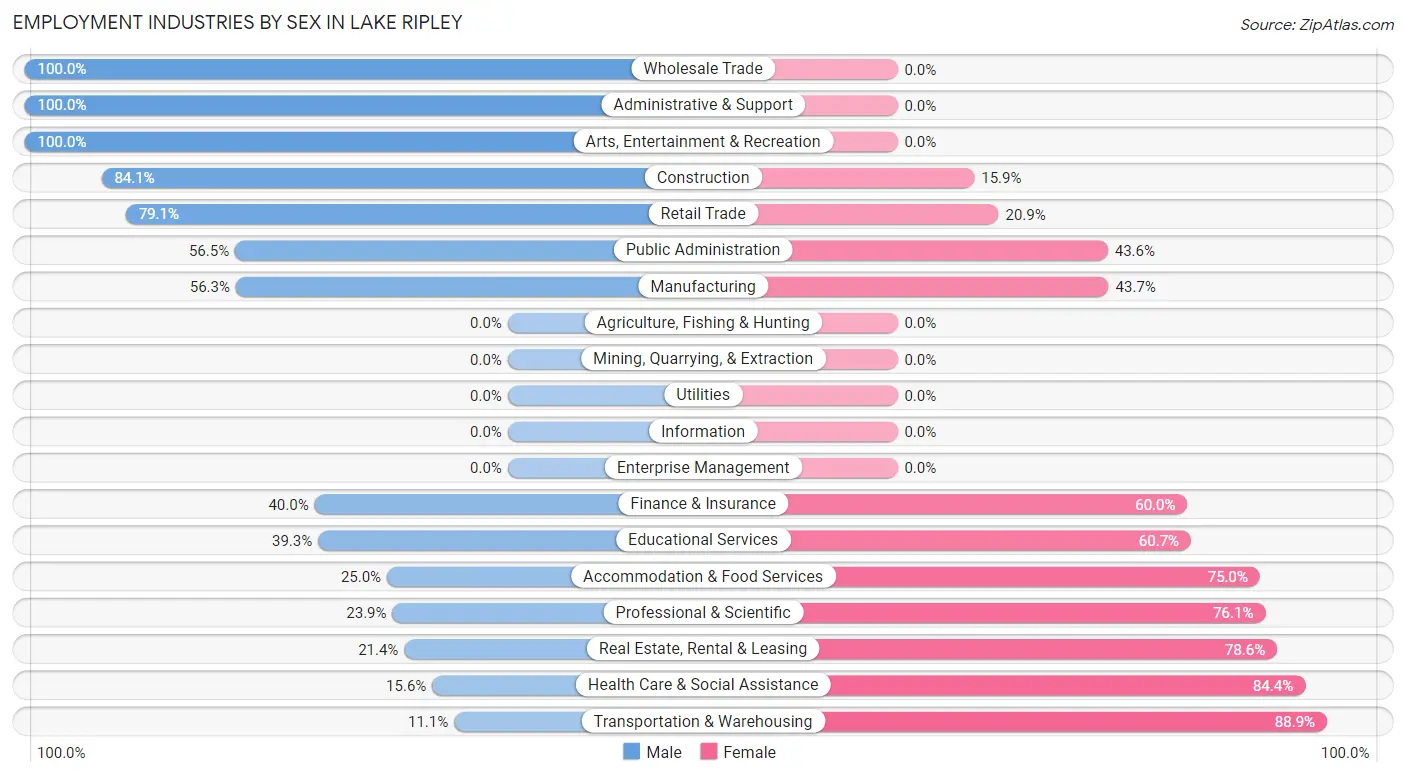
Employment Industries by Sex in Lake Ripley
The Lake Ripley industries that see more men than women are Wholesale Trade (100.0%), Administrative & Support (100.0%), and Arts, Entertainment & Recreation (100.0%), whereas the industries that tend to have a higher number of women are Transportation & Warehousing (88.9%), Health Care & Social Assistance (84.4%), and Real Estate, Rental & Leasing (78.6%).
| Industry | Male | Female |
| Agriculture, Fishing & Hunting | 0 (0.0%) | 0 (0.0%) |
| Mining, Quarrying, & Extraction | 0 (0.0%) | 0 (0.0%) |
| Construction | 37 (84.1%) | 7 (15.9%) |
| Manufacturing | 103 (56.3%) | 80 (43.7%) |
| Wholesale Trade | 18 (100.0%) | 0 (0.0%) |
| Retail Trade | 68 (79.1%) | 18 (20.9%) |
| Transportation & Warehousing | 3 (11.1%) | 24 (88.9%) |
| Utilities | 0 (0.0%) | 0 (0.0%) |
| Information | 0 (0.0%) | 0 (0.0%) |
| Finance & Insurance | 24 (40.0%) | 36 (60.0%) |
| Real Estate, Rental & Leasing | 3 (21.4%) | 11 (78.6%) |
| Professional & Scientific | 16 (23.9%) | 51 (76.1%) |
| Enterprise Management | 0 (0.0%) | 0 (0.0%) |
| Administrative & Support | 14 (100.0%) | 0 (0.0%) |
| Educational Services | 53 (39.3%) | 82 (60.7%) |
| Health Care & Social Assistance | 48 (15.6%) | 259 (84.4%) |
| Arts, Entertainment & Recreation | 10 (100.0%) | 0 (0.0%) |
| Accommodation & Food Services | 8 (25.0%) | 24 (75.0%) |
| Public Administration | 35 (56.5%) | 27 (43.5%) |
| Total | 443 (41.7%) | 619 (58.3%) |
Education in Lake Ripley
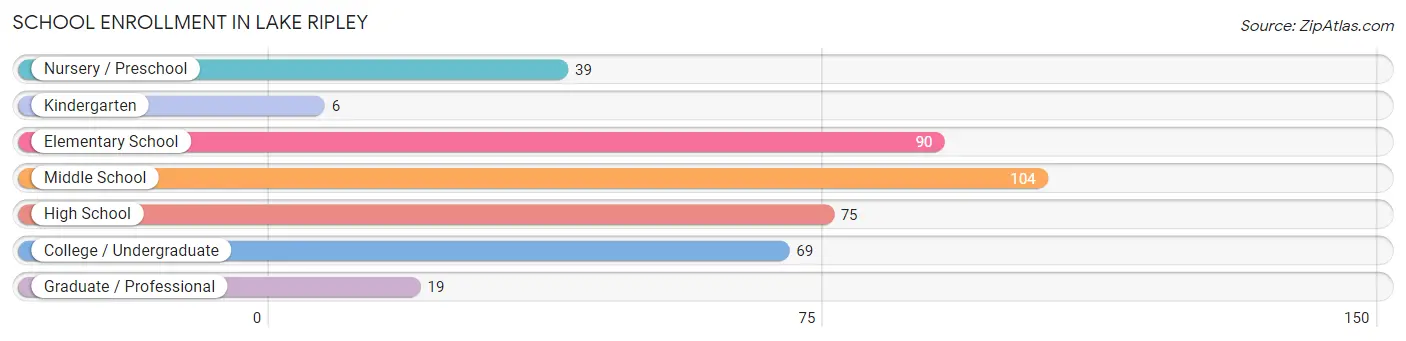
School Enrollment in Lake Ripley
The most common levels of schooling among the 402 students in Lake Ripley are middle school (104 | 25.9%), elementary school (90 | 22.4%), and high school (75 | 18.7%).
| School Level | # Students | % Students |
| Nursery / Preschool | 39 | 9.7% |
| Kindergarten | 6 | 1.5% |
| Elementary School | 90 | 22.4% |
| Middle School | 104 | 25.9% |
| High School | 75 | 18.7% |
| College / Undergraduate | 69 | 17.2% |
| Graduate / Professional | 19 | 4.7% |
| Total | 402 | 100.0% |
School Enrollment by Age by Funding Source in Lake Ripley
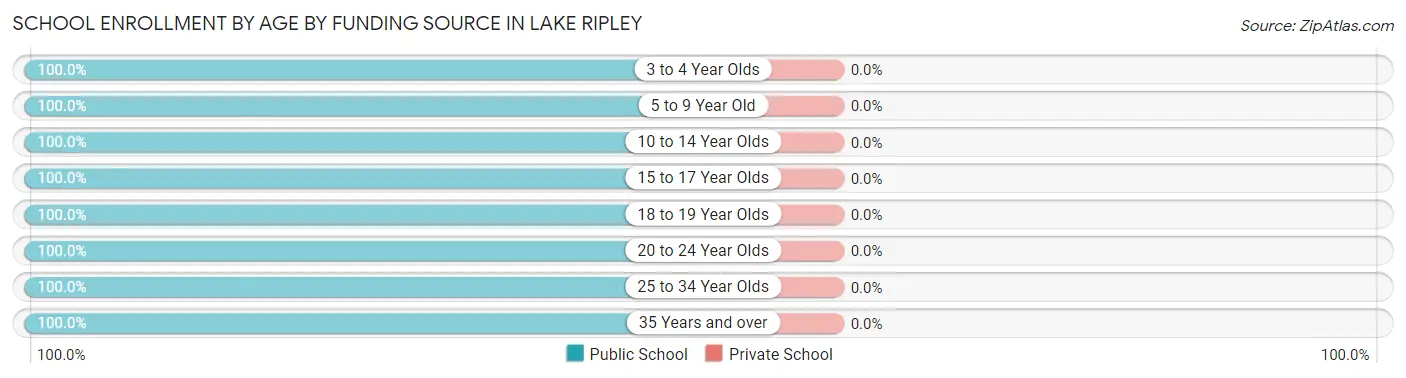
| Age Bracket | Public School | Private School |
| 3 to 4 Year Olds | 29 (100.0%) | 0 (0.0%) |
| 5 to 9 Year Old | 96 (100.0%) | 0 (0.0%) |
| 10 to 14 Year Olds | 114 (100.0%) | 0 (0.0%) |
| 15 to 17 Year Olds | 53 (100.0%) | 0 (0.0%) |
| 18 to 19 Year Olds | 39 (100.0%) | 0 (0.0%) |
| 20 to 24 Year Olds | 23 (100.0%) | 0 (0.0%) |
| 25 to 34 Year Olds | 33 (100.0%) | 0 (0.0%) |
| 35 Years and over | 15 (100.0%) | 0 (0.0%) |
| Total | 402 (100.0%) | 0 (0.0%) |
Educational Attainment by Field of Study in Lake Ripley
Business (252 | 26.1%), education (119 | 12.3%), science & technology (116 | 12.0%), arts & humanities (94 | 9.7%), and social sciences (87 | 9.0%) are the most common fields of study among 966 individuals in Lake Ripley who have obtained a bachelor's degree or higher.
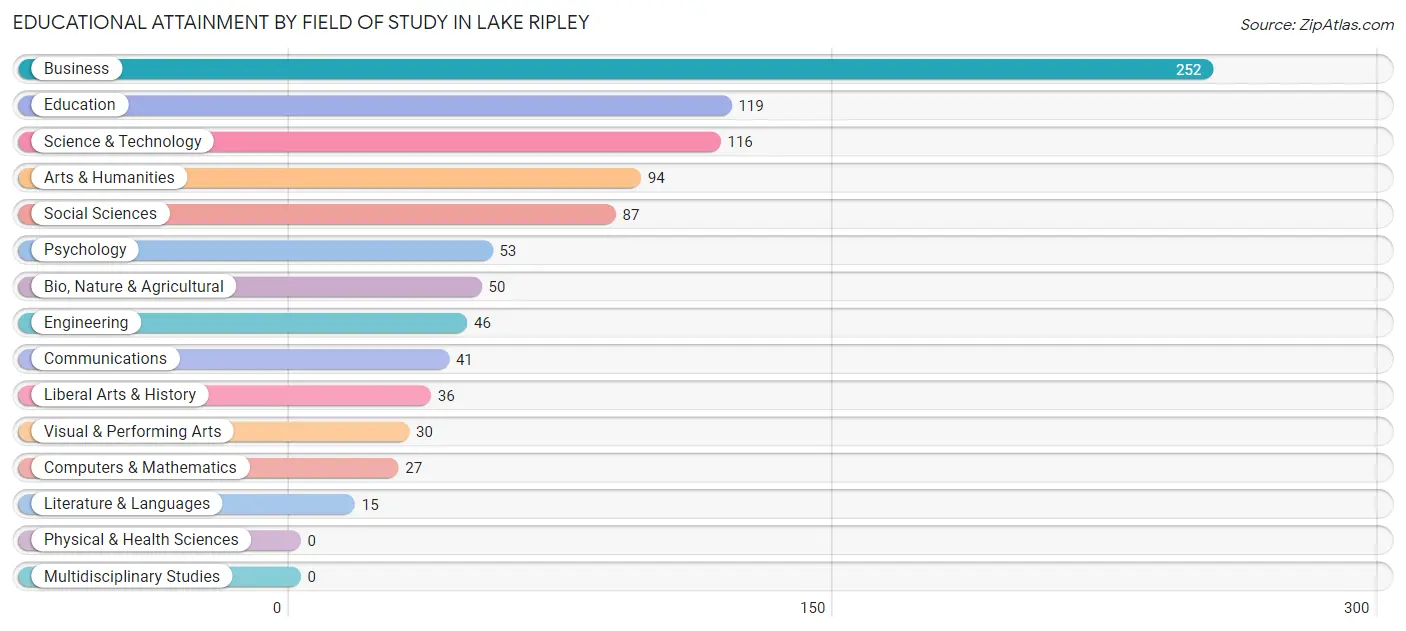
| Field of Study | # Graduates | % Graduates |
| Computers & Mathematics | 27 | 2.8% |
| Bio, Nature & Agricultural | 50 | 5.2% |
| Physical & Health Sciences | 0 | 0.0% |
| Psychology | 53 | 5.5% |
| Social Sciences | 87 | 9.0% |
| Engineering | 46 | 4.8% |
| Multidisciplinary Studies | 0 | 0.0% |
| Science & Technology | 116 | 12.0% |
| Business | 252 | 26.1% |
| Education | 119 | 12.3% |
| Literature & Languages | 15 | 1.5% |
| Liberal Arts & History | 36 | 3.7% |
| Visual & Performing Arts | 30 | 3.1% |
| Communications | 41 | 4.2% |
| Arts & Humanities | 94 | 9.7% |
| Total | 966 | 100.0% |
Transportation & Commute in Lake Ripley
Vehicle Availability by Sex in Lake Ripley
The most prevalent vehicle ownership categories in Lake Ripley are males with 3 vehicles (202, accounting for 45.6%) and females with 3 vehicles (162, making up 33.6%).
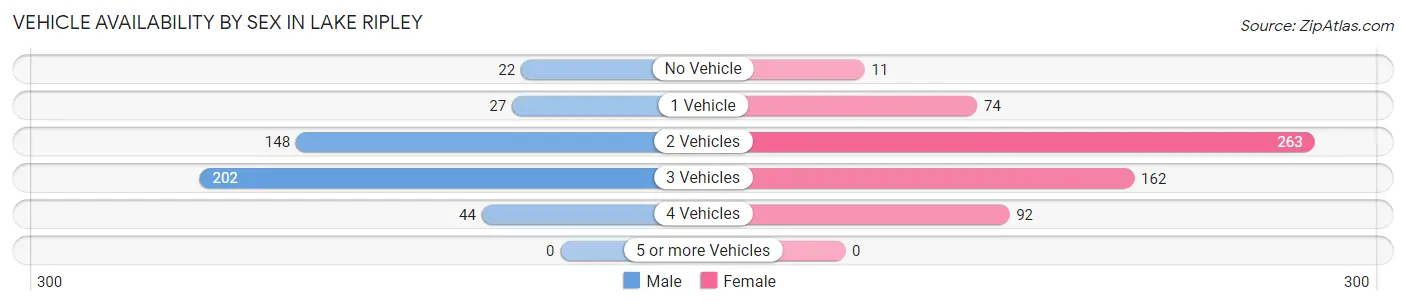
| Vehicles Available | Male | Female |
| No Vehicle | 22 (5.0%) | 11 (1.8%) |
| 1 Vehicle | 27 (6.1%) | 74 (12.3%) |
| 2 Vehicles | 148 (33.4%) | 263 (43.7%) |
| 3 Vehicles | 202 (45.6%) | 162 (26.9%) |
| 4 Vehicles | 44 (9.9%) | 92 (15.3%) |
| 5 or more Vehicles | 0 (0.0%) | 0 (0.0%) |
| Total | 443 (100.0%) | 602 (100.0%) |
Commute Time in Lake Ripley
The most frequently occuring commute durations in Lake Ripley are 30 to 34 minutes (328 commuters, 34.8%), 15 to 19 minutes (165 commuters, 17.5%), and 25 to 29 minutes (113 commuters, 12.0%).
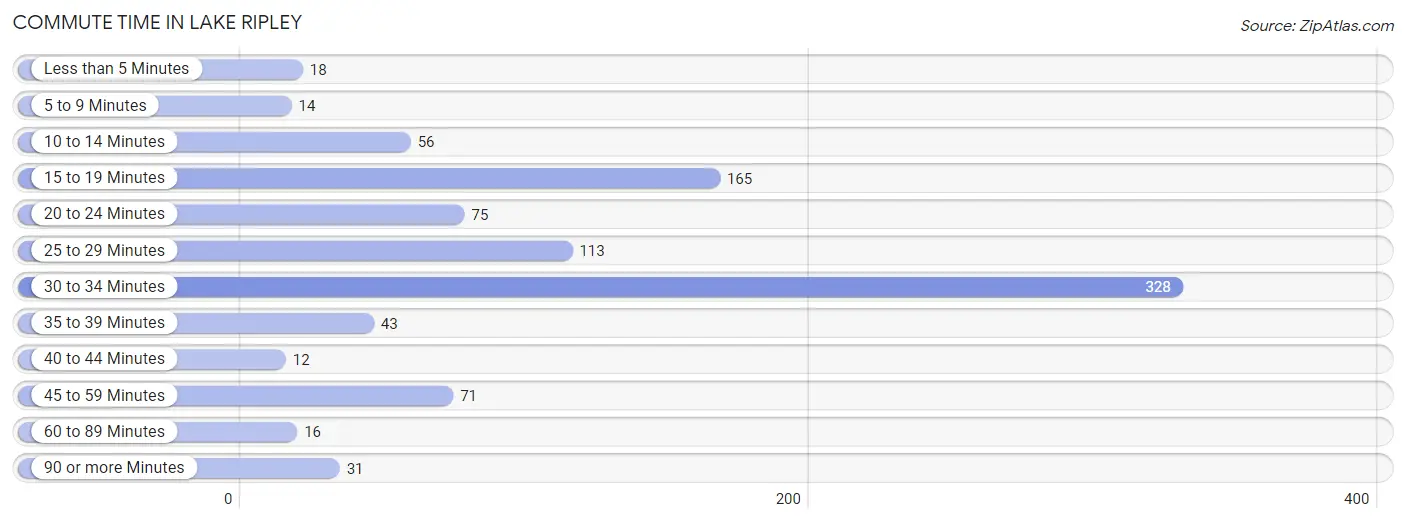
| Commute Time | # Commuters | % Commuters |
| Less than 5 Minutes | 18 | 1.9% |
| 5 to 9 Minutes | 14 | 1.5% |
| 10 to 14 Minutes | 56 | 5.9% |
| 15 to 19 Minutes | 165 | 17.5% |
| 20 to 24 Minutes | 75 | 8.0% |
| 25 to 29 Minutes | 113 | 12.0% |
| 30 to 34 Minutes | 328 | 34.8% |
| 35 to 39 Minutes | 43 | 4.6% |
| 40 to 44 Minutes | 12 | 1.3% |
| 45 to 59 Minutes | 71 | 7.5% |
| 60 to 89 Minutes | 16 | 1.7% |
| 90 or more Minutes | 31 | 3.3% |
Commute Time by Sex in Lake Ripley
The most common commute times in Lake Ripley are 30 to 34 minutes (108 commuters, 28.1%) for males and 30 to 34 minutes (220 commuters, 39.5%) for females.
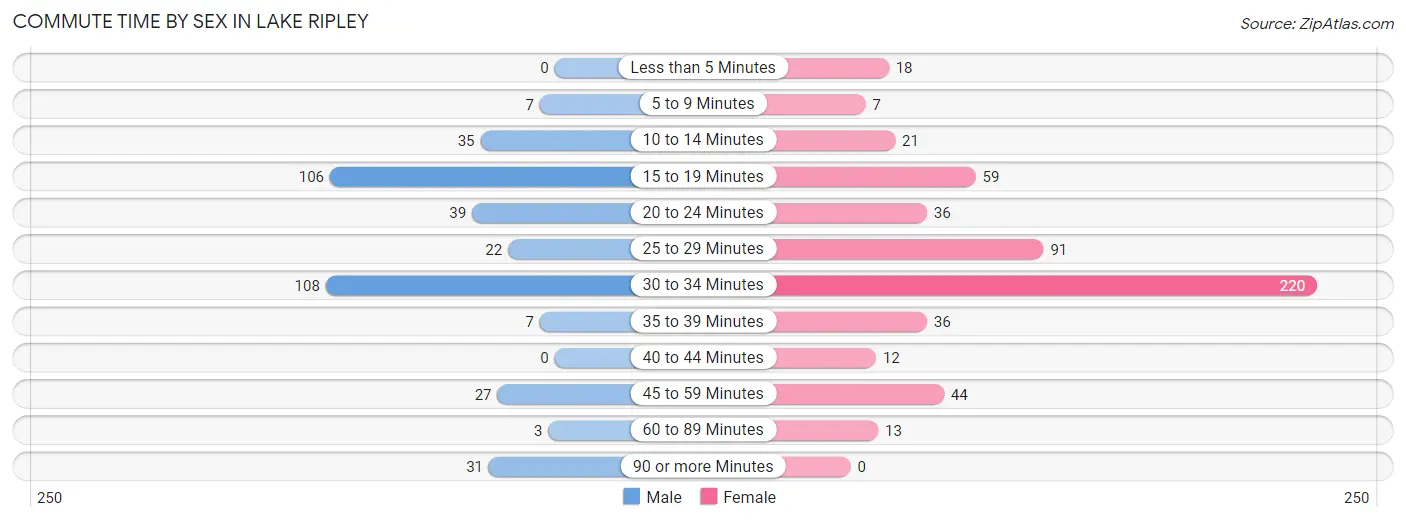
| Commute Time | Male | Female |
| Less than 5 Minutes | 0 (0.0%) | 18 (3.2%) |
| 5 to 9 Minutes | 7 (1.8%) | 7 (1.3%) |
| 10 to 14 Minutes | 35 (9.1%) | 21 (3.8%) |
| 15 to 19 Minutes | 106 (27.5%) | 59 (10.6%) |
| 20 to 24 Minutes | 39 (10.1%) | 36 (6.5%) |
| 25 to 29 Minutes | 22 (5.7%) | 91 (16.3%) |
| 30 to 34 Minutes | 108 (28.1%) | 220 (39.5%) |
| 35 to 39 Minutes | 7 (1.8%) | 36 (6.5%) |
| 40 to 44 Minutes | 0 (0.0%) | 12 (2.1%) |
| 45 to 59 Minutes | 27 (7.0%) | 44 (7.9%) |
| 60 to 89 Minutes | 3 (0.8%) | 13 (2.3%) |
| 90 or more Minutes | 31 (8.1%) | 0 (0.0%) |
Time of Departure to Work by Sex in Lake Ripley
The most frequent times of departure to work in Lake Ripley are 6:00 AM to 6:29 AM (75, 19.5%) for males and 8:00 AM to 8:29 AM (129, 23.2%) for females.
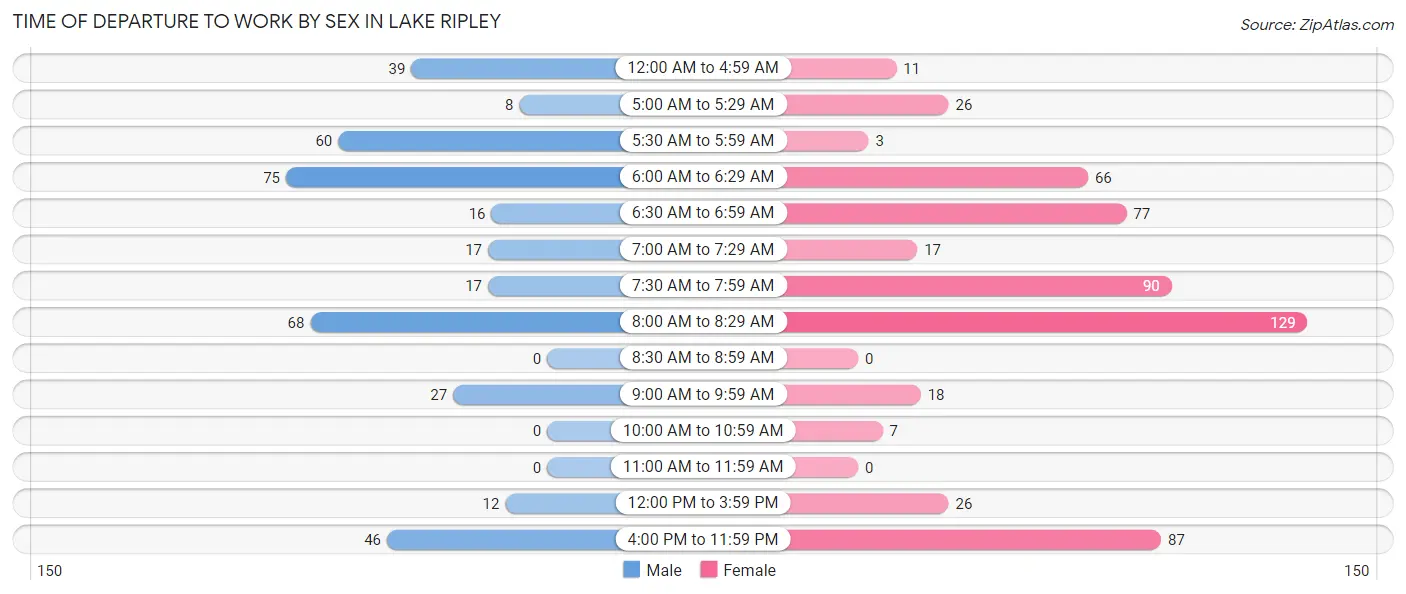
| Time of Departure | Male | Female |
| 12:00 AM to 4:59 AM | 39 (10.1%) | 11 (2.0%) |
| 5:00 AM to 5:29 AM | 8 (2.1%) | 26 (4.7%) |
| 5:30 AM to 5:59 AM | 60 (15.6%) | 3 (0.5%) |
| 6:00 AM to 6:29 AM | 75 (19.5%) | 66 (11.8%) |
| 6:30 AM to 6:59 AM | 16 (4.2%) | 77 (13.8%) |
| 7:00 AM to 7:29 AM | 17 (4.4%) | 17 (3.0%) |
| 7:30 AM to 7:59 AM | 17 (4.4%) | 90 (16.2%) |
| 8:00 AM to 8:29 AM | 68 (17.7%) | 129 (23.2%) |
| 8:30 AM to 8:59 AM | 0 (0.0%) | 0 (0.0%) |
| 9:00 AM to 9:59 AM | 27 (7.0%) | 18 (3.2%) |
| 10:00 AM to 10:59 AM | 0 (0.0%) | 7 (1.3%) |
| 11:00 AM to 11:59 AM | 0 (0.0%) | 0 (0.0%) |
| 12:00 PM to 3:59 PM | 12 (3.1%) | 26 (4.7%) |
| 4:00 PM to 11:59 PM | 46 (11.9%) | 87 (15.6%) |
| Total | 385 (100.0%) | 557 (100.0%) |
Housing Occupancy in Lake Ripley
Occupancy by Ownership in Lake Ripley
Of the total 796 dwellings in Lake Ripley, owner-occupied units account for 687 (86.3%), while renter-occupied units make up 109 (13.7%).
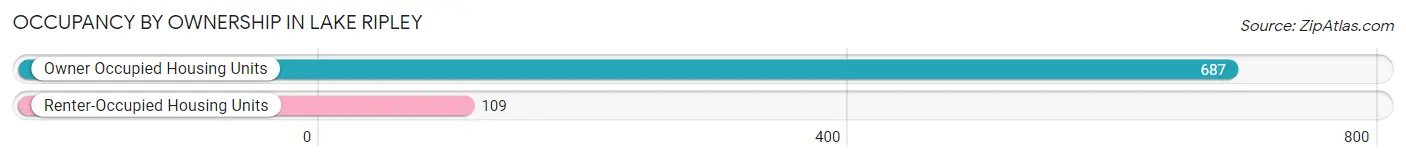
| Occupancy | # Housing Units | % Housing Units |
| Owner Occupied Housing Units | 687 | 86.3% |
| Renter-Occupied Housing Units | 109 | 13.7% |
| Total Occupied Housing Units | 796 | 100.0% |
Occupancy by Household Size in Lake Ripley
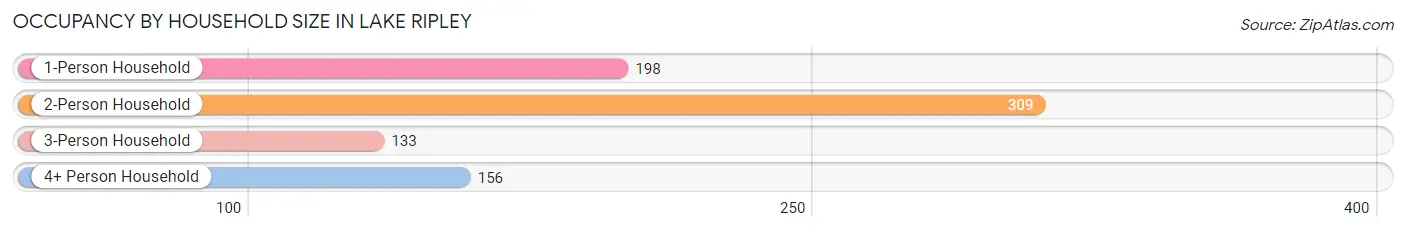
| Household Size | # Housing Units | % Housing Units |
| 1-Person Household | 198 | 24.9% |
| 2-Person Household | 309 | 38.8% |
| 3-Person Household | 133 | 16.7% |
| 4+ Person Household | 156 | 19.6% |
| Total Housing Units | 796 | 100.0% |
Occupancy by Ownership by Household Size in Lake Ripley
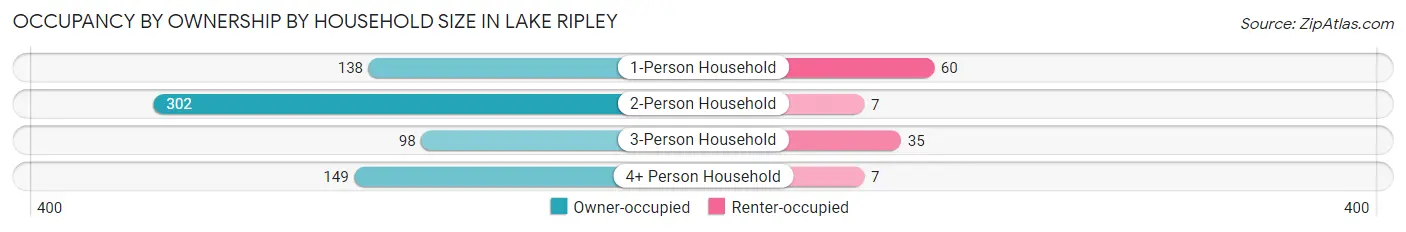
| Household Size | Owner-occupied | Renter-occupied |
| 1-Person Household | 138 (69.7%) | 60 (30.3%) |
| 2-Person Household | 302 (97.7%) | 7 (2.3%) |
| 3-Person Household | 98 (73.7%) | 35 (26.3%) |
| 4+ Person Household | 149 (95.5%) | 7 (4.5%) |
| Total Housing Units | 687 (86.3%) | 109 (13.7%) |
Occupancy by Educational Attainment in Lake Ripley
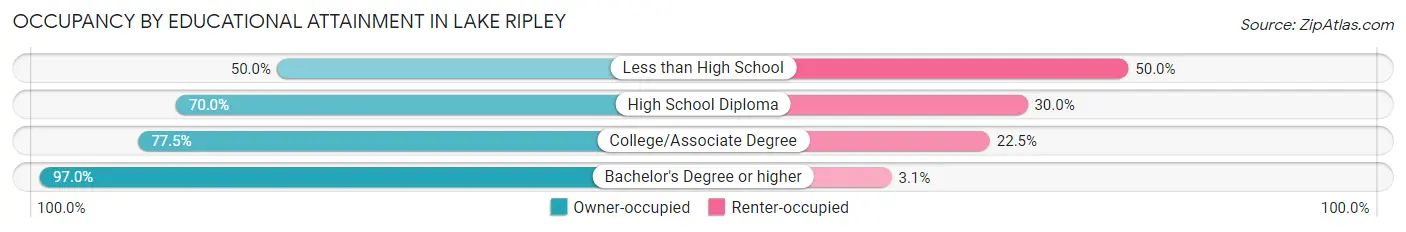
| Household Size | Owner-occupied | Renter-occupied |
| Less than High School | 8 (50.0%) | 8 (50.0%) |
| High School Diploma | 77 (70.0%) | 33 (30.0%) |
| College/Associate Degree | 189 (77.5%) | 55 (22.5%) |
| Bachelor's Degree or higher | 413 (97.0%) | 13 (3.0%) |
Occupancy by Age of Householder in Lake Ripley
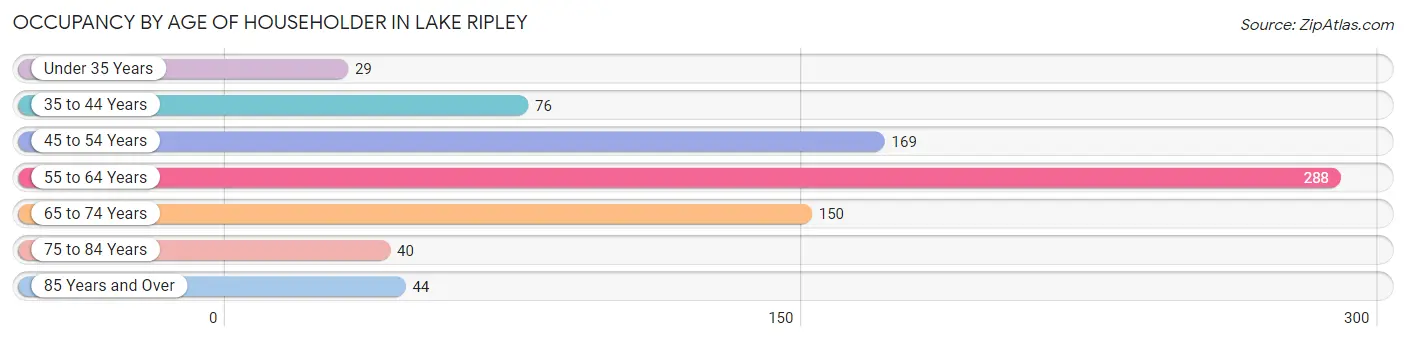
| Age Bracket | # Households | % Households |
| Under 35 Years | 29 | 3.6% |
| 35 to 44 Years | 76 | 9.6% |
| 45 to 54 Years | 169 | 21.2% |
| 55 to 64 Years | 288 | 36.2% |
| 65 to 74 Years | 150 | 18.8% |
| 75 to 84 Years | 40 | 5.0% |
| 85 Years and Over | 44 | 5.5% |
| Total | 796 | 100.0% |
Housing Finances in Lake Ripley
Median Income by Occupancy in Lake Ripley
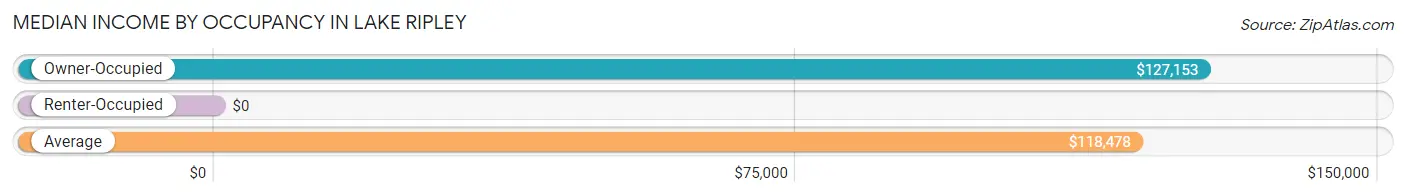
| Occupancy Type | # Households | Median Income |
| Owner-Occupied | 687 (86.3%) | $127,153 |
| Renter-Occupied | 109 (13.7%) | $0 |
| Average | 796 (100.0%) | $118,478 |
Occupancy by Householder Income Bracket in Lake Ripley
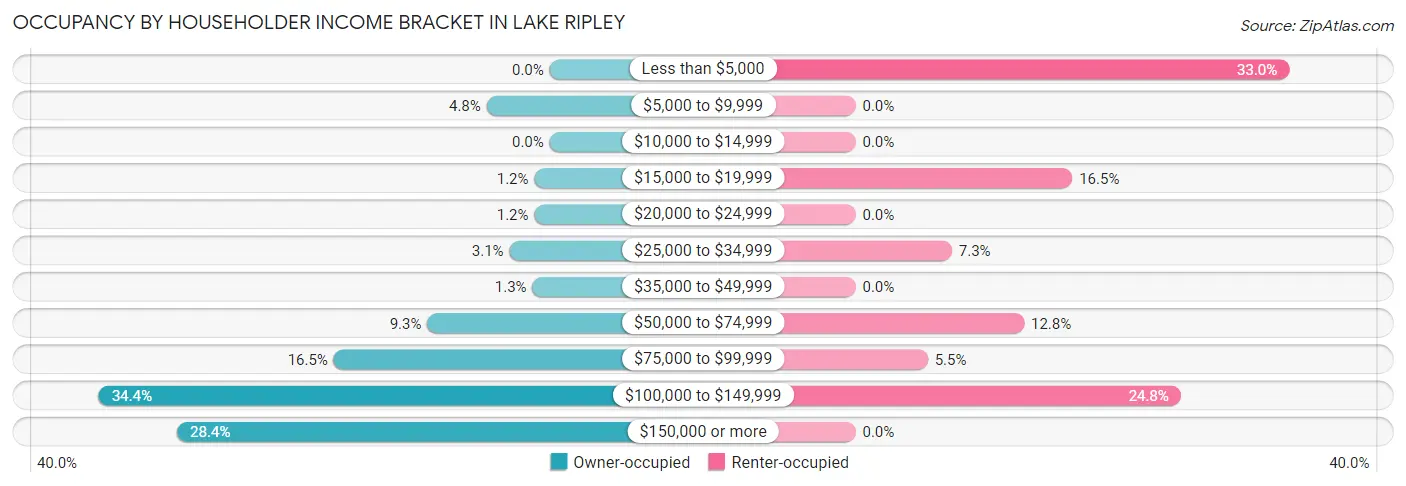
| Income Bracket | Owner-occupied | Renter-occupied |
| Less than $5,000 | 0 (0.0%) | 36 (33.0%) |
| $5,000 to $9,999 | 33 (4.8%) | 0 (0.0%) |
| $10,000 to $14,999 | 0 (0.0%) | 0 (0.0%) |
| $15,000 to $19,999 | 8 (1.2%) | 18 (16.5%) |
| $20,000 to $24,999 | 8 (1.2%) | 0 (0.0%) |
| $25,000 to $34,999 | 21 (3.1%) | 8 (7.3%) |
| $35,000 to $49,999 | 9 (1.3%) | 0 (0.0%) |
| $50,000 to $74,999 | 64 (9.3%) | 14 (12.8%) |
| $75,000 to $99,999 | 113 (16.5%) | 6 (5.5%) |
| $100,000 to $149,999 | 236 (34.4%) | 27 (24.8%) |
| $150,000 or more | 195 (28.4%) | 0 (0.0%) |
| Total | 687 (100.0%) | 109 (100.0%) |
Monthly Housing Cost Tiers in Lake Ripley
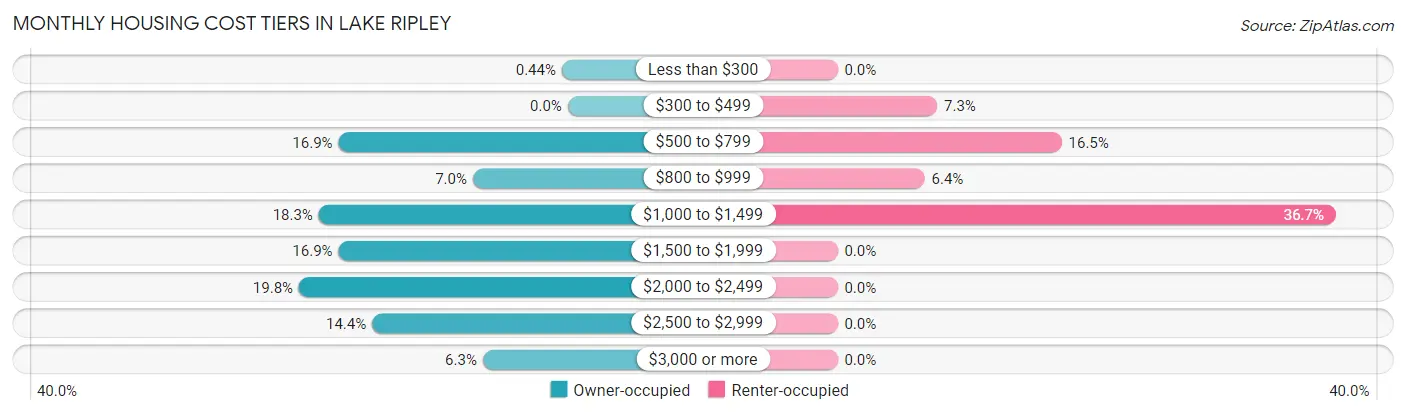
| Monthly Cost | Owner-occupied | Renter-occupied |
| Less than $300 | 3 (0.4%) | 0 (0.0%) |
| $300 to $499 | 0 (0.0%) | 8 (7.3%) |
| $500 to $799 | 116 (16.9%) | 18 (16.5%) |
| $800 to $999 | 48 (7.0%) | 7 (6.4%) |
| $1,000 to $1,499 | 126 (18.3%) | 40 (36.7%) |
| $1,500 to $1,999 | 116 (16.9%) | 0 (0.0%) |
| $2,000 to $2,499 | 136 (19.8%) | 0 (0.0%) |
| $2,500 to $2,999 | 99 (14.4%) | 0 (0.0%) |
| $3,000 or more | 43 (6.3%) | 0 (0.0%) |
| Total | 687 (100.0%) | 109 (100.0%) |
Physical Housing Characteristics in Lake Ripley
Housing Structures in Lake Ripley
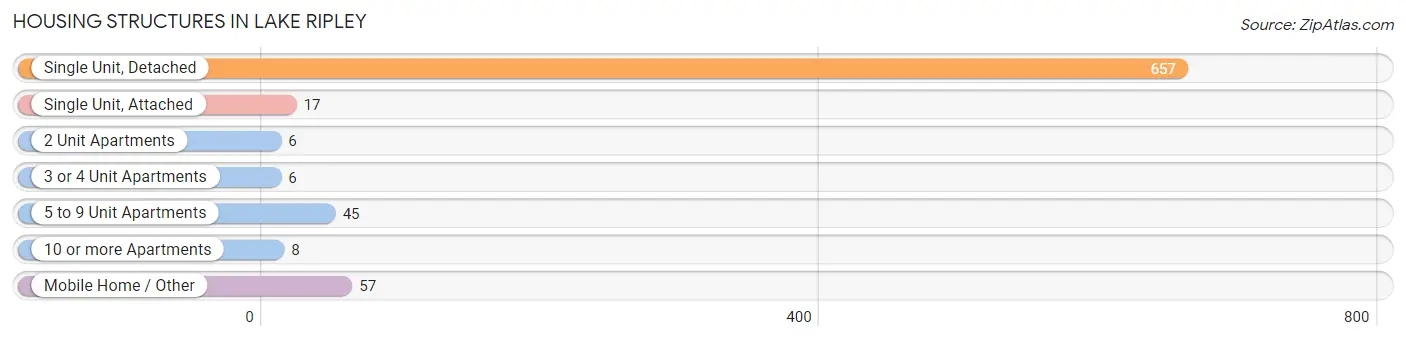
| Structure Type | # Housing Units | % Housing Units |
| Single Unit, Detached | 657 | 82.5% |
| Single Unit, Attached | 17 | 2.1% |
| 2 Unit Apartments | 6 | 0.7% |
| 3 or 4 Unit Apartments | 6 | 0.7% |
| 5 to 9 Unit Apartments | 45 | 5.7% |
| 10 or more Apartments | 8 | 1.0% |
| Mobile Home / Other | 57 | 7.2% |
| Total | 796 | 100.0% |
Housing Structures by Occupancy in Lake Ripley
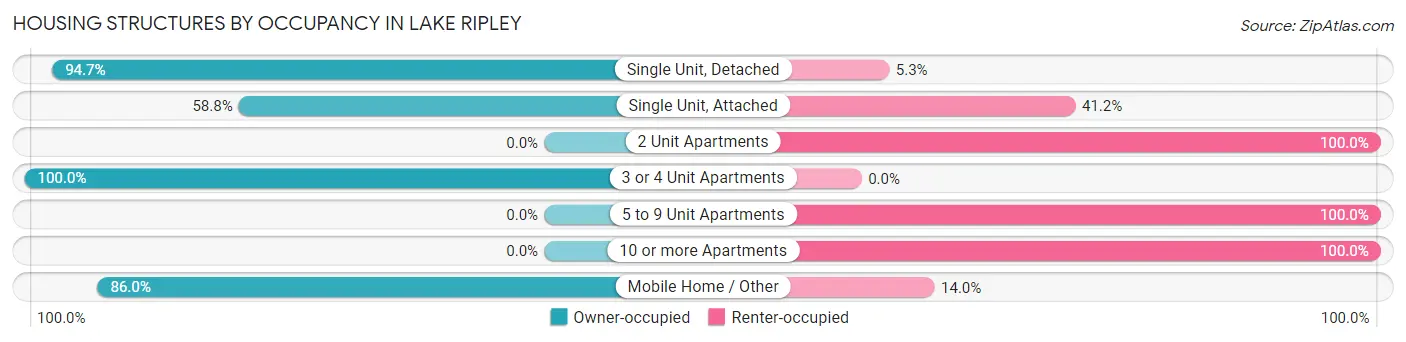
| Structure Type | Owner-occupied | Renter-occupied |
| Single Unit, Detached | 622 (94.7%) | 35 (5.3%) |
| Single Unit, Attached | 10 (58.8%) | 7 (41.2%) |
| 2 Unit Apartments | 0 (0.0%) | 6 (100.0%) |
| 3 or 4 Unit Apartments | 6 (100.0%) | 0 (0.0%) |
| 5 to 9 Unit Apartments | 0 (0.0%) | 45 (100.0%) |
| 10 or more Apartments | 0 (0.0%) | 8 (100.0%) |
| Mobile Home / Other | 49 (86.0%) | 8 (14.0%) |
| Total | 687 (86.3%) | 109 (13.7%) |
Housing Structures by Number of Rooms in Lake Ripley
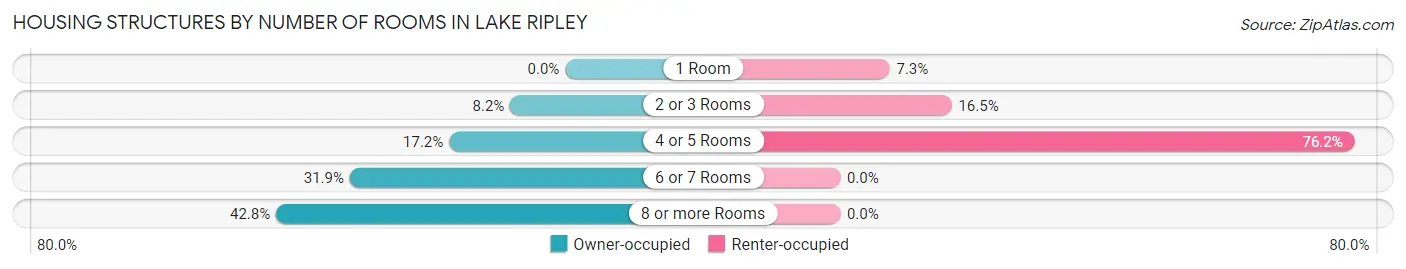
| Number of Rooms | Owner-occupied | Renter-occupied |
| 1 Room | 0 (0.0%) | 8 (7.3%) |
| 2 or 3 Rooms | 56 (8.2%) | 18 (16.5%) |
| 4 or 5 Rooms | 118 (17.2%) | 83 (76.1%) |
| 6 or 7 Rooms | 219 (31.9%) | 0 (0.0%) |
| 8 or more Rooms | 294 (42.8%) | 0 (0.0%) |
| Total | 687 (100.0%) | 109 (100.0%) |
Housing Structure by Heating Type in Lake Ripley
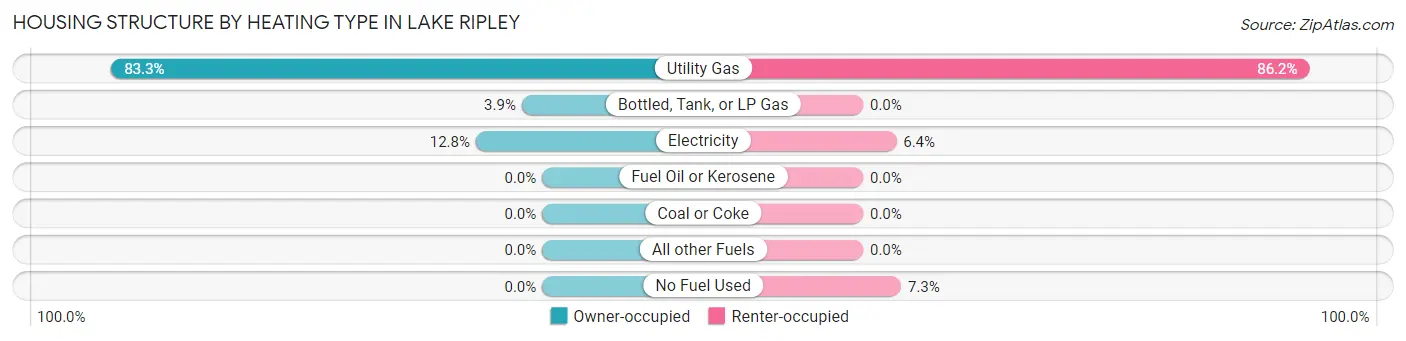
| Heating Type | Owner-occupied | Renter-occupied |
| Utility Gas | 572 (83.3%) | 94 (86.2%) |
| Bottled, Tank, or LP Gas | 27 (3.9%) | 0 (0.0%) |
| Electricity | 88 (12.8%) | 7 (6.4%) |
| Fuel Oil or Kerosene | 0 (0.0%) | 0 (0.0%) |
| Coal or Coke | 0 (0.0%) | 0 (0.0%) |
| All other Fuels | 0 (0.0%) | 0 (0.0%) |
| No Fuel Used | 0 (0.0%) | 8 (7.3%) |
| Total | 687 (100.0%) | 109 (100.0%) |
Household Vehicle Usage in Lake Ripley
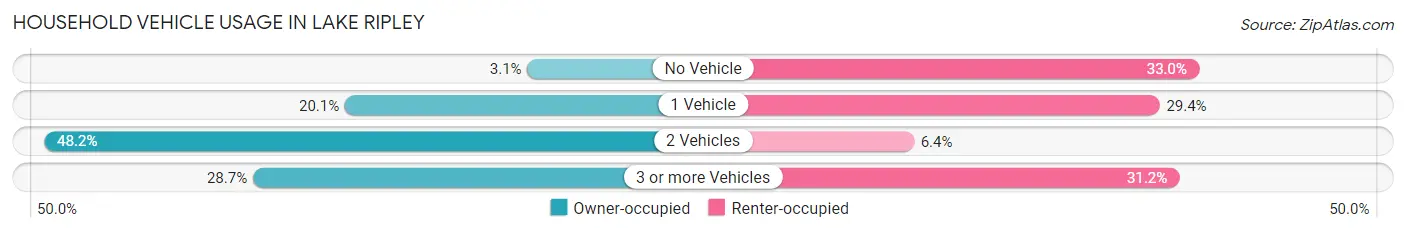
| Vehicles per Household | Owner-occupied | Renter-occupied |
| No Vehicle | 21 (3.1%) | 36 (33.0%) |
| 1 Vehicle | 138 (20.1%) | 32 (29.4%) |
| 2 Vehicles | 331 (48.2%) | 7 (6.4%) |
| 3 or more Vehicles | 197 (28.7%) | 34 (31.2%) |
| Total | 687 (100.0%) | 109 (100.0%) |
Real Estate & Mortgages in Lake Ripley
Real Estate and Mortgage Overview in Lake Ripley
| Characteristic | Without Mortgage | With Mortgage |
| Housing Units | 183 | 504 |
| Median Property Value | $306,800 | $329,200 |
| Median Household Income | $86,563 | $170 |
| Monthly Housing Costs | $719 | $43 |
| Real Estate Taxes | $5,291 | $0 |
Property Value by Mortgage Status in Lake Ripley
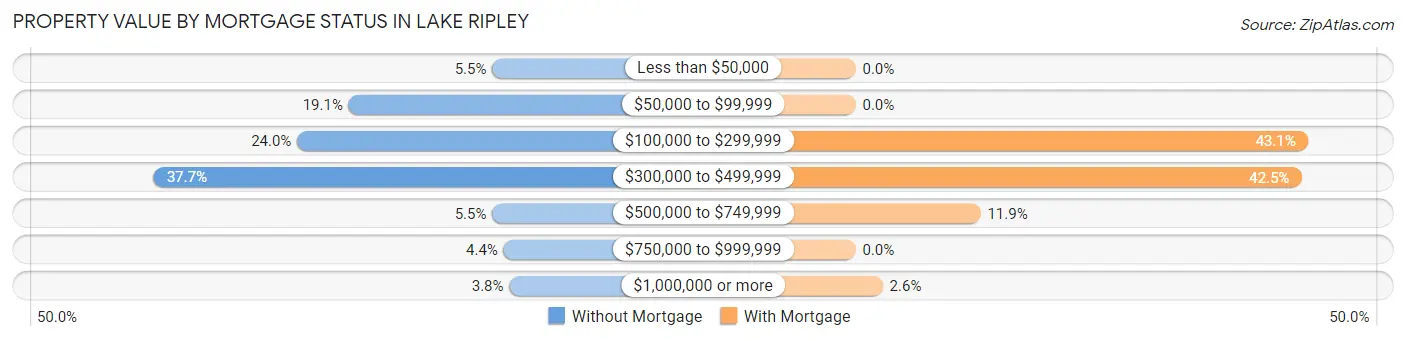
| Property Value | Without Mortgage | With Mortgage |
| Less than $50,000 | 10 (5.5%) | 0 (0.0%) |
| $50,000 to $99,999 | 35 (19.1%) | 0 (0.0%) |
| $100,000 to $299,999 | 44 (24.0%) | 217 (43.1%) |
| $300,000 to $499,999 | 69 (37.7%) | 214 (42.5%) |
| $500,000 to $749,999 | 10 (5.5%) | 60 (11.9%) |
| $750,000 to $999,999 | 8 (4.4%) | 0 (0.0%) |
| $1,000,000 or more | 7 (3.8%) | 13 (2.6%) |
| Total | 183 (100.0%) | 504 (100.0%) |
Household Income by Mortgage Status in Lake Ripley
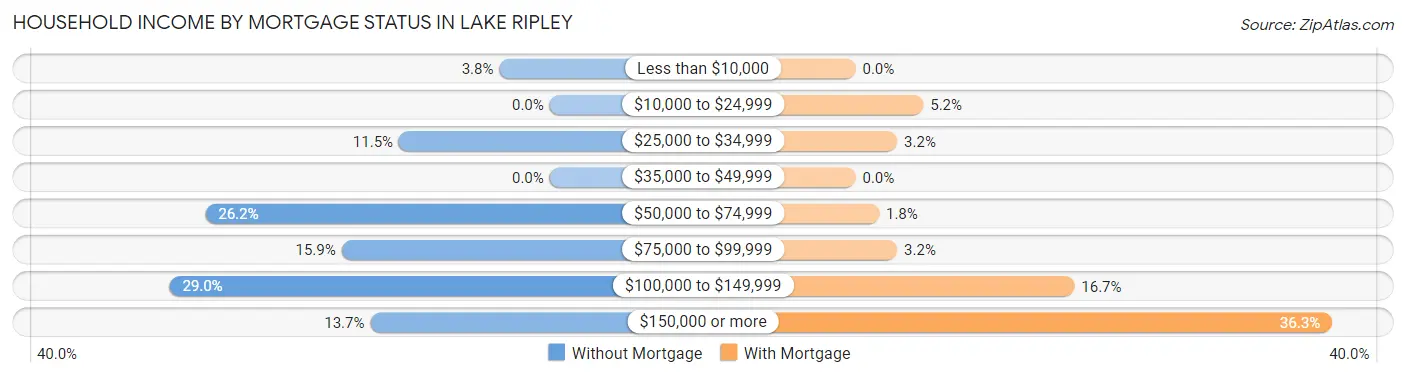
| Household Income | Without Mortgage | With Mortgage |
| Less than $10,000 | 7 (3.8%) | 0 (0.0%) |
| $10,000 to $24,999 | 0 (0.0%) | 26 (5.2%) |
| $25,000 to $34,999 | 21 (11.5%) | 16 (3.2%) |
| $35,000 to $49,999 | 0 (0.0%) | 0 (0.0%) |
| $50,000 to $74,999 | 48 (26.2%) | 9 (1.8%) |
| $75,000 to $99,999 | 29 (15.9%) | 16 (3.2%) |
| $100,000 to $149,999 | 53 (29.0%) | 84 (16.7%) |
| $150,000 or more | 25 (13.7%) | 183 (36.3%) |
| Total | 183 (100.0%) | 504 (100.0%) |
Property Value to Household Income Ratio in Lake Ripley
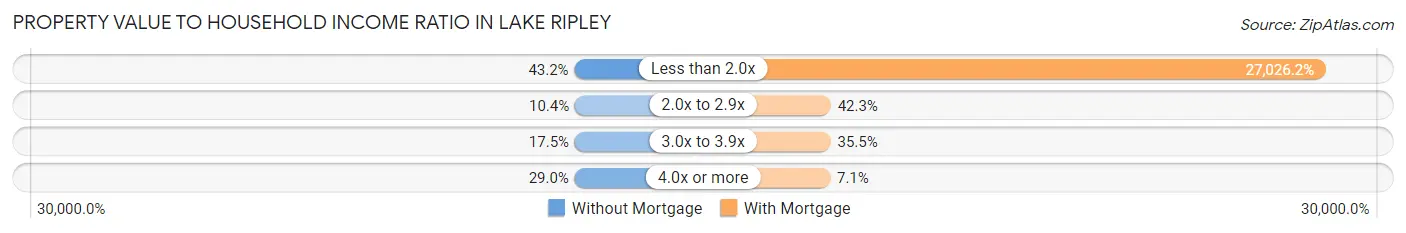
| Value-to-Income Ratio | Without Mortgage | With Mortgage |
| Less than 2.0x | 79 (43.2%) | 136,212 (27,026.2%) |
| 2.0x to 2.9x | 19 (10.4%) | 213 (42.3%) |
| 3.0x to 3.9x | 32 (17.5%) | 179 (35.5%) |
| 4.0x or more | 53 (29.0%) | 36 (7.1%) |
| Total | 183 (100.0%) | 504 (100.0%) |
Real Estate Taxes by Mortgage Status in Lake Ripley
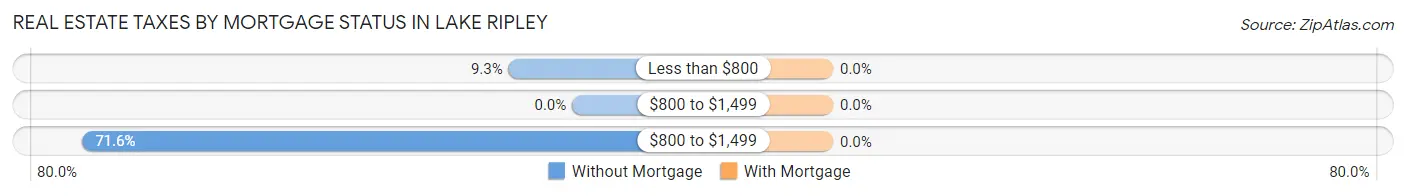
| Property Taxes | Without Mortgage | With Mortgage |
| Less than $800 | 17 (9.3%) | 0 (0.0%) |
| $800 to $1,499 | 0 (0.0%) | 0 (0.0%) |
| $800 to $1,499 | 131 (71.6%) | 0 (0.0%) |
| Total | 183 (100.0%) | 504 (100.0%) |
Health & Disability in Lake Ripley
Health Insurance Coverage by Age in Lake Ripley
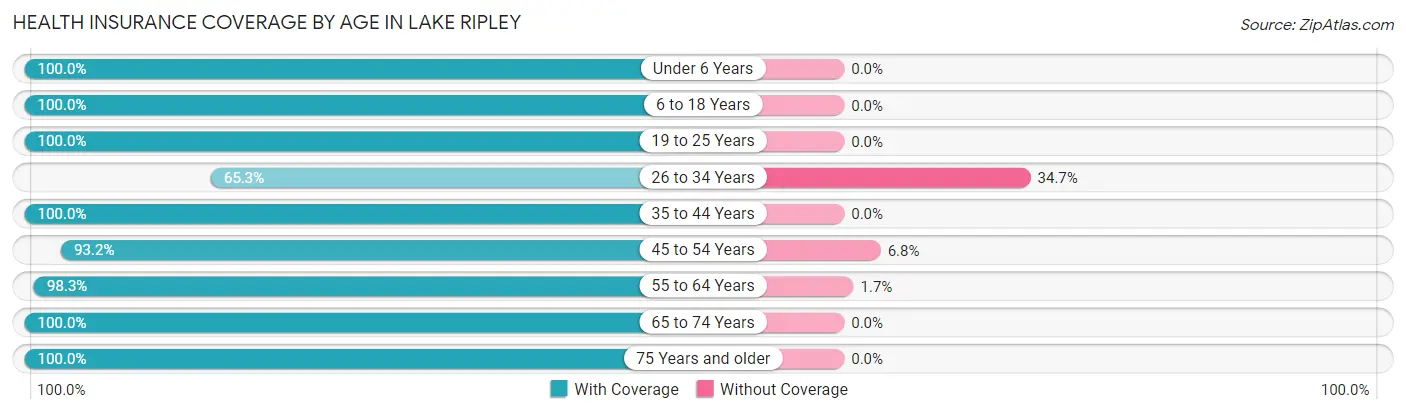
| Age Bracket | With Coverage | Without Coverage |
| Under 6 Years | 110 (100.0%) | 0 (0.0%) |
| 6 to 18 Years | 292 (100.0%) | 0 (0.0%) |
| 19 to 25 Years | 107 (100.0%) | 0 (0.0%) |
| 26 to 34 Years | 62 (65.3%) | 33 (34.7%) |
| 35 to 44 Years | 162 (100.0%) | 0 (0.0%) |
| 45 to 54 Years | 357 (93.2%) | 26 (6.8%) |
| 55 to 64 Years | 453 (98.3%) | 8 (1.7%) |
| 65 to 74 Years | 236 (100.0%) | 0 (0.0%) |
| 75 Years and older | 136 (100.0%) | 0 (0.0%) |
| Total | 1,915 (96.6%) | 67 (3.4%) |
Health Insurance Coverage by Citizenship Status in Lake Ripley
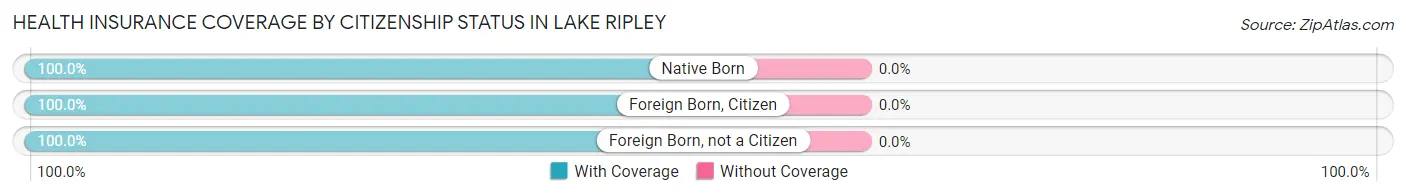
| Citizenship Status | With Coverage | Without Coverage |
| Native Born | 110 (100.0%) | 0 (0.0%) |
| Foreign Born, Citizen | 292 (100.0%) | 0 (0.0%) |
| Foreign Born, not a Citizen | 107 (100.0%) | 0 (0.0%) |
Health Insurance Coverage by Household Income in Lake Ripley
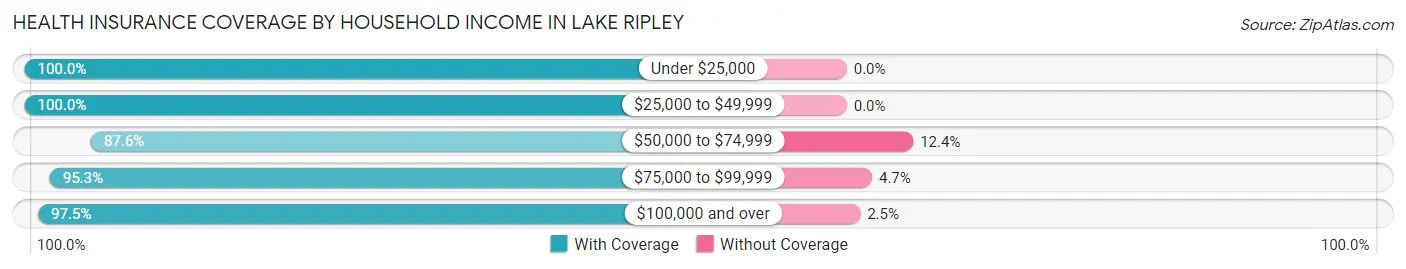
| Household Income | With Coverage | Without Coverage |
| Under $25,000 | 191 (100.0%) | 0 (0.0%) |
| $25,000 to $49,999 | 104 (100.0%) | 0 (0.0%) |
| $50,000 to $74,999 | 183 (87.6%) | 26 (12.4%) |
| $75,000 to $99,999 | 161 (95.3%) | 8 (4.7%) |
| $100,000 and over | 1,276 (97.5%) | 33 (2.5%) |
Public vs Private Health Insurance Coverage by Age in Lake Ripley
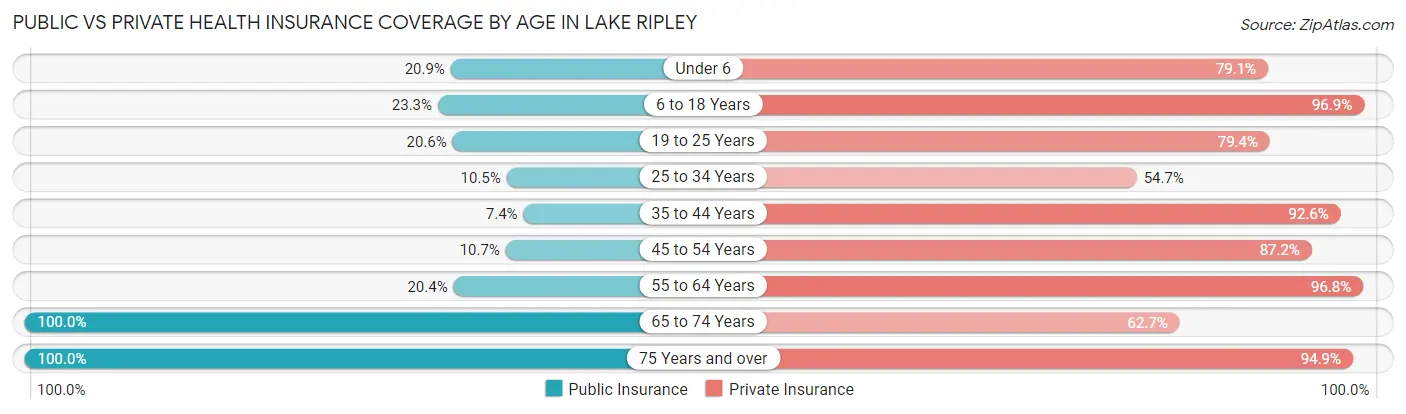
| Age Bracket | Public Insurance | Private Insurance |
| Under 6 | 23 (20.9%) | 87 (79.1%) |
| 6 to 18 Years | 68 (23.3%) | 283 (96.9%) |
| 19 to 25 Years | 22 (20.6%) | 85 (79.4%) |
| 25 to 34 Years | 10 (10.5%) | 52 (54.7%) |
| 35 to 44 Years | 12 (7.4%) | 150 (92.6%) |
| 45 to 54 Years | 41 (10.7%) | 334 (87.2%) |
| 55 to 64 Years | 94 (20.4%) | 446 (96.8%) |
| 65 to 74 Years | 236 (100.0%) | 148 (62.7%) |
| 75 Years and over | 136 (100.0%) | 129 (94.9%) |
| Total | 642 (32.4%) | 1,714 (86.5%) |
Disability Status by Sex by Age in Lake Ripley
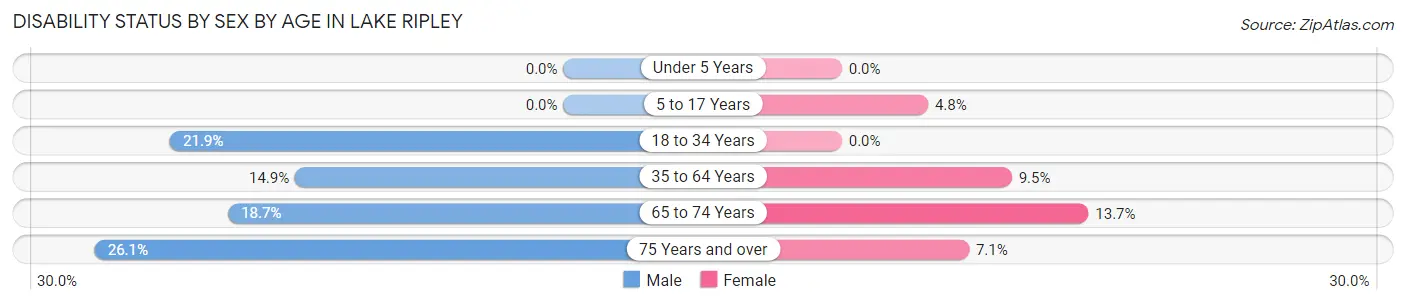
| Age Bracket | Male | Female |
| Under 5 Years | 0 (0.0%) | 0 (0.0%) |
| 5 to 17 Years | 0 (0.0%) | 6 (4.8%) |
| 18 to 34 Years | 23 (21.9%) | 0 (0.0%) |
| 35 to 64 Years | 65 (14.9%) | 54 (9.5%) |
| 65 to 74 Years | 25 (18.7%) | 14 (13.7%) |
| 75 Years and over | 6 (26.1%) | 8 (7.1%) |
Disability Class by Sex by Age in Lake Ripley
Disability Class: Hearing Difficulty
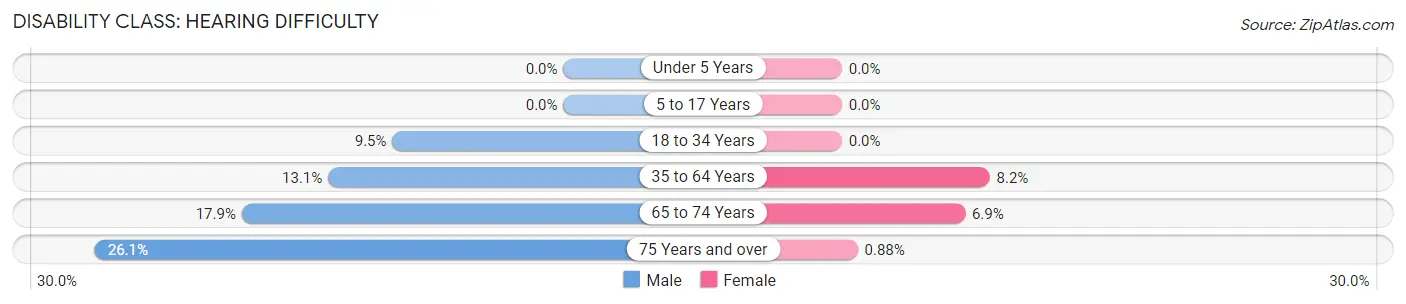
| Age Bracket | Male | Female |
| Under 5 Years | 0 (0.0%) | 0 (0.0%) |
| 5 to 17 Years | 0 (0.0%) | 0 (0.0%) |
| 18 to 34 Years | 10 (9.5%) | 0 (0.0%) |
| 35 to 64 Years | 57 (13.1%) | 47 (8.2%) |
| 65 to 74 Years | 24 (17.9%) | 7 (6.9%) |
| 75 Years and over | 6 (26.1%) | 1 (0.9%) |
Disability Class: Vision Difficulty
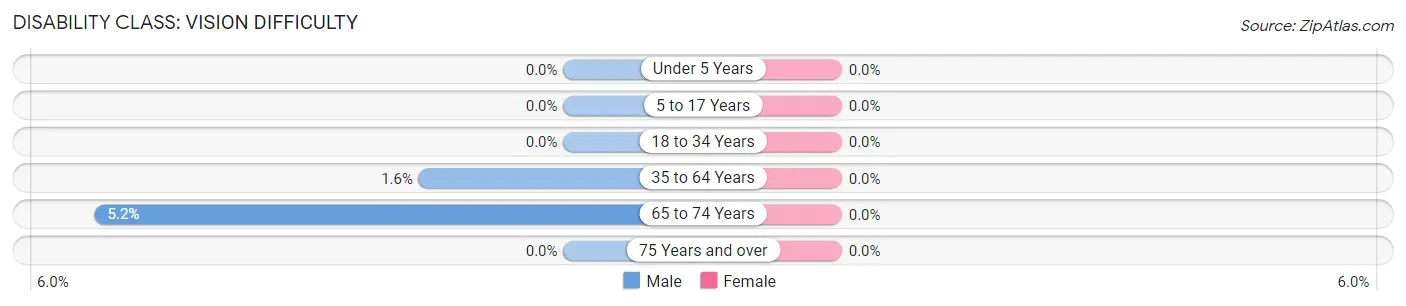
| Age Bracket | Male | Female |
| Under 5 Years | 0 (0.0%) | 0 (0.0%) |
| 5 to 17 Years | 0 (0.0%) | 0 (0.0%) |
| 18 to 34 Years | 0 (0.0%) | 0 (0.0%) |
| 35 to 64 Years | 7 (1.6%) | 0 (0.0%) |
| 65 to 74 Years | 7 (5.2%) | 0 (0.0%) |
| 75 Years and over | 0 (0.0%) | 0 (0.0%) |
Disability Class: Cognitive Difficulty
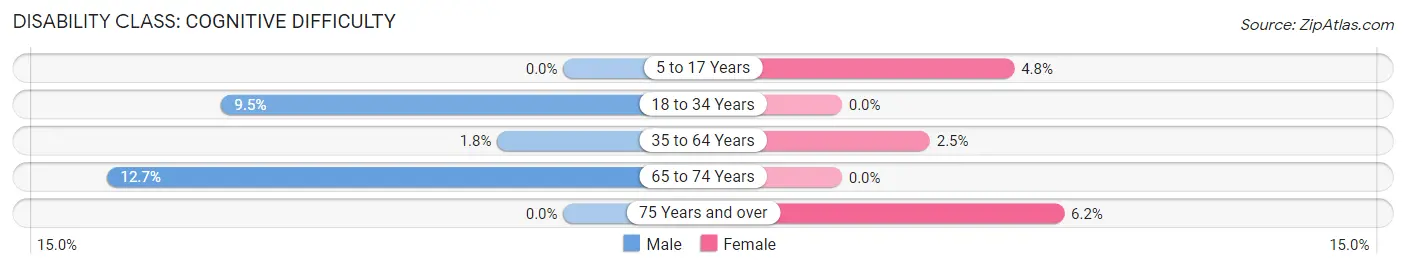
| Age Bracket | Male | Female |
| 5 to 17 Years | 0 (0.0%) | 6 (4.8%) |
| 18 to 34 Years | 10 (9.5%) | 0 (0.0%) |
| 35 to 64 Years | 8 (1.8%) | 14 (2.5%) |
| 65 to 74 Years | 17 (12.7%) | 0 (0.0%) |
| 75 Years and over | 0 (0.0%) | 7 (6.2%) |
Disability Class: Ambulatory Difficulty
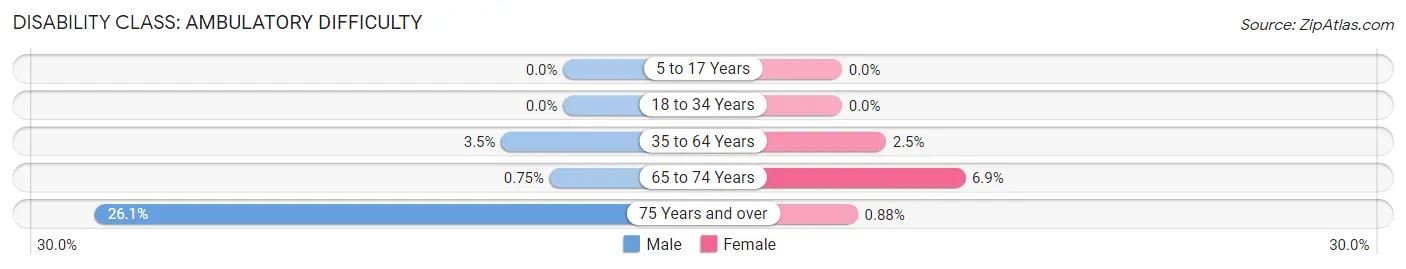
| Age Bracket | Male | Female |
| 5 to 17 Years | 0 (0.0%) | 0 (0.0%) |
| 18 to 34 Years | 0 (0.0%) | 0 (0.0%) |
| 35 to 64 Years | 15 (3.5%) | 14 (2.5%) |
| 65 to 74 Years | 1 (0.7%) | 7 (6.9%) |
| 75 Years and over | 6 (26.1%) | 1 (0.9%) |
Disability Class: Self-Care Difficulty
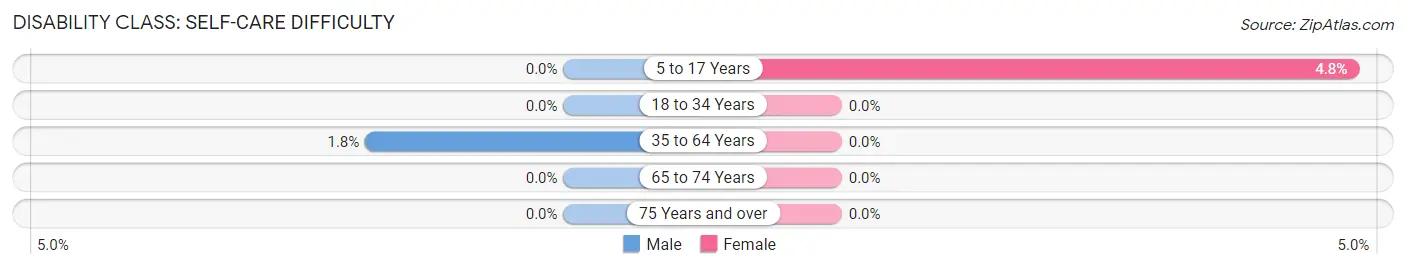
| Age Bracket | Male | Female |
| 5 to 17 Years | 0 (0.0%) | 6 (4.8%) |
| 18 to 34 Years | 0 (0.0%) | 0 (0.0%) |
| 35 to 64 Years | 8 (1.8%) | 0 (0.0%) |
| 65 to 74 Years | 0 (0.0%) | 0 (0.0%) |
| 75 Years and over | 0 (0.0%) | 0 (0.0%) |
Technology Access in Lake Ripley
Computing Device Access in Lake Ripley
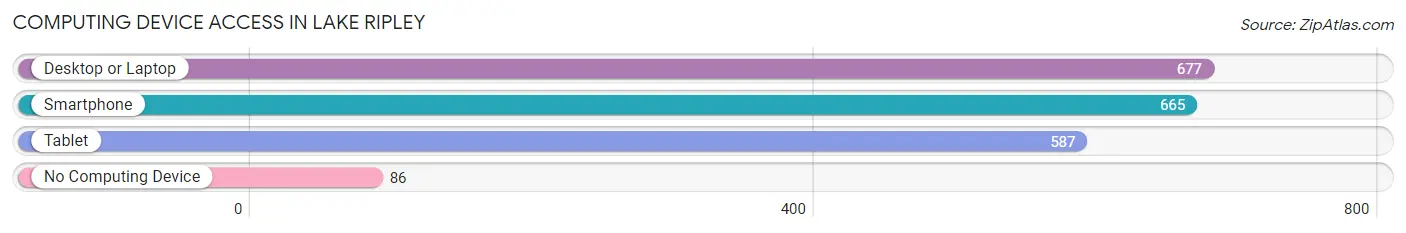
| Device Type | # Households | % Households |
| Desktop or Laptop | 677 | 85.1% |
| Smartphone | 665 | 83.5% |
| Tablet | 587 | 73.7% |
| No Computing Device | 86 | 10.8% |
| Total | 796 | 100.0% |
Internet Access in Lake Ripley
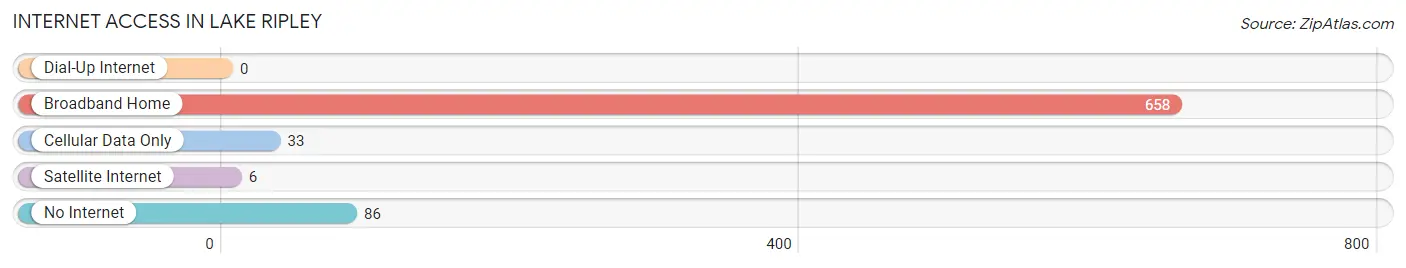
| Internet Type | # Households | % Households |
| Dial-Up Internet | 0 | 0.0% |
| Broadband Home | 658 | 82.7% |
| Cellular Data Only | 33 | 4.2% |
| Satellite Internet | 6 | 0.7% |
| No Internet | 86 | 10.8% |
| Total | 796 | 100.0% |
Lake Ripley Summary
History
Lake Ripley is a small unincorporated community located in Jefferson County, Wisconsin. It is situated on the western shore of Lake Ripley, a small lake of the same name. The lake is located in the Koshkonong Creek watershed, which is part of the Rock River drainage basin. The lake is approximately 1,000 acres in size and is a popular destination for fishing, swimming, and boating.
The area around Lake Ripley was first settled in the early 1800s by settlers from New England. The first settlers were primarily farmers, but the area soon became a popular destination for vacationers and fishermen. The lake was named after a local settler, William Ripley, who was the first to settle in the area.
The town of Lake Ripley was officially established in 1856. The town was named after the lake, and the lake was named after William Ripley. The town was primarily a farming community, but it also had a few small businesses, such as a general store and a blacksmith shop.
In the late 1800s, the town began to grow and develop. The first school was built in 1876, and the first church was built in 1877. The town also had a post office, which was established in 1878.
In the early 1900s, the town began to attract more visitors. The first hotel was built in 1906, and the first golf course was built in 1908. The town also had a movie theater, which opened in 1910.
The town continued to grow and develop throughout the 20th century. In the 1950s, the town was home to a popular amusement park, which was open until the 1970s. The town also had a popular beach, which was open until the 1980s.
Today, Lake Ripley is a small, unincorporated community. The town is still primarily a farming community, but it also has a few small businesses, such as a general store and a few restaurants. The town is also home to a popular golf course and a popular beach.
Geography
Lake Ripley is located in Jefferson County, Wisconsin. The town is situated on the western shore of Lake Ripley, a small lake of the same name. The lake is approximately 1,000 acres in size and is a popular destination for fishing, swimming, and boating.
The town is located in the Koshkonong Creek watershed, which is part of the Rock River drainage basin. The town is surrounded by rolling hills and farmland. The town is located approximately 25 miles west of Madison, Wisconsin.
Economy
The economy of Lake Ripley is primarily based on agriculture. The town is home to several farms, which produce a variety of crops, including corn, soybeans, and hay. The town also has a few small businesses, such as a general store and a few restaurants.
The town is also home to a popular golf course and a popular beach. These attractions bring in visitors from all over the region, which helps to boost the local economy.
Demographics
As of the 2010 census, the population of Lake Ripley was 1,093. The town has a total area of 1.2 square miles, all of which is land. The town has a population density of 890 people per square mile.
The racial makeup of the town is 97.3% White, 0.7% African American, 0.2% Native American, 0.2% Asian, 0.1% Pacific Islander, 0.7% from other races, and 0.9% from two or more races. Hispanic or Latino of any race were 1.3% of the population.
The median income for a household in the town was $50,000, and the median income for a family was $54,000. The per capita income for the town was $21,000. About 8.3% of families and 10.2% of the population were below the poverty line, including 14.3% of those under age 18 and 5.3% of those age 65 or over.
Common Questions
What is Per Capita Income in Lake Ripley?
Per Capita income in Lake Ripley is $57,118.
What is the Median Family Income in Lake Ripley?
Median Family Income in Lake Ripley is $135,170.
What is the Median Household income in Lake Ripley?
Median Household Income in Lake Ripley is $118,478.
What is Income or Wage Gap in Lake Ripley?
Income or Wage Gap in Lake Ripley is 26.2%.
Women in Lake Ripley earn 73.8 cents for every dollar earned by a man.
What is Inequality or Gini Index in Lake Ripley?
Inequality or Gini Index in Lake Ripley is 0.44.
What is the Total Population of Lake Ripley?
Total Population of Lake Ripley is 1,982.
What is the Total Male Population of Lake Ripley?
Total Male Population of Lake Ripley is 870.
What is the Total Female Population of Lake Ripley?
Total Female Population of Lake Ripley is 1,112.
What is the Ratio of Males per 100 Females in Lake Ripley?
There are 78.24 Males per 100 Females in Lake Ripley.
What is the Ratio of Females per 100 Males in Lake Ripley?
There are 127.82 Females per 100 Males in Lake Ripley.
What is the Median Population Age in Lake Ripley?
Median Population Age in Lake Ripley is 51.8 Years.
What is the Average Family Size in Lake Ripley
Average Family Size in Lake Ripley is 2.9 People.
What is the Average Household Size in Lake Ripley
Average Household Size in Lake Ripley is 2.5 People.
How Large is the Labor Force in Lake Ripley?
There are 1,145 People in the Labor Forcein in Lake Ripley.
What is the Percentage of People in the Labor Force in Lake Ripley?
68.5% of People are in the Labor Force in Lake Ripley.
What is the Unemployment Rate in Lake Ripley?
Unemployment Rate in Lake Ripley is 7.2%.