Potter Lake, WI Map & Demographics
Potter Lake Map
Potter Lake Overview
$45,234
PER CAPITA INCOME
$97,596
AVG FAMILY INCOME
$89,447
AVG HOUSEHOLD INCOME
44.1%
WAGE / INCOME GAP [ % ]
55.9¢/ $1
WAGE / INCOME GAP [ $ ]
0.29
INEQUALITY / GINI INDEX
879
TOTAL POPULATION
450
MALE POPULATION
429
FEMALE POPULATION
104.90
MALES / 100 FEMALES
95.33
FEMALES / 100 MALES
40.9
MEDIAN AGE
2.7
AVG FAMILY SIZE
2.4
AVG HOUSEHOLD SIZE
452
LABOR FORCE [ PEOPLE ]
67.2%
PERCENT IN LABOR FORCE
Income in Potter Lake
Income Overview in Potter Lake
Per Capita Income in Potter Lake is $45,234, while median incomes of families and households are $97,596 and $89,447 respectively.
| Characteristic | Number | Measure |
| Per Capita Income | 879 | $45,234 |
| Median Family Income | 275 | $97,596 |
| Mean Family Income | 275 | $113,828 |
| Median Household Income | 361 | $89,447 |
| Mean Household Income | 361 | $111,624 |
| Income Deficit | 275 | $0 |
| Wage / Income Gap (%) | 879 | 44.08% |
| Wage / Income Gap ($) | 879 | 55.92¢ per $1 |
| Gini / Inequality Index | 879 | 0.29 |
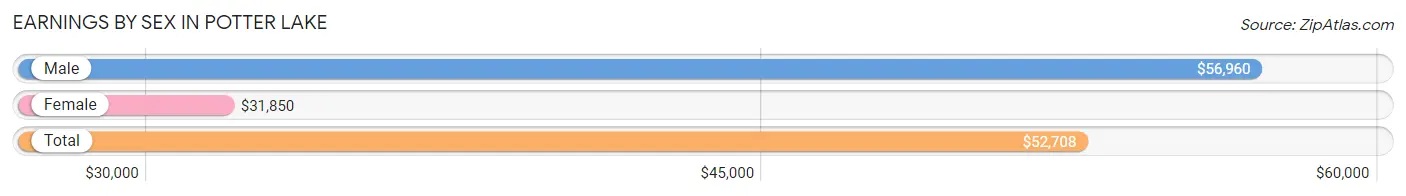
Earnings by Sex in Potter Lake
Average Earnings in Potter Lake are $52,708, $56,960 for men and $31,850 for women, a difference of 44.1%.
| Sex | Number | Average Earnings |
| Male | 247 (51.3%) | $56,960 |
| Female | 234 (48.6%) | $31,850 |
| Total | 481 (100.0%) | $52,708 |
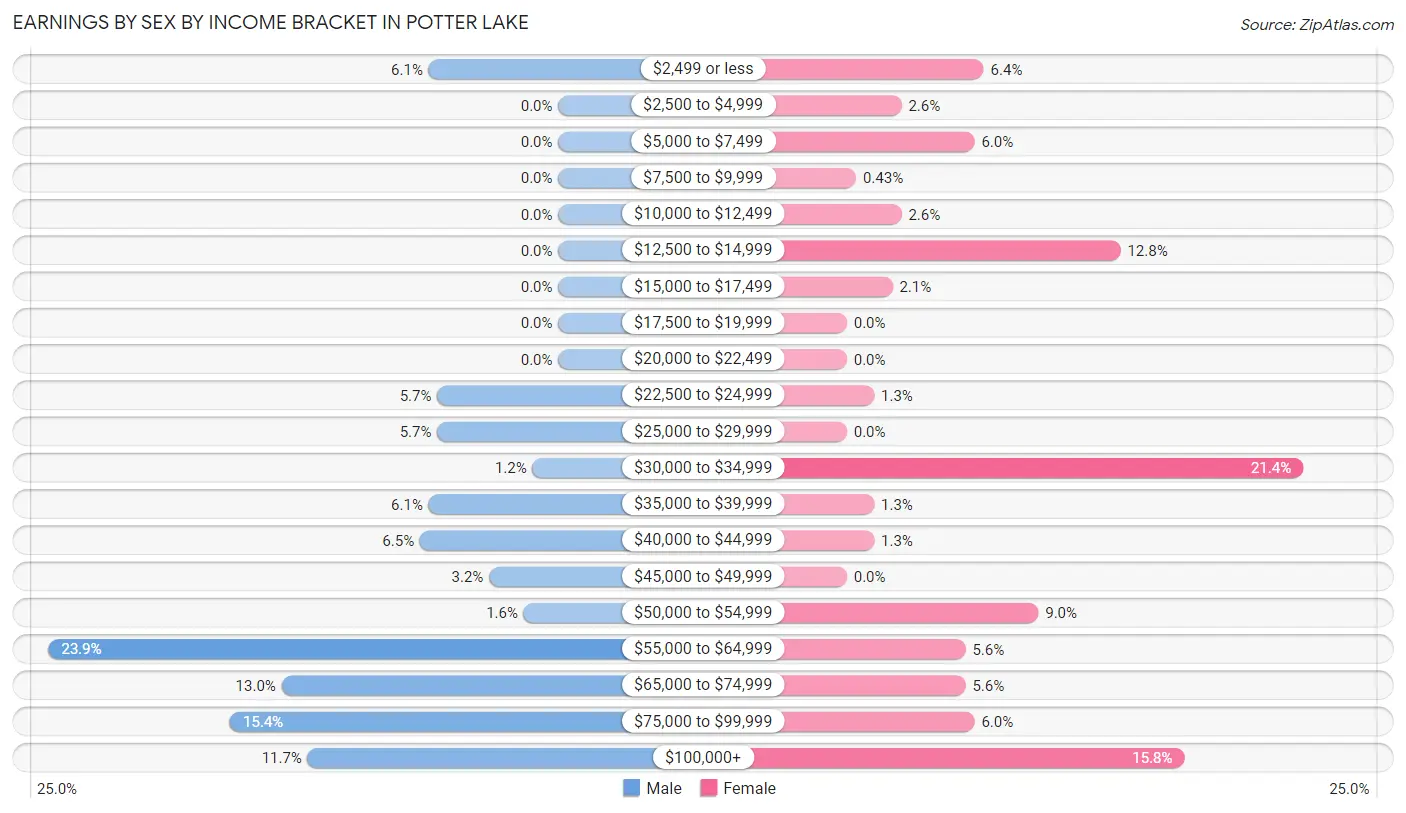
Earnings by Sex by Income Bracket in Potter Lake
The most common earnings brackets in Potter Lake are $55,000 to $64,999 for men (59 | 23.9%) and $30,000 to $34,999 for women (50 | 21.4%).
| Income | Male | Female |
| $2,499 or less | 15 (6.1%) | 15 (6.4%) |
| $2,500 to $4,999 | 0 (0.0%) | 6 (2.6%) |
| $5,000 to $7,499 | 0 (0.0%) | 14 (6.0%) |
| $7,500 to $9,999 | 0 (0.0%) | 1 (0.4%) |
| $10,000 to $12,499 | 0 (0.0%) | 6 (2.6%) |
| $12,500 to $14,999 | 0 (0.0%) | 30 (12.8%) |
| $15,000 to $17,499 | 0 (0.0%) | 5 (2.1%) |
| $17,500 to $19,999 | 0 (0.0%) | 0 (0.0%) |
| $20,000 to $22,499 | 0 (0.0%) | 0 (0.0%) |
| $22,500 to $24,999 | 14 (5.7%) | 3 (1.3%) |
| $25,000 to $29,999 | 14 (5.7%) | 0 (0.0%) |
| $30,000 to $34,999 | 3 (1.2%) | 50 (21.4%) |
| $35,000 to $39,999 | 15 (6.1%) | 3 (1.3%) |
| $40,000 to $44,999 | 16 (6.5%) | 3 (1.3%) |
| $45,000 to $49,999 | 8 (3.2%) | 0 (0.0%) |
| $50,000 to $54,999 | 4 (1.6%) | 21 (9.0%) |
| $55,000 to $64,999 | 59 (23.9%) | 13 (5.6%) |
| $65,000 to $74,999 | 32 (13.0%) | 13 (5.6%) |
| $75,000 to $99,999 | 38 (15.4%) | 14 (6.0%) |
| $100,000+ | 29 (11.7%) | 37 (15.8%) |
| Total | 247 (100.0%) | 234 (100.0%) |
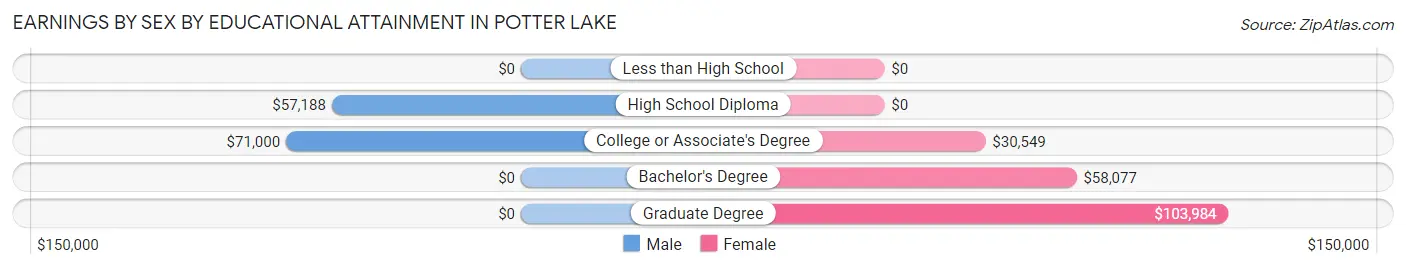
Earnings by Sex by Educational Attainment in Potter Lake
Average earnings in Potter Lake are $57,131 for men and $31,995 for women, a difference of 44.0%. Men with an educational attainment of college or associate's degree enjoy the highest average annual earnings of $71,000, while those with high school diploma education earn the least with $57,188. Women with an educational attainment of graduate degree earn the most with the average annual earnings of $103,984, while those with college or associate's degree education have the smallest earnings of $30,549.
| Educational Attainment | Male Income | Female Income |
| Less than High School | - | - |
| High School Diploma | $57,188 | $0 |
| College or Associate's Degree | $71,000 | $30,549 |
| Bachelor's Degree | - | - |
| Graduate Degree | - | - |
| Total | $57,131 | $31,995 |
Family Income in Potter Lake
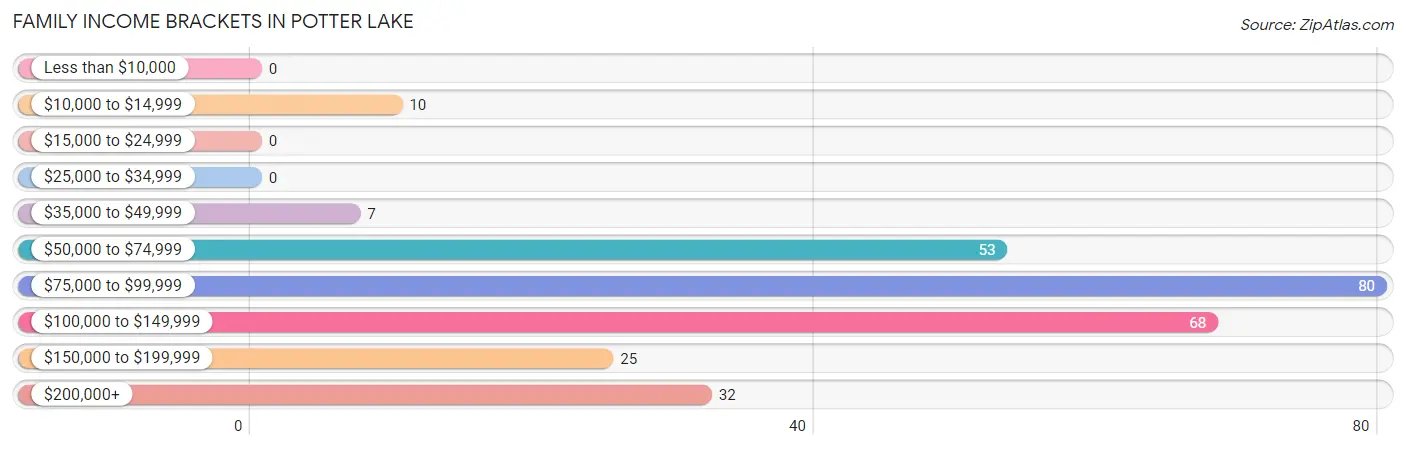
Family Income Brackets in Potter Lake
According to the Potter Lake family income data, there are 80 families falling into the $75,000 to $99,999 income range, which is the most common income bracket and makes up 29.1% of all families.
| Income Bracket | # Families | % Families |
| Less than $10,000 | 0 | 0.0% |
| $10,000 to $14,999 | 10 | 3.6% |
| $15,000 to $24,999 | 0 | 0.0% |
| $25,000 to $34,999 | 0 | 0.0% |
| $35,000 to $49,999 | 7 | 2.5% |
| $50,000 to $74,999 | 53 | 19.3% |
| $75,000 to $99,999 | 80 | 29.1% |
| $100,000 to $149,999 | 68 | 24.7% |
| $150,000 to $199,999 | 25 | 9.1% |
| $200,000+ | 32 | 11.6% |
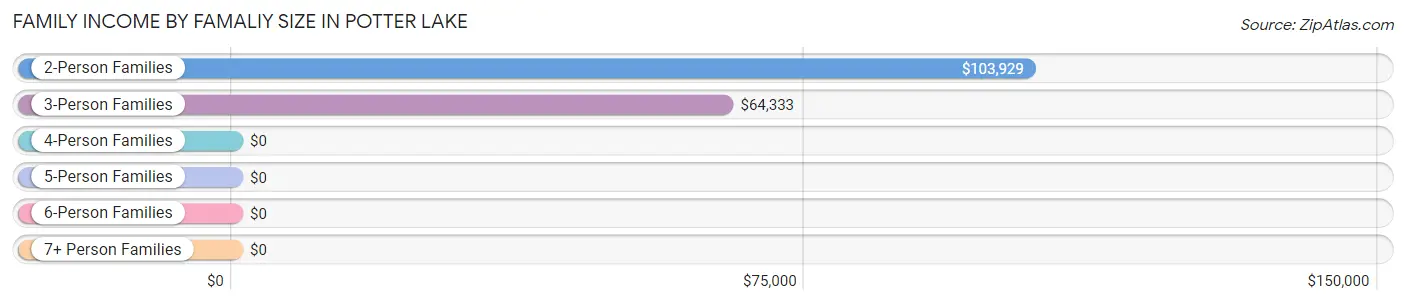
Family Income by Famaliy Size in Potter Lake
2-person families (128 | 46.6%) account for the highest median family income in Potter Lake with $103,929 per family, while 2-person families (128 | 46.6%) have the highest median income of $51,964 per family member.
| Income Bracket | # Families | Median Income |
| 2-Person Families | 128 (46.6%) | $103,929 |
| 3-Person Families | 42 (15.3%) | $64,333 |
| 4-Person Families | 103 (37.4%) | $0 |
| 5-Person Families | 2 (0.7%) | $0 |
| 6-Person Families | 0 (0.0%) | $0 |
| 7+ Person Families | 0 (0.0%) | $0 |
| Total | 275 (100.0%) | $97,596 |
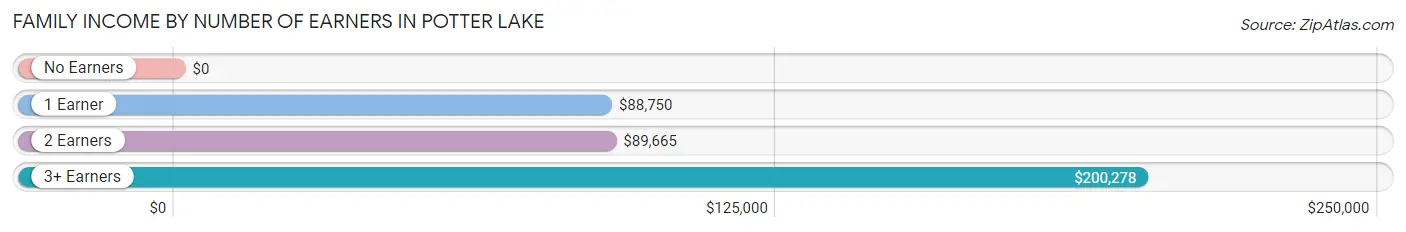
Family Income by Number of Earners in Potter Lake
| Number of Earners | # Families | Median Income |
| No Earners | 17 (6.2%) | $0 |
| 1 Earner | 137 (49.8%) | $88,750 |
| 2 Earners | 81 (29.4%) | $89,665 |
| 3+ Earners | 40 (14.5%) | $200,278 |
| Total | 275 (100.0%) | $97,596 |
Household Income in Potter Lake
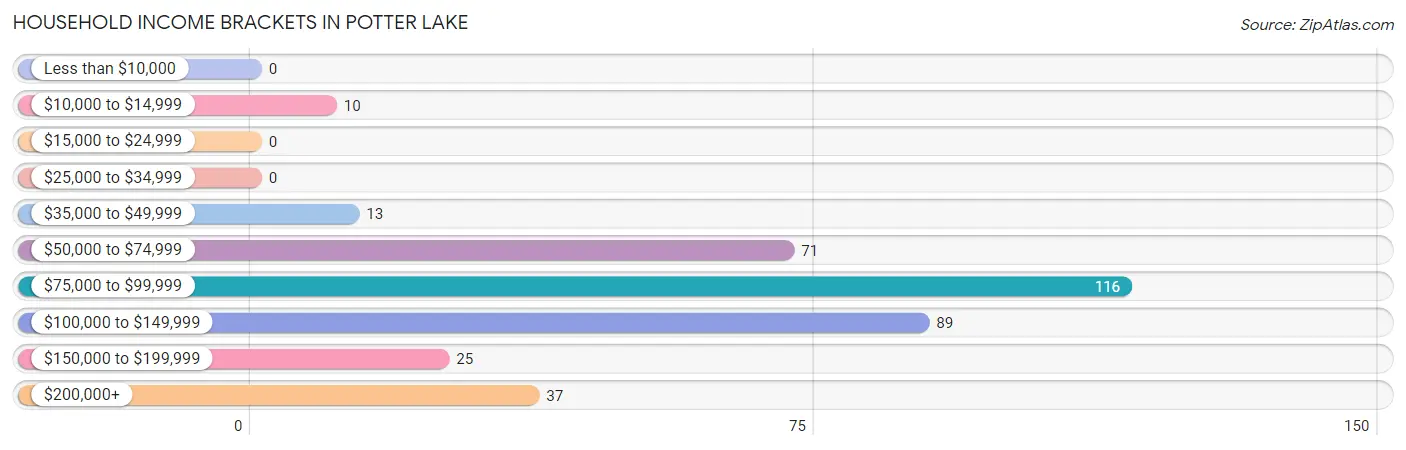
Household Income Brackets in Potter Lake
With 116 households falling in the category, the $75,000 to $99,999 income range is the most frequent in Potter Lake, accounting for 32.1% of all households.
| Income Bracket | # Households | % Households |
| Less than $10,000 | 0 | 0.0% |
| $10,000 to $14,999 | 10 | 2.8% |
| $15,000 to $24,999 | 0 | 0.0% |
| $25,000 to $34,999 | 0 | 0.0% |
| $35,000 to $49,999 | 13 | 3.6% |
| $50,000 to $74,999 | 71 | 19.7% |
| $75,000 to $99,999 | 116 | 32.1% |
| $100,000 to $149,999 | 89 | 24.7% |
| $150,000 to $199,999 | 25 | 6.9% |
| $200,000+ | 37 | 10.2% |
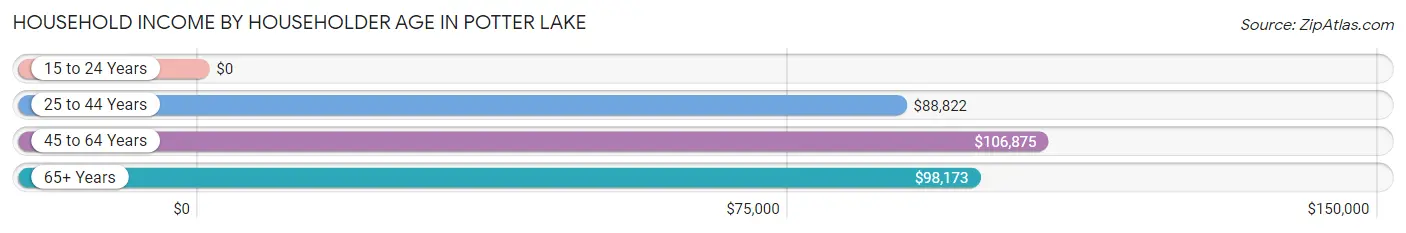
Household Income by Householder Age in Potter Lake
The median household income in Potter Lake is $89,447, with the highest median household income of $106,875 found in the 45 to 64 years age bracket for the primary householder. A total of 107 households (29.6%) fall into this category.
| Income Bracket | # Households | Median Income |
| 15 to 24 Years | 0 (0.0%) | $0 |
| 25 to 44 Years | 125 (34.6%) | $88,822 |
| 45 to 64 Years | 107 (29.6%) | $106,875 |
| 65+ Years | 129 (35.7%) | $98,173 |
| Total | 361 (100.0%) | $89,447 |
Poverty in Potter Lake
Income Below Poverty by Sex and Age in Potter Lake
With 2.0% poverty level for males and 10.3% for females among the residents of Potter Lake, 6 to 11 year old males and 15 year old females are the most vulnerable to poverty, with 9 males (37.5%) and 9 females (64.3%) in their respective age groups living below the poverty level.
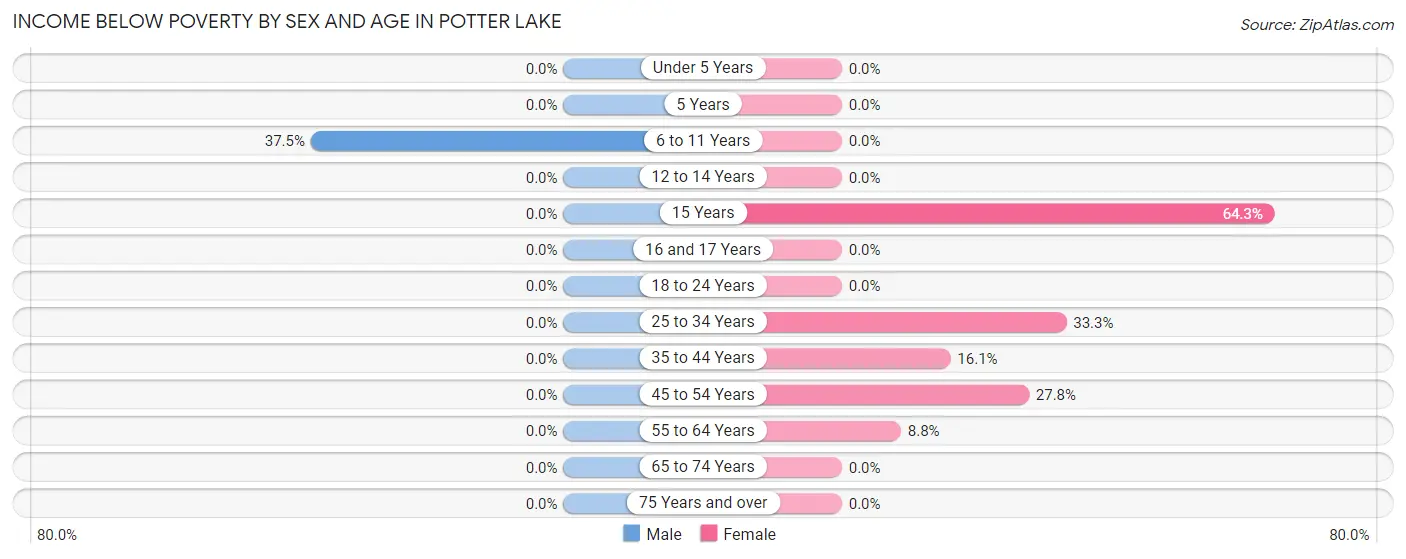
| Age Bracket | Male | Female |
| Under 5 Years | 0 (0.0%) | 0 (0.0%) |
| 5 Years | 0 (0.0%) | 0 (0.0%) |
| 6 to 11 Years | 9 (37.5%) | 0 (0.0%) |
| 12 to 14 Years | 0 (0.0%) | 0 (0.0%) |
| 15 Years | 0 (0.0%) | 9 (64.3%) |
| 16 and 17 Years | 0 (0.0%) | 0 (0.0%) |
| 18 to 24 Years | 0 (0.0%) | 0 (0.0%) |
| 25 to 34 Years | 0 (0.0%) | 5 (33.3%) |
| 35 to 44 Years | 0 (0.0%) | 15 (16.1%) |
| 45 to 54 Years | 0 (0.0%) | 10 (27.8%) |
| 55 to 64 Years | 0 (0.0%) | 5 (8.8%) |
| 65 to 74 Years | 0 (0.0%) | 0 (0.0%) |
| 75 Years and over | 0 (0.0%) | 0 (0.0%) |
| Total | 9 (2.0%) | 44 (10.3%) |
Income Above Poverty by Sex and Age in Potter Lake
According to the poverty statistics in Potter Lake, males aged under 5 years and females aged under 5 years are the age groups that are most secure financially, with 100.0% of males and 100.0% of females in these age groups living above the poverty line.
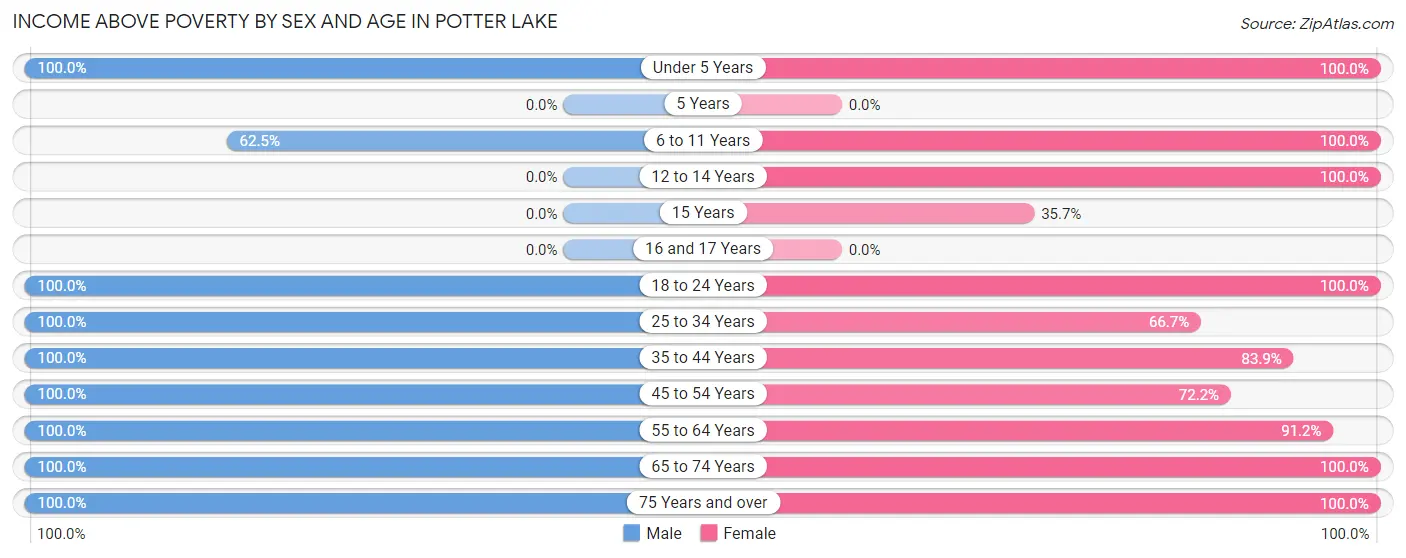
| Age Bracket | Male | Female |
| Under 5 Years | 74 (100.0%) | 25 (100.0%) |
| 5 Years | 0 (0.0%) | 0 (0.0%) |
| 6 to 11 Years | 15 (62.5%) | 52 (100.0%) |
| 12 to 14 Years | 0 (0.0%) | 17 (100.0%) |
| 15 Years | 0 (0.0%) | 5 (35.7%) |
| 16 and 17 Years | 0 (0.0%) | 0 (0.0%) |
| 18 to 24 Years | 6 (100.0%) | 25 (100.0%) |
| 25 to 34 Years | 40 (100.0%) | 10 (66.7%) |
| 35 to 44 Years | 77 (100.0%) | 78 (83.9%) |
| 45 to 54 Years | 45 (100.0%) | 26 (72.2%) |
| 55 to 64 Years | 56 (100.0%) | 52 (91.2%) |
| 65 to 74 Years | 82 (100.0%) | 75 (100.0%) |
| 75 Years and over | 46 (100.0%) | 20 (100.0%) |
| Total | 441 (98.0%) | 385 (89.7%) |
Income Below Poverty Among Married-Couple Families in Potter Lake
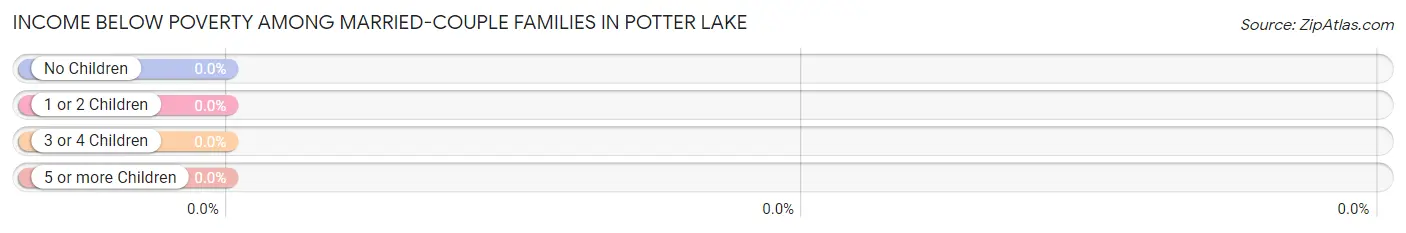
| Children | Above Poverty | Below Poverty |
| No Children | 127 (100.0%) | 0 (0.0%) |
| 1 or 2 Children | 86 (100.0%) | 0 (0.0%) |
| 3 or 4 Children | 0 (0.0%) | 0 (0.0%) |
| 5 or more Children | 0 (0.0%) | 0 (0.0%) |
| Total | 213 (100.0%) | 0 (0.0%) |
Income Below Poverty Among Single-Parent Households in Potter Lake
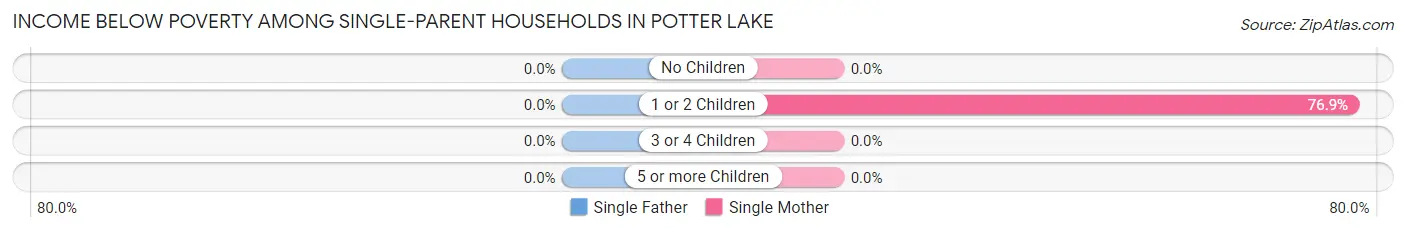
| Children | Single Father | Single Mother |
| No Children | 0 (0.0%) | 0 (0.0%) |
| 1 or 2 Children | 0 (0.0%) | 10 (76.9%) |
| 3 or 4 Children | 0 (0.0%) | 0 (0.0%) |
| 5 or more Children | 0 (0.0%) | 0 (0.0%) |
| Total | 0 (0.0%) | 10 (27.8%) |
Income Below Poverty Among Married-Couple vs Single-Parent Households in Potter Lake
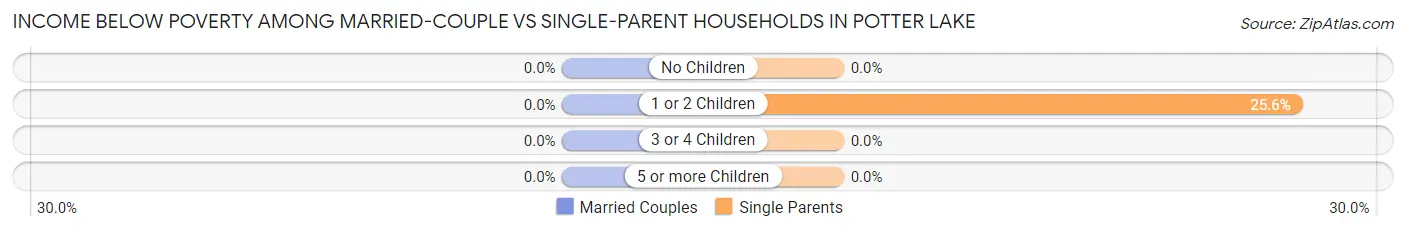
| Children | Married-Couple Families | Single-Parent Households |
| No Children | 0 (0.0%) | 0 (0.0%) |
| 1 or 2 Children | 0 (0.0%) | 10 (25.6%) |
| 3 or 4 Children | 0 (0.0%) | 0 (0.0%) |
| 5 or more Children | 0 (0.0%) | 0 (0.0%) |
| Total | 0 (0.0%) | 10 (16.1%) |
Race in Potter Lake
The most populous races in Potter Lake are White / Caucasian (779 | 88.6%), Two or more Races (100 | 11.4%), and Hispanic or Latino (87 | 9.9%).
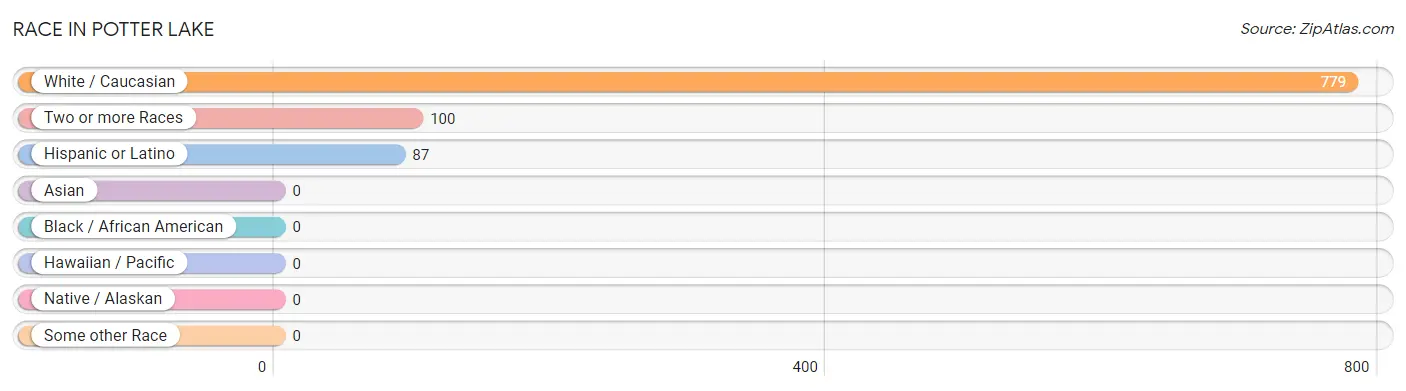
| Race | # Population | % Population |
| Asian | 0 | 0.0% |
| Black / African American | 0 | 0.0% |
| Hawaiian / Pacific | 0 | 0.0% |
| Hispanic or Latino | 87 | 9.9% |
| Native / Alaskan | 0 | 0.0% |
| White / Caucasian | 779 | 88.6% |
| Two or more Races | 100 | 11.4% |
| Some other Race | 0 | 0.0% |
| Total | 879 | 100.0% |
Ancestry in Potter Lake
The most populous ancestries reported in Potter Lake are German (526 | 59.8%), Polish (185 | 21.0%), Irish (119 | 13.5%), Mexican (67 | 7.6%), and French (56 | 6.4%), together accounting for 108.4% of all Potter Lake residents.
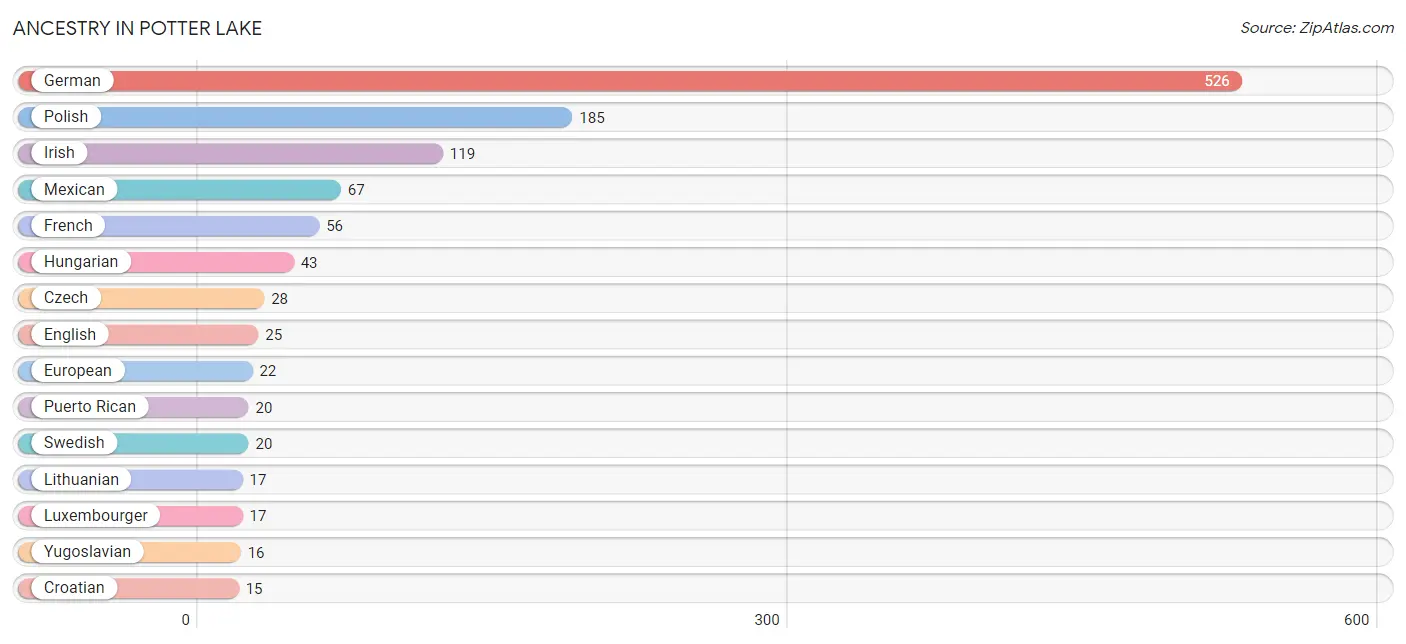
| Ancestry | # Population | % Population |
| Austrian | 1 | 0.1% |
| Croatian | 15 | 1.7% |
| Czech | 28 | 3.2% |
| Czechoslovakian | 11 | 1.3% |
| Dutch | 6 | 0.7% |
| English | 25 | 2.8% |
| European | 22 | 2.5% |
| French | 56 | 6.4% |
| French Canadian | 1 | 0.1% |
| German | 526 | 59.8% |
| Greek | 2 | 0.2% |
| Hungarian | 43 | 4.9% |
| Irish | 119 | 13.5% |
| Italian | 14 | 1.6% |
| Lithuanian | 17 | 1.9% |
| Luxembourger | 17 | 1.9% |
| Mexican | 67 | 7.6% |
| Northern European | 6 | 0.7% |
| Norwegian | 12 | 1.4% |
| Polish | 185 | 21.0% |
| Puerto Rican | 20 | 2.3% |
| Scottish | 1 | 0.1% |
| Swedish | 20 | 2.3% |
| Swiss | 10 | 1.1% |
| Yugoslavian | 16 | 1.8% | View All 25 Rows |
Immigrants in Potter Lake

| Immigration Origin | # Population | % Population | View All 0 Rows |
Sex and Age in Potter Lake
Sex and Age in Potter Lake
The most populous age groups in Potter Lake are 65 to 69 Years (80 | 17.8%) for men and 35 to 39 Years (77 | 17.9%) for women.
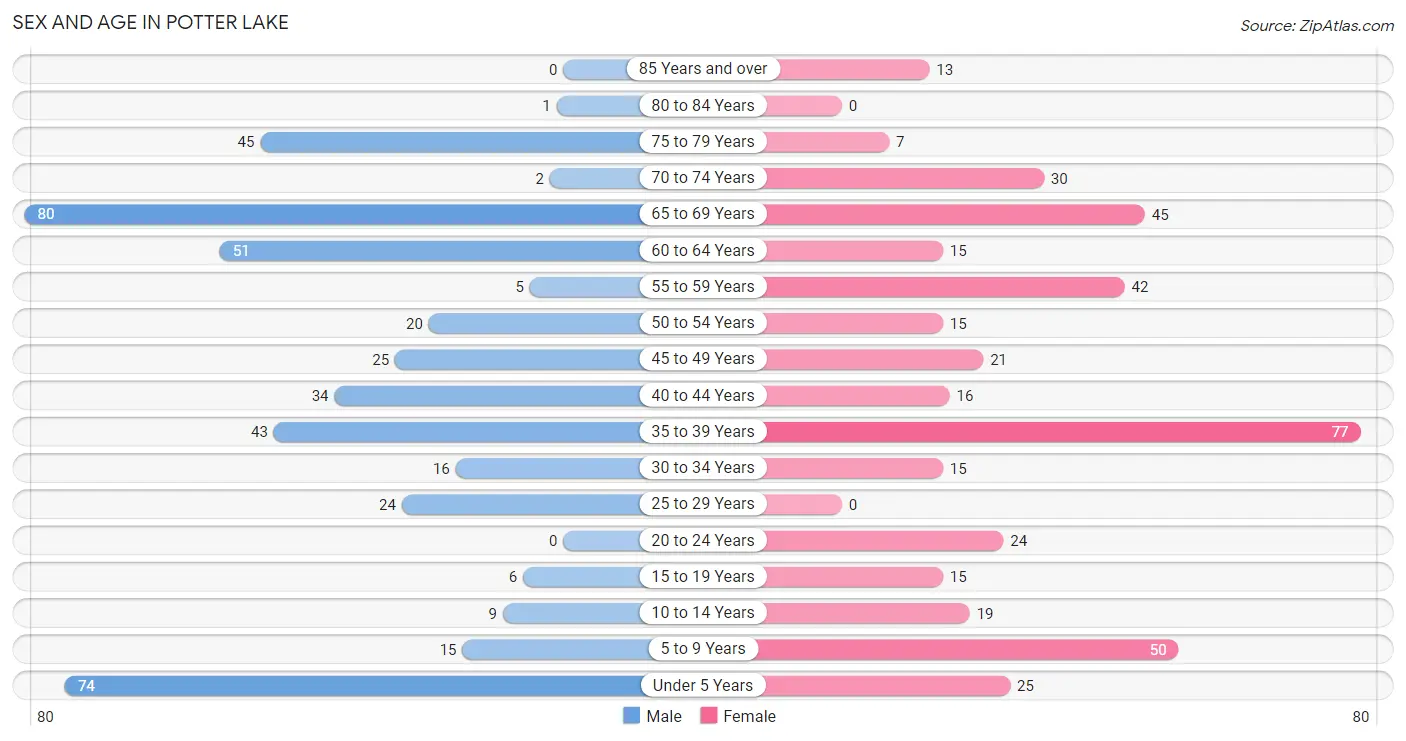
| Age Bracket | Male | Female |
| Under 5 Years | 74 (16.4%) | 25 (5.8%) |
| 5 to 9 Years | 15 (3.3%) | 50 (11.7%) |
| 10 to 14 Years | 9 (2.0%) | 19 (4.4%) |
| 15 to 19 Years | 6 (1.3%) | 15 (3.5%) |
| 20 to 24 Years | 0 (0.0%) | 24 (5.6%) |
| 25 to 29 Years | 24 (5.3%) | 0 (0.0%) |
| 30 to 34 Years | 16 (3.6%) | 15 (3.5%) |
| 35 to 39 Years | 43 (9.6%) | 77 (17.9%) |
| 40 to 44 Years | 34 (7.6%) | 16 (3.7%) |
| 45 to 49 Years | 25 (5.6%) | 21 (4.9%) |
| 50 to 54 Years | 20 (4.4%) | 15 (3.5%) |
| 55 to 59 Years | 5 (1.1%) | 42 (9.8%) |
| 60 to 64 Years | 51 (11.3%) | 15 (3.5%) |
| 65 to 69 Years | 80 (17.8%) | 45 (10.5%) |
| 70 to 74 Years | 2 (0.4%) | 30 (7.0%) |
| 75 to 79 Years | 45 (10.0%) | 7 (1.6%) |
| 80 to 84 Years | 1 (0.2%) | 0 (0.0%) |
| 85 Years and over | 0 (0.0%) | 13 (3.0%) |
| Total | 450 (100.0%) | 429 (100.0%) |
Families and Households in Potter Lake
Median Family Size in Potter Lake
The median family size in Potter Lake is 2.73 persons per family, with single female/mother families (36 | 13.1%) accounting for the largest median family size of 4.03 persons per family. On the other hand, married-couple families (213 | 77.4%) represent the smallest median family size with 2.54 persons per family.
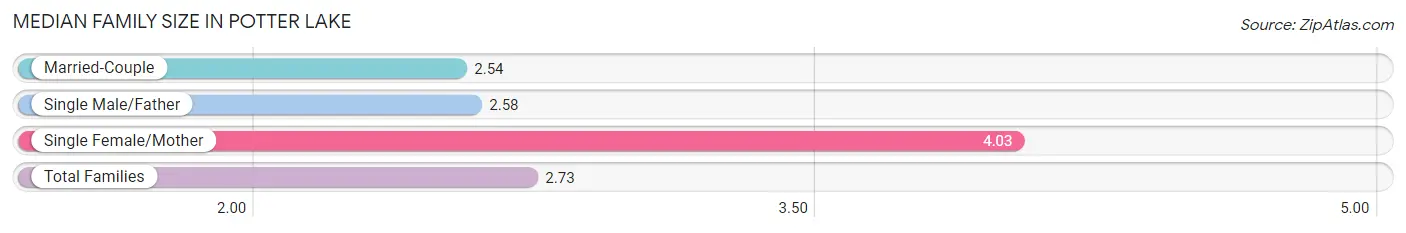
| Family Type | # Families | Family Size |
| Married-Couple | 213 (77.4%) | 2.54 |
| Single Male/Father | 26 (9.5%) | 2.58 |
| Single Female/Mother | 36 (13.1%) | 4.03 |
| Total Families | 275 (100.0%) | 2.73 |
Median Household Size in Potter Lake
The median household size in Potter Lake is 2.43 persons per household, with single female/mother households (36 | 10.0%) accounting for the largest median household size of 4.03 persons per household. non-family households (86 | 23.8%) represent the smallest median household size with 1.30 persons per household.
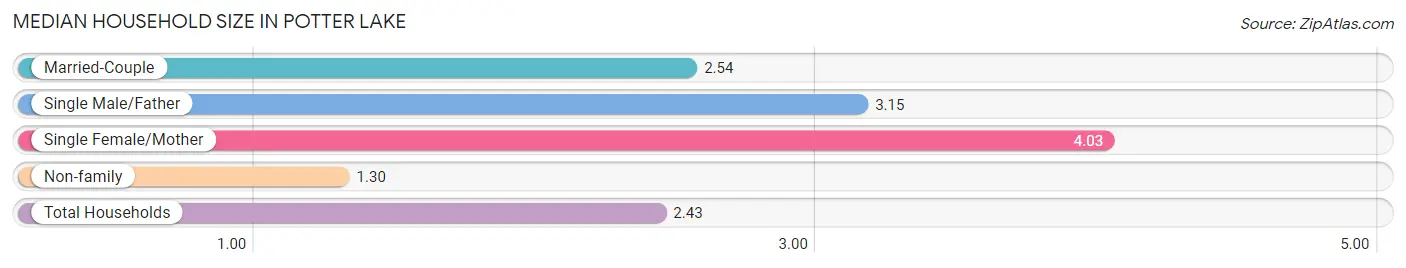
| Household Type | # Households | Household Size |
| Married-Couple | 213 (59.0%) | 2.54 |
| Single Male/Father | 26 (7.2%) | 3.15 |
| Single Female/Mother | 36 (10.0%) | 4.03 |
| Non-family | 86 (23.8%) | 1.30 |
| Total Households | 361 (100.0%) | 2.43 |
Household Size by Marriage Status in Potter Lake
Out of a total of 361 households in Potter Lake, 275 (76.2%) are family households, while 86 (23.8%) are nonfamily households. The most numerous type of family households are 2-person households, comprising 128, and the most common type of nonfamily households are 1-person households, comprising 60.
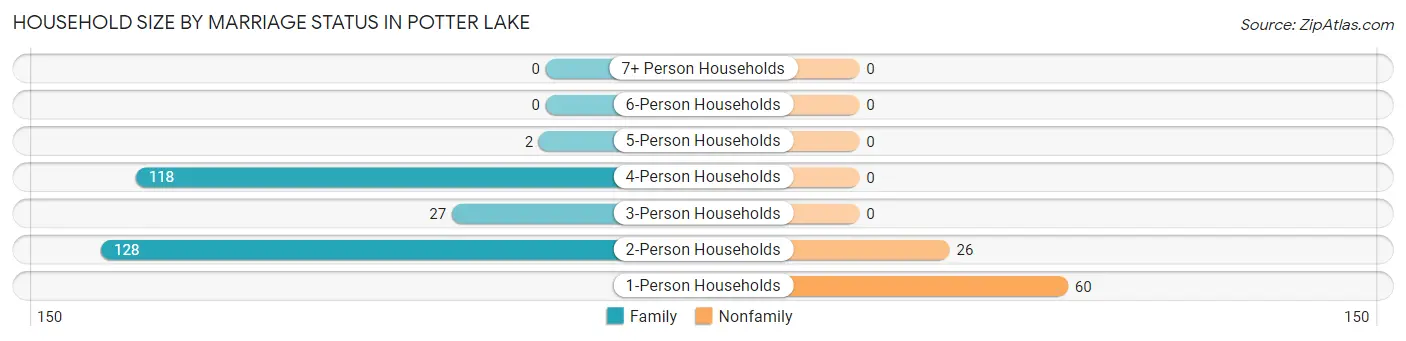
| Household Size | Family Households | Nonfamily Households |
| 1-Person Households | - | 60 (16.6%) |
| 2-Person Households | 128 (35.5%) | 26 (7.2%) |
| 3-Person Households | 27 (7.5%) | 0 (0.0%) |
| 4-Person Households | 118 (32.7%) | 0 (0.0%) |
| 5-Person Households | 2 (0.5%) | 0 (0.0%) |
| 6-Person Households | 0 (0.0%) | 0 (0.0%) |
| 7+ Person Households | 0 (0.0%) | 0 (0.0%) |
| Total | 275 (76.2%) | 86 (23.8%) |
Female Fertility in Potter Lake
Fertility by Age in Potter Lake
Average fertility rate in Potter Lake is 56.0 births per 1,000 women. Women in the age bracket of 20 to 34 years have the highest fertility rate with 256.0 births per 1,000 women. Women in the age bracket of 20 to 34 years acount for 100.0% of all women with births.
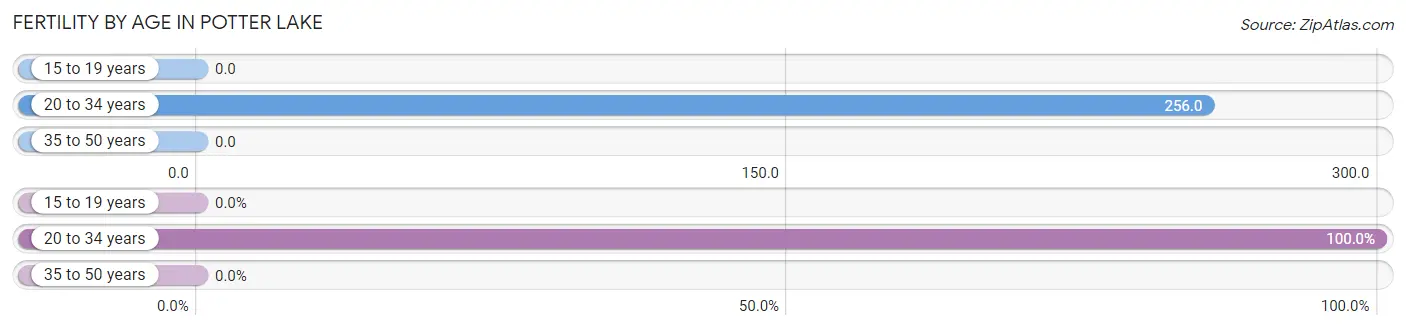
| Age Bracket | Women with Births | Births / 1,000 Women |
| 15 to 19 years | 0 (0.0%) | 0.0 |
| 20 to 34 years | 10 (100.0%) | 256.0 |
| 35 to 50 years | 0 (0.0%) | 0.0 |
| Total | 10 (100.0%) | 56.0 |
Fertility by Age by Marriage Status in Potter Lake
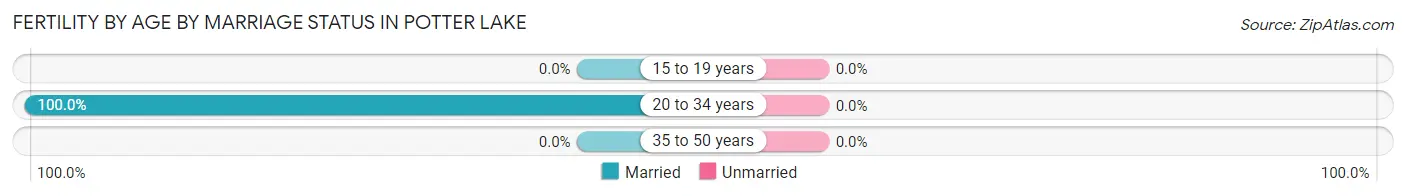
| Age Bracket | Married | Unmarried |
| 15 to 19 years | 0 (0.0%) | 0 (0.0%) |
| 20 to 34 years | 10 (100.0%) | 0 (0.0%) |
| 35 to 50 years | 0 (0.0%) | 0 (0.0%) |
| Total | 10 (100.0%) | 0 (0.0%) |
Fertility by Education in Potter Lake
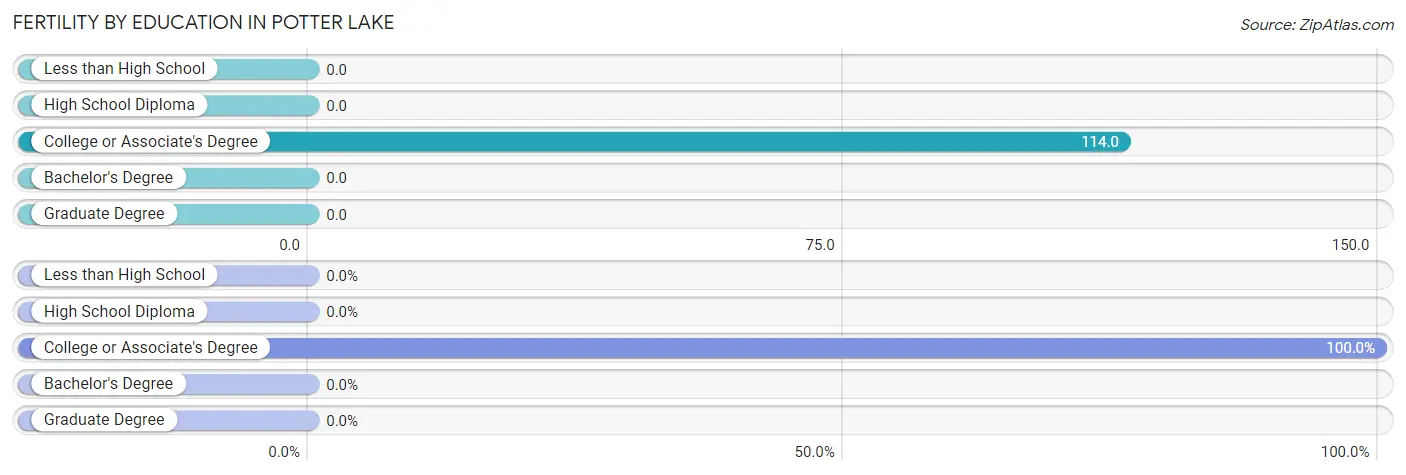
| Educational Attainment | Women with Births | Births / 1,000 Women |
| Less than High School | 0 (0.0%) | 0.0 |
| High School Diploma | 0 (0.0%) | 0.0 |
| College or Associate's Degree | 10 (100.0%) | 114.0 |
| Bachelor's Degree | 0 (0.0%) | 0.0 |
| Graduate Degree | 0 (0.0%) | 0.0 |
| Total | 10 (100.0%) | 56.0 |
Fertility by Education by Marriage Status in Potter Lake
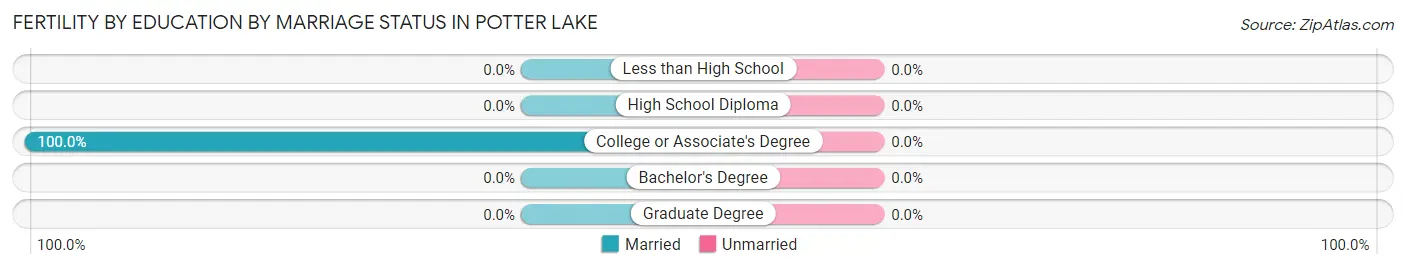
| Educational Attainment | Married | Unmarried |
| Less than High School | 0 (0.0%) | 0 (0.0%) |
| High School Diploma | 0 (0.0%) | 0 (0.0%) |
| College or Associate's Degree | 10 (100.0%) | 0 (0.0%) |
| Bachelor's Degree | 0 (0.0%) | 0 (0.0%) |
| Graduate Degree | 0 (0.0%) | 0 (0.0%) |
| Total | 10 (100.0%) | 0 (0.0%) |
Employment Characteristics in Potter Lake
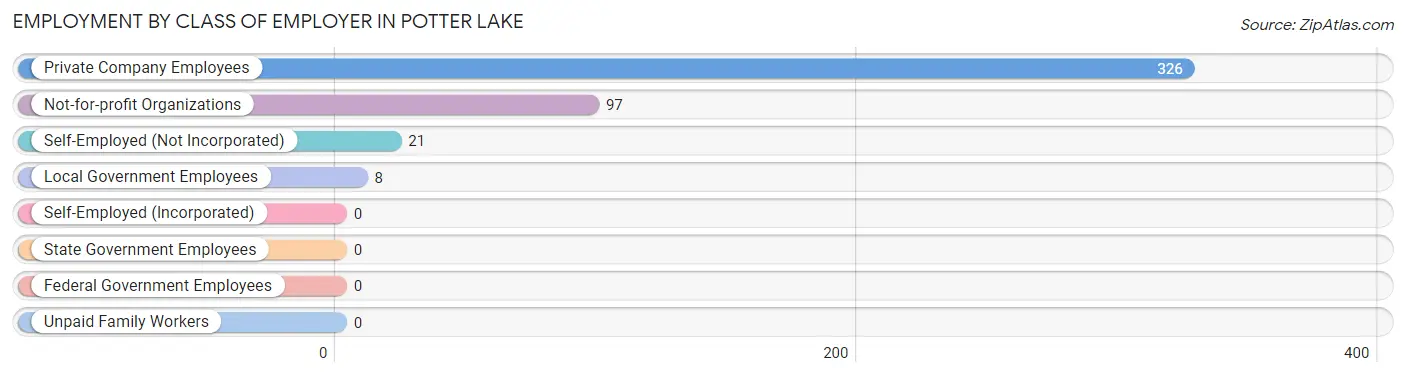
Employment by Class of Employer in Potter Lake
Among the 452 employed individuals in Potter Lake, private company employees (326 | 72.1%), not-for-profit organizations (97 | 21.5%), and self-employed (not incorporated) (21 | 4.6%) make up the most common classes of employment.
| Employer Class | # Employees | % Employees |
| Private Company Employees | 326 | 72.1% |
| Self-Employed (Incorporated) | 0 | 0.0% |
| Self-Employed (Not Incorporated) | 21 | 4.6% |
| Not-for-profit Organizations | 97 | 21.5% |
| Local Government Employees | 8 | 1.8% |
| State Government Employees | 0 | 0.0% |
| Federal Government Employees | 0 | 0.0% |
| Unpaid Family Workers | 0 | 0.0% |
| Total | 452 | 100.0% |
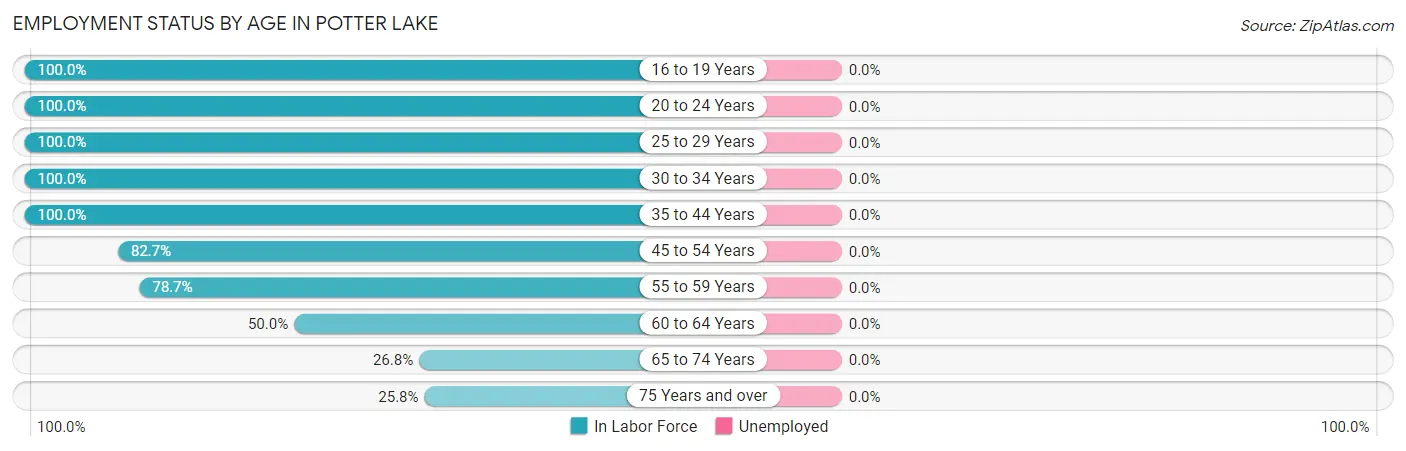
Employment Status by Age in Potter Lake
| Age Bracket | In Labor Force | Unemployed |
| 16 to 19 Years | 7 (100.0%) | 0 (0.0%) |
| 20 to 24 Years | 24 (100.0%) | 0 (0.0%) |
| 25 to 29 Years | 24 (100.0%) | 0 (0.0%) |
| 30 to 34 Years | 31 (100.0%) | 0 (0.0%) |
| 35 to 44 Years | 170 (100.0%) | 0 (0.0%) |
| 45 to 54 Years | 67 (82.7%) | 0 (0.0%) |
| 55 to 59 Years | 37 (78.7%) | 0 (0.0%) |
| 60 to 64 Years | 33 (50.0%) | 0 (0.0%) |
| 65 to 74 Years | 42 (26.8%) | 0 (0.0%) |
| 75 Years and over | 17 (25.8%) | 0 (0.0%) |
| Total | 452 (67.2%) | 0 (0.0%) |
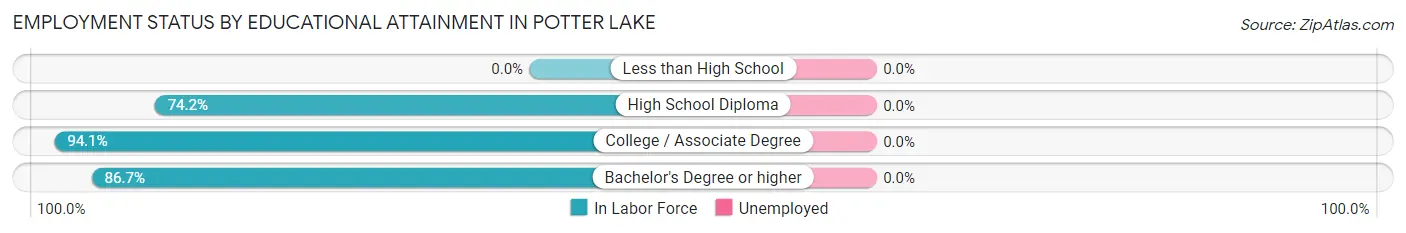
Employment Status by Educational Attainment in Potter Lake
| Educational Attainment | In Labor Force | Unemployed |
| Less than High School | 0 (0.0%) | 0 (0.0%) |
| High School Diploma | 89 (74.2%) | 0 (0.0%) |
| College / Associate Degree | 175 (94.1%) | 0 (0.0%) |
| Bachelor's Degree or higher | 98 (86.7%) | 0 (0.0%) |
| Total | 362 (86.4%) | 0 (0.0%) |
Employment Occupations by Sex in Potter Lake
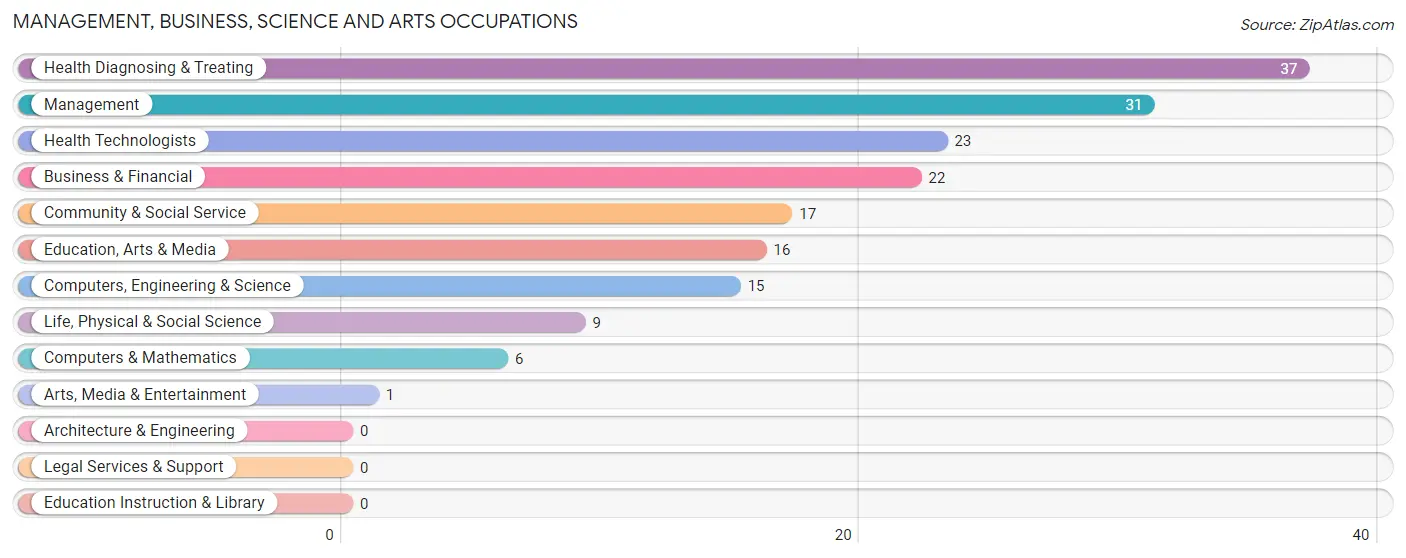
Management, Business, Science and Arts Occupations
The most common Management, Business, Science and Arts occupations in Potter Lake are Health Diagnosing & Treating (37 | 8.2%), Management (31 | 6.9%), Health Technologists (23 | 5.1%), Business & Financial (22 | 4.9%), and Community & Social Service (17 | 3.8%).
Management, Business, Science and Arts Occupations by Sex
Within the Management, Business, Science and Arts occupations in Potter Lake, the most male-oriented occupations are Computers, Engineering & Science (100.0%), Computers & Mathematics (100.0%), and Life, Physical & Social Science (100.0%), while the most female-oriented occupations are Business & Financial (100.0%), Health Technologists (100.0%), and Management (87.1%).
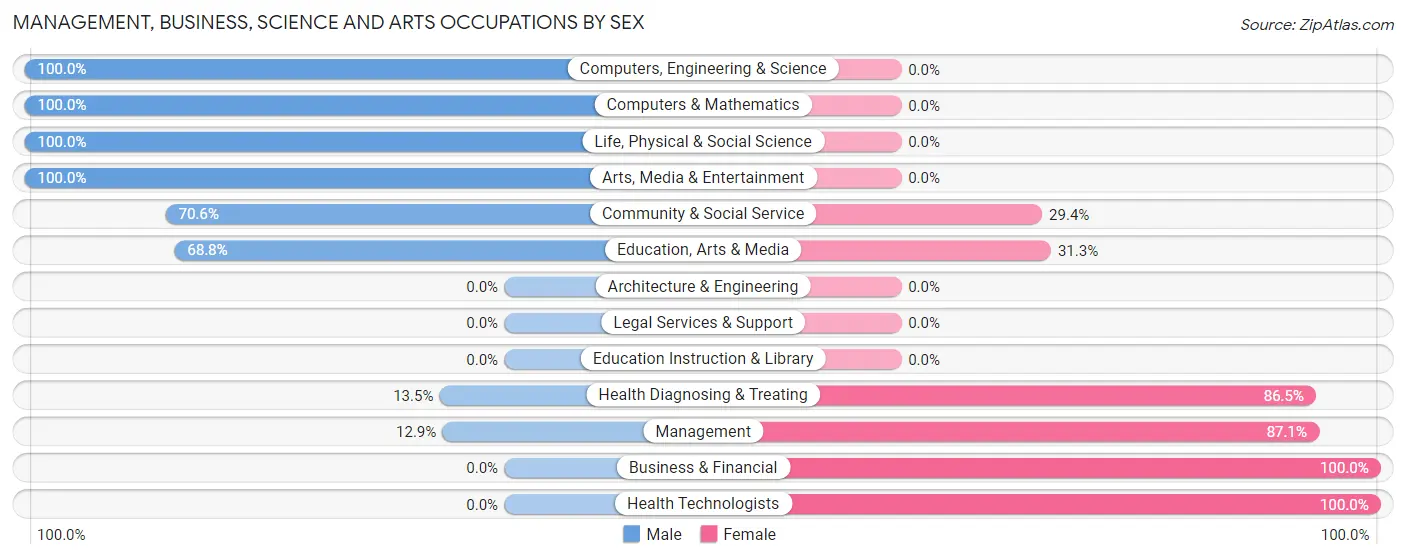
| Occupation | Male | Female |
| Management | 4 (12.9%) | 27 (87.1%) |
| Business & Financial | 0 (0.0%) | 22 (100.0%) |
| Computers, Engineering & Science | 15 (100.0%) | 0 (0.0%) |
| Computers & Mathematics | 6 (100.0%) | 0 (0.0%) |
| Architecture & Engineering | 0 (0.0%) | 0 (0.0%) |
| Life, Physical & Social Science | 9 (100.0%) | 0 (0.0%) |
| Community & Social Service | 12 (70.6%) | 5 (29.4%) |
| Education, Arts & Media | 11 (68.8%) | 5 (31.2%) |
| Legal Services & Support | 0 (0.0%) | 0 (0.0%) |
| Education Instruction & Library | 0 (0.0%) | 0 (0.0%) |
| Arts, Media & Entertainment | 1 (100.0%) | 0 (0.0%) |
| Health Diagnosing & Treating | 5 (13.5%) | 32 (86.5%) |
| Health Technologists | 0 (0.0%) | 23 (100.0%) |
| Total (Category) | 36 (29.5%) | 86 (70.5%) |
| Total (Overall) | 233 (51.5%) | 219 (48.4%) |
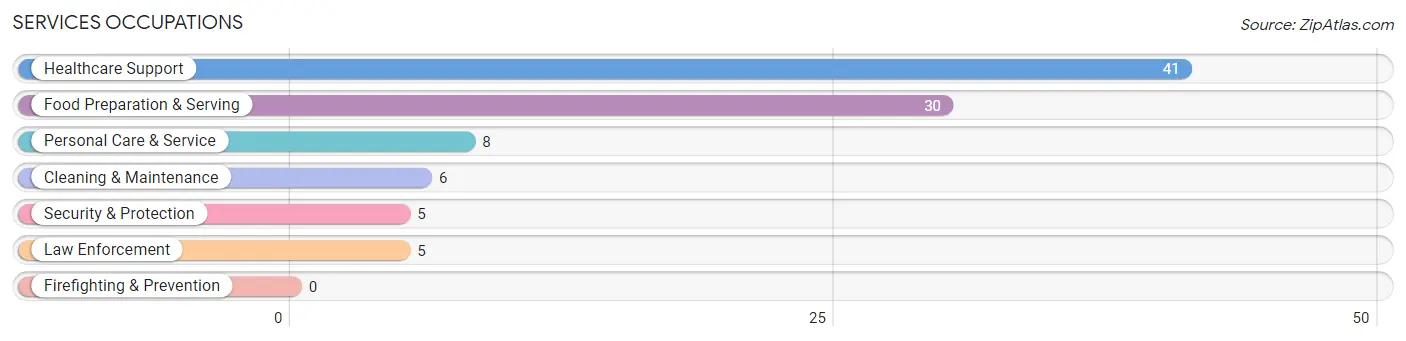
Services Occupations
The most common Services occupations in Potter Lake are Healthcare Support (41 | 9.1%), Food Preparation & Serving (30 | 6.6%), Personal Care & Service (8 | 1.8%), Cleaning & Maintenance (6 | 1.3%), and Security & Protection (5 | 1.1%).
Services Occupations by Sex
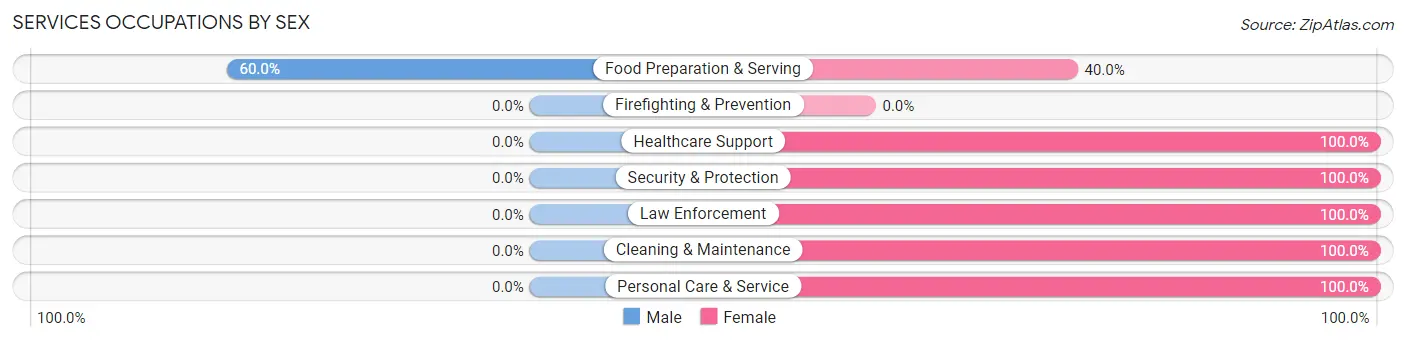
| Occupation | Male | Female |
| Healthcare Support | 0 (0.0%) | 41 (100.0%) |
| Security & Protection | 0 (0.0%) | 5 (100.0%) |
| Firefighting & Prevention | 0 (0.0%) | 0 (0.0%) |
| Law Enforcement | 0 (0.0%) | 5 (100.0%) |
| Food Preparation & Serving | 18 (60.0%) | 12 (40.0%) |
| Cleaning & Maintenance | 0 (0.0%) | 6 (100.0%) |
| Personal Care & Service | 0 (0.0%) | 8 (100.0%) |
| Total (Category) | 18 (20.0%) | 72 (80.0%) |
| Total (Overall) | 233 (51.5%) | 219 (48.4%) |
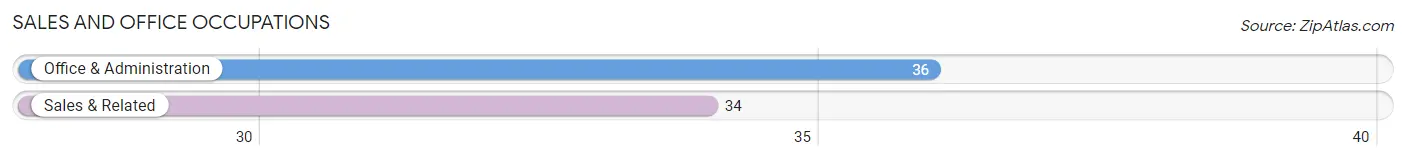
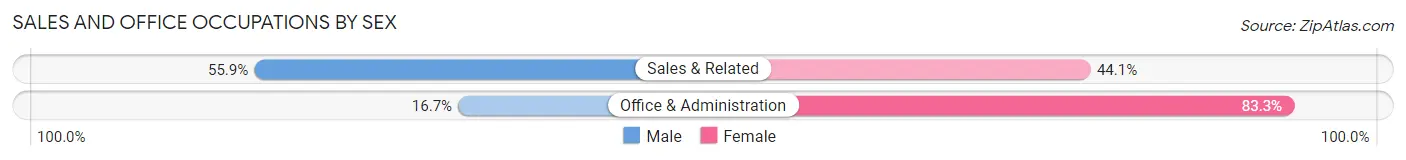
Sales and Office Occupations
The most common Sales and Office occupations in Potter Lake are Office & Administration (36 | 8.0%), and Sales & Related (34 | 7.5%).
Sales and Office Occupations by Sex
| Occupation | Male | Female |
| Sales & Related | 19 (55.9%) | 15 (44.1%) |
| Office & Administration | 6 (16.7%) | 30 (83.3%) |
| Total (Category) | 25 (35.7%) | 45 (64.3%) |
| Total (Overall) | 233 (51.5%) | 219 (48.4%) |
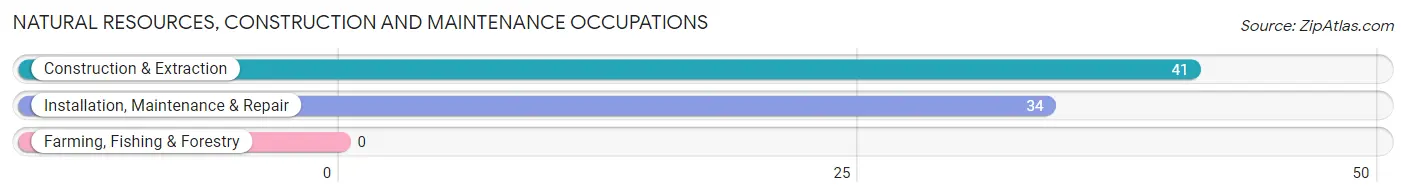
Natural Resources, Construction and Maintenance Occupations
The most common Natural Resources, Construction and Maintenance occupations in Potter Lake are Construction & Extraction (41 | 9.1%), and Installation, Maintenance & Repair (34 | 7.5%).
Natural Resources, Construction and Maintenance Occupations by Sex
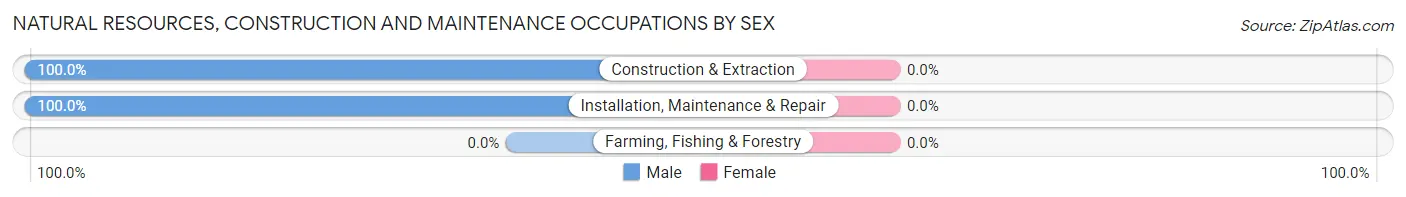
| Occupation | Male | Female |
| Farming, Fishing & Forestry | 0 (0.0%) | 0 (0.0%) |
| Construction & Extraction | 41 (100.0%) | 0 (0.0%) |
| Installation, Maintenance & Repair | 34 (100.0%) | 0 (0.0%) |
| Total (Category) | 75 (100.0%) | 0 (0.0%) |
| Total (Overall) | 233 (51.5%) | 219 (48.4%) |
Production, Transportation and Moving Occupations
The most common Production, Transportation and Moving occupations in Potter Lake are Transportation (51 | 11.3%), Production (34 | 7.5%), and Material Moving (10 | 2.2%).
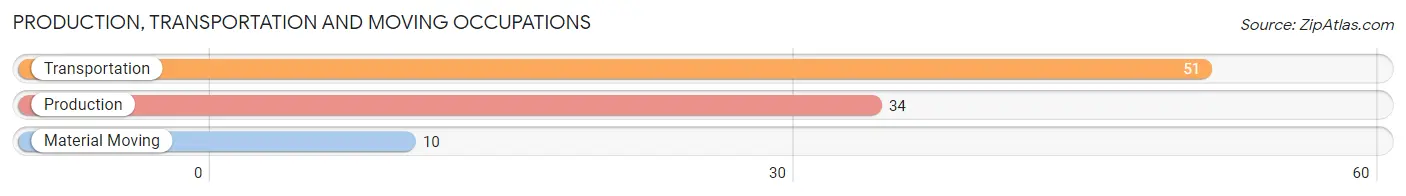
Production, Transportation and Moving Occupations by Sex
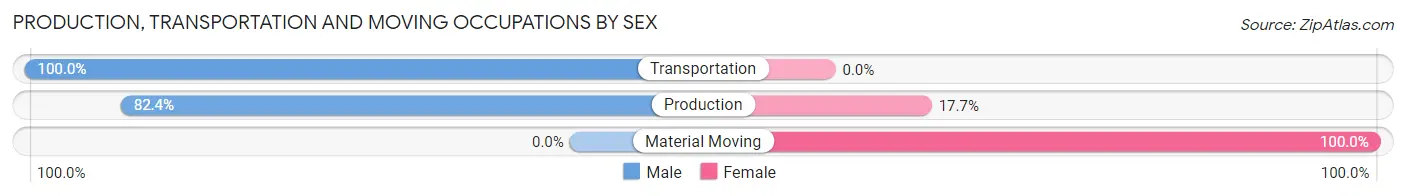
| Occupation | Male | Female |
| Production | 28 (82.4%) | 6 (17.6%) |
| Transportation | 51 (100.0%) | 0 (0.0%) |
| Material Moving | 0 (0.0%) | 10 (100.0%) |
| Total (Category) | 79 (83.2%) | 16 (16.8%) |
| Total (Overall) | 233 (51.5%) | 219 (48.4%) |
Employment Industries by Sex in Potter Lake
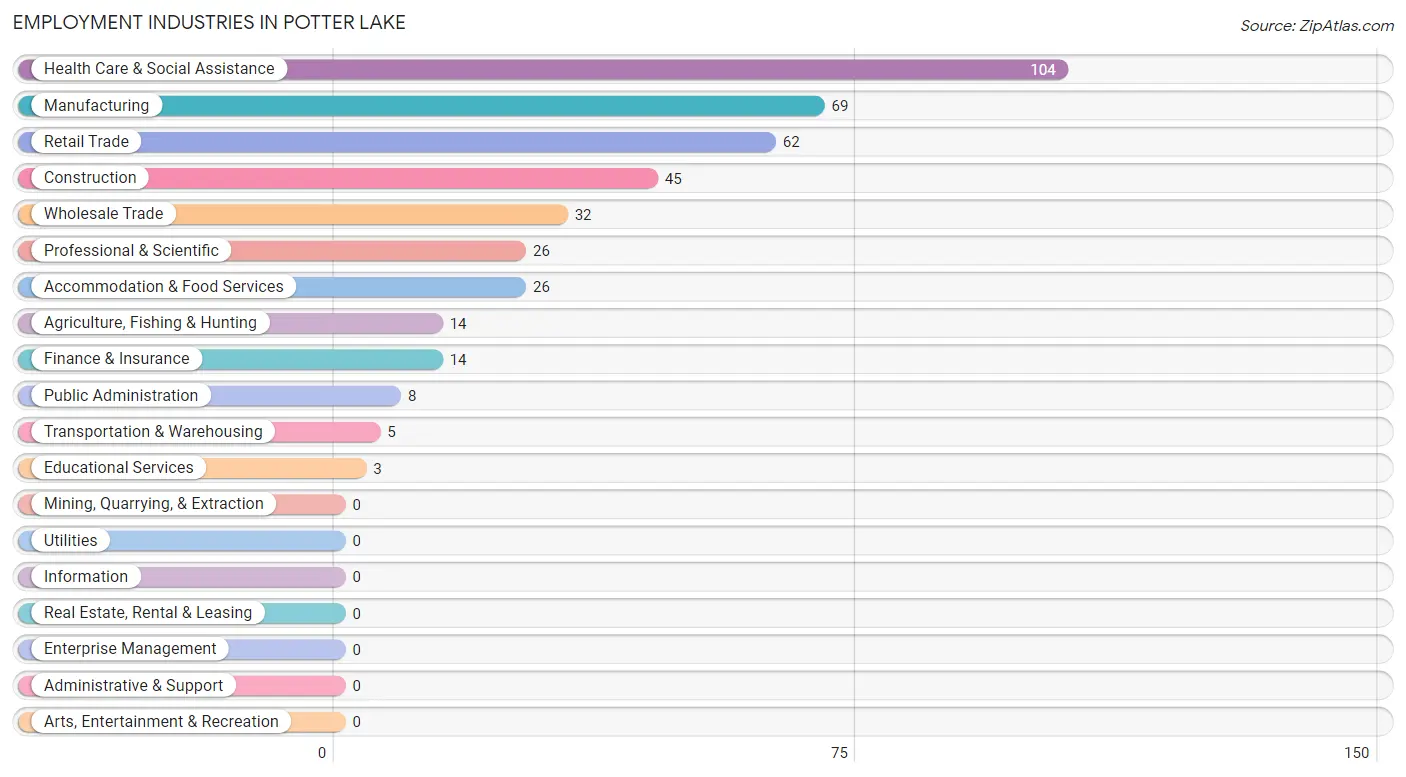
Employment Industries in Potter Lake
The major employment industries in Potter Lake include Health Care & Social Assistance (104 | 23.0%), Manufacturing (69 | 15.3%), Retail Trade (62 | 13.7%), Construction (45 | 10.0%), and Wholesale Trade (32 | 7.1%).
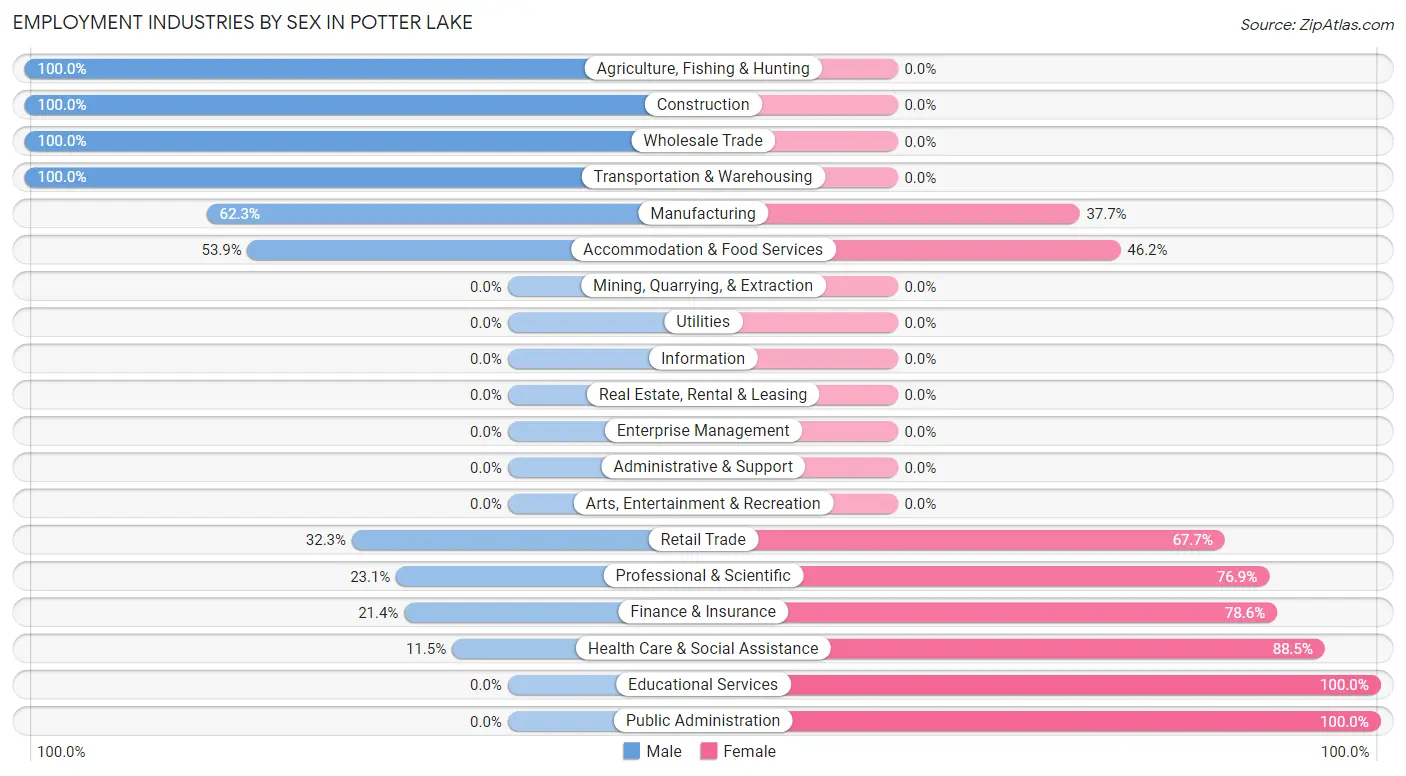
Employment Industries by Sex in Potter Lake
The Potter Lake industries that see more men than women are Agriculture, Fishing & Hunting (100.0%), Construction (100.0%), and Wholesale Trade (100.0%), whereas the industries that tend to have a higher number of women are Educational Services (100.0%), Public Administration (100.0%), and Health Care & Social Assistance (88.5%).
| Industry | Male | Female |
| Agriculture, Fishing & Hunting | 14 (100.0%) | 0 (0.0%) |
| Mining, Quarrying, & Extraction | 0 (0.0%) | 0 (0.0%) |
| Construction | 45 (100.0%) | 0 (0.0%) |
| Manufacturing | 43 (62.3%) | 26 (37.7%) |
| Wholesale Trade | 32 (100.0%) | 0 (0.0%) |
| Retail Trade | 20 (32.3%) | 42 (67.7%) |
| Transportation & Warehousing | 5 (100.0%) | 0 (0.0%) |
| Utilities | 0 (0.0%) | 0 (0.0%) |
| Information | 0 (0.0%) | 0 (0.0%) |
| Finance & Insurance | 3 (21.4%) | 11 (78.6%) |
| Real Estate, Rental & Leasing | 0 (0.0%) | 0 (0.0%) |
| Professional & Scientific | 6 (23.1%) | 20 (76.9%) |
| Enterprise Management | 0 (0.0%) | 0 (0.0%) |
| Administrative & Support | 0 (0.0%) | 0 (0.0%) |
| Educational Services | 0 (0.0%) | 3 (100.0%) |
| Health Care & Social Assistance | 12 (11.5%) | 92 (88.5%) |
| Arts, Entertainment & Recreation | 0 (0.0%) | 0 (0.0%) |
| Accommodation & Food Services | 14 (53.8%) | 12 (46.2%) |
| Public Administration | 0 (0.0%) | 8 (100.0%) |
| Total | 233 (51.5%) | 219 (48.4%) |
Education in Potter Lake
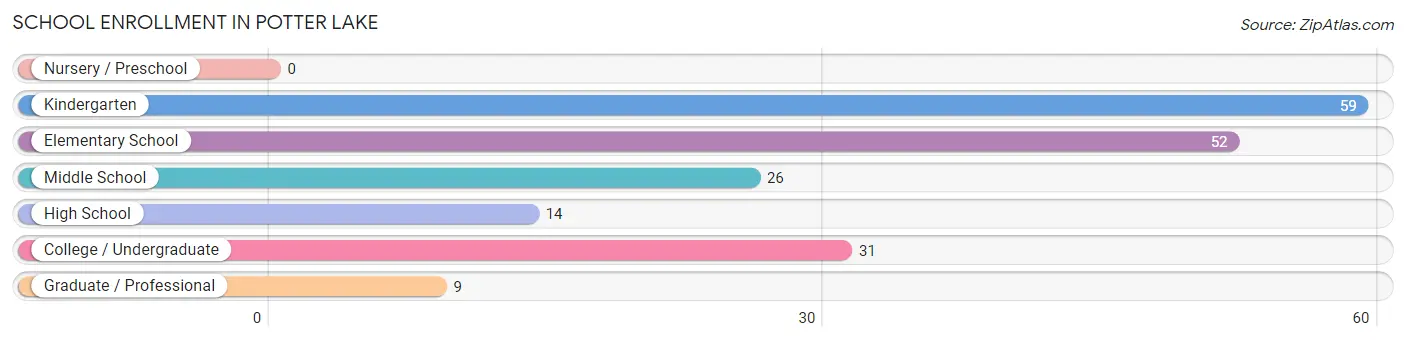
School Enrollment in Potter Lake
The most common levels of schooling among the 191 students in Potter Lake are kindergarten (59 | 30.9%), elementary school (52 | 27.2%), and college / undergraduate (31 | 16.2%).
| School Level | # Students | % Students |
| Nursery / Preschool | 0 | 0.0% |
| Kindergarten | 59 | 30.9% |
| Elementary School | 52 | 27.2% |
| Middle School | 26 | 13.6% |
| High School | 14 | 7.3% |
| College / Undergraduate | 31 | 16.2% |
| Graduate / Professional | 9 | 4.7% |
| Total | 191 | 100.0% |
School Enrollment by Age by Funding Source in Potter Lake
Out of a total of 191 students who are enrolled in schools in Potter Lake, 29 (15.2%) attend a private institution, while the remaining 162 (84.8%) are enrolled in public schools. The age group of 35 years and over has the highest likelihood of being enrolled in private schools, with 3 (100.0% in the age bracket) enrolled. Conversely, the age group of 3 to 4 year olds has the lowest likelihood of being enrolled in a private school, with 44 (100.0% in the age bracket) attending a public institution.
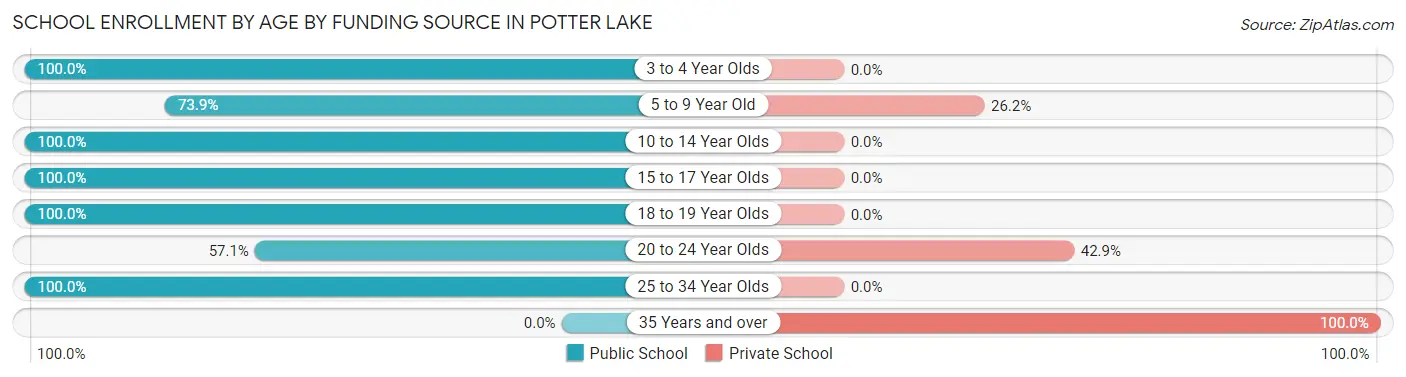
| Age Bracket | Public School | Private School |
| 3 to 4 Year Olds | 44 (100.0%) | 0 (0.0%) |
| 5 to 9 Year Old | 48 (73.9%) | 17 (26.2%) |
| 10 to 14 Year Olds | 28 (100.0%) | 0 (0.0%) |
| 15 to 17 Year Olds | 14 (100.0%) | 0 (0.0%) |
| 18 to 19 Year Olds | 1 (100.0%) | 0 (0.0%) |
| 20 to 24 Year Olds | 12 (57.1%) | 9 (42.9%) |
| 25 to 34 Year Olds | 15 (100.0%) | 0 (0.0%) |
| 35 Years and over | 0 (0.0%) | 3 (100.0%) |
| Total | 162 (84.8%) | 29 (15.2%) |
Educational Attainment by Field of Study in Potter Lake
Science & technology (64 | 32.7%), business (35 | 17.9%), education (34 | 17.3%), liberal arts & history (27 | 13.8%), and bio, nature & agricultural (14 | 7.1%) are the most common fields of study among 196 individuals in Potter Lake who have obtained a bachelor's degree or higher.
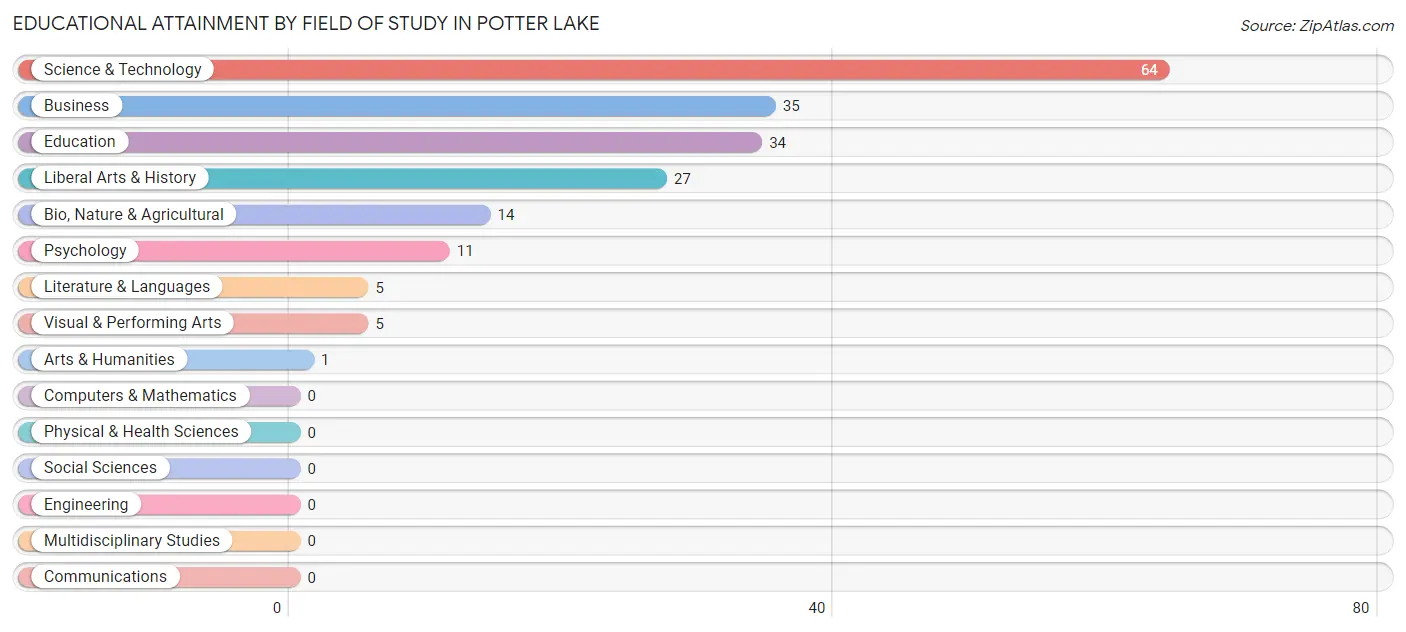
| Field of Study | # Graduates | % Graduates |
| Computers & Mathematics | 0 | 0.0% |
| Bio, Nature & Agricultural | 14 | 7.1% |
| Physical & Health Sciences | 0 | 0.0% |
| Psychology | 11 | 5.6% |
| Social Sciences | 0 | 0.0% |
| Engineering | 0 | 0.0% |
| Multidisciplinary Studies | 0 | 0.0% |
| Science & Technology | 64 | 32.7% |
| Business | 35 | 17.9% |
| Education | 34 | 17.3% |
| Literature & Languages | 5 | 2.5% |
| Liberal Arts & History | 27 | 13.8% |
| Visual & Performing Arts | 5 | 2.5% |
| Communications | 0 | 0.0% |
| Arts & Humanities | 1 | 0.5% |
| Total | 196 | 100.0% |
Transportation & Commute in Potter Lake
Vehicle Availability by Sex in Potter Lake
The most prevalent vehicle ownership categories in Potter Lake are males with 2 vehicles (113, accounting for 48.5%) and females with 2 vehicles (95, making up 51.6%).
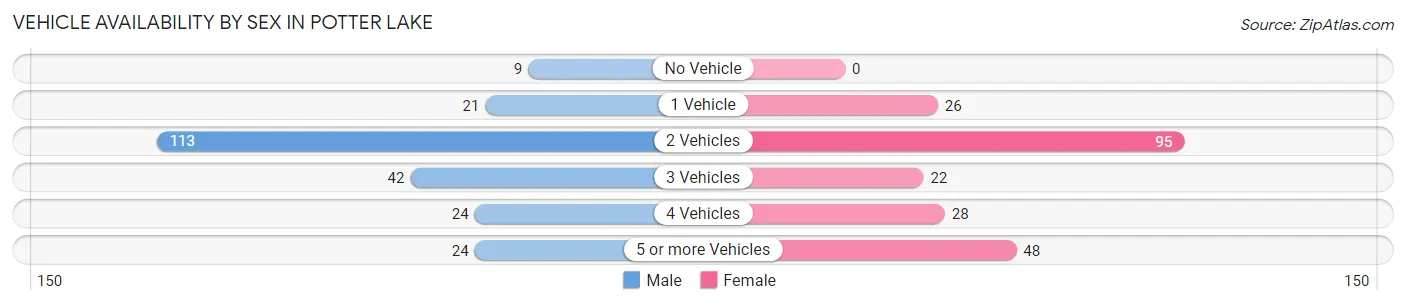
| Vehicles Available | Male | Female |
| No Vehicle | 9 (3.9%) | 0 (0.0%) |
| 1 Vehicle | 21 (9.0%) | 26 (11.9%) |
| 2 Vehicles | 113 (48.5%) | 95 (43.4%) |
| 3 Vehicles | 42 (18.0%) | 22 (10.1%) |
| 4 Vehicles | 24 (10.3%) | 28 (12.8%) |
| 5 or more Vehicles | 24 (10.3%) | 48 (21.9%) |
| Total | 233 (100.0%) | 219 (100.0%) |
Commute Time in Potter Lake
The most frequently occuring commute durations in Potter Lake are 15 to 19 minutes (89 commuters, 22.1%), 5 to 9 minutes (56 commuters, 13.9%), and 45 to 59 minutes (53 commuters, 13.2%).
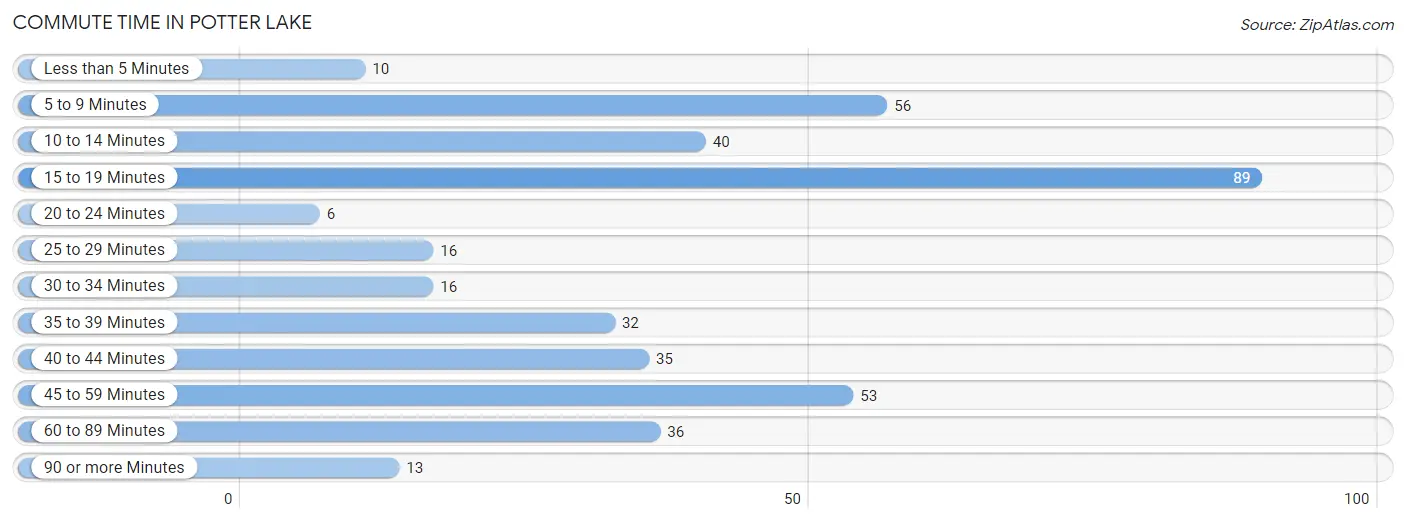
| Commute Time | # Commuters | % Commuters |
| Less than 5 Minutes | 10 | 2.5% |
| 5 to 9 Minutes | 56 | 13.9% |
| 10 to 14 Minutes | 40 | 10.0% |
| 15 to 19 Minutes | 89 | 22.1% |
| 20 to 24 Minutes | 6 | 1.5% |
| 25 to 29 Minutes | 16 | 4.0% |
| 30 to 34 Minutes | 16 | 4.0% |
| 35 to 39 Minutes | 32 | 8.0% |
| 40 to 44 Minutes | 35 | 8.7% |
| 45 to 59 Minutes | 53 | 13.2% |
| 60 to 89 Minutes | 36 | 9.0% |
| 90 or more Minutes | 13 | 3.2% |
Commute Time by Sex in Potter Lake
The most common commute times in Potter Lake are 5 to 9 minutes (49 commuters, 21.6%) for males and 15 to 19 minutes (52 commuters, 29.7%) for females.
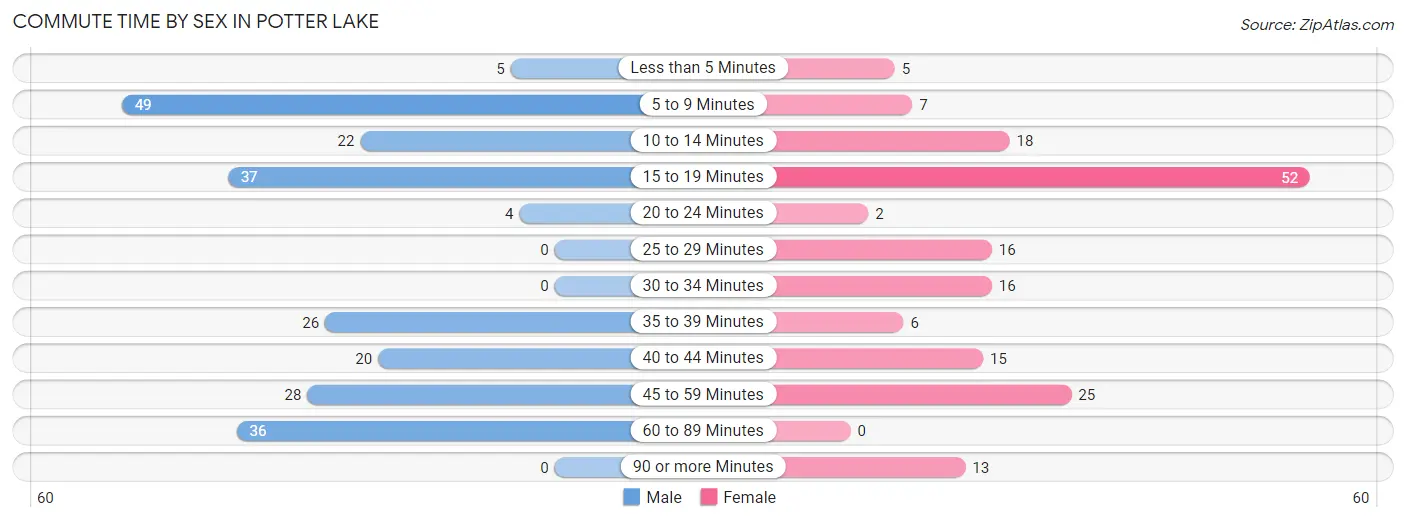
| Commute Time | Male | Female |
| Less than 5 Minutes | 5 (2.2%) | 5 (2.9%) |
| 5 to 9 Minutes | 49 (21.6%) | 7 (4.0%) |
| 10 to 14 Minutes | 22 (9.7%) | 18 (10.3%) |
| 15 to 19 Minutes | 37 (16.3%) | 52 (29.7%) |
| 20 to 24 Minutes | 4 (1.8%) | 2 (1.1%) |
| 25 to 29 Minutes | 0 (0.0%) | 16 (9.1%) |
| 30 to 34 Minutes | 0 (0.0%) | 16 (9.1%) |
| 35 to 39 Minutes | 26 (11.5%) | 6 (3.4%) |
| 40 to 44 Minutes | 20 (8.8%) | 15 (8.6%) |
| 45 to 59 Minutes | 28 (12.3%) | 25 (14.3%) |
| 60 to 89 Minutes | 36 (15.9%) | 0 (0.0%) |
| 90 or more Minutes | 0 (0.0%) | 13 (7.4%) |
Time of Departure to Work by Sex in Potter Lake
The most frequent times of departure to work in Potter Lake are 12:00 PM to 3:59 PM (58, 25.6%) for males and 6:30 AM to 6:59 AM (62, 35.4%) for females.
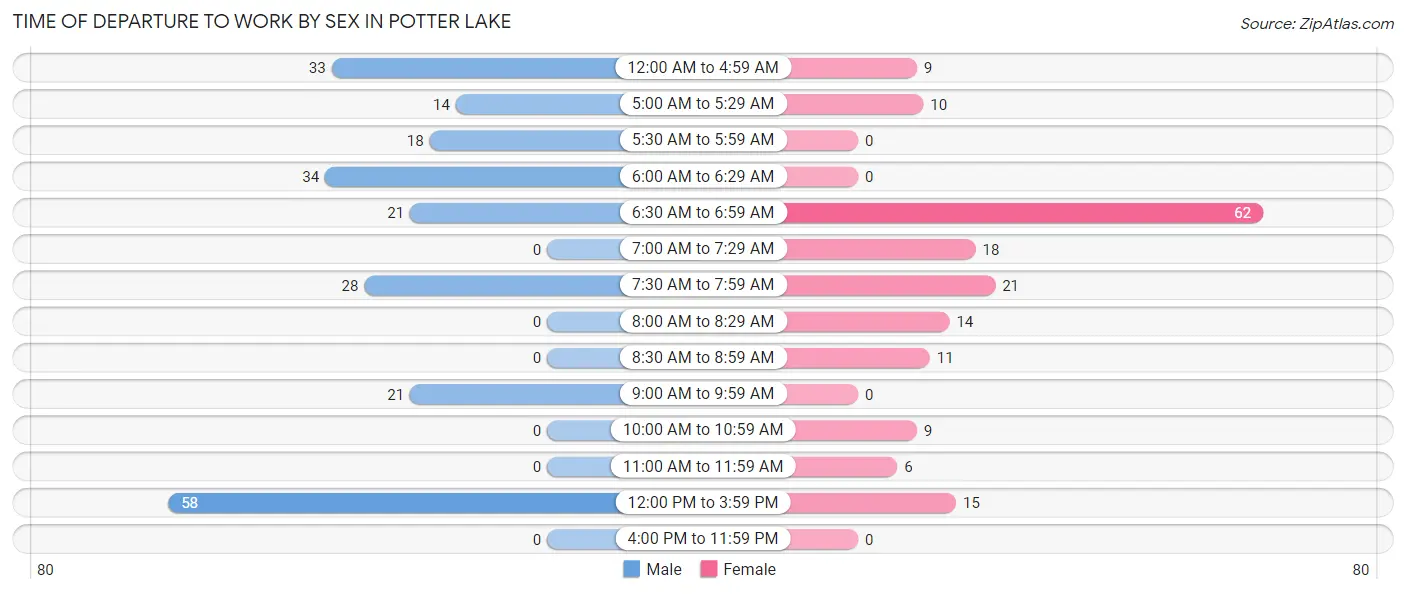
| Time of Departure | Male | Female |
| 12:00 AM to 4:59 AM | 33 (14.5%) | 9 (5.1%) |
| 5:00 AM to 5:29 AM | 14 (6.2%) | 10 (5.7%) |
| 5:30 AM to 5:59 AM | 18 (7.9%) | 0 (0.0%) |
| 6:00 AM to 6:29 AM | 34 (15.0%) | 0 (0.0%) |
| 6:30 AM to 6:59 AM | 21 (9.2%) | 62 (35.4%) |
| 7:00 AM to 7:29 AM | 0 (0.0%) | 18 (10.3%) |
| 7:30 AM to 7:59 AM | 28 (12.3%) | 21 (12.0%) |
| 8:00 AM to 8:29 AM | 0 (0.0%) | 14 (8.0%) |
| 8:30 AM to 8:59 AM | 0 (0.0%) | 11 (6.3%) |
| 9:00 AM to 9:59 AM | 21 (9.2%) | 0 (0.0%) |
| 10:00 AM to 10:59 AM | 0 (0.0%) | 9 (5.1%) |
| 11:00 AM to 11:59 AM | 0 (0.0%) | 6 (3.4%) |
| 12:00 PM to 3:59 PM | 58 (25.6%) | 15 (8.6%) |
| 4:00 PM to 11:59 PM | 0 (0.0%) | 0 (0.0%) |
| Total | 227 (100.0%) | 175 (100.0%) |
Housing Occupancy in Potter Lake
Occupancy by Ownership in Potter Lake
Of the total 361 dwellings in Potter Lake, owner-occupied units account for 336 (93.1%), while renter-occupied units make up 25 (6.9%).
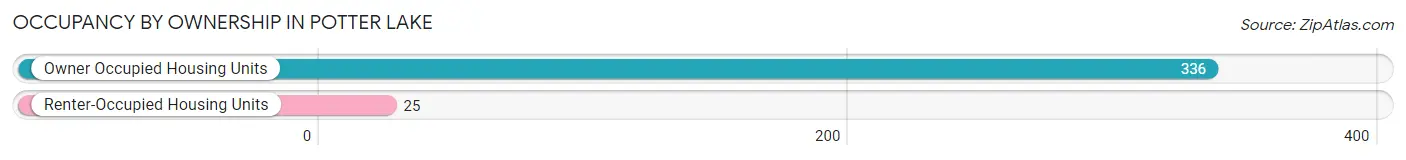
| Occupancy | # Housing Units | % Housing Units |
| Owner Occupied Housing Units | 336 | 93.1% |
| Renter-Occupied Housing Units | 25 | 6.9% |
| Total Occupied Housing Units | 361 | 100.0% |
Occupancy by Household Size in Potter Lake
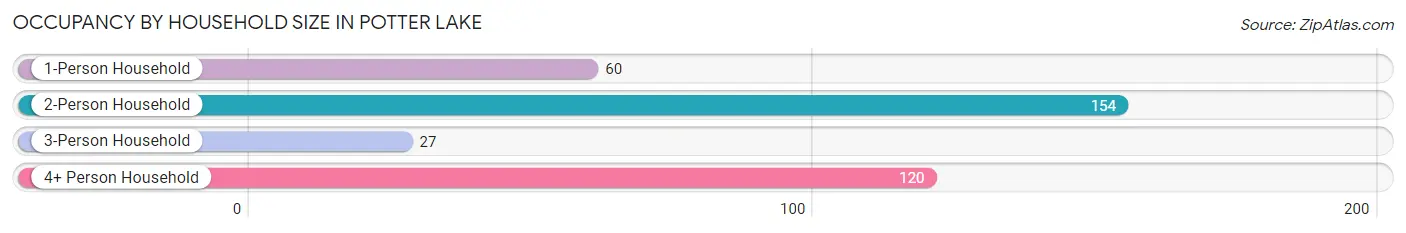
| Household Size | # Housing Units | % Housing Units |
| 1-Person Household | 60 | 16.6% |
| 2-Person Household | 154 | 42.7% |
| 3-Person Household | 27 | 7.5% |
| 4+ Person Household | 120 | 33.2% |
| Total Housing Units | 361 | 100.0% |
Occupancy by Ownership by Household Size in Potter Lake
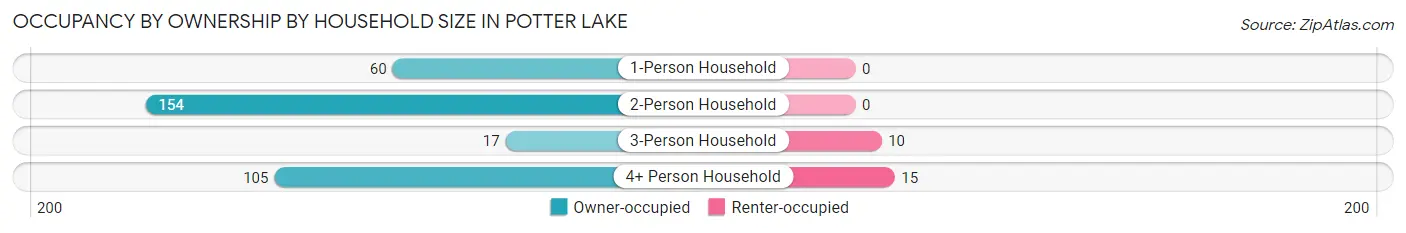
| Household Size | Owner-occupied | Renter-occupied |
| 1-Person Household | 60 (100.0%) | 0 (0.0%) |
| 2-Person Household | 154 (100.0%) | 0 (0.0%) |
| 3-Person Household | 17 (63.0%) | 10 (37.0%) |
| 4+ Person Household | 105 (87.5%) | 15 (12.5%) |
| Total Housing Units | 336 (93.1%) | 25 (6.9%) |
Occupancy by Educational Attainment in Potter Lake
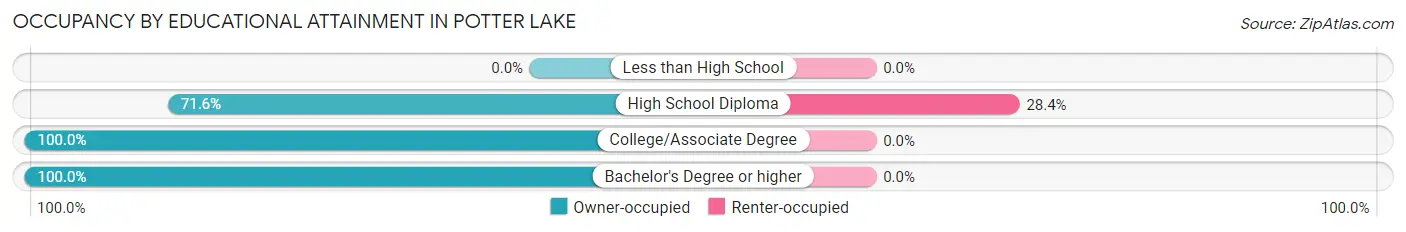
| Household Size | Owner-occupied | Renter-occupied |
| Less than High School | 0 (0.0%) | 0 (0.0%) |
| High School Diploma | 63 (71.6%) | 25 (28.4%) |
| College/Associate Degree | 138 (100.0%) | 0 (0.0%) |
| Bachelor's Degree or higher | 135 (100.0%) | 0 (0.0%) |
Occupancy by Age of Householder in Potter Lake
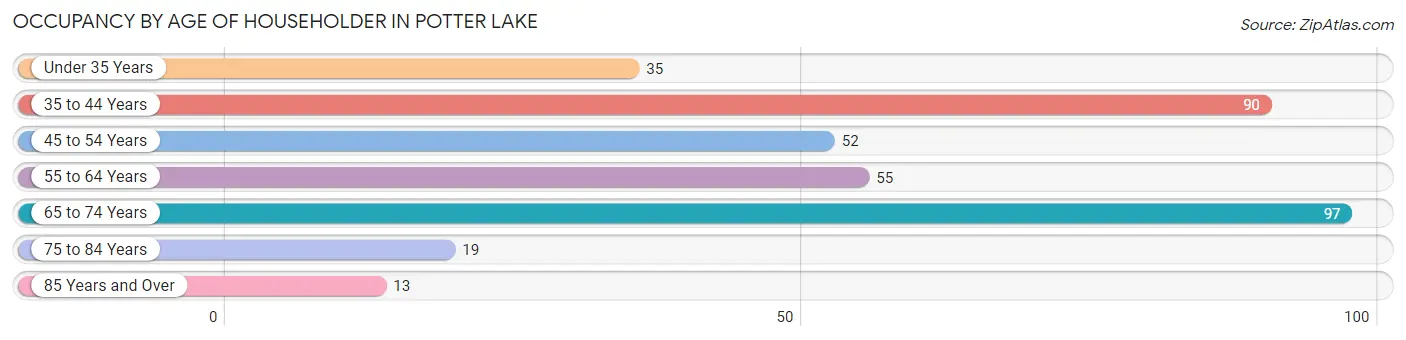
| Age Bracket | # Households | % Households |
| Under 35 Years | 35 | 9.7% |
| 35 to 44 Years | 90 | 24.9% |
| 45 to 54 Years | 52 | 14.4% |
| 55 to 64 Years | 55 | 15.2% |
| 65 to 74 Years | 97 | 26.9% |
| 75 to 84 Years | 19 | 5.3% |
| 85 Years and Over | 13 | 3.6% |
| Total | 361 | 100.0% |
Housing Finances in Potter Lake
Median Income by Occupancy in Potter Lake
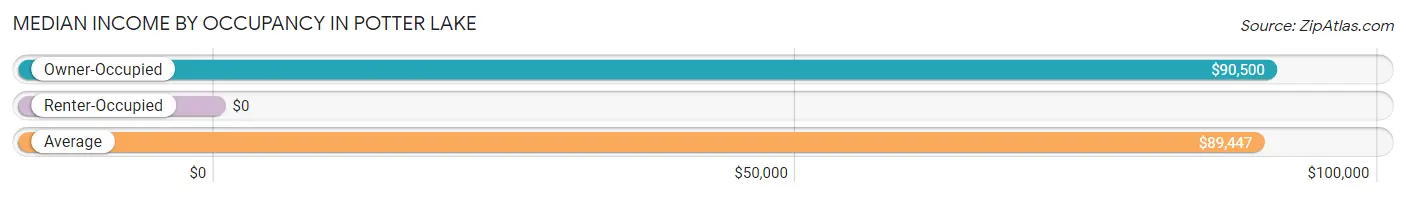
| Occupancy Type | # Households | Median Income |
| Owner-Occupied | 336 (93.1%) | $90,500 |
| Renter-Occupied | 25 (6.9%) | $0 |
| Average | 361 (100.0%) | $89,447 |
Occupancy by Householder Income Bracket in Potter Lake
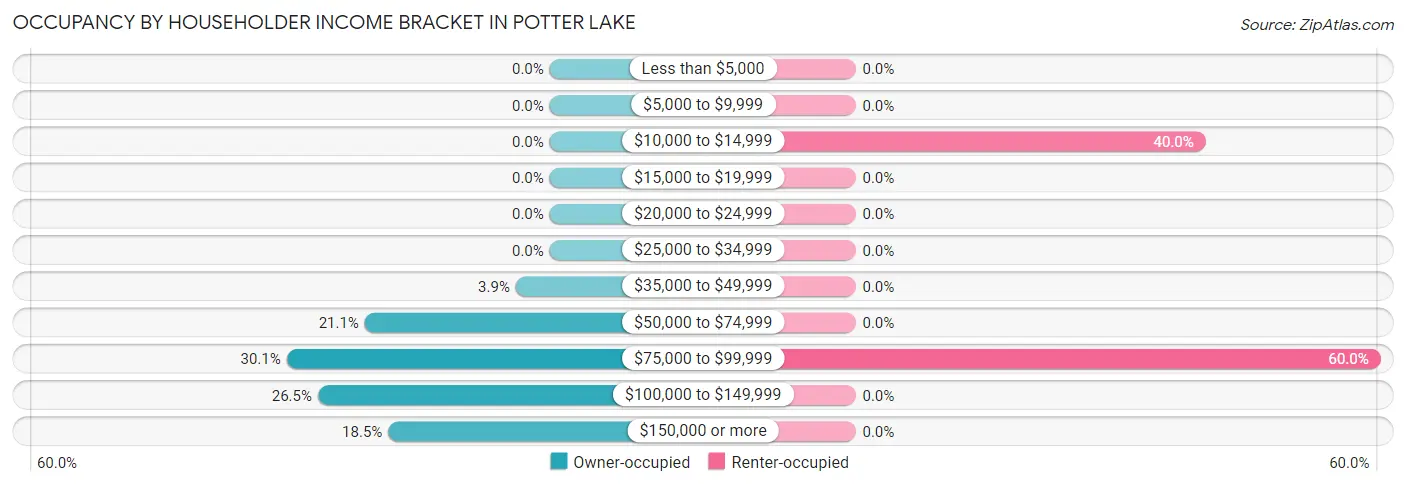
| Income Bracket | Owner-occupied | Renter-occupied |
| Less than $5,000 | 0 (0.0%) | 0 (0.0%) |
| $5,000 to $9,999 | 0 (0.0%) | 0 (0.0%) |
| $10,000 to $14,999 | 0 (0.0%) | 10 (40.0%) |
| $15,000 to $19,999 | 0 (0.0%) | 0 (0.0%) |
| $20,000 to $24,999 | 0 (0.0%) | 0 (0.0%) |
| $25,000 to $34,999 | 0 (0.0%) | 0 (0.0%) |
| $35,000 to $49,999 | 13 (3.9%) | 0 (0.0%) |
| $50,000 to $74,999 | 71 (21.1%) | 0 (0.0%) |
| $75,000 to $99,999 | 101 (30.1%) | 15 (60.0%) |
| $100,000 to $149,999 | 89 (26.5%) | 0 (0.0%) |
| $150,000 or more | 62 (18.4%) | 0 (0.0%) |
| Total | 336 (100.0%) | 25 (100.0%) |
Monthly Housing Cost Tiers in Potter Lake
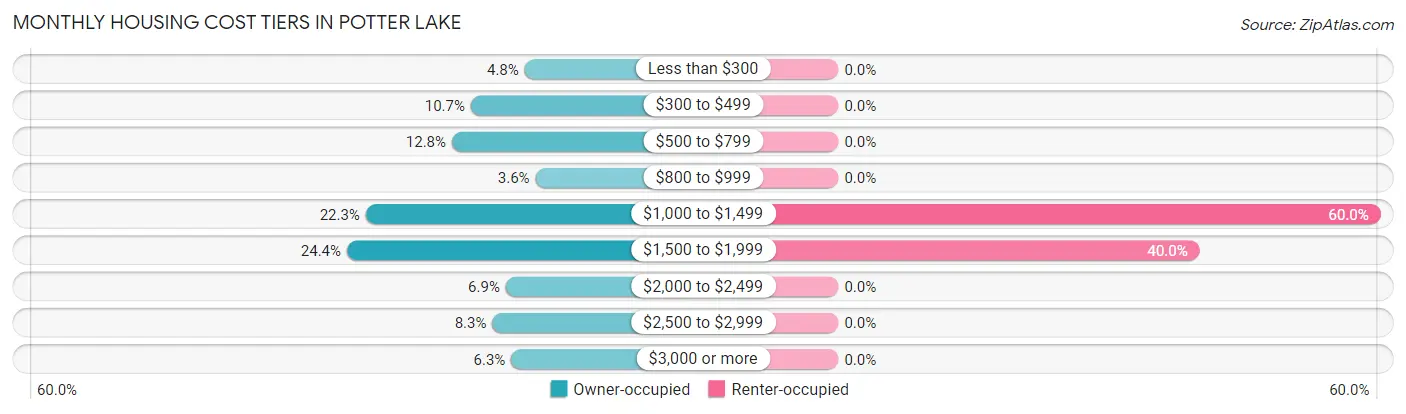
| Monthly Cost | Owner-occupied | Renter-occupied |
| Less than $300 | 16 (4.8%) | 0 (0.0%) |
| $300 to $499 | 36 (10.7%) | 0 (0.0%) |
| $500 to $799 | 43 (12.8%) | 0 (0.0%) |
| $800 to $999 | 12 (3.6%) | 0 (0.0%) |
| $1,000 to $1,499 | 75 (22.3%) | 15 (60.0%) |
| $1,500 to $1,999 | 82 (24.4%) | 10 (40.0%) |
| $2,000 to $2,499 | 23 (6.9%) | 0 (0.0%) |
| $2,500 to $2,999 | 28 (8.3%) | 0 (0.0%) |
| $3,000 or more | 21 (6.2%) | 0 (0.0%) |
| Total | 336 (100.0%) | 25 (100.0%) |
Physical Housing Characteristics in Potter Lake
Housing Structures in Potter Lake
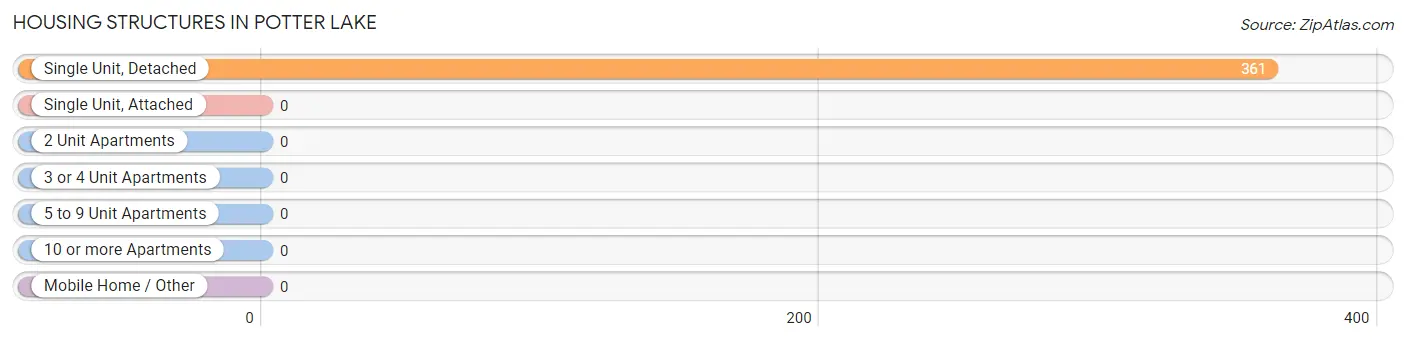
| Structure Type | # Housing Units | % Housing Units |
| Single Unit, Detached | 361 | 100.0% |
| Single Unit, Attached | 0 | 0.0% |
| 2 Unit Apartments | 0 | 0.0% |
| 3 or 4 Unit Apartments | 0 | 0.0% |
| 5 to 9 Unit Apartments | 0 | 0.0% |
| 10 or more Apartments | 0 | 0.0% |
| Mobile Home / Other | 0 | 0.0% |
| Total | 361 | 100.0% |
Housing Structures by Occupancy in Potter Lake
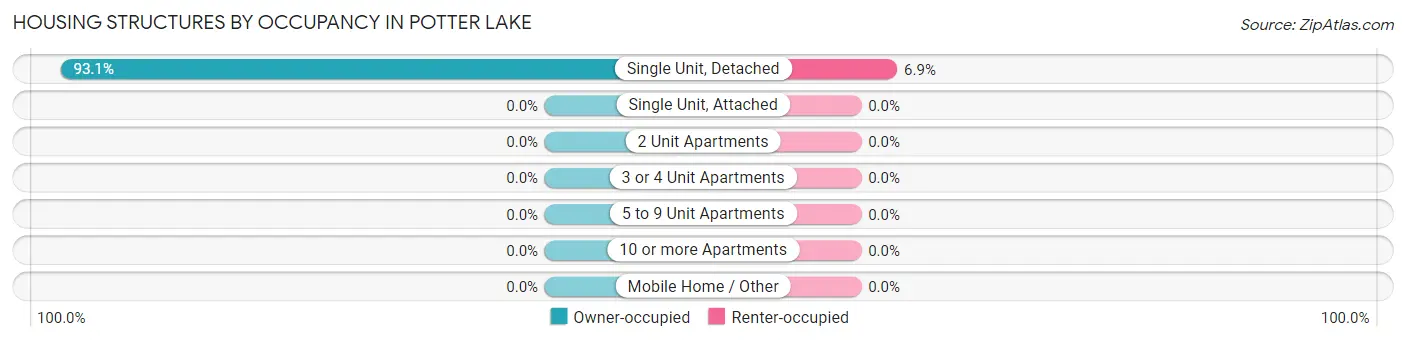
| Structure Type | Owner-occupied | Renter-occupied |
| Single Unit, Detached | 336 (93.1%) | 25 (6.9%) |
| Single Unit, Attached | 0 (0.0%) | 0 (0.0%) |
| 2 Unit Apartments | 0 (0.0%) | 0 (0.0%) |
| 3 or 4 Unit Apartments | 0 (0.0%) | 0 (0.0%) |
| 5 to 9 Unit Apartments | 0 (0.0%) | 0 (0.0%) |
| 10 or more Apartments | 0 (0.0%) | 0 (0.0%) |
| Mobile Home / Other | 0 (0.0%) | 0 (0.0%) |
| Total | 336 (93.1%) | 25 (6.9%) |
Housing Structures by Number of Rooms in Potter Lake
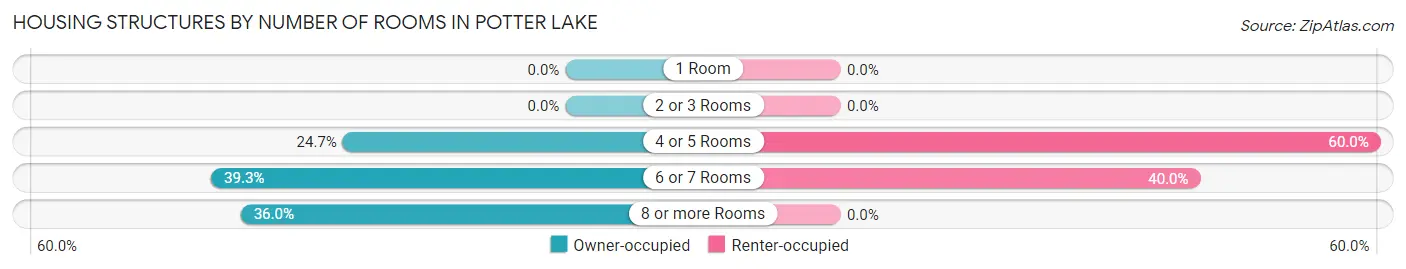
| Number of Rooms | Owner-occupied | Renter-occupied |
| 1 Room | 0 (0.0%) | 0 (0.0%) |
| 2 or 3 Rooms | 0 (0.0%) | 0 (0.0%) |
| 4 or 5 Rooms | 83 (24.7%) | 15 (60.0%) |
| 6 or 7 Rooms | 132 (39.3%) | 10 (40.0%) |
| 8 or more Rooms | 121 (36.0%) | 0 (0.0%) |
| Total | 336 (100.0%) | 25 (100.0%) |
Housing Structure by Heating Type in Potter Lake
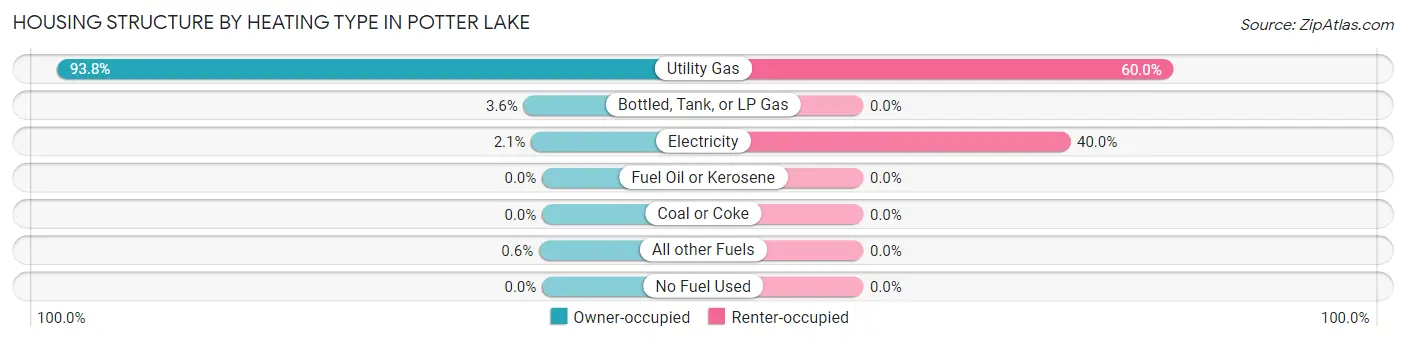
| Heating Type | Owner-occupied | Renter-occupied |
| Utility Gas | 315 (93.8%) | 15 (60.0%) |
| Bottled, Tank, or LP Gas | 12 (3.6%) | 0 (0.0%) |
| Electricity | 7 (2.1%) | 10 (40.0%) |
| Fuel Oil or Kerosene | 0 (0.0%) | 0 (0.0%) |
| Coal or Coke | 0 (0.0%) | 0 (0.0%) |
| All other Fuels | 2 (0.6%) | 0 (0.0%) |
| No Fuel Used | 0 (0.0%) | 0 (0.0%) |
| Total | 336 (100.0%) | 25 (100.0%) |
Household Vehicle Usage in Potter Lake
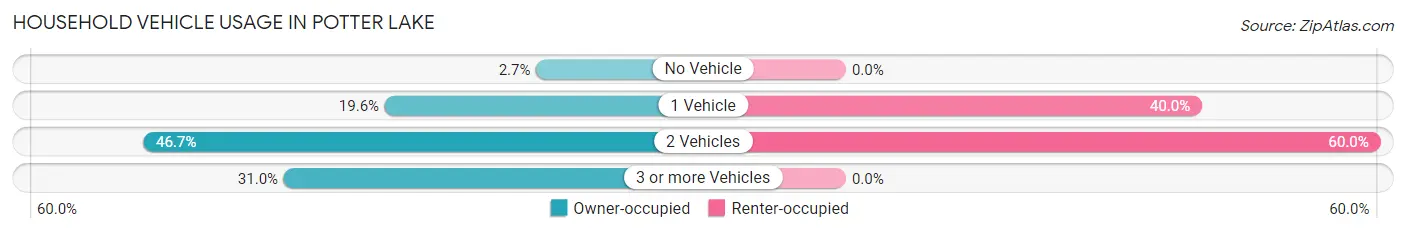
| Vehicles per Household | Owner-occupied | Renter-occupied |
| No Vehicle | 9 (2.7%) | 0 (0.0%) |
| 1 Vehicle | 66 (19.6%) | 10 (40.0%) |
| 2 Vehicles | 157 (46.7%) | 15 (60.0%) |
| 3 or more Vehicles | 104 (30.9%) | 0 (0.0%) |
| Total | 336 (100.0%) | 25 (100.0%) |
Real Estate & Mortgages in Potter Lake
Real Estate and Mortgage Overview in Potter Lake
| Characteristic | Without Mortgage | With Mortgage |
| Housing Units | 112 | 224 |
| Median Property Value | - | - |
| Median Household Income | $97,692 | $62 |
| Monthly Housing Costs | $536 | $21 |
| Real Estate Taxes | - | - |
Property Value by Mortgage Status in Potter Lake
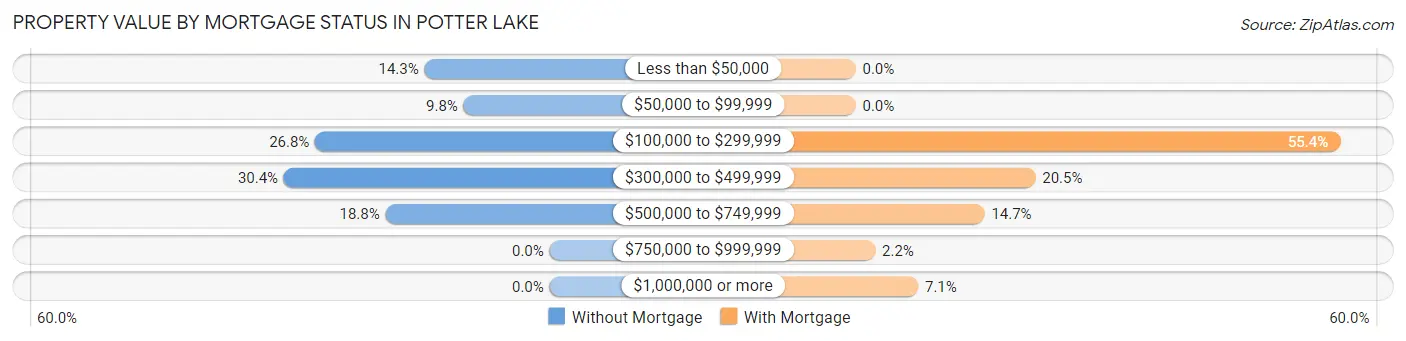
| Property Value | Without Mortgage | With Mortgage |
| Less than $50,000 | 16 (14.3%) | 0 (0.0%) |
| $50,000 to $99,999 | 11 (9.8%) | 0 (0.0%) |
| $100,000 to $299,999 | 30 (26.8%) | 124 (55.4%) |
| $300,000 to $499,999 | 34 (30.4%) | 46 (20.5%) |
| $500,000 to $749,999 | 21 (18.8%) | 33 (14.7%) |
| $750,000 to $999,999 | 0 (0.0%) | 5 (2.2%) |
| $1,000,000 or more | 0 (0.0%) | 16 (7.1%) |
| Total | 112 (100.0%) | 224 (100.0%) |
Household Income by Mortgage Status in Potter Lake
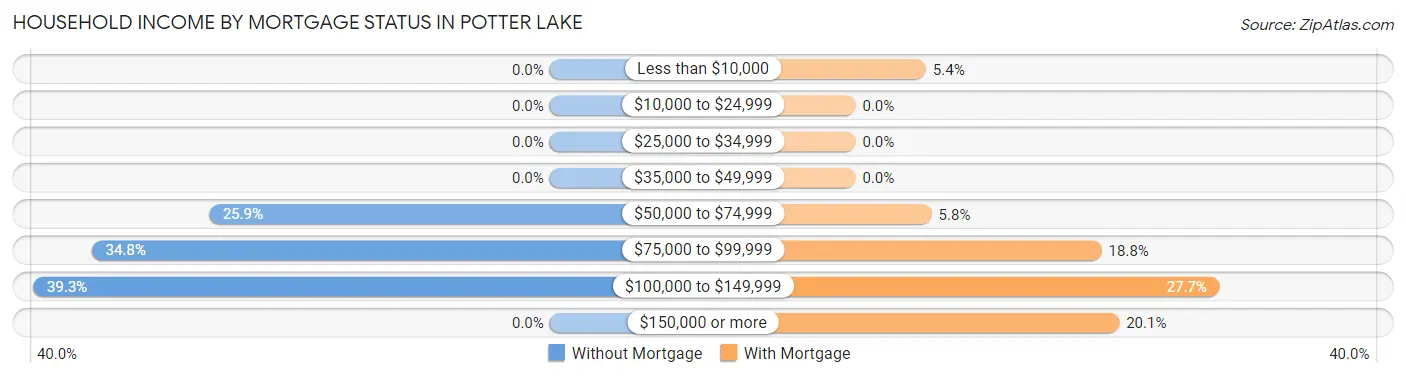
| Household Income | Without Mortgage | With Mortgage |
| Less than $10,000 | 0 (0.0%) | 12 (5.4%) |
| $10,000 to $24,999 | 0 (0.0%) | 0 (0.0%) |
| $25,000 to $34,999 | 0 (0.0%) | 0 (0.0%) |
| $35,000 to $49,999 | 0 (0.0%) | 0 (0.0%) |
| $50,000 to $74,999 | 29 (25.9%) | 13 (5.8%) |
| $75,000 to $99,999 | 39 (34.8%) | 42 (18.8%) |
| $100,000 to $149,999 | 44 (39.3%) | 62 (27.7%) |
| $150,000 or more | 0 (0.0%) | 45 (20.1%) |
| Total | 112 (100.0%) | 224 (100.0%) |
Property Value to Household Income Ratio in Potter Lake
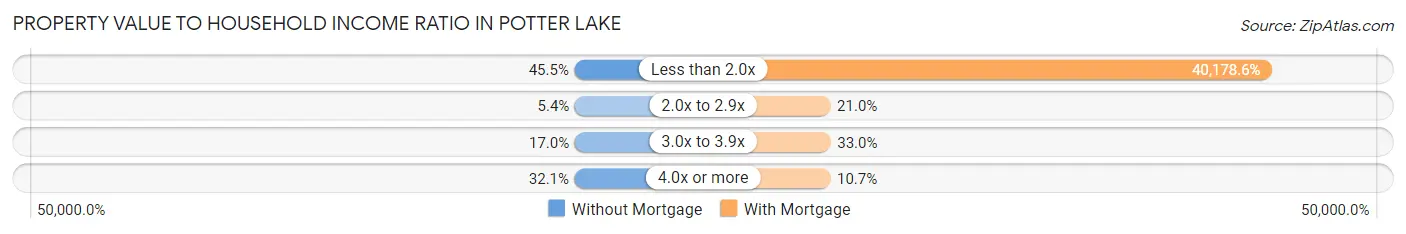
| Value-to-Income Ratio | Without Mortgage | With Mortgage |
| Less than 2.0x | 51 (45.5%) | 90,000 (40,178.6%) |
| 2.0x to 2.9x | 6 (5.4%) | 47 (21.0%) |
| 3.0x to 3.9x | 19 (17.0%) | 74 (33.0%) |
| 4.0x or more | 36 (32.1%) | 24 (10.7%) |
| Total | 112 (100.0%) | 224 (100.0%) |
Real Estate Taxes by Mortgage Status in Potter Lake
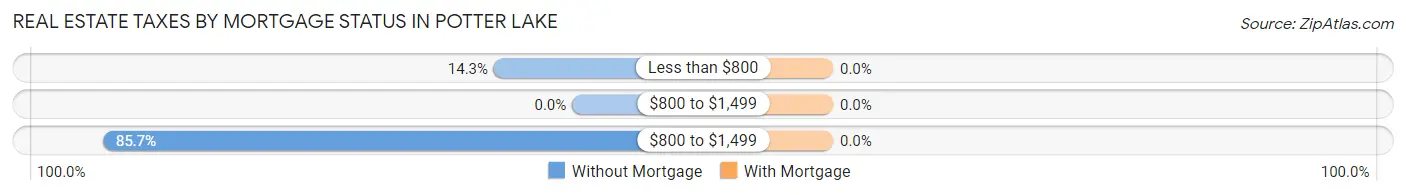
| Property Taxes | Without Mortgage | With Mortgage |
| Less than $800 | 16 (14.3%) | 0 (0.0%) |
| $800 to $1,499 | 0 (0.0%) | 0 (0.0%) |
| $800 to $1,499 | 96 (85.7%) | 0 (0.0%) |
| Total | 112 (100.0%) | 224 (100.0%) |
Health & Disability in Potter Lake
Health Insurance Coverage by Age in Potter Lake
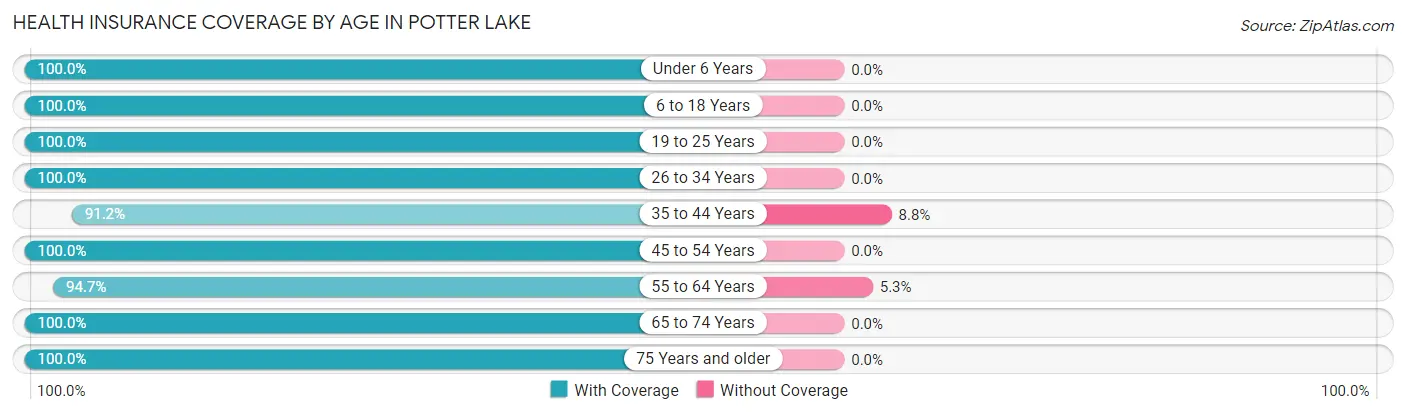
| Age Bracket | With Coverage | Without Coverage |
| Under 6 Years | 99 (100.0%) | 0 (0.0%) |
| 6 to 18 Years | 108 (100.0%) | 0 (0.0%) |
| 19 to 25 Years | 30 (100.0%) | 0 (0.0%) |
| 26 to 34 Years | 55 (100.0%) | 0 (0.0%) |
| 35 to 44 Years | 155 (91.2%) | 15 (8.8%) |
| 45 to 54 Years | 81 (100.0%) | 0 (0.0%) |
| 55 to 64 Years | 107 (94.7%) | 6 (5.3%) |
| 65 to 74 Years | 157 (100.0%) | 0 (0.0%) |
| 75 Years and older | 66 (100.0%) | 0 (0.0%) |
| Total | 858 (97.6%) | 21 (2.4%) |
Health Insurance Coverage by Citizenship Status in Potter Lake
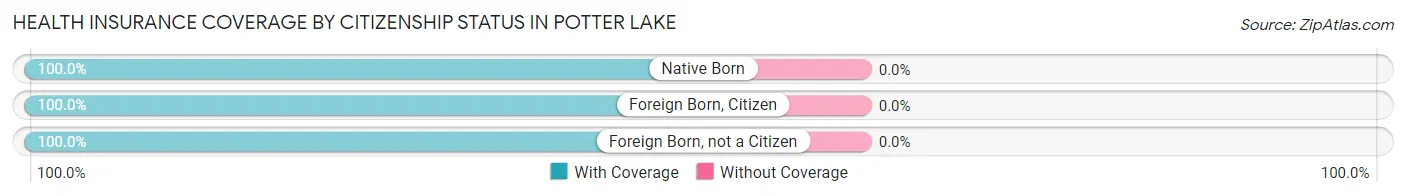
| Citizenship Status | With Coverage | Without Coverage |
| Native Born | 99 (100.0%) | 0 (0.0%) |
| Foreign Born, Citizen | 108 (100.0%) | 0 (0.0%) |
| Foreign Born, not a Citizen | 30 (100.0%) | 0 (0.0%) |
Health Insurance Coverage by Household Income in Potter Lake
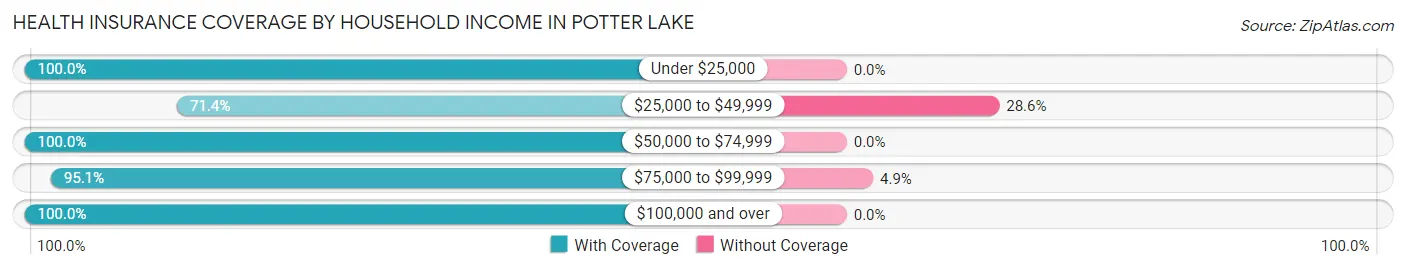
| Household Income | With Coverage | Without Coverage |
| Under $25,000 | 28 (100.0%) | 0 (0.0%) |
| $25,000 to $49,999 | 15 (71.4%) | 6 (28.6%) |
| $50,000 to $74,999 | 157 (100.0%) | 0 (0.0%) |
| $75,000 to $99,999 | 289 (95.1%) | 15 (4.9%) |
| $100,000 and over | 369 (100.0%) | 0 (0.0%) |
Public vs Private Health Insurance Coverage by Age in Potter Lake
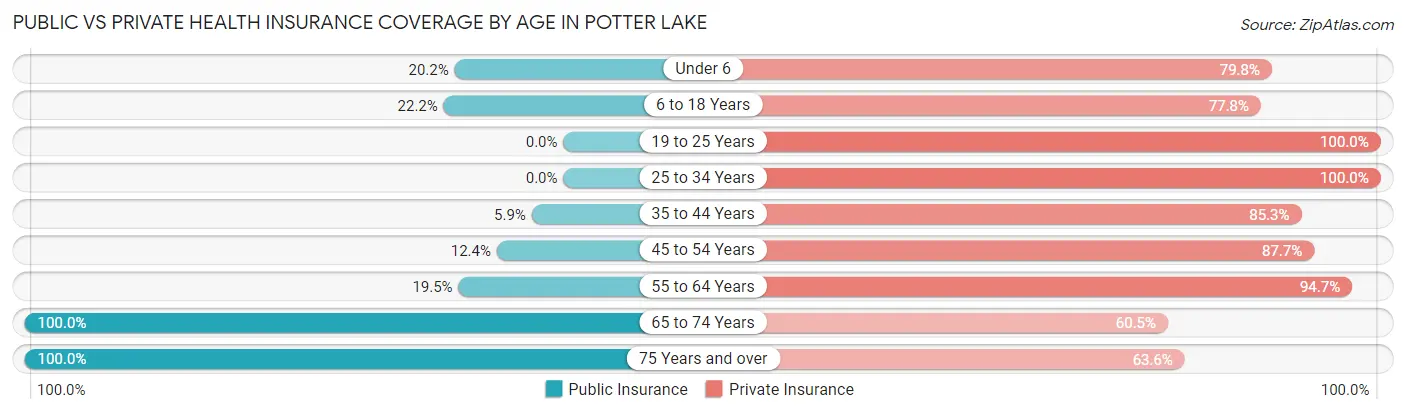
| Age Bracket | Public Insurance | Private Insurance |
| Under 6 | 20 (20.2%) | 79 (79.8%) |
| 6 to 18 Years | 24 (22.2%) | 84 (77.8%) |
| 19 to 25 Years | 0 (0.0%) | 30 (100.0%) |
| 25 to 34 Years | 0 (0.0%) | 55 (100.0%) |
| 35 to 44 Years | 10 (5.9%) | 145 (85.3%) |
| 45 to 54 Years | 10 (12.3%) | 71 (87.6%) |
| 55 to 64 Years | 22 (19.5%) | 107 (94.7%) |
| 65 to 74 Years | 157 (100.0%) | 95 (60.5%) |
| 75 Years and over | 66 (100.0%) | 42 (63.6%) |
| Total | 309 (35.1%) | 708 (80.5%) |
Disability Status by Sex by Age in Potter Lake
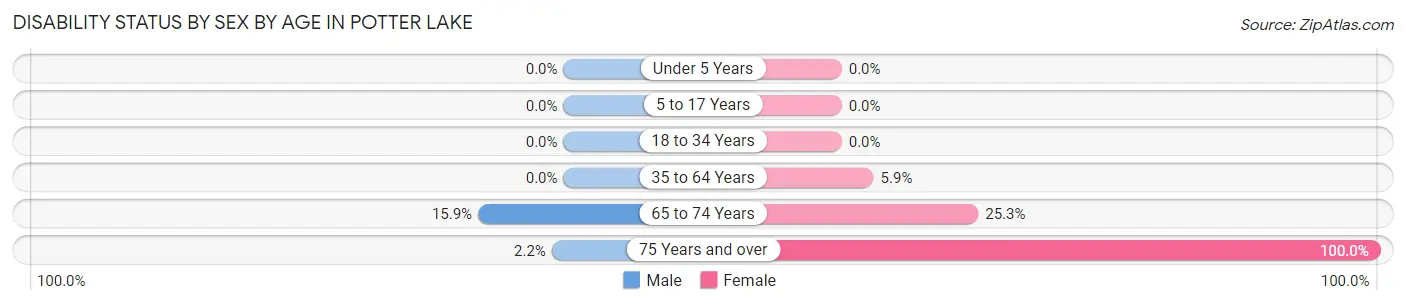
| Age Bracket | Male | Female |
| Under 5 Years | 0 (0.0%) | 0 (0.0%) |
| 5 to 17 Years | 0 (0.0%) | 0 (0.0%) |
| 18 to 34 Years | 0 (0.0%) | 0 (0.0%) |
| 35 to 64 Years | 0 (0.0%) | 11 (5.9%) |
| 65 to 74 Years | 13 (15.9%) | 19 (25.3%) |
| 75 Years and over | 1 (2.2%) | 20 (100.0%) |
Disability Class by Sex by Age in Potter Lake
Disability Class: Hearing Difficulty
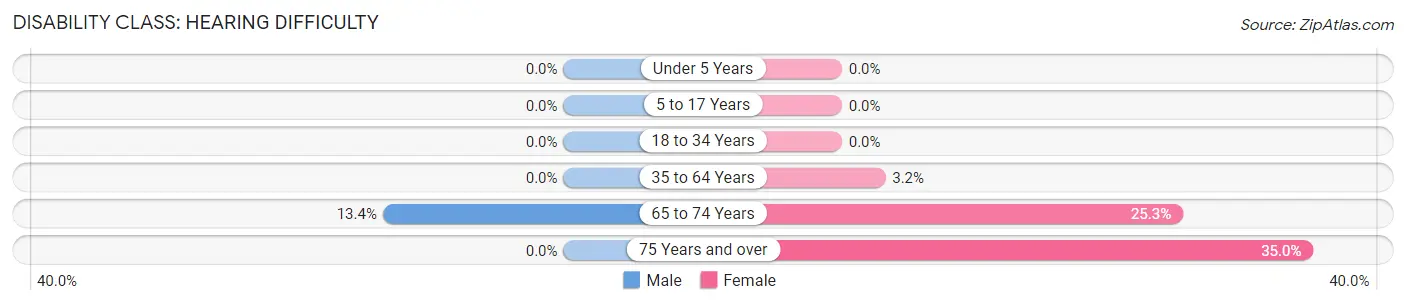
| Age Bracket | Male | Female |
| Under 5 Years | 0 (0.0%) | 0 (0.0%) |
| 5 to 17 Years | 0 (0.0%) | 0 (0.0%) |
| 18 to 34 Years | 0 (0.0%) | 0 (0.0%) |
| 35 to 64 Years | 0 (0.0%) | 6 (3.2%) |
| 65 to 74 Years | 11 (13.4%) | 19 (25.3%) |
| 75 Years and over | 0 (0.0%) | 7 (35.0%) |
Disability Class: Vision Difficulty
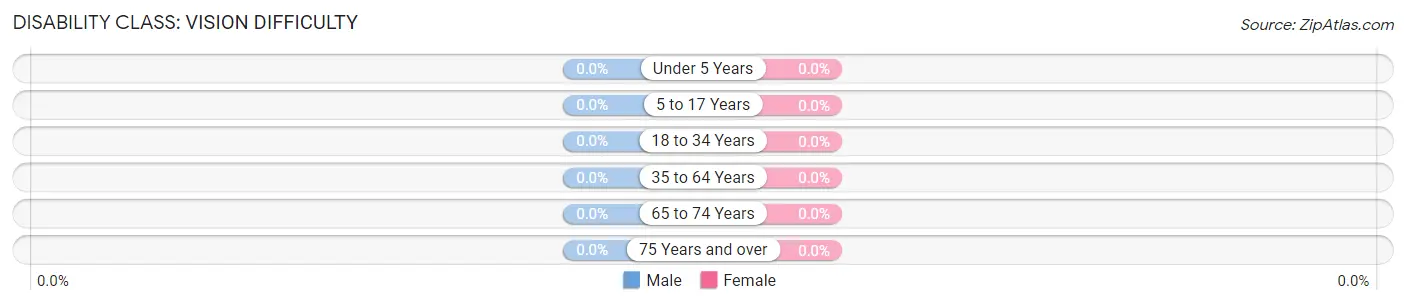
| Age Bracket | Male | Female |
| Under 5 Years | 0 (0.0%) | 0 (0.0%) |
| 5 to 17 Years | 0 (0.0%) | 0 (0.0%) |
| 18 to 34 Years | 0 (0.0%) | 0 (0.0%) |
| 35 to 64 Years | 0 (0.0%) | 0 (0.0%) |
| 65 to 74 Years | 0 (0.0%) | 0 (0.0%) |
| 75 Years and over | 0 (0.0%) | 0 (0.0%) |
Disability Class: Cognitive Difficulty
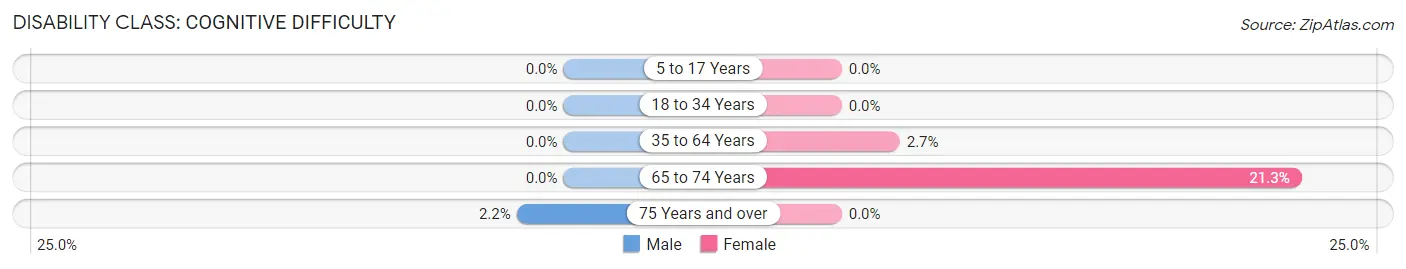
| Age Bracket | Male | Female |
| 5 to 17 Years | 0 (0.0%) | 0 (0.0%) |
| 18 to 34 Years | 0 (0.0%) | 0 (0.0%) |
| 35 to 64 Years | 0 (0.0%) | 5 (2.7%) |
| 65 to 74 Years | 0 (0.0%) | 16 (21.3%) |
| 75 Years and over | 1 (2.2%) | 0 (0.0%) |
Disability Class: Ambulatory Difficulty
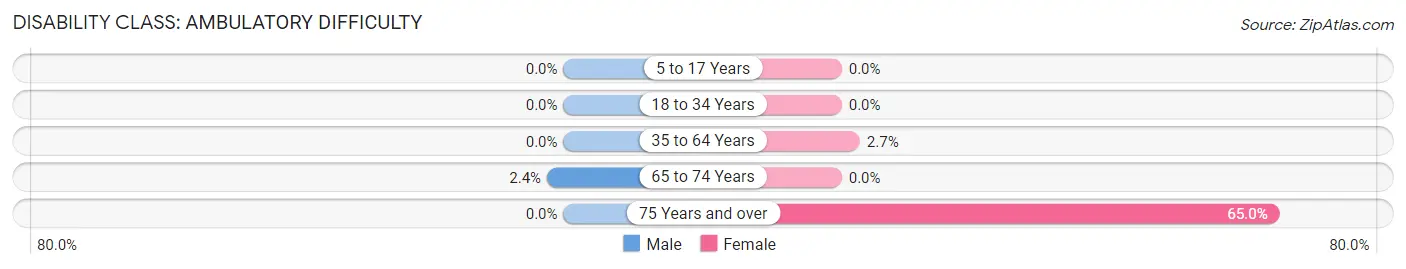
| Age Bracket | Male | Female |
| 5 to 17 Years | 0 (0.0%) | 0 (0.0%) |
| 18 to 34 Years | 0 (0.0%) | 0 (0.0%) |
| 35 to 64 Years | 0 (0.0%) | 5 (2.7%) |
| 65 to 74 Years | 2 (2.4%) | 0 (0.0%) |
| 75 Years and over | 0 (0.0%) | 13 (65.0%) |
Disability Class: Self-Care Difficulty
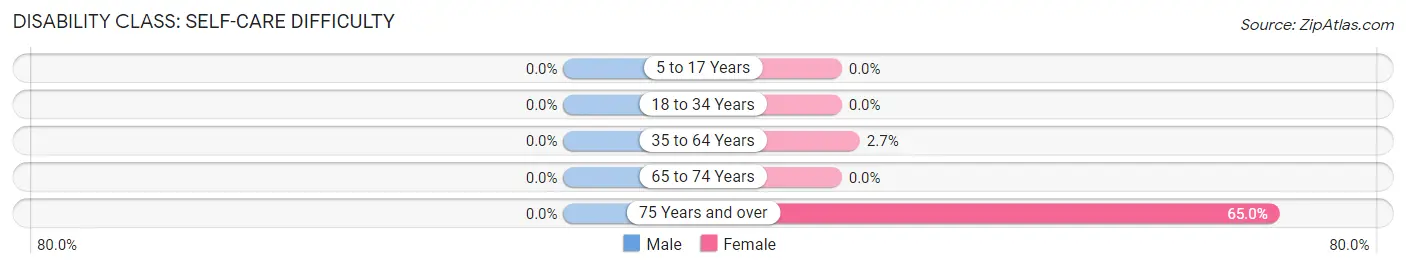
| Age Bracket | Male | Female |
| 5 to 17 Years | 0 (0.0%) | 0 (0.0%) |
| 18 to 34 Years | 0 (0.0%) | 0 (0.0%) |
| 35 to 64 Years | 0 (0.0%) | 5 (2.7%) |
| 65 to 74 Years | 0 (0.0%) | 0 (0.0%) |
| 75 Years and over | 0 (0.0%) | 13 (65.0%) |
Technology Access in Potter Lake
Computing Device Access in Potter Lake
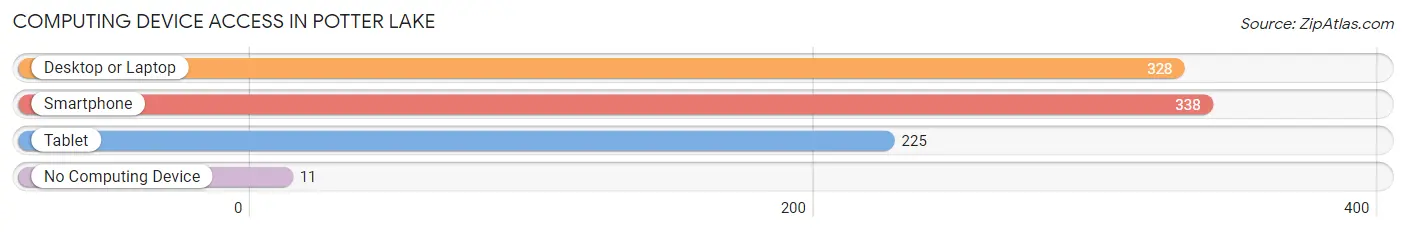
| Device Type | # Households | % Households |
| Desktop or Laptop | 328 | 90.9% |
| Smartphone | 338 | 93.6% |
| Tablet | 225 | 62.3% |
| No Computing Device | 11 | 3.0% |
| Total | 361 | 100.0% |
Internet Access in Potter Lake
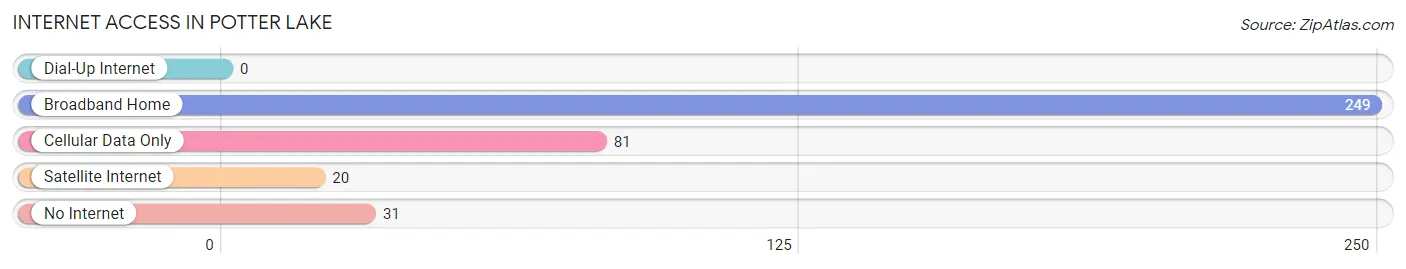
| Internet Type | # Households | % Households |
| Dial-Up Internet | 0 | 0.0% |
| Broadband Home | 249 | 69.0% |
| Cellular Data Only | 81 | 22.4% |
| Satellite Internet | 20 | 5.5% |
| No Internet | 31 | 8.6% |
| Total | 361 | 100.0% |
Potter Lake Summary
Potter Lake, Wisconsin is a small unincorporated community located in the Town of Potter in Waushara County, Wisconsin. The community is situated on the north shore of Potter Lake, a small lake of approximately 200 acres. Potter Lake is located in the Central Sands region of Wisconsin, an area known for its sandy soils and rolling hills. The community is located approximately 25 miles northwest of Wautoma, the county seat of Waushara County.
History
Potter Lake was first settled in the late 1800s by a group of German immigrants. The settlers were attracted to the area by the abundance of timber and the potential for farming. The settlers cleared the land and built homes, farms, and businesses. The community was named after the lake, which was named after the first settler, John Potter.
In the early 1900s, the community began to grow and prosper. A post office was established in 1906 and a school was built in 1908. The school served the community until it closed in the 1950s.
In the 1950s, the community began to decline as many of the residents moved away in search of better economic opportunities. The post office closed in the 1960s and the school was closed in the 1970s.
Today, Potter Lake is a small, rural community with a population of approximately 200 people. The community is home to a few businesses, including a general store, a gas station, and a restaurant.
Geography
Potter Lake is located in the Central Sands region of Wisconsin. The area is characterized by sandy soils and rolling hills. The lake is approximately 200 acres in size and is surrounded by a mix of hardwood and coniferous forests. The lake is fed by several small streams and is home to a variety of fish species, including bass, walleye, and panfish.
The community is located approximately 25 miles northwest of Wautoma, the county seat of Waushara County. The nearest major city is Appleton, which is located approximately 50 miles to the east.
Economy
The economy of Potter Lake is largely based on tourism and agriculture. The area is popular with tourists due to its natural beauty and recreational opportunities. The lake is a popular destination for fishing, boating, and swimming. The surrounding forests are popular for hunting and hiking.
Agriculture is also an important part of the local economy. The area is home to several small farms that produce a variety of crops, including corn, soybeans, and hay.
Demographics
As of the 2010 census, the population of Potter Lake was approximately 200 people. The racial makeup of the community was 97.5% White, 0.5% African American, 0.5% Native American, and 1.5% from other races. The median household income was $41,250 and the median home value was $117,500.
Conclusion
Potter Lake, Wisconsin is a small, rural community located in the Central Sands region of Wisconsin. The community is home to a few businesses and is popular with tourists due to its natural beauty and recreational opportunities. The economy of the community is largely based on tourism and agriculture. The population of Potter Lake is approximately 200 people and the median household income is $41,250.
Common Questions
What is Per Capita Income in Potter Lake?
Per Capita income in Potter Lake is $45,234.
What is the Median Family Income in Potter Lake?
Median Family Income in Potter Lake is $97,596.
What is the Median Household income in Potter Lake?
Median Household Income in Potter Lake is $89,447.
What is Income or Wage Gap in Potter Lake?
Income or Wage Gap in Potter Lake is 44.1%.
Women in Potter Lake earn 55.9 cents for every dollar earned by a man.
What is Inequality or Gini Index in Potter Lake?
Inequality or Gini Index in Potter Lake is 0.29.
What is the Total Population of Potter Lake?
Total Population of Potter Lake is 879.
What is the Total Male Population of Potter Lake?
Total Male Population of Potter Lake is 450.
What is the Total Female Population of Potter Lake?
Total Female Population of Potter Lake is 429.
What is the Ratio of Males per 100 Females in Potter Lake?
There are 104.90 Males per 100 Females in Potter Lake.
What is the Ratio of Females per 100 Males in Potter Lake?
There are 95.33 Females per 100 Males in Potter Lake.
What is the Median Population Age in Potter Lake?
Median Population Age in Potter Lake is 40.9 Years.
What is the Average Family Size in Potter Lake
Average Family Size in Potter Lake is 2.7 People.
What is the Average Household Size in Potter Lake
Average Household Size in Potter Lake is 2.4 People.
How Large is the Labor Force in Potter Lake?
There are 452 People in the Labor Forcein in Potter Lake.
What is the Percentage of People in the Labor Force in Potter Lake?
67.2% of People are in the Labor Force in Potter Lake.