Ottawa vs Cuban 3 or more Vehicles in Household
COMPARE
Ottawa
Cuban
3 or more Vehicles in Household
3 or more Vehicles in Household Comparison
Ottawa
Cubans
20.1%
3 OR MORE VEHICLES IN HOUSEHOLD
84.9/ 100
METRIC RATING
141st/ 347
METRIC RANK
19.3%
3 OR MORE VEHICLES IN HOUSEHOLD
36.6/ 100
METRIC RATING
182nd/ 347
METRIC RANK
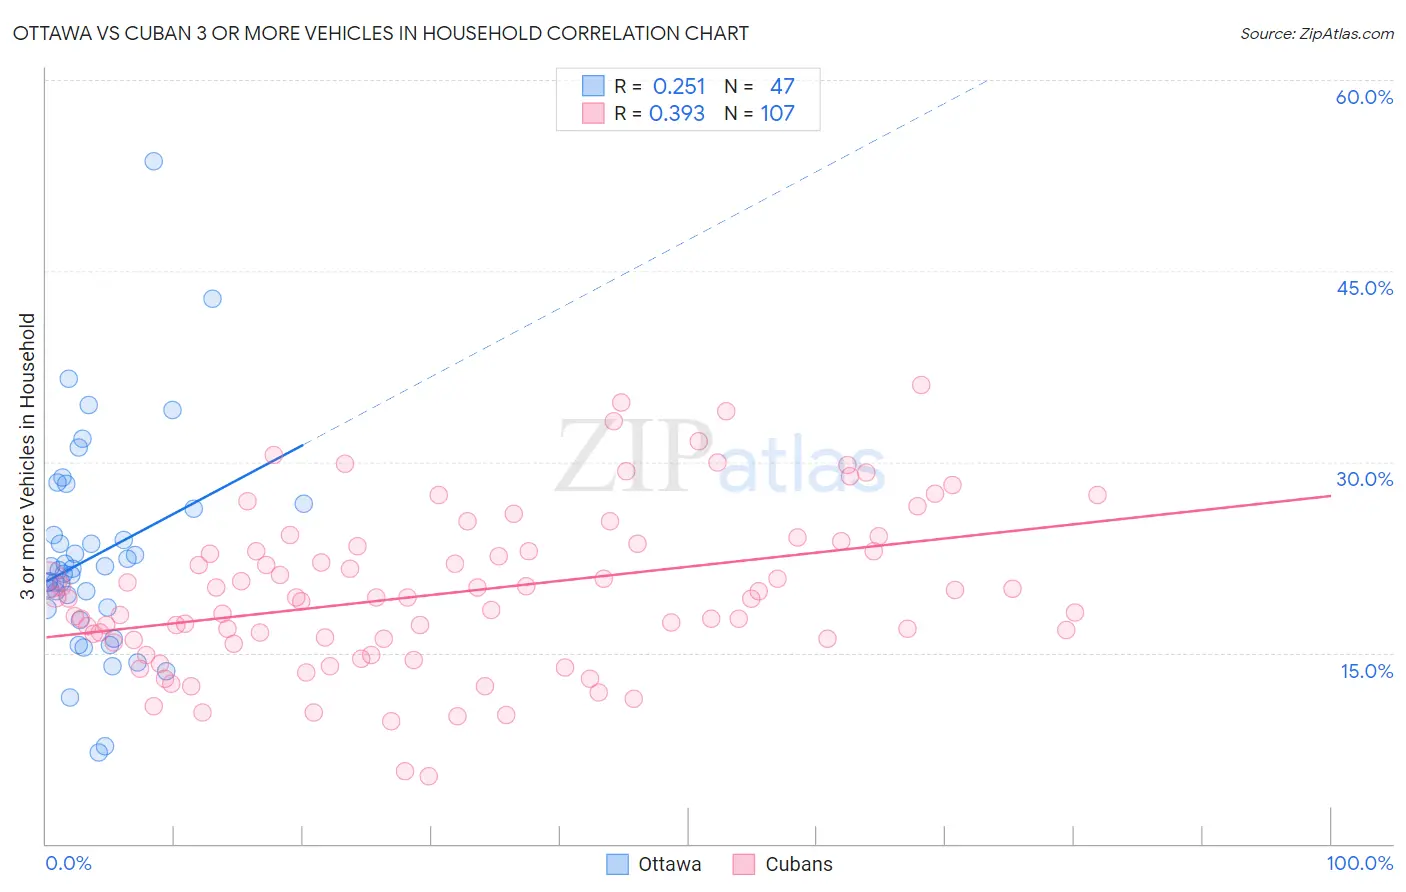
Ottawa vs Cuban 3 or more Vehicles in Household Correlation Chart
The statistical analysis conducted on geographies consisting of 49,939,188 people shows a weak positive correlation between the proportion of Ottawa and percentage of households with 3 or more vehicles available in the United States with a correlation coefficient (R) of 0.251 and weighted average of 20.1%. Similarly, the statistical analysis conducted on geographies consisting of 448,802,841 people shows a mild positive correlation between the proportion of Cubans and percentage of households with 3 or more vehicles available in the United States with a correlation coefficient (R) of 0.393 and weighted average of 19.3%, a difference of 4.3%.
3 or more Vehicles in Household Correlation Summary
| Measurement | Ottawa | Cuban |
| Minimum | 7.1% | 5.3% |
| Maximum | 53.7% | 36.0% |
| Range | 46.5% | 30.7% |
| Mean | 22.6% | 19.8% |
| Median | 21.5% | 19.3% |
| Interquartile 25% (IQ1) | 18.5% | 16.0% |
| Interquartile 75% (IQ3) | 26.3% | 23.3% |
| Interquartile Range (IQR) | 7.8% | 7.3% |
| Standard Deviation (Sample) | 8.4% | 6.3% |
| Standard Deviation (Population) | 8.3% | 6.2% |
Similar Demographics by 3 or more Vehicles in Household
Demographics Similar to Ottawa by 3 or more Vehicles in Household
In terms of 3 or more vehicles in household, the demographic groups most similar to Ottawa are French American Indian (20.1%, a difference of 0.060%), Jordanian (20.1%, a difference of 0.060%), Lithuanian (20.1%, a difference of 0.070%), Slovene (20.2%, a difference of 0.090%), and Iranian (20.1%, a difference of 0.12%).
| Demographics | Rating | Rank | 3 or more Vehicles in Household |
| Poles | 87.3 /100 | #134 | Excellent 20.2% |
| Immigrants | India | 87.2 /100 | #135 | Excellent 20.2% |
| Immigrants | Nicaragua | 87.1 /100 | #136 | Excellent 20.2% |
| Immigrants | Iraq | 87.1 /100 | #137 | Excellent 20.2% |
| Aleuts | 86.3 /100 | #138 | Excellent 20.2% |
| Slovenes | 85.5 /100 | #139 | Excellent 20.2% |
| French American Indians | 85.3 /100 | #140 | Excellent 20.1% |
| Ottawa | 84.9 /100 | #141 | Excellent 20.1% |
| Jordanians | 84.4 /100 | #142 | Excellent 20.1% |
| Lithuanians | 84.4 /100 | #143 | Excellent 20.1% |
| Iranians | 84.0 /100 | #144 | Excellent 20.1% |
| Palestinians | 83.9 /100 | #145 | Excellent 20.1% |
| Australians | 83.6 /100 | #146 | Excellent 20.1% |
| Slovaks | 83.0 /100 | #147 | Excellent 20.1% |
| Guatemalans | 82.6 /100 | #148 | Excellent 20.1% |
Demographics Similar to Cubans by 3 or more Vehicles in Household
In terms of 3 or more vehicles in household, the demographic groups most similar to Cubans are Romanian (19.3%, a difference of 0.040%), Cajun (19.3%, a difference of 0.050%), South African (19.3%, a difference of 0.070%), Latvian (19.3%, a difference of 0.070%), and Immigrants from South Central Asia (19.3%, a difference of 0.19%).
| Demographics | Rating | Rank | 3 or more Vehicles in Household |
| Syrians | 47.0 /100 | #175 | Average 19.5% |
| Iroquois | 46.0 /100 | #176 | Average 19.4% |
| Immigrants | Peru | 41.1 /100 | #177 | Average 19.4% |
| Immigrants | Syria | 40.3 /100 | #178 | Average 19.4% |
| Immigrants | South Central Asia | 38.9 /100 | #179 | Fair 19.3% |
| South Africans | 37.5 /100 | #180 | Fair 19.3% |
| Romanians | 37.1 /100 | #181 | Fair 19.3% |
| Cubans | 36.6 /100 | #182 | Fair 19.3% |
| Cajuns | 36.0 /100 | #183 | Fair 19.3% |
| Latvians | 35.7 /100 | #184 | Fair 19.3% |
| Immigrants | Sri Lanka | 30.7 /100 | #185 | Fair 19.2% |
| Immigrants | Sweden | 29.0 /100 | #186 | Fair 19.2% |
| Immigrants | Hong Kong | 28.3 /100 | #187 | Fair 19.2% |
| Immigrants | Kuwait | 26.1 /100 | #188 | Fair 19.1% |
| Indians (Asian) | 26.0 /100 | #189 | Fair 19.1% |