Luxembourger vs Soviet Union 3 or more Vehicles in Household
COMPARE
Luxembourger
Soviet Union
3 or more Vehicles in Household
3 or more Vehicles in Household Comparison
Luxembourgers
Soviet Union
20.9%
3 OR MORE VEHICLES IN HOUSEHOLD
97.7/ 100
METRIC RATING
104th/ 347
METRIC RANK
14.2%
3 OR MORE VEHICLES IN HOUSEHOLD
0.0/ 100
METRIC RATING
326th/ 347
METRIC RANK
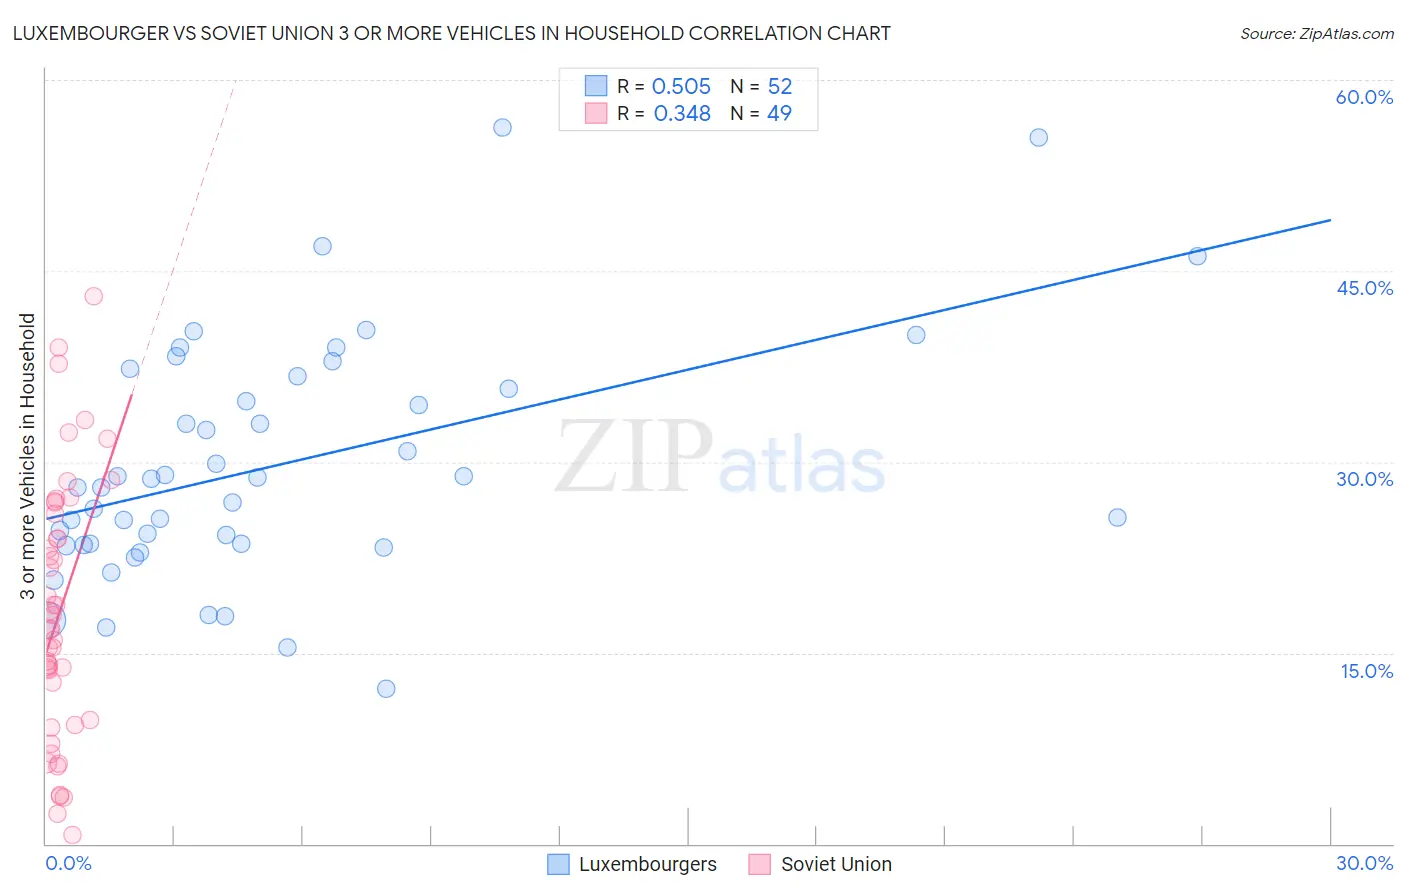
Luxembourger vs Soviet Union 3 or more Vehicles in Household Correlation Chart
The statistical analysis conducted on geographies consisting of 144,618,677 people shows a substantial positive correlation between the proportion of Luxembourgers and percentage of households with 3 or more vehicles available in the United States with a correlation coefficient (R) of 0.505 and weighted average of 20.9%. Similarly, the statistical analysis conducted on geographies consisting of 43,505,589 people shows a mild positive correlation between the proportion of Soviet Union and percentage of households with 3 or more vehicles available in the United States with a correlation coefficient (R) of 0.348 and weighted average of 14.2%, a difference of 47.2%.
3 or more Vehicles in Household Correlation Summary
| Measurement | Luxembourger | Soviet Union |
| Minimum | 12.2% | 0.69% |
| Maximum | 56.2% | 43.0% |
| Range | 44.1% | 42.4% |
| Mean | 29.8% | 18.2% |
| Median | 28.4% | 16.9% |
| Interquartile 25% (IQ1) | 23.5% | 9.5% |
| Interquartile 75% (IQ3) | 36.2% | 26.4% |
| Interquartile Range (IQR) | 12.7% | 16.8% |
| Standard Deviation (Sample) | 9.4% | 10.2% |
| Standard Deviation (Population) | 9.3% | 10.1% |
Similar Demographics by 3 or more Vehicles in Household
Demographics Similar to Luxembourgers by 3 or more Vehicles in Household
In terms of 3 or more vehicles in household, the demographic groups most similar to Luxembourgers are Dutch West Indian (20.9%, a difference of 0.080%), Austrian (20.9%, a difference of 0.10%), Seminole (20.9%, a difference of 0.12%), Blackfeet (20.9%, a difference of 0.15%), and Bolivian (20.8%, a difference of 0.20%).
| Demographics | Rating | Rank | 3 or more Vehicles in Household |
| Canadians | 98.3 /100 | #97 | Exceptional 21.0% |
| Hmong | 98.2 /100 | #98 | Exceptional 21.0% |
| Alaska Natives | 98.2 /100 | #99 | Exceptional 21.0% |
| Comanche | 98.2 /100 | #100 | Exceptional 21.0% |
| Blackfeet | 97.9 /100 | #101 | Exceptional 20.9% |
| Seminole | 97.8 /100 | #102 | Exceptional 20.9% |
| Dutch West Indians | 97.8 /100 | #103 | Exceptional 20.9% |
| Luxembourgers | 97.7 /100 | #104 | Exceptional 20.9% |
| Austrians | 97.5 /100 | #105 | Exceptional 20.9% |
| Bolivians | 97.4 /100 | #106 | Exceptional 20.8% |
| Immigrants | Germany | 97.4 /100 | #107 | Exceptional 20.8% |
| Immigrants | Scotland | 97.1 /100 | #108 | Exceptional 20.8% |
| Filipinos | 97.0 /100 | #109 | Exceptional 20.8% |
| Asians | 96.8 /100 | #110 | Exceptional 20.8% |
| Immigrants | Micronesia | 96.7 /100 | #111 | Exceptional 20.7% |
Demographics Similar to Soviet Union by 3 or more Vehicles in Household
In terms of 3 or more vehicles in household, the demographic groups most similar to Soviet Union are Senegalese (14.2%, a difference of 0.33%), Immigrants from Yemen (14.2%, a difference of 0.41%), Ecuadorian (14.1%, a difference of 0.89%), Immigrants from Albania (14.0%, a difference of 1.6%), and Immigrants from Caribbean (14.6%, a difference of 2.7%).
| Demographics | Rating | Rank | 3 or more Vehicles in Household |
| Cape Verdeans | 0.0 /100 | #319 | Tragic 15.0% |
| Yup'ik | 0.0 /100 | #320 | Tragic 14.8% |
| Immigrants | Jamaica | 0.0 /100 | #321 | Tragic 14.7% |
| Immigrants | West Indies | 0.0 /100 | #322 | Tragic 14.6% |
| Immigrants | Caribbean | 0.0 /100 | #323 | Tragic 14.6% |
| Immigrants | Yemen | 0.0 /100 | #324 | Tragic 14.2% |
| Senegalese | 0.0 /100 | #325 | Tragic 14.2% |
| Soviet Union | 0.0 /100 | #326 | Tragic 14.2% |
| Ecuadorians | 0.0 /100 | #327 | Tragic 14.1% |
| Immigrants | Albania | 0.0 /100 | #328 | Tragic 14.0% |
| Immigrants | Senegal | 0.0 /100 | #329 | Tragic 13.8% |
| West Indians | 0.0 /100 | #330 | Tragic 13.7% |
| Immigrants | Dominica | 0.0 /100 | #331 | Tragic 13.7% |
| Trinidadians and Tobagonians | 0.0 /100 | #332 | Tragic 13.6% |
| Immigrants | Cabo Verde | 0.0 /100 | #333 | Tragic 13.6% |