Immigrants from South Central Asia vs Immigrants from Bangladesh 3 or more Vehicles in Household
COMPARE
Immigrants from South Central Asia
Immigrants from Bangladesh
3 or more Vehicles in Household
3 or more Vehicles in Household Comparison
Immigrants from South Central Asia
Immigrants from Bangladesh
19.3%
3 OR MORE VEHICLES IN HOUSEHOLD
38.9/ 100
METRIC RATING
179th/ 347
METRIC RANK
12.5%
3 OR MORE VEHICLES IN HOUSEHOLD
0.0/ 100
METRIC RATING
337th/ 347
METRIC RANK
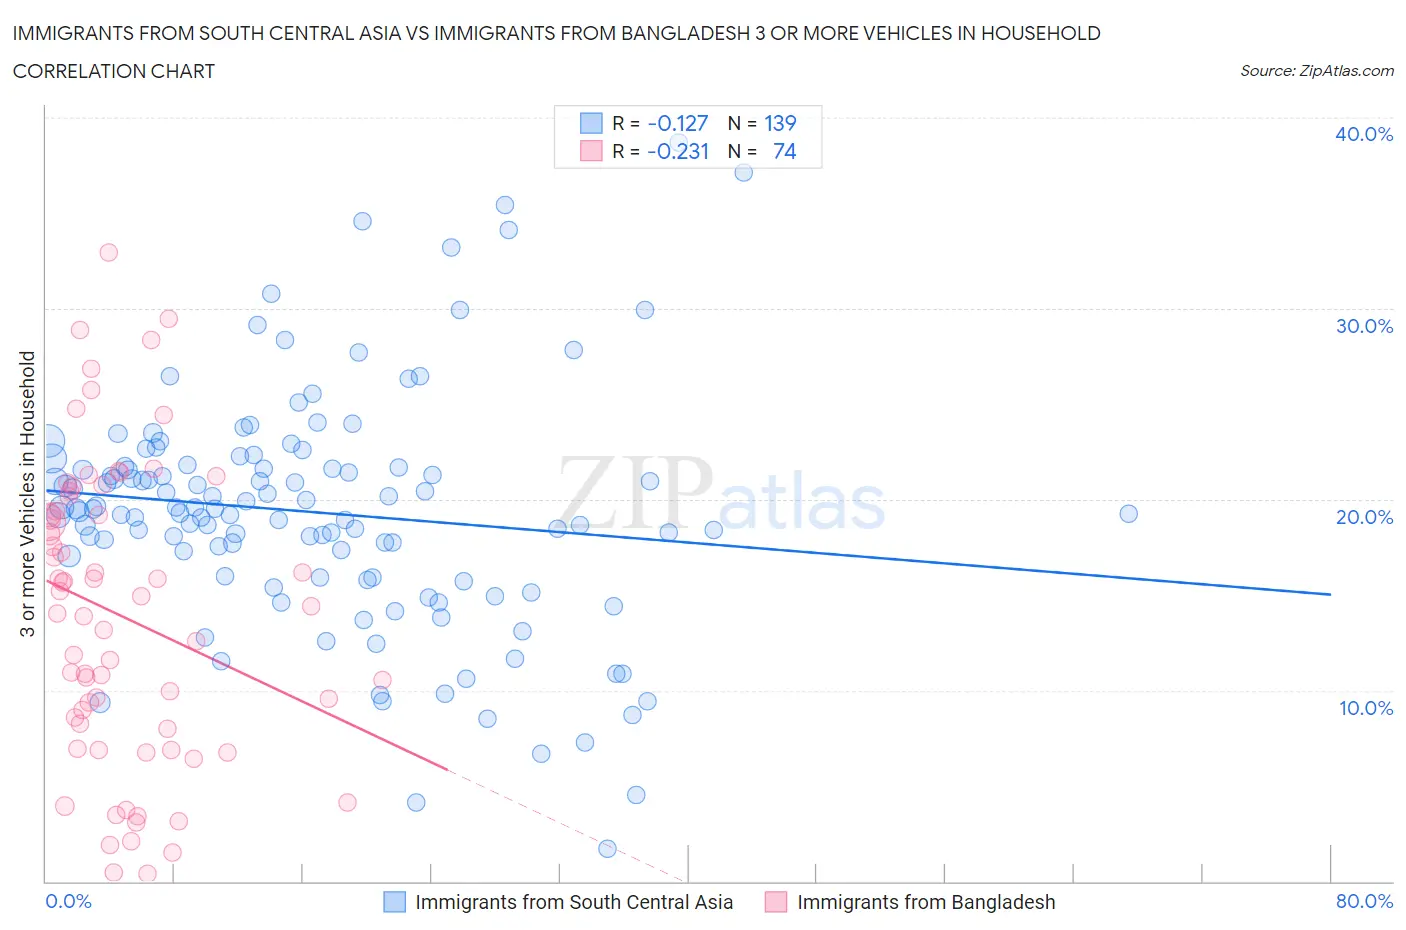
Immigrants from South Central Asia vs Immigrants from Bangladesh 3 or more Vehicles in Household Correlation Chart
The statistical analysis conducted on geographies consisting of 472,461,759 people shows a poor negative correlation between the proportion of Immigrants from South Central Asia and percentage of households with 3 or more vehicles available in the United States with a correlation coefficient (R) of -0.127 and weighted average of 19.3%. Similarly, the statistical analysis conducted on geographies consisting of 203,530,312 people shows a weak negative correlation between the proportion of Immigrants from Bangladesh and percentage of households with 3 or more vehicles available in the United States with a correlation coefficient (R) of -0.231 and weighted average of 12.5%, a difference of 54.5%.
3 or more Vehicles in Household Correlation Summary
| Measurement | Immigrants from South Central Asia | Immigrants from Bangladesh |
| Minimum | 1.7% | 0.43% |
| Maximum | 38.7% | 33.0% |
| Range | 37.0% | 32.5% |
| Mean | 19.3% | 13.9% |
| Median | 19.5% | 14.2% |
| Interquartile 25% (IQ1) | 15.9% | 8.0% |
| Interquartile 75% (IQ3) | 21.7% | 19.4% |
| Interquartile Range (IQR) | 5.8% | 11.4% |
| Standard Deviation (Sample) | 6.3% | 7.8% |
| Standard Deviation (Population) | 6.2% | 7.7% |
Similar Demographics by 3 or more Vehicles in Household
Demographics Similar to Immigrants from South Central Asia by 3 or more Vehicles in Household
In terms of 3 or more vehicles in household, the demographic groups most similar to Immigrants from South Central Asia are Immigrants from Syria (19.4%, a difference of 0.11%), South African (19.3%, a difference of 0.11%), Romanian (19.3%, a difference of 0.15%), Immigrants from Peru (19.4%, a difference of 0.17%), and Cuban (19.3%, a difference of 0.19%).
| Demographics | Rating | Rank | 3 or more Vehicles in Household |
| Kiowa | 50.9 /100 | #172 | Average 19.5% |
| Immigrants | Northern Europe | 50.2 /100 | #173 | Average 19.5% |
| Immigrants | South Africa | 50.0 /100 | #174 | Average 19.5% |
| Syrians | 47.0 /100 | #175 | Average 19.5% |
| Iroquois | 46.0 /100 | #176 | Average 19.4% |
| Immigrants | Peru | 41.1 /100 | #177 | Average 19.4% |
| Immigrants | Syria | 40.3 /100 | #178 | Average 19.4% |
| Immigrants | South Central Asia | 38.9 /100 | #179 | Fair 19.3% |
| South Africans | 37.5 /100 | #180 | Fair 19.3% |
| Romanians | 37.1 /100 | #181 | Fair 19.3% |
| Cubans | 36.6 /100 | #182 | Fair 19.3% |
| Cajuns | 36.0 /100 | #183 | Fair 19.3% |
| Latvians | 35.7 /100 | #184 | Fair 19.3% |
| Immigrants | Sri Lanka | 30.7 /100 | #185 | Fair 19.2% |
| Immigrants | Sweden | 29.0 /100 | #186 | Fair 19.2% |
Demographics Similar to Immigrants from Bangladesh by 3 or more Vehicles in Household
In terms of 3 or more vehicles in household, the demographic groups most similar to Immigrants from Bangladesh are Barbadian (12.6%, a difference of 0.44%), Vietnamese (12.5%, a difference of 0.54%), Immigrants from Uzbekistan (12.0%, a difference of 4.4%), Immigrants from Trinidad and Tobago (13.3%, a difference of 6.6%), and Immigrants from Barbados (11.7%, a difference of 6.8%).
| Demographics | Rating | Rank | 3 or more Vehicles in Household |
| West Indians | 0.0 /100 | #330 | Tragic 13.7% |
| Immigrants | Dominica | 0.0 /100 | #331 | Tragic 13.7% |
| Trinidadians and Tobagonians | 0.0 /100 | #332 | Tragic 13.6% |
| Immigrants | Cabo Verde | 0.0 /100 | #333 | Tragic 13.6% |
| Immigrants | Ecuador | 0.0 /100 | #334 | Tragic 13.4% |
| Immigrants | Trinidad and Tobago | 0.0 /100 | #335 | Tragic 13.3% |
| Barbadians | 0.0 /100 | #336 | Tragic 12.6% |
| Immigrants | Bangladesh | 0.0 /100 | #337 | Tragic 12.5% |
| Vietnamese | 0.0 /100 | #338 | Tragic 12.5% |
| Immigrants | Uzbekistan | 0.0 /100 | #339 | Tragic 12.0% |
| Immigrants | Barbados | 0.0 /100 | #340 | Tragic 11.7% |
| Guyanese | 0.0 /100 | #341 | Tragic 11.5% |
| British West Indians | 0.0 /100 | #342 | Tragic 11.4% |
| Immigrants | Guyana | 0.0 /100 | #343 | Tragic 11.2% |
| Dominicans | 0.0 /100 | #344 | Tragic 11.2% |