Immigrants from South Central Asia vs Immigrants from Chile 3 or more Vehicles in Household
COMPARE
Immigrants from South Central Asia
Immigrants from Chile
3 or more Vehicles in Household
3 or more Vehicles in Household Comparison
Immigrants from South Central Asia
Immigrants from Chile
19.3%
3 OR MORE VEHICLES IN HOUSEHOLD
38.9/ 100
METRIC RATING
179th/ 347
METRIC RANK
18.8%
3 OR MORE VEHICLES IN HOUSEHOLD
13.6/ 100
METRIC RATING
207th/ 347
METRIC RANK
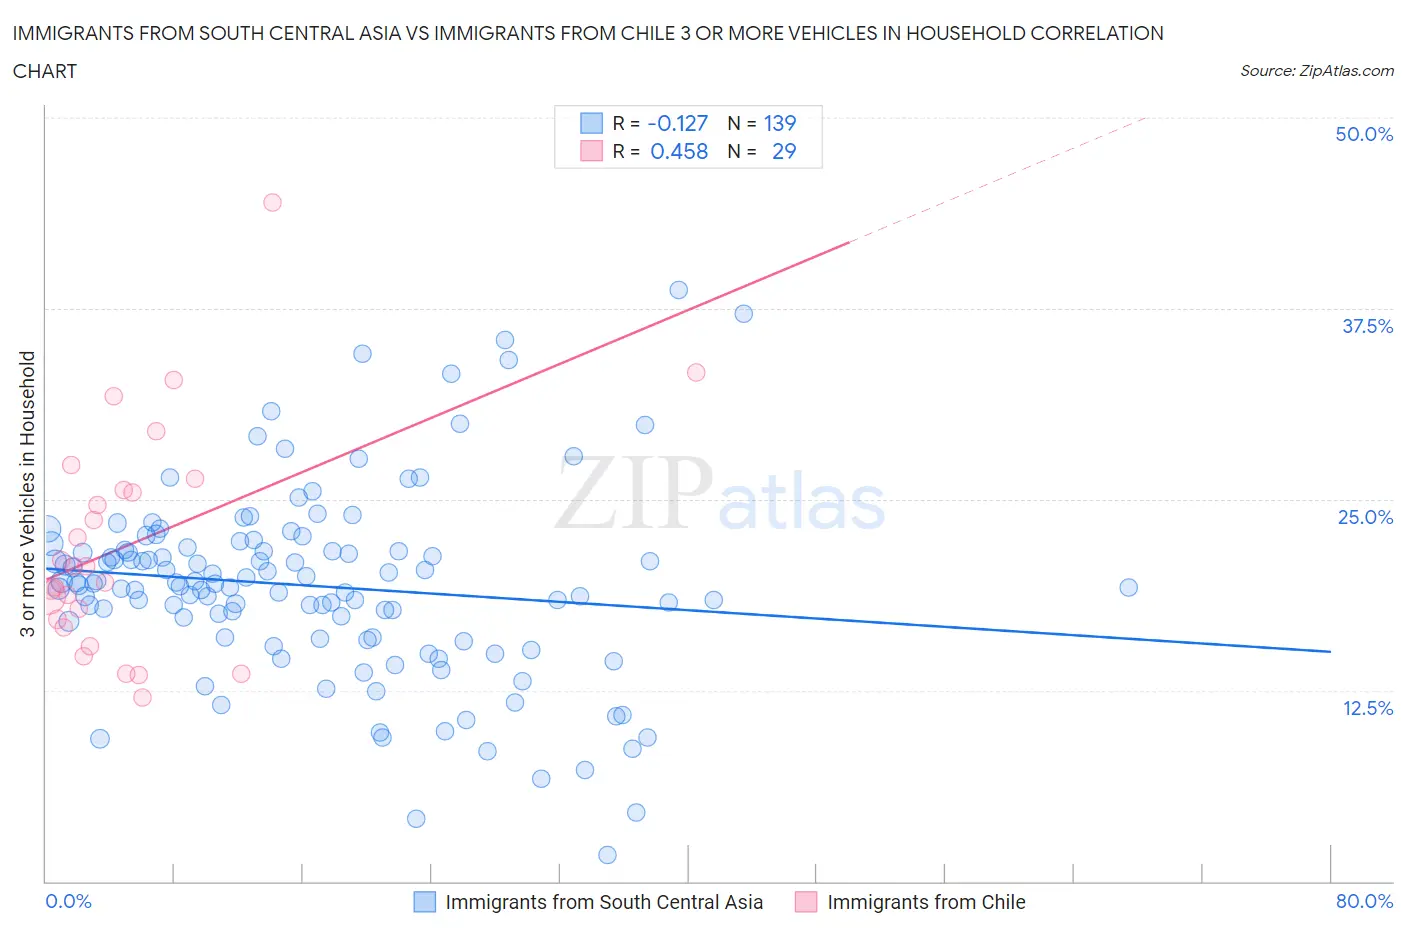
Immigrants from South Central Asia vs Immigrants from Chile 3 or more Vehicles in Household Correlation Chart
The statistical analysis conducted on geographies consisting of 472,461,759 people shows a poor negative correlation between the proportion of Immigrants from South Central Asia and percentage of households with 3 or more vehicles available in the United States with a correlation coefficient (R) of -0.127 and weighted average of 19.3%. Similarly, the statistical analysis conducted on geographies consisting of 218,586,627 people shows a moderate positive correlation between the proportion of Immigrants from Chile and percentage of households with 3 or more vehicles available in the United States with a correlation coefficient (R) of 0.458 and weighted average of 18.8%, a difference of 2.7%.
3 or more Vehicles in Household Correlation Summary
| Measurement | Immigrants from South Central Asia | Immigrants from Chile |
| Minimum | 1.7% | 12.0% |
| Maximum | 38.7% | 44.4% |
| Range | 37.0% | 32.4% |
| Mean | 19.3% | 22.0% |
| Median | 19.5% | 20.6% |
| Interquartile 25% (IQ1) | 15.9% | 16.9% |
| Interquartile 75% (IQ3) | 21.7% | 26.0% |
| Interquartile Range (IQR) | 5.8% | 9.1% |
| Standard Deviation (Sample) | 6.3% | 7.3% |
| Standard Deviation (Population) | 6.2% | 7.2% |
Similar Demographics by 3 or more Vehicles in Household
Demographics Similar to Immigrants from South Central Asia by 3 or more Vehicles in Household
In terms of 3 or more vehicles in household, the demographic groups most similar to Immigrants from South Central Asia are Immigrants from Syria (19.4%, a difference of 0.11%), South African (19.3%, a difference of 0.11%), Romanian (19.3%, a difference of 0.15%), Immigrants from Peru (19.4%, a difference of 0.17%), and Cuban (19.3%, a difference of 0.19%).
| Demographics | Rating | Rank | 3 or more Vehicles in Household |
| Kiowa | 50.9 /100 | #172 | Average 19.5% |
| Immigrants | Northern Europe | 50.2 /100 | #173 | Average 19.5% |
| Immigrants | South Africa | 50.0 /100 | #174 | Average 19.5% |
| Syrians | 47.0 /100 | #175 | Average 19.5% |
| Iroquois | 46.0 /100 | #176 | Average 19.4% |
| Immigrants | Peru | 41.1 /100 | #177 | Average 19.4% |
| Immigrants | Syria | 40.3 /100 | #178 | Average 19.4% |
| Immigrants | South Central Asia | 38.9 /100 | #179 | Fair 19.3% |
| South Africans | 37.5 /100 | #180 | Fair 19.3% |
| Romanians | 37.1 /100 | #181 | Fair 19.3% |
| Cubans | 36.6 /100 | #182 | Fair 19.3% |
| Cajuns | 36.0 /100 | #183 | Fair 19.3% |
| Latvians | 35.7 /100 | #184 | Fair 19.3% |
| Immigrants | Sri Lanka | 30.7 /100 | #185 | Fair 19.2% |
| Immigrants | Sweden | 29.0 /100 | #186 | Fair 19.2% |
Demographics Similar to Immigrants from Chile by 3 or more Vehicles in Household
In terms of 3 or more vehicles in household, the demographic groups most similar to Immigrants from Chile are Immigrants from Burma/Myanmar (18.8%, a difference of 0.010%), Immigrants from Egypt (18.8%, a difference of 0.020%), Immigrants from Eastern Asia (18.8%, a difference of 0.080%), Russian (18.8%, a difference of 0.090%), and Bulgarian (18.8%, a difference of 0.10%).
| Demographics | Rating | Rank | 3 or more Vehicles in Household |
| Argentineans | 18.2 /100 | #200 | Poor 18.9% |
| Arabs | 17.7 /100 | #201 | Poor 18.9% |
| Immigrants | Austria | 15.4 /100 | #202 | Poor 18.9% |
| Tohono O'odham | 14.8 /100 | #203 | Poor 18.9% |
| Immigrants | Romania | 14.6 /100 | #204 | Poor 18.9% |
| Russians | 14.2 /100 | #205 | Poor 18.8% |
| Immigrants | Eastern Asia | 14.1 /100 | #206 | Poor 18.8% |
| Immigrants | Chile | 13.6 /100 | #207 | Poor 18.8% |
| Immigrants | Burma/Myanmar | 13.6 /100 | #208 | Poor 18.8% |
| Immigrants | Egypt | 13.5 /100 | #209 | Poor 18.8% |
| Bulgarians | 13.1 /100 | #210 | Poor 18.8% |
| Immigrants | Kenya | 12.4 /100 | #211 | Poor 18.8% |
| Panamanians | 11.6 /100 | #212 | Poor 18.8% |
| Immigrants | Cuba | 11.6 /100 | #213 | Poor 18.8% |
| Immigrants | Sierra Leone | 10.8 /100 | #214 | Poor 18.7% |