Immigrants from Northern Europe 2 or more Vehicles in Household
COMPARE
Immigrants from Northern Europe
Select to Compare
2 or more Vehicles in Household
Immigrants from Northern Europe 2 or more Vehicles in Household
56.1%
2+ VEHICLES AVAILABLE
78.7/ 100
METRIC RATING
151st/ 347
METRIC RANK
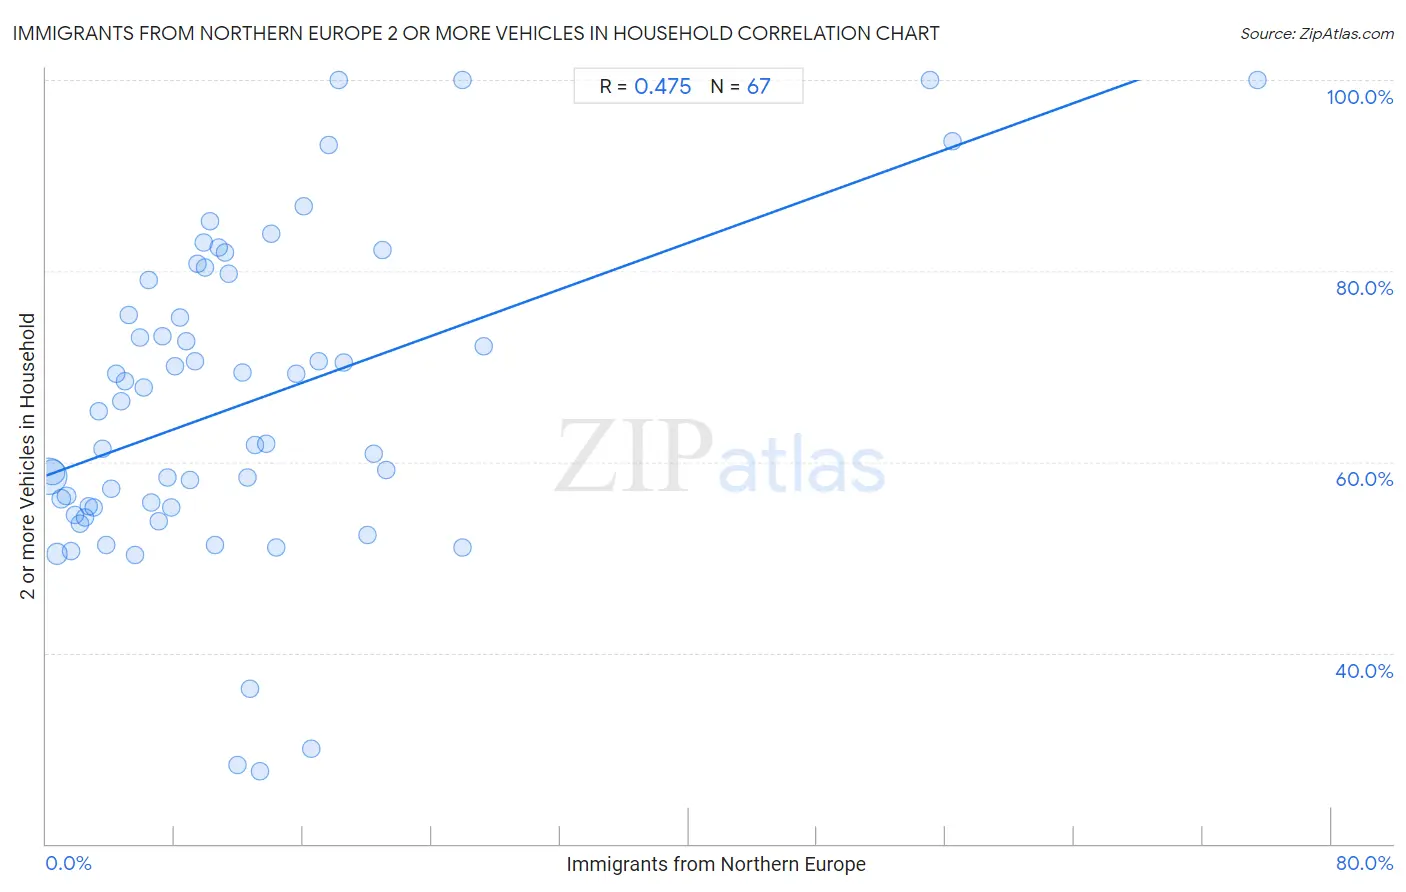
Immigrants from Northern Europe 2 or more Vehicles in Household Correlation Chart
The statistical analysis conducted on geographies consisting of 476,975,889 people shows a moderate positive correlation between the proportion of Immigrants from Northern Europe and percentage of households with 2 or more vehicles available in the United States with a correlation coefficient (R) of 0.475 and weighted average of 56.1%. On average, for every 1% (one percent) increase in Immigrants from Northern Europe within a typical geography, there is an increase of 0.61% in percentage of households with 2 or more vehicles available.
It is essential to understand that the correlation between the percentage of Immigrants from Northern Europe and percentage of households with 2 or more vehicles available does not imply a direct cause-and-effect relationship. It remains uncertain whether the presence of Immigrants from Northern Europe influences an upward or downward trend in the level of percentage of households with 2 or more vehicles available within an area, or if Immigrants from Northern Europe simply ended up residing in those areas with higher or lower levels of percentage of households with 2 or more vehicles available due to other factors.
Demographics Similar to Immigrants from Northern Europe by 2 or more Vehicles in Household
In terms of 2 or more vehicles in household, the demographic groups most similar to Immigrants from Northern Europe are Immigrants from Pakistan (56.1%, a difference of 0.030%), Nicaraguan (56.1%, a difference of 0.070%), Immigrants from Moldova (56.1%, a difference of 0.090%), Chilean (56.1%, a difference of 0.090%), and Serbian (56.1%, a difference of 0.10%).
| Demographics | Rating | Rank | 2 or more Vehicles in Household |
| Immigrants from Syria | 81.4 /100 | #144 | Excellent 56.2% |
| Syrians | 81.2 /100 | #145 | Excellent 56.2% |
| Venezuelans | 80.7 /100 | #146 | Excellent 56.1% |
| Serbians | 80.3 /100 | #147 | Excellent 56.1% |
| Immigrants from Moldova | 80.2 /100 | #148 | Excellent 56.1% |
| Chileans | 80.2 /100 | #149 | Excellent 56.1% |
| Nicaraguans | 79.9 /100 | #150 | Good 56.1% |
| Immigrants from Northern Europe | 78.7 /100 | #151 | Good 56.1% |
| Immigrants from Pakistan | 78.1 /100 | #152 | Good 56.1% |
| Lumbee | 71.9 /100 | #153 | Good 55.9% |
| Ukrainians | 70.8 /100 | #154 | Good 55.8% |
| Immigrants from Venezuela | 70.7 /100 | #155 | Good 55.8% |
| Immigrants from Lithuania | 70.4 /100 | #156 | Good 55.8% |
| Immigrants from Kuwait | 70.2 /100 | #157 | Good 55.8% |
| Tlingit-Haida | 68.5 /100 | #158 | Good 55.8% |
Immigrants from Northern Europe 2 or more Vehicles in Household Correlation Summary
| Measurement | Immigrants from Northern Europe Data | 2 or more Vehicles in Household Data |
| Minimum | 0.13% | 27.6% |
| Maximum | 75.4% | 100.0% |
| Range | 75.3% | 72.4% |
| Mean | 12.3% | 66.1% |
| Median | 9.4% | 65.3% |
| Interquartile 25% (IQ1) | 4.7% | 55.2% |
| Interquartile 75% (IQ3) | 15.5% | 79.1% |
| Interquartile Range (IQR) | 10.9% | 23.9% |
| Standard Deviation (Sample) | 12.9% | 16.6% |
| Standard Deviation (Population) | 12.8% | 16.5% |
Correlation Details
| Immigrants from Northern Europe Percentile | Sample Size | 2 or more Vehicles in Household |
[ 0.0% - 0.5% ] 0.13% | 272,108,387 | 58.5% |
[ 0.0% - 0.5% ] 0.40% | 115,563,704 | 58.9% |
[ 0.5% - 1.0% ] 0.66% | 50,627,921 | 50.4% |
[ 0.5% - 1.0% ] 0.97% | 18,396,057 | 56.2% |
[ 1.0% - 1.5% ] 1.26% | 8,714,796 | 56.4% |
[ 1.5% - 2.0% ] 1.55% | 5,116,722 | 50.7% |
[ 1.5% - 2.0% ] 1.81% | 2,217,395 | 54.5% |
[ 2.0% - 2.5% ] 2.08% | 1,589,130 | 53.5% |
[ 2.0% - 2.5% ] 2.38% | 760,282 | 54.2% |
[ 2.5% - 3.0% ] 2.68% | 491,411 | 55.3% |
[ 2.5% - 3.0% ] 2.96% | 304,371 | 55.2% |
[ 3.0% - 3.5% ] 3.23% | 264,268 | 65.3% |
[ 3.5% - 4.0% ] 3.52% | 208,292 | 61.4% |
[ 3.5% - 4.0% ] 3.77% | 188,861 | 51.3% |
[ 4.0% - 4.5% ] 4.07% | 92,567 | 57.2% |
[ 4.0% - 4.5% ] 4.34% | 76,025 | 69.3% |
[ 4.5% - 5.0% ] 4.67% | 55,708 | 66.4% |
[ 4.5% - 5.0% ] 4.93% | 26,824 | 68.4% |
[ 5.0% - 5.5% ] 5.15% | 24,427 | 75.4% |
[ 5.0% - 5.5% ] 5.49% | 47,206 | 50.3% |
[ 5.5% - 6.0% ] 5.87% | 24,981 | 73.0% |
[ 6.0% - 6.5% ] 6.07% | 2,406 | 67.8% |
[ 6.0% - 6.5% ] 6.41% | 7,287 | 79.1% |
[ 6.5% - 7.0% ] 6.55% | 18,291 | 55.7% |
[ 6.5% - 7.0% ] 6.97% | 12,287 | 53.7% |
[ 7.0% - 7.5% ] 7.27% | 6,066 | 73.1% |
[ 7.5% - 8.0% ] 7.53% | 2,920 | 58.3% |
[ 7.5% - 8.0% ] 7.76% | 2,462 | 55.2% |
[ 8.0% - 8.5% ] 8.02% | 4,636 | 70.0% |
[ 8.0% - 8.5% ] 8.33% | 876 | 75.1% |
[ 8.5% - 9.0% ] 8.68% | 864 | 72.7% |
[ 8.5% - 9.0% ] 8.97% | 1,483 | 58.2% |
[ 9.0% - 9.5% ] 9.24% | 1,180 | 70.5% |
[ 9.0% - 9.5% ] 9.41% | 999 | 80.8% |
[ 9.5% - 10.0% ] 9.82% | 550 | 82.9% |
[ 9.5% - 10.0% ] 9.92% | 595 | 80.3% |
[ 10.0% - 10.5% ] 10.23% | 567 | 85.2% |
[ 10.0% - 10.5% ] 10.49% | 991 | 51.3% |
[ 10.5% - 11.0% ] 10.76% | 1,264 | 82.5% |
[ 11.0% - 11.5% ] 11.14% | 2,540 | 82.0% |
[ 11.0% - 11.5% ] 11.40% | 623 | 79.7% |
[ 11.5% - 12.0% ] 11.90% | 84 | 28.2% |
[ 12.0% - 12.5% ] 12.22% | 180 | 69.4% |
[ 12.0% - 12.5% ] 12.50% | 40 | 58.3% |
[ 12.5% - 13.0% ] 12.72% | 747 | 36.2% |
[ 13.0% - 13.5% ] 13.03% | 238 | 61.7% |
[ 13.0% - 13.5% ] 13.33% | 60 | 27.6% |
[ 13.5% - 14.0% ] 13.66% | 366 | 61.9% |
[ 14.0% - 14.5% ] 14.02% | 1,013 | 84.0% |
[ 14.0% - 14.5% ] 14.35% | 230 | 51.0% |
[ 15.5% - 16.0% ] 15.53% | 953 | 69.3% |
[ 16.0% - 16.5% ] 16.04% | 636 | 86.8% |
[ 16.0% - 16.5% ] 16.50% | 491 | 30.0% |
[ 16.5% - 17.0% ] 16.98% | 106 | 70.5% |
[ 17.5% - 18.0% ] 17.61% | 352 | 93.2% |
[ 18.0% - 18.5% ] 18.18% | 55 | 100.0% |
[ 18.0% - 18.5% ] 18.49% | 119 | 70.3% |
[ 20.0% - 20.5% ] 20.00% | 30 | 52.4% |
[ 20.0% - 20.5% ] 20.35% | 285 | 60.9% |
[ 20.5% - 21.0% ] 20.90% | 244 | 82.2% |
[ 21.0% - 21.5% ] 21.19% | 453 | 59.2% |
[ 25.5% - 26.0% ] 25.93% | 54 | 100.0% |
[ 25.5% - 26.0% ] 25.95% | 185 | 51.0% |
[ 27.0% - 27.5% ] 27.27% | 165 | 72.2% |
[ 55.0% - 55.5% ] 55.00% | 20 | 100.0% |
[ 56.0% - 56.5% ] 56.39% | 321 | 93.5% |
[ 75.0% - 75.5% ] 75.42% | 240 | 100.0% |