Immigrants from North America vs Trinidadian and Tobagonian 3 or more Vehicles in Household
COMPARE
Immigrants from North America
Trinidadian and Tobagonian
3 or more Vehicles in Household
3 or more Vehicles in Household Comparison
Immigrants from North America
Trinidadians and Tobagonians
20.2%
3 OR MORE VEHICLES IN HOUSEHOLD
87.8/ 100
METRIC RATING
133rd/ 347
METRIC RANK
13.6%
3 OR MORE VEHICLES IN HOUSEHOLD
0.0/ 100
METRIC RATING
332nd/ 347
METRIC RANK
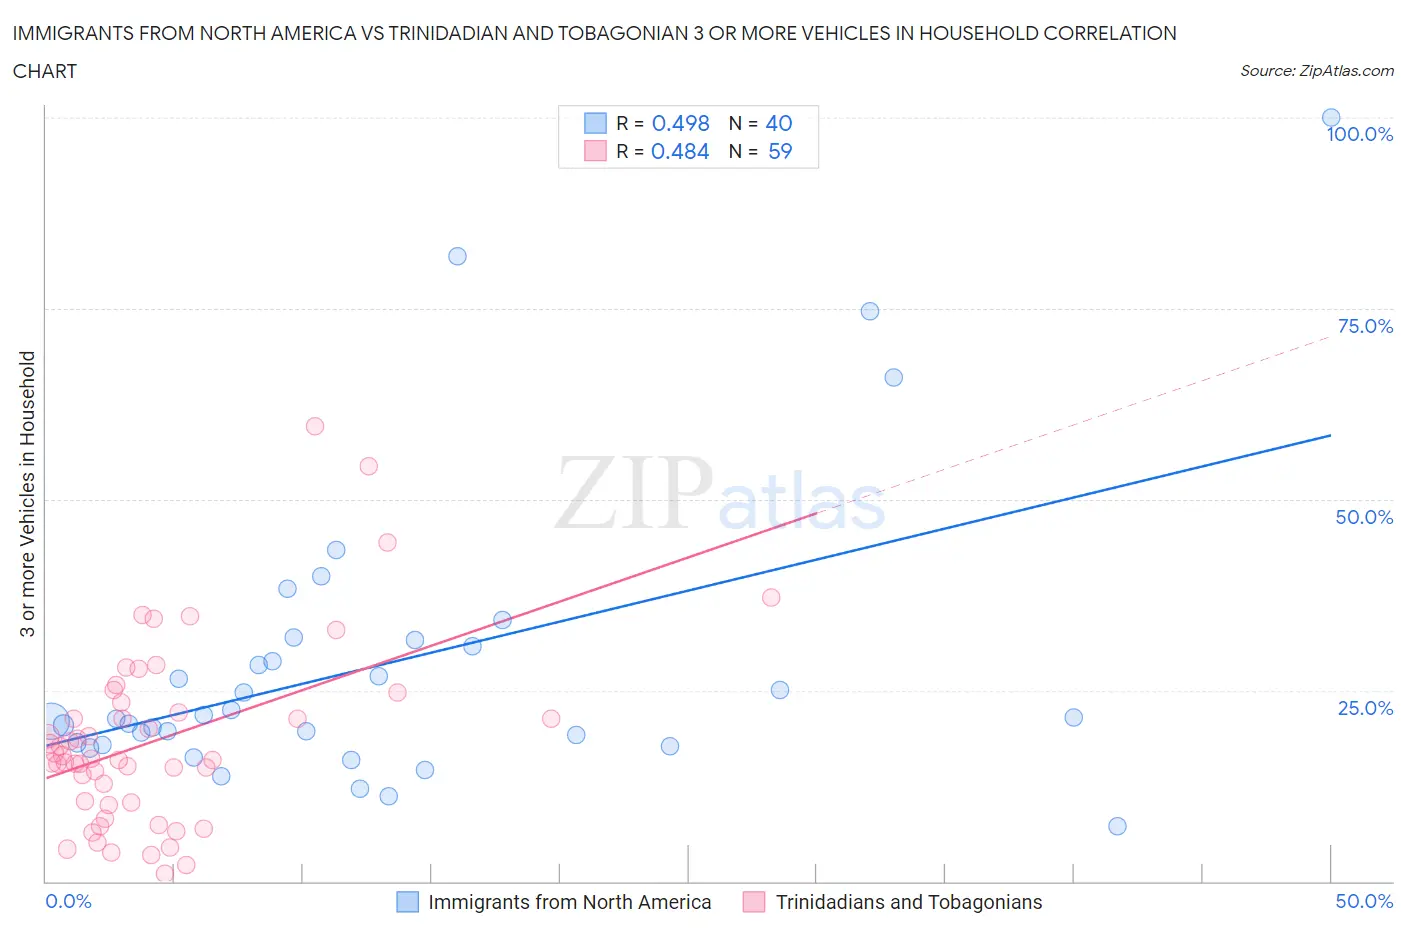
Immigrants from North America vs Trinidadian and Tobagonian 3 or more Vehicles in Household Correlation Chart
The statistical analysis conducted on geographies consisting of 462,036,046 people shows a moderate positive correlation between the proportion of Immigrants from North America and percentage of households with 3 or more vehicles available in the United States with a correlation coefficient (R) of 0.498 and weighted average of 20.2%. Similarly, the statistical analysis conducted on geographies consisting of 219,661,129 people shows a moderate positive correlation between the proportion of Trinidadians and Tobagonians and percentage of households with 3 or more vehicles available in the United States with a correlation coefficient (R) of 0.484 and weighted average of 13.6%, a difference of 48.5%.
3 or more Vehicles in Household Correlation Summary
| Measurement | Immigrants from North America | Trinidadian and Tobagonian |
| Minimum | 7.1% | 1.0% |
| Maximum | 100.0% | 59.6% |
| Range | 92.9% | 58.6% |
| Mean | 28.5% | 18.6% |
| Median | 21.4% | 16.0% |
| Interquartile 25% (IQ1) | 18.0% | 10.2% |
| Interquartile 75% (IQ3) | 31.1% | 23.5% |
| Interquartile Range (IQR) | 13.1% | 13.3% |
| Standard Deviation (Sample) | 19.6% | 11.9% |
| Standard Deviation (Population) | 19.4% | 11.8% |
Similar Demographics by 3 or more Vehicles in Household
Demographics Similar to Immigrants from North America by 3 or more Vehicles in Household
In terms of 3 or more vehicles in household, the demographic groups most similar to Immigrants from North America are Immigrants from Canada (20.2%, a difference of 0.0%), Immigrants from Asia (20.2%, a difference of 0.050%), Polish (20.2%, a difference of 0.090%), Immigrants from India (20.2%, a difference of 0.11%), and Immigrants from Nicaragua (20.2%, a difference of 0.12%).
| Demographics | Rating | Rank | 3 or more Vehicles in Household |
| Slavs | 92.1 /100 | #126 | Exceptional 20.4% |
| Immigrants | Bolivia | 92.0 /100 | #127 | Exceptional 20.4% |
| New Zealanders | 91.3 /100 | #128 | Exceptional 20.4% |
| Zimbabweans | 88.7 /100 | #129 | Excellent 20.3% |
| Greeks | 88.6 /100 | #130 | Excellent 20.3% |
| Immigrants | Asia | 88.1 /100 | #131 | Excellent 20.2% |
| Immigrants | Canada | 87.8 /100 | #132 | Excellent 20.2% |
| Immigrants | North America | 87.8 /100 | #133 | Excellent 20.2% |
| Poles | 87.3 /100 | #134 | Excellent 20.2% |
| Immigrants | India | 87.2 /100 | #135 | Excellent 20.2% |
| Immigrants | Nicaragua | 87.1 /100 | #136 | Excellent 20.2% |
| Immigrants | Iraq | 87.1 /100 | #137 | Excellent 20.2% |
| Aleuts | 86.3 /100 | #138 | Excellent 20.2% |
| Slovenes | 85.5 /100 | #139 | Excellent 20.2% |
| French American Indians | 85.3 /100 | #140 | Excellent 20.1% |
Demographics Similar to Trinidadians and Tobagonians by 3 or more Vehicles in Household
In terms of 3 or more vehicles in household, the demographic groups most similar to Trinidadians and Tobagonians are Immigrants from Cabo Verde (13.6%, a difference of 0.36%), Immigrants from Dominica (13.7%, a difference of 0.71%), West Indian (13.7%, a difference of 0.93%), Immigrants from Senegal (13.8%, a difference of 1.3%), and Immigrants from Ecuador (13.4%, a difference of 1.6%).
| Demographics | Rating | Rank | 3 or more Vehicles in Household |
| Senegalese | 0.0 /100 | #325 | Tragic 14.2% |
| Soviet Union | 0.0 /100 | #326 | Tragic 14.2% |
| Ecuadorians | 0.0 /100 | #327 | Tragic 14.1% |
| Immigrants | Albania | 0.0 /100 | #328 | Tragic 14.0% |
| Immigrants | Senegal | 0.0 /100 | #329 | Tragic 13.8% |
| West Indians | 0.0 /100 | #330 | Tragic 13.7% |
| Immigrants | Dominica | 0.0 /100 | #331 | Tragic 13.7% |
| Trinidadians and Tobagonians | 0.0 /100 | #332 | Tragic 13.6% |
| Immigrants | Cabo Verde | 0.0 /100 | #333 | Tragic 13.6% |
| Immigrants | Ecuador | 0.0 /100 | #334 | Tragic 13.4% |
| Immigrants | Trinidad and Tobago | 0.0 /100 | #335 | Tragic 13.3% |
| Barbadians | 0.0 /100 | #336 | Tragic 12.6% |
| Immigrants | Bangladesh | 0.0 /100 | #337 | Tragic 12.5% |
| Vietnamese | 0.0 /100 | #338 | Tragic 12.5% |
| Immigrants | Uzbekistan | 0.0 /100 | #339 | Tragic 12.0% |