Immigrants from Lithuania vs Immigrants from Nepal 3 or more Vehicles in Household
COMPARE
Immigrants from Lithuania
Immigrants from Nepal
3 or more Vehicles in Household
3 or more Vehicles in Household Comparison
Immigrants from Lithuania
Immigrants from Nepal
18.5%
3 OR MORE VEHICLES IN HOUSEHOLD
5.6/ 100
METRIC RATING
225th/ 347
METRIC RANK
17.6%
3 OR MORE VEHICLES IN HOUSEHOLD
0.6/ 100
METRIC RATING
270th/ 347
METRIC RANK
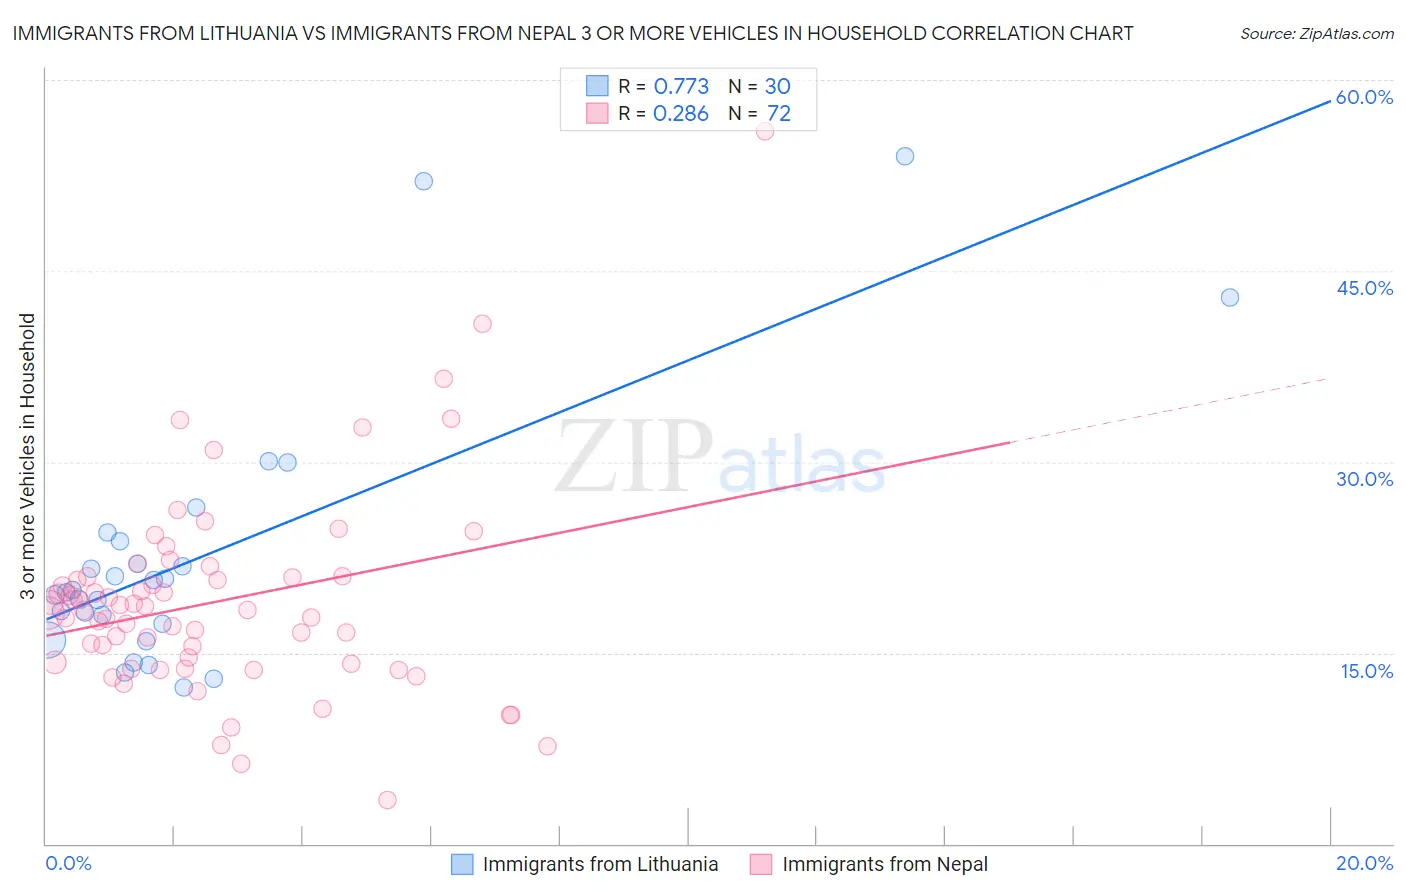
Immigrants from Lithuania vs Immigrants from Nepal 3 or more Vehicles in Household Correlation Chart
The statistical analysis conducted on geographies consisting of 117,713,976 people shows a strong positive correlation between the proportion of Immigrants from Lithuania and percentage of households with 3 or more vehicles available in the United States with a correlation coefficient (R) of 0.773 and weighted average of 18.5%. Similarly, the statistical analysis conducted on geographies consisting of 186,663,227 people shows a weak positive correlation between the proportion of Immigrants from Nepal and percentage of households with 3 or more vehicles available in the United States with a correlation coefficient (R) of 0.286 and weighted average of 17.6%, a difference of 4.7%.
3 or more Vehicles in Household Correlation Summary
| Measurement | Immigrants from Lithuania | Immigrants from Nepal |
| Minimum | 12.3% | 3.4% |
| Maximum | 54.1% | 55.9% |
| Range | 41.8% | 52.5% |
| Mean | 22.7% | 19.0% |
| Median | 19.8% | 18.3% |
| Interquartile 25% (IQ1) | 17.3% | 14.2% |
| Interquartile 75% (IQ3) | 23.8% | 21.0% |
| Interquartile Range (IQR) | 6.5% | 6.8% |
| Standard Deviation (Sample) | 10.3% | 8.0% |
| Standard Deviation (Population) | 10.1% | 8.0% |
Similar Demographics by 3 or more Vehicles in Household
Demographics Similar to Immigrants from Lithuania by 3 or more Vehicles in Household
In terms of 3 or more vehicles in household, the demographic groups most similar to Immigrants from Lithuania are Immigrants from Argentina (18.5%, a difference of 0.010%), Immigrants from Hungary (18.5%, a difference of 0.030%), Immigrants from Singapore (18.4%, a difference of 0.060%), Turkish (18.4%, a difference of 0.080%), and Immigrants from Czechoslovakia (18.5%, a difference of 0.11%).
| Demographics | Rating | Rank | 3 or more Vehicles in Household |
| Immigrants | Portugal | 8.9 /100 | #218 | Tragic 18.6% |
| Immigrants | Armenia | 8.6 /100 | #219 | Tragic 18.6% |
| Nigerians | 7.9 /100 | #220 | Tragic 18.6% |
| Immigrants | Poland | 7.5 /100 | #221 | Tragic 18.6% |
| Belizeans | 7.3 /100 | #222 | Tragic 18.6% |
| Immigrants | Czechoslovakia | 5.9 /100 | #223 | Tragic 18.5% |
| Immigrants | Argentina | 5.6 /100 | #224 | Tragic 18.5% |
| Immigrants | Lithuania | 5.6 /100 | #225 | Tragic 18.5% |
| Immigrants | Hungary | 5.5 /100 | #226 | Tragic 18.5% |
| Immigrants | Singapore | 5.4 /100 | #227 | Tragic 18.4% |
| Turks | 5.4 /100 | #228 | Tragic 18.4% |
| Immigrants | Switzerland | 5.0 /100 | #229 | Tragic 18.4% |
| Immigrants | Western Asia | 4.8 /100 | #230 | Tragic 18.4% |
| Immigrants | Belgium | 4.8 /100 | #231 | Tragic 18.4% |
| Immigrants | Uganda | 4.6 /100 | #232 | Tragic 18.4% |
Demographics Similar to Immigrants from Nepal by 3 or more Vehicles in Household
In terms of 3 or more vehicles in household, the demographic groups most similar to Immigrants from Nepal are South American (17.6%, a difference of 0.0%), Immigrants from France (17.6%, a difference of 0.050%), Immigrants from Africa (17.6%, a difference of 0.41%), Immigrants from Sudan (17.6%, a difference of 0.45%), and Immigrants from Bulgaria (17.7%, a difference of 0.47%).
| Demographics | Rating | Rank | 3 or more Vehicles in Household |
| Bermudans | 0.9 /100 | #263 | Tragic 17.8% |
| Cambodians | 0.9 /100 | #264 | Tragic 17.8% |
| Immigrants | Panama | 0.8 /100 | #265 | Tragic 17.7% |
| Macedonians | 0.8 /100 | #266 | Tragic 17.7% |
| Immigrants | Venezuela | 0.8 /100 | #267 | Tragic 17.7% |
| Immigrants | Bulgaria | 0.8 /100 | #268 | Tragic 17.7% |
| Immigrants | France | 0.6 /100 | #269 | Tragic 17.6% |
| Immigrants | Nepal | 0.6 /100 | #270 | Tragic 17.6% |
| South Americans | 0.6 /100 | #271 | Tragic 17.6% |
| Immigrants | Africa | 0.5 /100 | #272 | Tragic 17.6% |
| Immigrants | Sudan | 0.5 /100 | #273 | Tragic 17.6% |
| Immigrants | Bosnia and Herzegovina | 0.5 /100 | #274 | Tragic 17.5% |
| Immigrants | Ukraine | 0.4 /100 | #275 | Tragic 17.5% |
| Okinawans | 0.4 /100 | #276 | Tragic 17.4% |
| Brazilians | 0.4 /100 | #277 | Tragic 17.4% |