Immigrants from Lithuania vs French 3 or more Vehicles in Household
COMPARE
Immigrants from Lithuania
French
3 or more Vehicles in Household
3 or more Vehicles in Household Comparison
Immigrants from Lithuania
French
18.5%
3 OR MORE VEHICLES IN HOUSEHOLD
5.6/ 100
METRIC RATING
225th/ 347
METRIC RANK
21.4%
3 OR MORE VEHICLES IN HOUSEHOLD
99.4/ 100
METRIC RATING
88th/ 347
METRIC RANK
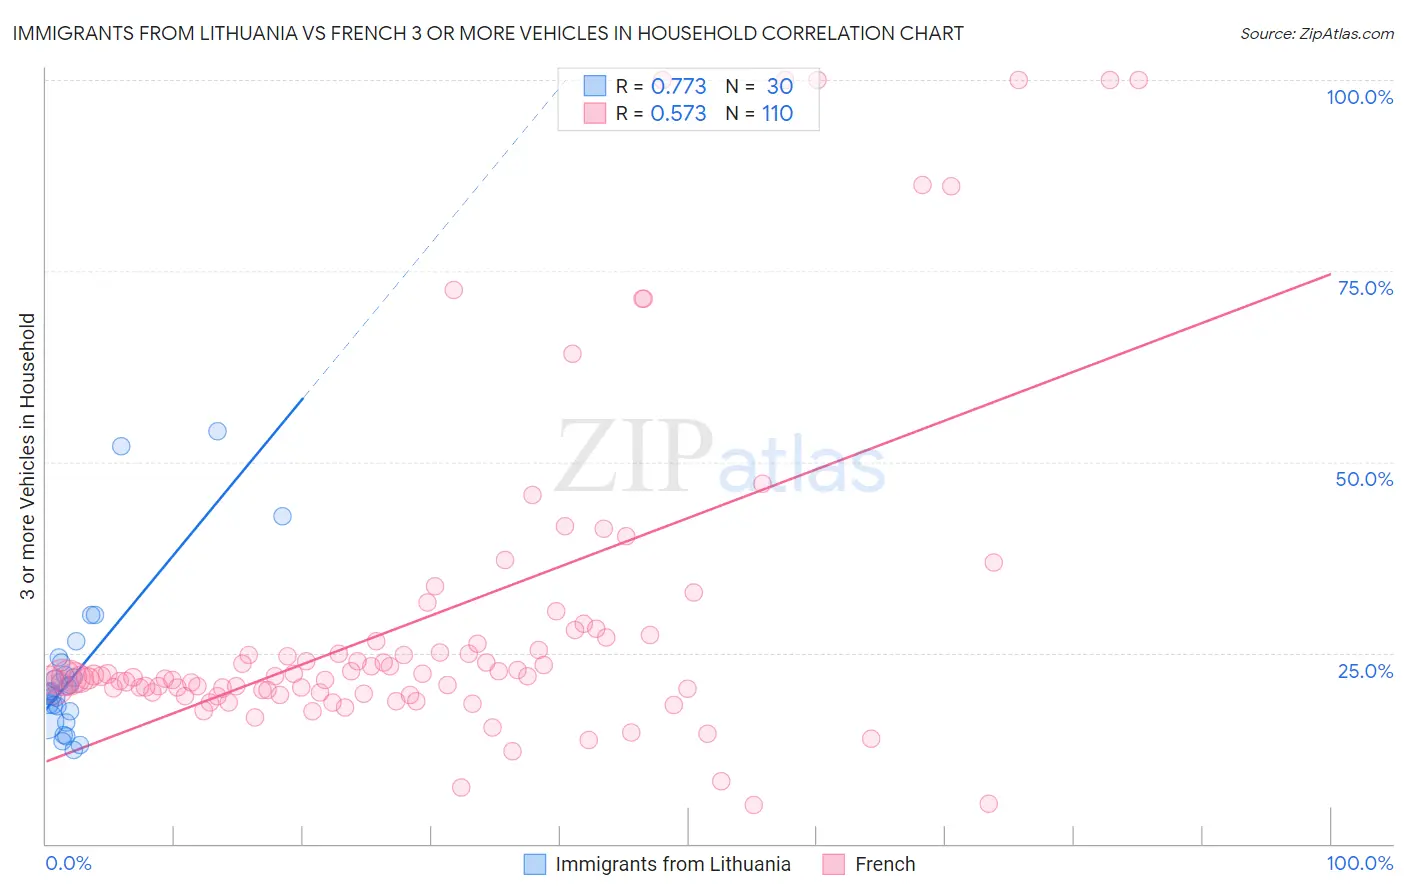
Immigrants from Lithuania vs French 3 or more Vehicles in Household Correlation Chart
The statistical analysis conducted on geographies consisting of 117,713,976 people shows a strong positive correlation between the proportion of Immigrants from Lithuania and percentage of households with 3 or more vehicles available in the United States with a correlation coefficient (R) of 0.773 and weighted average of 18.5%. Similarly, the statistical analysis conducted on geographies consisting of 571,506,399 people shows a substantial positive correlation between the proportion of French and percentage of households with 3 or more vehicles available in the United States with a correlation coefficient (R) of 0.573 and weighted average of 21.4%, a difference of 16.0%.
3 or more Vehicles in Household Correlation Summary
| Measurement | Immigrants from Lithuania | French |
| Minimum | 12.3% | 5.1% |
| Maximum | 54.1% | 100.0% |
| Range | 41.8% | 94.9% |
| Mean | 22.7% | 29.6% |
| Median | 19.8% | 21.9% |
| Interquartile 25% (IQ1) | 17.3% | 19.8% |
| Interquartile 75% (IQ3) | 23.8% | 27.1% |
| Interquartile Range (IQR) | 6.5% | 7.3% |
| Standard Deviation (Sample) | 10.3% | 22.0% |
| Standard Deviation (Population) | 10.1% | 21.9% |
Similar Demographics by 3 or more Vehicles in Household
Demographics Similar to Immigrants from Lithuania by 3 or more Vehicles in Household
In terms of 3 or more vehicles in household, the demographic groups most similar to Immigrants from Lithuania are Immigrants from Argentina (18.5%, a difference of 0.010%), Immigrants from Hungary (18.5%, a difference of 0.030%), Immigrants from Singapore (18.4%, a difference of 0.060%), Turkish (18.4%, a difference of 0.080%), and Immigrants from Czechoslovakia (18.5%, a difference of 0.11%).
| Demographics | Rating | Rank | 3 or more Vehicles in Household |
| Immigrants | Portugal | 8.9 /100 | #218 | Tragic 18.6% |
| Immigrants | Armenia | 8.6 /100 | #219 | Tragic 18.6% |
| Nigerians | 7.9 /100 | #220 | Tragic 18.6% |
| Immigrants | Poland | 7.5 /100 | #221 | Tragic 18.6% |
| Belizeans | 7.3 /100 | #222 | Tragic 18.6% |
| Immigrants | Czechoslovakia | 5.9 /100 | #223 | Tragic 18.5% |
| Immigrants | Argentina | 5.6 /100 | #224 | Tragic 18.5% |
| Immigrants | Lithuania | 5.6 /100 | #225 | Tragic 18.5% |
| Immigrants | Hungary | 5.5 /100 | #226 | Tragic 18.5% |
| Immigrants | Singapore | 5.4 /100 | #227 | Tragic 18.4% |
| Turks | 5.4 /100 | #228 | Tragic 18.4% |
| Immigrants | Switzerland | 5.0 /100 | #229 | Tragic 18.4% |
| Immigrants | Western Asia | 4.8 /100 | #230 | Tragic 18.4% |
| Immigrants | Belgium | 4.8 /100 | #231 | Tragic 18.4% |
| Immigrants | Uganda | 4.6 /100 | #232 | Tragic 18.4% |
Demographics Similar to French by 3 or more Vehicles in Household
In terms of 3 or more vehicles in household, the demographic groups most similar to French are Immigrants from the Azores (21.5%, a difference of 0.26%), Delaware (21.5%, a difference of 0.38%), Laotian (21.5%, a difference of 0.46%), Icelander (21.5%, a difference of 0.47%), and Chippewa (21.5%, a difference of 0.53%).
| Demographics | Rating | Rank | 3 or more Vehicles in Household |
| Celtics | 99.7 /100 | #81 | Exceptional 21.7% |
| Immigrants | El Salvador | 99.6 /100 | #82 | Exceptional 21.5% |
| Chippewa | 99.6 /100 | #83 | Exceptional 21.5% |
| Icelanders | 99.6 /100 | #84 | Exceptional 21.5% |
| Laotians | 99.6 /100 | #85 | Exceptional 21.5% |
| Delaware | 99.6 /100 | #86 | Exceptional 21.5% |
| Immigrants | Azores | 99.5 /100 | #87 | Exceptional 21.5% |
| French | 99.4 /100 | #88 | Exceptional 21.4% |
| Marshallese | 99.2 /100 | #89 | Exceptional 21.3% |
| Immigrants | Afghanistan | 99.1 /100 | #90 | Exceptional 21.2% |
| Belgians | 98.9 /100 | #91 | Exceptional 21.2% |
| Apache | 98.9 /100 | #92 | Exceptional 21.2% |
| Immigrants | Indonesia | 98.8 /100 | #93 | Exceptional 21.1% |
| Immigrants | Cambodia | 98.6 /100 | #94 | Exceptional 21.1% |
| Pakistanis | 98.5 /100 | #95 | Exceptional 21.0% |