Immigrants from Korea vs Immigrants from Chile 3 or more Vehicles in Household
COMPARE
Immigrants from Korea
Immigrants from Chile
3 or more Vehicles in Household
3 or more Vehicles in Household Comparison
Immigrants from Korea
Immigrants from Chile
20.5%
3 OR MORE VEHICLES IN HOUSEHOLD
93.7/ 100
METRIC RATING
123rd/ 347
METRIC RANK
18.8%
3 OR MORE VEHICLES IN HOUSEHOLD
13.6/ 100
METRIC RATING
207th/ 347
METRIC RANK
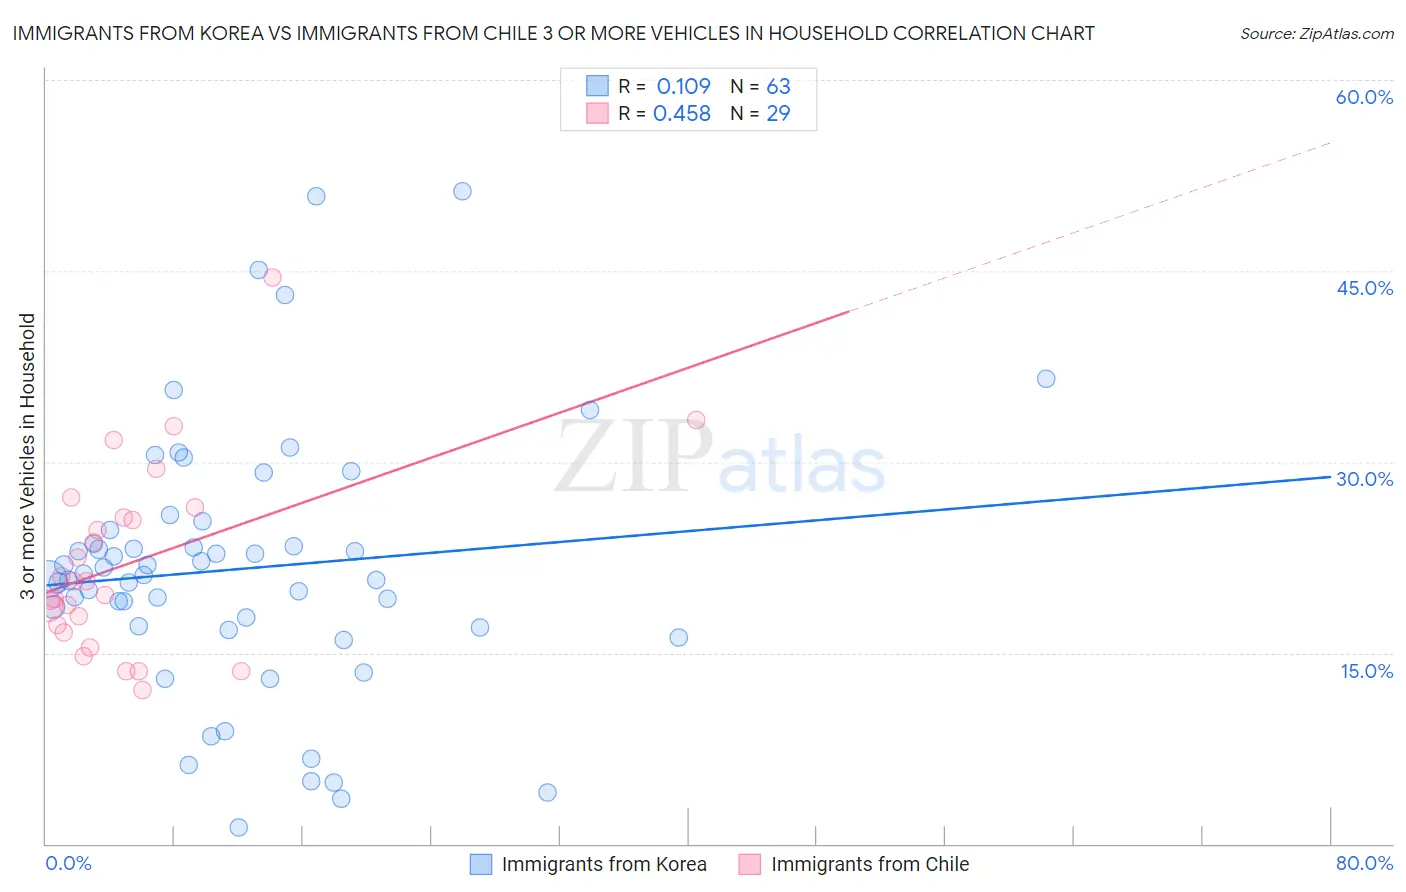
Immigrants from Korea vs Immigrants from Chile 3 or more Vehicles in Household Correlation Chart
The statistical analysis conducted on geographies consisting of 415,786,030 people shows a poor positive correlation between the proportion of Immigrants from Korea and percentage of households with 3 or more vehicles available in the United States with a correlation coefficient (R) of 0.109 and weighted average of 20.5%. Similarly, the statistical analysis conducted on geographies consisting of 218,586,627 people shows a moderate positive correlation between the proportion of Immigrants from Chile and percentage of households with 3 or more vehicles available in the United States with a correlation coefficient (R) of 0.458 and weighted average of 18.8%, a difference of 8.9%.
3 or more Vehicles in Household Correlation Summary
| Measurement | Immigrants from Korea | Immigrants from Chile |
| Minimum | 1.2% | 12.0% |
| Maximum | 51.2% | 44.4% |
| Range | 50.0% | 32.4% |
| Mean | 21.6% | 22.0% |
| Median | 21.1% | 20.6% |
| Interquartile 25% (IQ1) | 17.0% | 16.9% |
| Interquartile 75% (IQ3) | 24.6% | 26.0% |
| Interquartile Range (IQR) | 7.6% | 9.1% |
| Standard Deviation (Sample) | 10.3% | 7.3% |
| Standard Deviation (Population) | 10.3% | 7.2% |
Similar Demographics by 3 or more Vehicles in Household
Demographics Similar to Immigrants from Korea by 3 or more Vehicles in Household
In terms of 3 or more vehicles in household, the demographic groups most similar to Immigrants from Korea are German Russian (20.5%, a difference of 0.010%), Immigrants from Thailand (20.5%, a difference of 0.050%), Maltese (20.5%, a difference of 0.060%), Central American (20.5%, a difference of 0.17%), and Immigrants from Netherlands (20.4%, a difference of 0.20%).
| Demographics | Rating | Rank | 3 or more Vehicles in Household |
| Italians | 94.9 /100 | #116 | Exceptional 20.6% |
| Croatians | 94.9 /100 | #117 | Exceptional 20.6% |
| Costa Ricans | 94.6 /100 | #118 | Exceptional 20.6% |
| Immigrants | Latin America | 94.5 /100 | #119 | Exceptional 20.5% |
| Maltese | 93.9 /100 | #120 | Exceptional 20.5% |
| Immigrants | Thailand | 93.8 /100 | #121 | Exceptional 20.5% |
| German Russians | 93.7 /100 | #122 | Exceptional 20.5% |
| Immigrants | Korea | 93.7 /100 | #123 | Exceptional 20.5% |
| Central Americans | 93.1 /100 | #124 | Exceptional 20.5% |
| Immigrants | Netherlands | 92.9 /100 | #125 | Exceptional 20.4% |
| Slavs | 92.1 /100 | #126 | Exceptional 20.4% |
| Immigrants | Bolivia | 92.0 /100 | #127 | Exceptional 20.4% |
| New Zealanders | 91.3 /100 | #128 | Exceptional 20.4% |
| Zimbabweans | 88.7 /100 | #129 | Excellent 20.3% |
| Greeks | 88.6 /100 | #130 | Excellent 20.3% |
Demographics Similar to Immigrants from Chile by 3 or more Vehicles in Household
In terms of 3 or more vehicles in household, the demographic groups most similar to Immigrants from Chile are Immigrants from Burma/Myanmar (18.8%, a difference of 0.010%), Immigrants from Egypt (18.8%, a difference of 0.020%), Immigrants from Eastern Asia (18.8%, a difference of 0.080%), Russian (18.8%, a difference of 0.090%), and Bulgarian (18.8%, a difference of 0.10%).
| Demographics | Rating | Rank | 3 or more Vehicles in Household |
| Argentineans | 18.2 /100 | #200 | Poor 18.9% |
| Arabs | 17.7 /100 | #201 | Poor 18.9% |
| Immigrants | Austria | 15.4 /100 | #202 | Poor 18.9% |
| Tohono O'odham | 14.8 /100 | #203 | Poor 18.9% |
| Immigrants | Romania | 14.6 /100 | #204 | Poor 18.9% |
| Russians | 14.2 /100 | #205 | Poor 18.8% |
| Immigrants | Eastern Asia | 14.1 /100 | #206 | Poor 18.8% |
| Immigrants | Chile | 13.6 /100 | #207 | Poor 18.8% |
| Immigrants | Burma/Myanmar | 13.6 /100 | #208 | Poor 18.8% |
| Immigrants | Egypt | 13.5 /100 | #209 | Poor 18.8% |
| Bulgarians | 13.1 /100 | #210 | Poor 18.8% |
| Immigrants | Kenya | 12.4 /100 | #211 | Poor 18.8% |
| Panamanians | 11.6 /100 | #212 | Poor 18.8% |
| Immigrants | Cuba | 11.6 /100 | #213 | Poor 18.8% |
| Immigrants | Sierra Leone | 10.8 /100 | #214 | Poor 18.7% |