Immigrants from Bolivia vs Romanian 3 or more Vehicles in Household
COMPARE
Immigrants from Bolivia
Romanian
3 or more Vehicles in Household
3 or more Vehicles in Household Comparison
Immigrants from Bolivia
Romanians
20.4%
3 OR MORE VEHICLES IN HOUSEHOLD
92.0/ 100
METRIC RATING
127th/ 347
METRIC RANK
19.3%
3 OR MORE VEHICLES IN HOUSEHOLD
37.1/ 100
METRIC RATING
181st/ 347
METRIC RANK
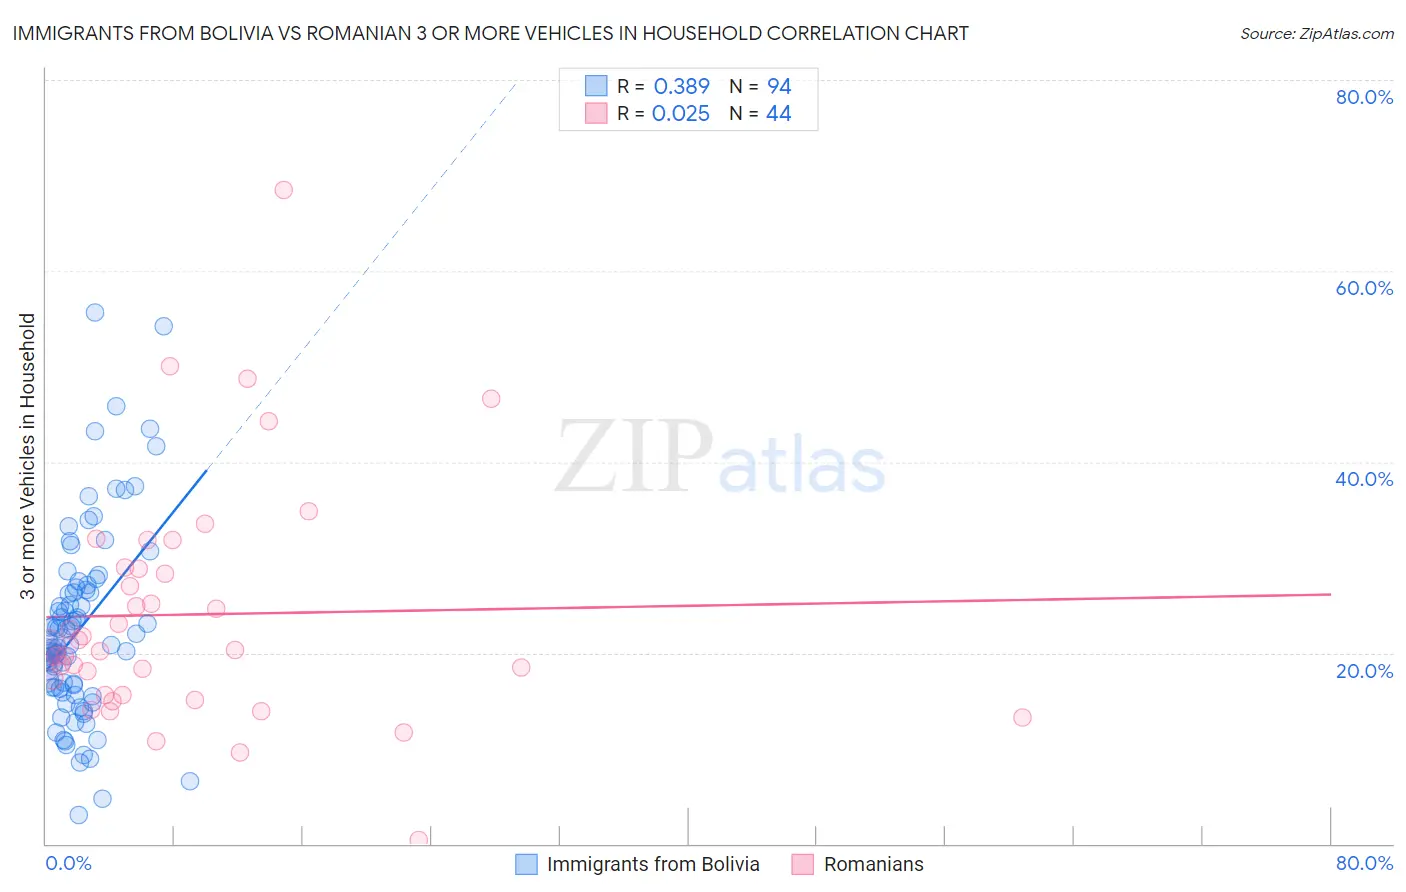
Immigrants from Bolivia vs Romanian 3 or more Vehicles in Household Correlation Chart
The statistical analysis conducted on geographies consisting of 158,700,588 people shows a mild positive correlation between the proportion of Immigrants from Bolivia and percentage of households with 3 or more vehicles available in the United States with a correlation coefficient (R) of 0.389 and weighted average of 20.4%. Similarly, the statistical analysis conducted on geographies consisting of 377,618,048 people shows no correlation between the proportion of Romanians and percentage of households with 3 or more vehicles available in the United States with a correlation coefficient (R) of 0.025 and weighted average of 19.3%, a difference of 5.7%.
3 or more Vehicles in Household Correlation Summary
| Measurement | Immigrants from Bolivia | Romanian |
| Minimum | 3.1% | 0.45% |
| Maximum | 55.7% | 68.5% |
| Range | 52.6% | 68.0% |
| Mean | 22.5% | 24.0% |
| Median | 20.9% | 20.5% |
| Interquartile 25% (IQ1) | 16.3% | 15.6% |
| Interquartile 75% (IQ3) | 26.5% | 28.9% |
| Interquartile Range (IQR) | 10.2% | 13.3% |
| Standard Deviation (Sample) | 9.8% | 12.5% |
| Standard Deviation (Population) | 9.8% | 12.4% |
Similar Demographics by 3 or more Vehicles in Household
Demographics Similar to Immigrants from Bolivia by 3 or more Vehicles in Household
In terms of 3 or more vehicles in household, the demographic groups most similar to Immigrants from Bolivia are Slavic (20.4%, a difference of 0.030%), New Zealander (20.4%, a difference of 0.17%), Immigrants from Netherlands (20.4%, a difference of 0.25%), Central American (20.5%, a difference of 0.28%), and Immigrants from Korea (20.5%, a difference of 0.45%).
| Demographics | Rating | Rank | 3 or more Vehicles in Household |
| Maltese | 93.9 /100 | #120 | Exceptional 20.5% |
| Immigrants | Thailand | 93.8 /100 | #121 | Exceptional 20.5% |
| German Russians | 93.7 /100 | #122 | Exceptional 20.5% |
| Immigrants | Korea | 93.7 /100 | #123 | Exceptional 20.5% |
| Central Americans | 93.1 /100 | #124 | Exceptional 20.5% |
| Immigrants | Netherlands | 92.9 /100 | #125 | Exceptional 20.4% |
| Slavs | 92.1 /100 | #126 | Exceptional 20.4% |
| Immigrants | Bolivia | 92.0 /100 | #127 | Exceptional 20.4% |
| New Zealanders | 91.3 /100 | #128 | Exceptional 20.4% |
| Zimbabweans | 88.7 /100 | #129 | Excellent 20.3% |
| Greeks | 88.6 /100 | #130 | Excellent 20.3% |
| Immigrants | Asia | 88.1 /100 | #131 | Excellent 20.2% |
| Immigrants | Canada | 87.8 /100 | #132 | Excellent 20.2% |
| Immigrants | North America | 87.8 /100 | #133 | Excellent 20.2% |
| Poles | 87.3 /100 | #134 | Excellent 20.2% |
Demographics Similar to Romanians by 3 or more Vehicles in Household
In terms of 3 or more vehicles in household, the demographic groups most similar to Romanians are South African (19.3%, a difference of 0.030%), Cuban (19.3%, a difference of 0.040%), Cajun (19.3%, a difference of 0.090%), Latvian (19.3%, a difference of 0.11%), and Immigrants from South Central Asia (19.3%, a difference of 0.15%).
| Demographics | Rating | Rank | 3 or more Vehicles in Household |
| Immigrants | South Africa | 50.0 /100 | #174 | Average 19.5% |
| Syrians | 47.0 /100 | #175 | Average 19.5% |
| Iroquois | 46.0 /100 | #176 | Average 19.4% |
| Immigrants | Peru | 41.1 /100 | #177 | Average 19.4% |
| Immigrants | Syria | 40.3 /100 | #178 | Average 19.4% |
| Immigrants | South Central Asia | 38.9 /100 | #179 | Fair 19.3% |
| South Africans | 37.5 /100 | #180 | Fair 19.3% |
| Romanians | 37.1 /100 | #181 | Fair 19.3% |
| Cubans | 36.6 /100 | #182 | Fair 19.3% |
| Cajuns | 36.0 /100 | #183 | Fair 19.3% |
| Latvians | 35.7 /100 | #184 | Fair 19.3% |
| Immigrants | Sri Lanka | 30.7 /100 | #185 | Fair 19.2% |
| Immigrants | Sweden | 29.0 /100 | #186 | Fair 19.2% |
| Immigrants | Hong Kong | 28.3 /100 | #187 | Fair 19.2% |
| Immigrants | Kuwait | 26.1 /100 | #188 | Fair 19.1% |