Immigrants from Bolivia vs Houma 3 or more Vehicles in Household
COMPARE
Immigrants from Bolivia
Houma
3 or more Vehicles in Household
3 or more Vehicles in Household Comparison
Immigrants from Bolivia
Houma
20.4%
3 OR MORE VEHICLES IN HOUSEHOLD
92.0/ 100
METRIC RATING
127th/ 347
METRIC RANK
16.1%
3 OR MORE VEHICLES IN HOUSEHOLD
0.0/ 100
METRIC RATING
308th/ 347
METRIC RANK
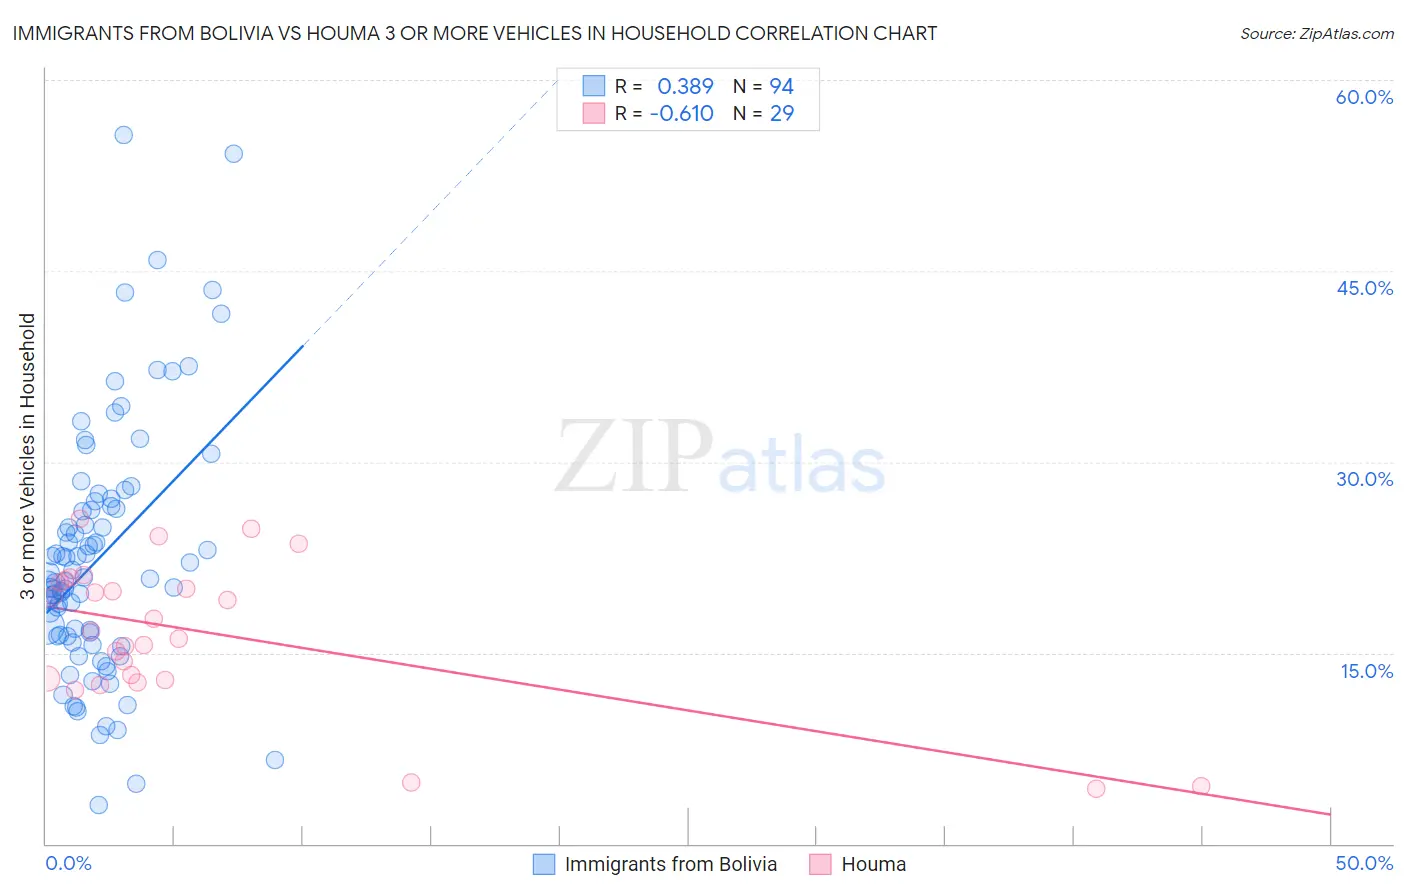
Immigrants from Bolivia vs Houma 3 or more Vehicles in Household Correlation Chart
The statistical analysis conducted on geographies consisting of 158,700,588 people shows a mild positive correlation between the proportion of Immigrants from Bolivia and percentage of households with 3 or more vehicles available in the United States with a correlation coefficient (R) of 0.389 and weighted average of 20.4%. Similarly, the statistical analysis conducted on geographies consisting of 36,793,119 people shows a significant negative correlation between the proportion of Houma and percentage of households with 3 or more vehicles available in the United States with a correlation coefficient (R) of -0.610 and weighted average of 16.1%, a difference of 27.0%.
3 or more Vehicles in Household Correlation Summary
| Measurement | Immigrants from Bolivia | Houma |
| Minimum | 3.1% | 4.3% |
| Maximum | 55.7% | 25.5% |
| Range | 52.6% | 21.2% |
| Mean | 22.5% | 16.6% |
| Median | 20.9% | 16.7% |
| Interquartile 25% (IQ1) | 16.3% | 12.9% |
| Interquartile 75% (IQ3) | 26.5% | 20.6% |
| Interquartile Range (IQR) | 10.2% | 7.7% |
| Standard Deviation (Sample) | 9.8% | 5.7% |
| Standard Deviation (Population) | 9.8% | 5.6% |
Similar Demographics by 3 or more Vehicles in Household
Demographics Similar to Immigrants from Bolivia by 3 or more Vehicles in Household
In terms of 3 or more vehicles in household, the demographic groups most similar to Immigrants from Bolivia are Slavic (20.4%, a difference of 0.030%), New Zealander (20.4%, a difference of 0.17%), Immigrants from Netherlands (20.4%, a difference of 0.25%), Central American (20.5%, a difference of 0.28%), and Immigrants from Korea (20.5%, a difference of 0.45%).
| Demographics | Rating | Rank | 3 or more Vehicles in Household |
| Maltese | 93.9 /100 | #120 | Exceptional 20.5% |
| Immigrants | Thailand | 93.8 /100 | #121 | Exceptional 20.5% |
| German Russians | 93.7 /100 | #122 | Exceptional 20.5% |
| Immigrants | Korea | 93.7 /100 | #123 | Exceptional 20.5% |
| Central Americans | 93.1 /100 | #124 | Exceptional 20.5% |
| Immigrants | Netherlands | 92.9 /100 | #125 | Exceptional 20.4% |
| Slavs | 92.1 /100 | #126 | Exceptional 20.4% |
| Immigrants | Bolivia | 92.0 /100 | #127 | Exceptional 20.4% |
| New Zealanders | 91.3 /100 | #128 | Exceptional 20.4% |
| Zimbabweans | 88.7 /100 | #129 | Excellent 20.3% |
| Greeks | 88.6 /100 | #130 | Excellent 20.3% |
| Immigrants | Asia | 88.1 /100 | #131 | Excellent 20.2% |
| Immigrants | Canada | 87.8 /100 | #132 | Excellent 20.2% |
| Immigrants | North America | 87.8 /100 | #133 | Excellent 20.2% |
| Poles | 87.3 /100 | #134 | Excellent 20.2% |
Demographics Similar to Houma by 3 or more Vehicles in Household
In terms of 3 or more vehicles in household, the demographic groups most similar to Houma are Immigrants from Ghana (16.2%, a difference of 0.59%), Somali (16.2%, a difference of 0.74%), Immigrants from Somalia (15.9%, a difference of 0.92%), Moroccan (15.9%, a difference of 1.2%), and Immigrants from Morocco (16.3%, a difference of 1.6%).
| Demographics | Rating | Rank | 3 or more Vehicles in Household |
| Paraguayans | 0.0 /100 | #301 | Tragic 16.6% |
| Immigrants | Greece | 0.0 /100 | #302 | Tragic 16.5% |
| Immigrants | Serbia | 0.0 /100 | #303 | Tragic 16.4% |
| Ghanaians | 0.0 /100 | #304 | Tragic 16.4% |
| Immigrants | Morocco | 0.0 /100 | #305 | Tragic 16.3% |
| Somalis | 0.0 /100 | #306 | Tragic 16.2% |
| Immigrants | Ghana | 0.0 /100 | #307 | Tragic 16.2% |
| Houma | 0.0 /100 | #308 | Tragic 16.1% |
| Immigrants | Somalia | 0.0 /100 | #309 | Tragic 15.9% |
| Moroccans | 0.0 /100 | #310 | Tragic 15.9% |
| Albanians | 0.0 /100 | #311 | Tragic 15.8% |
| Puerto Ricans | 0.0 /100 | #312 | Tragic 15.6% |
| Immigrants | Israel | 0.0 /100 | #313 | Tragic 15.6% |
| Immigrants | Belarus | 0.0 /100 | #314 | Tragic 15.5% |
| Haitians | 0.0 /100 | #315 | Tragic 15.5% |