Immigrants from Belize vs Cypriot 3 or more Vehicles in Household
COMPARE
Immigrants from Belize
Cypriot
3 or more Vehicles in Household
3 or more Vehicles in Household Comparison
Immigrants from Belize
Cypriots
18.1%
3 OR MORE VEHICLES IN HOUSEHOLD
2.1/ 100
METRIC RATING
245th/ 347
METRIC RANK
16.6%
3 OR MORE VEHICLES IN HOUSEHOLD
0.0/ 100
METRIC RATING
300th/ 347
METRIC RANK
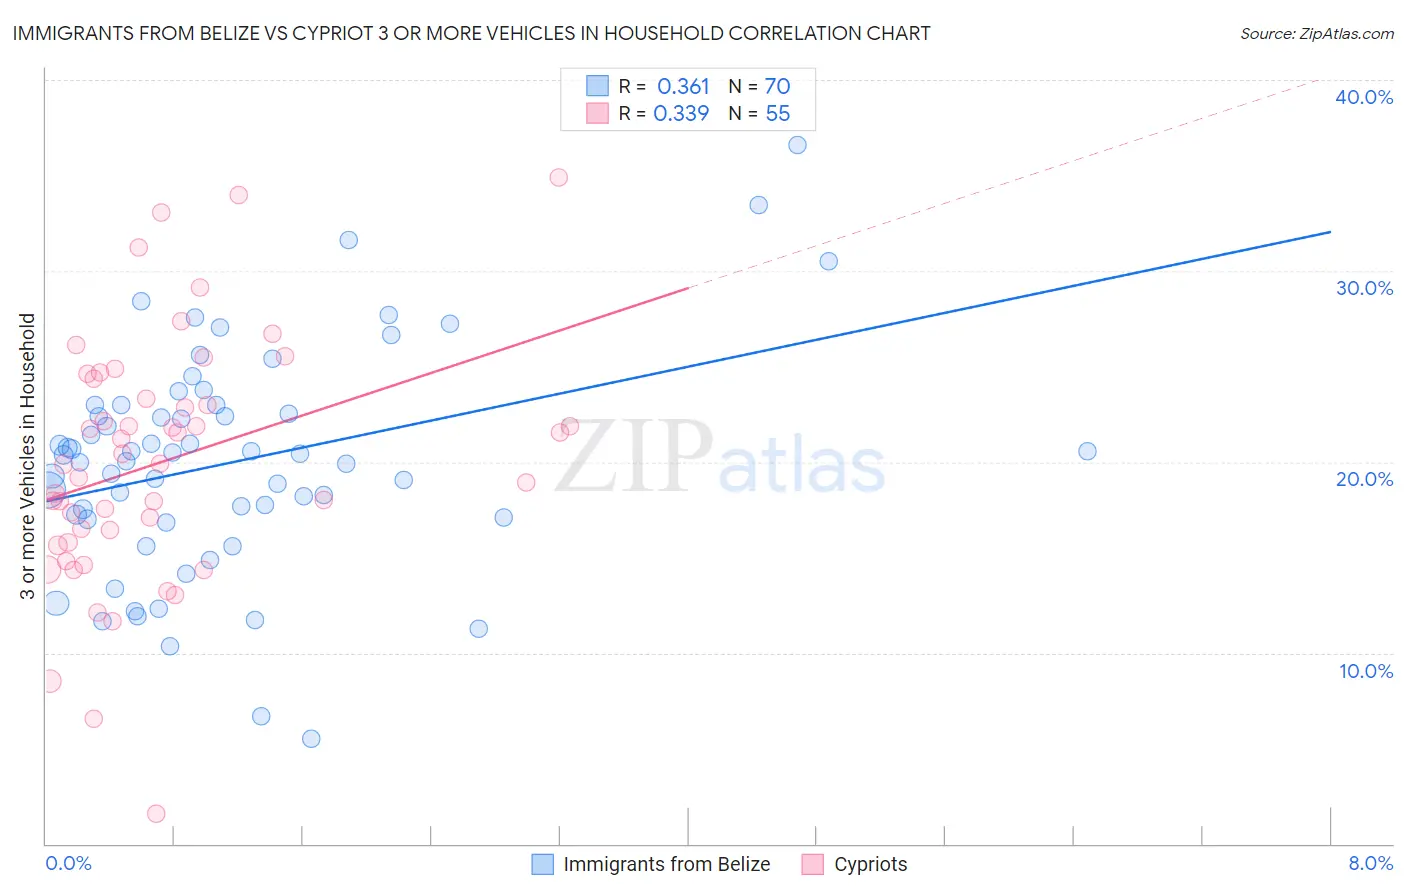
Immigrants from Belize vs Cypriot 3 or more Vehicles in Household Correlation Chart
The statistical analysis conducted on geographies consisting of 130,289,749 people shows a mild positive correlation between the proportion of Immigrants from Belize and percentage of households with 3 or more vehicles available in the United States with a correlation coefficient (R) of 0.361 and weighted average of 18.1%. Similarly, the statistical analysis conducted on geographies consisting of 61,836,618 people shows a mild positive correlation between the proportion of Cypriots and percentage of households with 3 or more vehicles available in the United States with a correlation coefficient (R) of 0.339 and weighted average of 16.6%, a difference of 8.8%.
3 or more Vehicles in Household Correlation Summary
| Measurement | Immigrants from Belize | Cypriot |
| Minimum | 5.5% | 1.6% |
| Maximum | 36.6% | 34.9% |
| Range | 31.1% | 33.3% |
| Mean | 20.0% | 20.0% |
| Median | 20.4% | 19.9% |
| Interquartile 25% (IQ1) | 17.1% | 15.8% |
| Interquartile 75% (IQ3) | 23.0% | 24.3% |
| Interquartile Range (IQR) | 5.9% | 8.5% |
| Standard Deviation (Sample) | 5.8% | 6.5% |
| Standard Deviation (Population) | 5.8% | 6.4% |
Similar Demographics by 3 or more Vehicles in Household
Demographics Similar to Immigrants from Belize by 3 or more Vehicles in Household
In terms of 3 or more vehicles in household, the demographic groups most similar to Immigrants from Belize are Immigrants from Australia (18.1%, a difference of 0.070%), Mongolian (18.1%, a difference of 0.16%), Carpatho Rusyn (18.0%, a difference of 0.23%), Immigrants from Europe (18.1%, a difference of 0.28%), and Immigrants from Eastern Africa (18.0%, a difference of 0.36%).
| Demographics | Rating | Rank | 3 or more Vehicles in Household |
| Immigrants | Honduras | 3.1 /100 | #238 | Tragic 18.2% |
| Immigrants | Middle Africa | 3.1 /100 | #239 | Tragic 18.2% |
| Immigrants | China | 2.9 /100 | #240 | Tragic 18.2% |
| Africans | 2.7 /100 | #241 | Tragic 18.2% |
| Hopi | 2.5 /100 | #242 | Tragic 18.2% |
| Immigrants | Europe | 2.4 /100 | #243 | Tragic 18.1% |
| Mongolians | 2.3 /100 | #244 | Tragic 18.1% |
| Immigrants | Belize | 2.1 /100 | #245 | Tragic 18.1% |
| Immigrants | Australia | 2.0 /100 | #246 | Tragic 18.1% |
| Carpatho Rusyns | 1.9 /100 | #247 | Tragic 18.0% |
| Immigrants | Eastern Africa | 1.8 /100 | #248 | Tragic 18.0% |
| Immigrants | Saudi Arabia | 1.7 /100 | #249 | Tragic 18.0% |
| Venezuelans | 1.7 /100 | #250 | Tragic 18.0% |
| Alsatians | 1.5 /100 | #251 | Tragic 18.0% |
| Immigrants | Southern Europe | 1.4 /100 | #252 | Tragic 17.9% |
Demographics Similar to Cypriots by 3 or more Vehicles in Household
In terms of 3 or more vehicles in household, the demographic groups most similar to Cypriots are Paraguayan (16.6%, a difference of 0.41%), Immigrants from South America (16.7%, a difference of 0.48%), Immigrants from Zaire (16.7%, a difference of 0.54%), Immigrants from Greece (16.5%, a difference of 0.83%), and Israeli (16.8%, a difference of 0.91%).
| Demographics | Rating | Rank | 3 or more Vehicles in Household |
| Bahamians | 0.1 /100 | #293 | Tragic 16.9% |
| Immigrants | Western Africa | 0.1 /100 | #294 | Tragic 16.9% |
| Immigrants | Russia | 0.1 /100 | #295 | Tragic 16.9% |
| Inupiat | 0.1 /100 | #296 | Tragic 16.9% |
| Israelis | 0.1 /100 | #297 | Tragic 16.8% |
| Immigrants | Zaire | 0.1 /100 | #298 | Tragic 16.7% |
| Immigrants | South America | 0.1 /100 | #299 | Tragic 16.7% |
| Cypriots | 0.0 /100 | #300 | Tragic 16.6% |
| Paraguayans | 0.0 /100 | #301 | Tragic 16.6% |
| Immigrants | Greece | 0.0 /100 | #302 | Tragic 16.5% |
| Immigrants | Serbia | 0.0 /100 | #303 | Tragic 16.4% |
| Ghanaians | 0.0 /100 | #304 | Tragic 16.4% |
| Immigrants | Morocco | 0.0 /100 | #305 | Tragic 16.3% |
| Somalis | 0.0 /100 | #306 | Tragic 16.2% |
| Immigrants | Ghana | 0.0 /100 | #307 | Tragic 16.2% |