Immigrants from Austria vs Kiowa 3 or more Vehicles in Household
COMPARE
Immigrants from Austria
Kiowa
3 or more Vehicles in Household
3 or more Vehicles in Household Comparison
Immigrants from Austria
Kiowa
18.9%
3 OR MORE VEHICLES IN HOUSEHOLD
15.4/ 100
METRIC RATING
202nd/ 347
METRIC RANK
19.5%
3 OR MORE VEHICLES IN HOUSEHOLD
50.9/ 100
METRIC RATING
172nd/ 347
METRIC RANK
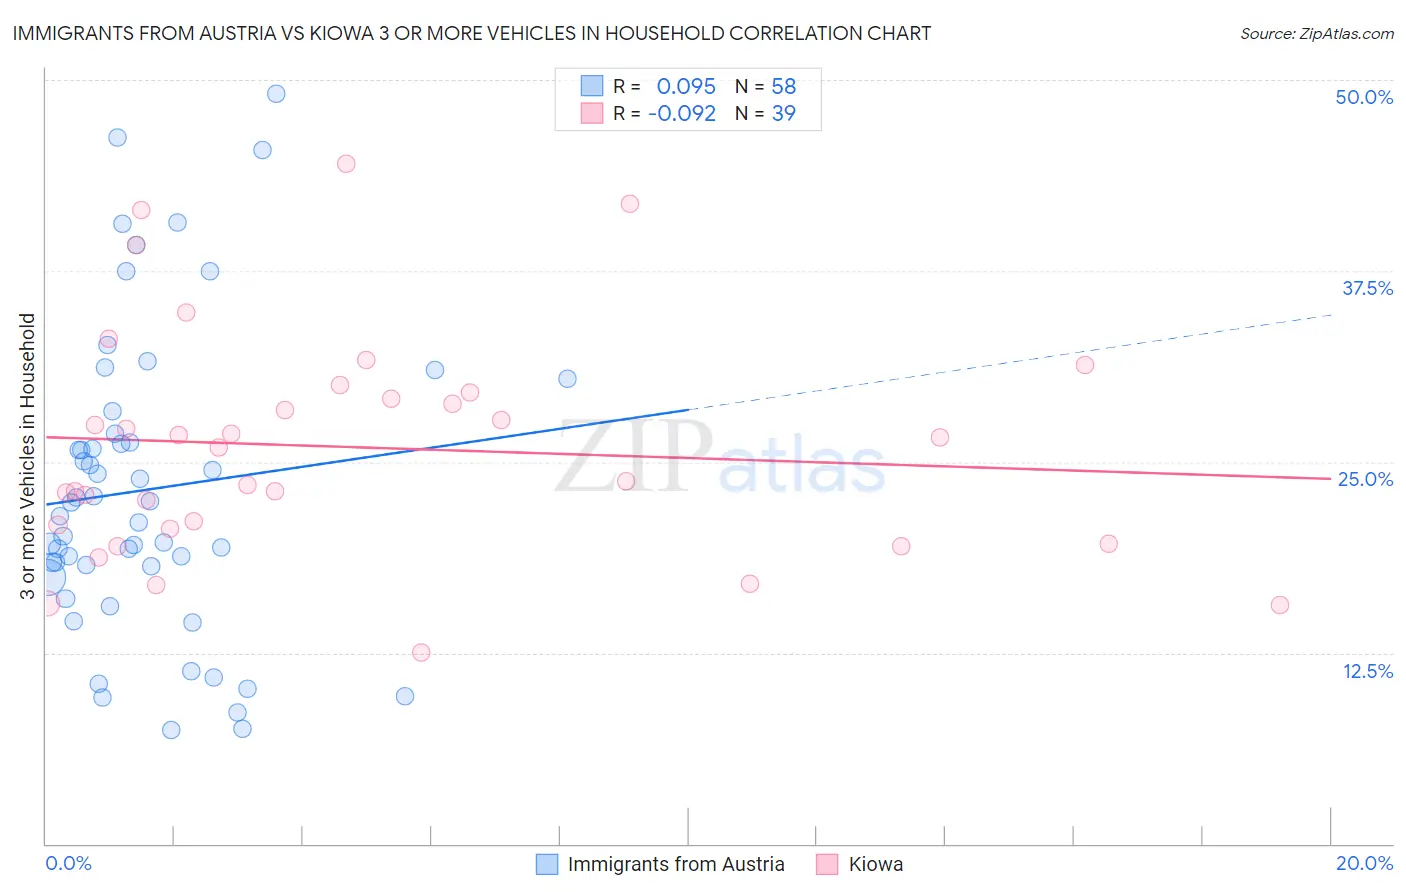
Immigrants from Austria vs Kiowa 3 or more Vehicles in Household Correlation Chart
The statistical analysis conducted on geographies consisting of 167,924,568 people shows a slight positive correlation between the proportion of Immigrants from Austria and percentage of households with 3 or more vehicles available in the United States with a correlation coefficient (R) of 0.095 and weighted average of 18.9%. Similarly, the statistical analysis conducted on geographies consisting of 56,098,357 people shows a slight negative correlation between the proportion of Kiowa and percentage of households with 3 or more vehicles available in the United States with a correlation coefficient (R) of -0.092 and weighted average of 19.5%, a difference of 3.4%.
3 or more Vehicles in Household Correlation Summary
| Measurement | Immigrants from Austria | Kiowa |
| Minimum | 7.4% | 12.5% |
| Maximum | 49.1% | 44.5% |
| Range | 41.7% | 32.0% |
| Mean | 23.2% | 25.9% |
| Median | 21.9% | 26.0% |
| Interquartile 25% (IQ1) | 18.2% | 20.6% |
| Interquartile 75% (IQ3) | 26.9% | 29.5% |
| Interquartile Range (IQR) | 8.7% | 8.9% |
| Standard Deviation (Sample) | 9.9% | 7.5% |
| Standard Deviation (Population) | 9.8% | 7.4% |
Similar Demographics by 3 or more Vehicles in Household
Demographics Similar to Immigrants from Austria by 3 or more Vehicles in Household
In terms of 3 or more vehicles in household, the demographic groups most similar to Immigrants from Austria are Tohono O'odham (18.9%, a difference of 0.090%), Immigrants from Romania (18.9%, a difference of 0.12%), Russian (18.8%, a difference of 0.19%), Immigrants from Eastern Asia (18.8%, a difference of 0.20%), and Immigrants from Chile (18.8%, a difference of 0.28%).
| Demographics | Rating | Rank | 3 or more Vehicles in Household |
| Immigrants | Moldova | 23.6 /100 | #195 | Fair 19.1% |
| Central American Indians | 22.2 /100 | #196 | Fair 19.0% |
| Immigrants | Japan | 22.0 /100 | #197 | Fair 19.0% |
| Egyptians | 19.5 /100 | #198 | Poor 19.0% |
| Immigrants | Norway | 19.0 /100 | #199 | Poor 19.0% |
| Argentineans | 18.2 /100 | #200 | Poor 18.9% |
| Arabs | 17.7 /100 | #201 | Poor 18.9% |
| Immigrants | Austria | 15.4 /100 | #202 | Poor 18.9% |
| Tohono O'odham | 14.8 /100 | #203 | Poor 18.9% |
| Immigrants | Romania | 14.6 /100 | #204 | Poor 18.9% |
| Russians | 14.2 /100 | #205 | Poor 18.8% |
| Immigrants | Eastern Asia | 14.1 /100 | #206 | Poor 18.8% |
| Immigrants | Chile | 13.6 /100 | #207 | Poor 18.8% |
| Immigrants | Burma/Myanmar | 13.6 /100 | #208 | Poor 18.8% |
| Immigrants | Egypt | 13.5 /100 | #209 | Poor 18.8% |
Demographics Similar to Kiowa by 3 or more Vehicles in Household
In terms of 3 or more vehicles in household, the demographic groups most similar to Kiowa are Immigrants from Northern Europe (19.5%, a difference of 0.050%), Immigrants from South Africa (19.5%, a difference of 0.070%), Immigrants from Western Europe (19.5%, a difference of 0.18%), Syrian (19.5%, a difference of 0.30%), and Iroquois (19.4%, a difference of 0.37%).
| Demographics | Rating | Rank | 3 or more Vehicles in Household |
| Immigrants | Costa Rica | 61.9 /100 | #165 | Good 19.7% |
| Immigrants | Cameroon | 60.9 /100 | #166 | Good 19.7% |
| Ukrainians | 58.9 /100 | #167 | Average 19.6% |
| Peruvians | 58.8 /100 | #168 | Average 19.6% |
| Immigrants | Denmark | 57.6 /100 | #169 | Average 19.6% |
| Iraqis | 56.0 /100 | #170 | Average 19.6% |
| Immigrants | Western Europe | 53.2 /100 | #171 | Average 19.5% |
| Kiowa | 50.9 /100 | #172 | Average 19.5% |
| Immigrants | Northern Europe | 50.2 /100 | #173 | Average 19.5% |
| Immigrants | South Africa | 50.0 /100 | #174 | Average 19.5% |
| Syrians | 47.0 /100 | #175 | Average 19.5% |
| Iroquois | 46.0 /100 | #176 | Average 19.4% |
| Immigrants | Peru | 41.1 /100 | #177 | Average 19.4% |
| Immigrants | Syria | 40.3 /100 | #178 | Average 19.4% |
| Immigrants | South Central Asia | 38.9 /100 | #179 | Fair 19.3% |