Brazilian Male Disability
COMPARE
Brazilian
Select to Compare
Male Disability
Brazilian Male Disability
10.9%
DISABILITY | MALES
85.4/ 100
METRIC RATING
130th/ 347
METRIC RANK
Brazilian Male Disability Correlation Chart
The statistical analysis conducted on geographies consisting of 323,937,131 people shows a moderate positive correlation between the proportion of Brazilians and percentage of males with a disability in the United States with a correlation coefficient (R) of 0.496 and weighted average of 10.9%. On average, for every 1% (one percent) increase in Brazilians within a typical geography, there is an increase of 0.25% in percentage of males with a disability.
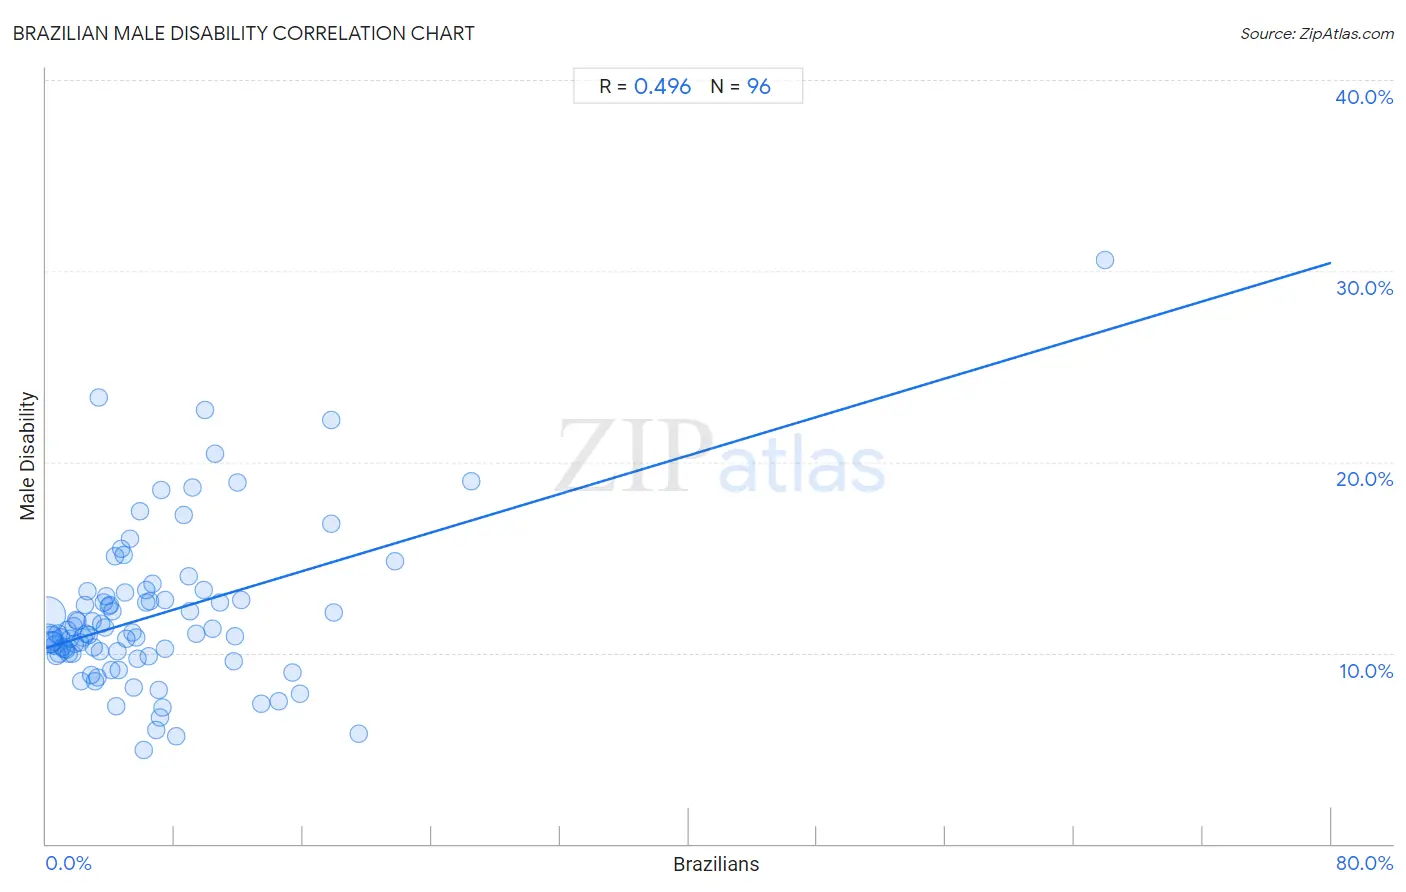
It is essential to understand that the correlation between the percentage of Brazilians and percentage of males with a disability does not imply a direct cause-and-effect relationship. It remains uncertain whether the presence of Brazilians influences an upward or downward trend in the level of percentage of males with a disability within an area, or if Brazilians simply ended up residing in those areas with higher or lower levels of percentage of males with a disability due to other factors.
Demographics Similar to Brazilians by Male Disability
In terms of male disability, the demographic groups most similar to Brazilians are Immigrants from Latvia (10.9%, a difference of 0.0%), Immigrants from Philippines (10.9%, a difference of 0.0%), Macedonian (11.0%, a difference of 0.14%), Immigrants from Ukraine (10.9%, a difference of 0.16%), and Immigrants from Fiji (11.0%, a difference of 0.16%).
| Demographics | Rating | Rank | Male Disability |
| Immigrants from Czechoslovakia | 88.4 /100 | #123 | Excellent 10.9% |
| South American Indians | 88.1 /100 | #124 | Excellent 10.9% |
| Immigrants from North Macedonia | 88.1 /100 | #125 | Excellent 10.9% |
| Immigrants from Trinidad and Tobago | 86.9 /100 | #126 | Excellent 10.9% |
| Immigrants from Ukraine | 86.8 /100 | #127 | Excellent 10.9% |
| Immigrants from Latvia | 85.5 /100 | #128 | Excellent 10.9% |
| Immigrants from Philippines | 85.4 /100 | #129 | Excellent 10.9% |
| Brazilians | 85.4 /100 | #130 | Excellent 10.9% |
| Macedonians | 84.2 /100 | #131 | Excellent 11.0% |
| Immigrants from Fiji | 84.0 /100 | #132 | Excellent 11.0% |
| Ugandans | 83.9 /100 | #133 | Excellent 11.0% |
| Bhutanese | 83.4 /100 | #134 | Excellent 11.0% |
| Trinidadians and Tobagonians | 83.3 /100 | #135 | Excellent 11.0% |
| Immigrants from Costa Rica | 82.8 /100 | #136 | Excellent 11.0% |
| Immigrants from Europe | 82.0 /100 | #137 | Excellent 11.0% |
Brazilian Male Disability Correlation Summary
| Measurement | Brazilian Data | Male Disability Data |
| Minimum | 0.046% | 4.9% |
| Maximum | 65.9% | 30.6% |
| Range | 65.9% | 25.7% |
| Mean | 6.7% | 12.0% |
| Median | 4.7% | 11.0% |
| Interquartile 25% (IQ1) | 2.3% | 9.9% |
| Interquartile 75% (IQ3) | 8.7% | 12.9% |
| Interquartile Range (IQR) | 6.4% | 2.9% |
| Standard Deviation (Sample) | 8.0% | 4.1% |
| Standard Deviation (Population) | 8.0% | 4.1% |
Correlation Details
| Brazilian Percentile | Sample Size | Male Disability |
[ 0.0% - 0.5% ] 0.046% | 137,012,700 | 12.0% |
[ 0.0% - 0.5% ] 0.14% | 85,404,346 | 10.8% |
[ 0.0% - 0.5% ] 0.24% | 31,738,628 | 10.5% |
[ 0.0% - 0.5% ] 0.33% | 19,842,910 | 10.9% |
[ 0.0% - 0.5% ] 0.43% | 12,176,016 | 10.6% |
[ 0.5% - 1.0% ] 0.53% | 7,595,123 | 10.4% |
[ 0.5% - 1.0% ] 0.63% | 5,724,831 | 9.9% |
[ 0.5% - 1.0% ] 0.73% | 2,623,104 | 11.0% |
[ 0.5% - 1.0% ] 0.81% | 3,087,353 | 10.0% |
[ 0.5% - 1.0% ] 0.92% | 2,547,374 | 10.8% |
[ 1.0% - 1.5% ] 1.02% | 2,024,905 | 10.3% |
[ 1.0% - 1.5% ] 1.12% | 1,608,611 | 10.2% |
[ 1.0% - 1.5% ] 1.21% | 1,432,636 | 10.2% |
[ 1.0% - 1.5% ] 1.31% | 967,552 | 11.2% |
[ 1.0% - 1.5% ] 1.41% | 819,150 | 9.9% |
[ 1.5% - 2.0% ] 1.50% | 801,833 | 10.7% |
[ 1.5% - 2.0% ] 1.60% | 581,737 | 9.9% |
[ 1.5% - 2.0% ] 1.69% | 1,006,548 | 11.4% |
[ 1.5% - 2.0% ] 1.80% | 259,954 | 10.5% |
[ 1.5% - 2.0% ] 1.90% | 486,593 | 11.7% |
[ 1.5% - 2.0% ] 1.97% | 151,262 | 11.7% |
[ 2.0% - 2.5% ] 2.11% | 735,276 | 10.5% |
[ 2.0% - 2.5% ] 2.18% | 440,427 | 8.5% |
[ 2.0% - 2.5% ] 2.30% | 368,846 | 10.8% |
[ 2.0% - 2.5% ] 2.37% | 296,770 | 12.5% |
[ 2.0% - 2.5% ] 2.47% | 143,659 | 11.0% |
[ 2.5% - 3.0% ] 2.56% | 198,889 | 13.2% |
[ 2.5% - 3.0% ] 2.67% | 121,638 | 10.9% |
[ 2.5% - 3.0% ] 2.79% | 60,644 | 8.8% |
[ 2.5% - 3.0% ] 2.87% | 167,682 | 11.6% |
[ 2.5% - 3.0% ] 2.98% | 182,701 | 10.3% |
[ 3.0% - 3.5% ] 3.06% | 65,423 | 8.5% |
[ 3.0% - 3.5% ] 3.16% | 61,562 | 8.7% |
[ 3.0% - 3.5% ] 3.25% | 154 | 23.4% |
[ 3.0% - 3.5% ] 3.37% | 107,926 | 10.1% |
[ 3.0% - 3.5% ] 3.45% | 240,705 | 11.5% |
[ 3.5% - 4.0% ] 3.58% | 255,685 | 12.7% |
[ 3.5% - 4.0% ] 3.65% | 143,358 | 11.3% |
[ 3.5% - 4.0% ] 3.74% | 174,154 | 12.9% |
[ 3.5% - 4.0% ] 3.87% | 32,655 | 12.4% |
[ 3.5% - 4.0% ] 3.96% | 97,412 | 12.5% |
[ 4.0% - 4.5% ] 4.03% | 151,720 | 9.1% |
[ 4.0% - 4.5% ] 4.13% | 29,781 | 12.2% |
[ 4.0% - 4.5% ] 4.25% | 7,419 | 15.1% |
[ 4.0% - 4.5% ] 4.32% | 63,170 | 7.2% |
[ 4.0% - 4.5% ] 4.47% | 42,045 | 10.1% |
[ 4.0% - 4.5% ] 4.50% | 122,618 | 9.1% |
[ 4.5% - 5.0% ] 4.64% | 12,532 | 15.4% |
[ 4.5% - 5.0% ] 4.79% | 321,508 | 15.1% |
[ 4.5% - 5.0% ] 4.90% | 9,246 | 13.1% |
[ 5.0% - 5.5% ] 5.02% | 5,799 | 10.8% |
[ 5.0% - 5.5% ] 5.18% | 29,576 | 15.9% |
[ 5.0% - 5.5% ] 5.38% | 818 | 11.1% |
[ 5.0% - 5.5% ] 5.46% | 1,924 | 8.2% |
[ 5.5% - 6.0% ] 5.61% | 144,030 | 10.8% |
[ 5.5% - 6.0% ] 5.70% | 20,668 | 9.7% |
[ 5.5% - 6.0% ] 5.81% | 3,957 | 17.4% |
[ 6.0% - 6.5% ] 6.09% | 10,623 | 4.9% |
[ 6.0% - 6.5% ] 6.20% | 742 | 13.3% |
[ 6.0% - 6.5% ] 6.25% | 9,051 | 12.6% |
[ 6.0% - 6.5% ] 6.40% | 5,003 | 9.8% |
[ 6.0% - 6.5% ] 6.48% | 48,922 | 12.7% |
[ 6.5% - 7.0% ] 6.59% | 57,900 | 13.6% |
[ 6.5% - 7.0% ] 6.84% | 68,930 | 6.0% |
[ 6.5% - 7.0% ] 7.00% | 46,938 | 8.1% |
[ 7.0% - 7.5% ] 7.07% | 948 | 6.6% |
[ 7.0% - 7.5% ] 7.12% | 2,330 | 18.5% |
[ 7.0% - 7.5% ] 7.25% | 33,691 | 7.2% |
[ 7.0% - 7.5% ] 7.37% | 17,870 | 12.8% |
[ 7.0% - 7.5% ] 7.42% | 58,564 | 10.2% |
[ 8.0% - 8.5% ] 8.10% | 51,318 | 5.6% |
[ 8.5% - 9.0% ] 8.59% | 32,076 | 17.2% |
[ 8.5% - 9.0% ] 8.89% | 118,546 | 14.0% |
[ 8.5% - 9.0% ] 8.96% | 31,932 | 12.2% |
[ 9.0% - 9.5% ] 9.11% | 2,570 | 18.6% |
[ 9.0% - 9.5% ] 9.37% | 98,856 | 11.0% |
[ 9.5% - 10.0% ] 9.81% | 11,653 | 13.3% |
[ 9.5% - 10.0% ] 9.91% | 13,154 | 22.7% |
[ 10.0% - 10.5% ] 10.38% | 60,009 | 11.2% |
[ 10.5% - 11.0% ] 10.51% | 1,580 | 20.4% |
[ 10.5% - 11.0% ] 10.79% | 82,782 | 12.7% |
[ 11.5% - 12.0% ] 11.68% | 50,112 | 9.5% |
[ 11.5% - 12.0% ] 11.74% | 71,805 | 10.9% |
[ 11.5% - 12.0% ] 11.93% | 3,589 | 18.9% |
[ 12.0% - 12.5% ] 12.14% | 17,178 | 12.8% |
[ 13.0% - 13.5% ] 13.38% | 30,411 | 7.3% |
[ 14.0% - 14.5% ] 14.48% | 27,569 | 7.5% |
[ 15.0% - 15.5% ] 15.29% | 8,547 | 8.9% |
[ 15.5% - 16.0% ] 15.76% | 203 | 7.9% |
[ 17.5% - 18.0% ] 17.72% | 1,016 | 22.2% |
[ 17.5% - 18.0% ] 17.75% | 1,183 | 16.7% |
[ 17.5% - 18.0% ] 17.87% | 38,898 | 12.1% |
[ 19.0% - 19.5% ] 19.48% | 2,367 | 5.8% |
[ 21.5% - 22.0% ] 21.74% | 61,855 | 14.8% |
[ 26.0% - 26.5% ] 26.46% | 650 | 19.0% |
[ 65.5% - 66.0% ] 65.90% | 217 | 30.6% |