Brazilian vs Immigrants from Jordan 3 or more Vehicles in Household
COMPARE
Brazilian
Immigrants from Jordan
3 or more Vehicles in Household
3 or more Vehicles in Household Comparison
Brazilians
Immigrants from Jordan
17.4%
3 OR MORE VEHICLES IN HOUSEHOLD
0.4/ 100
METRIC RATING
277th/ 347
METRIC RANK
19.9%
3 OR MORE VEHICLES IN HOUSEHOLD
75.0/ 100
METRIC RATING
154th/ 347
METRIC RANK
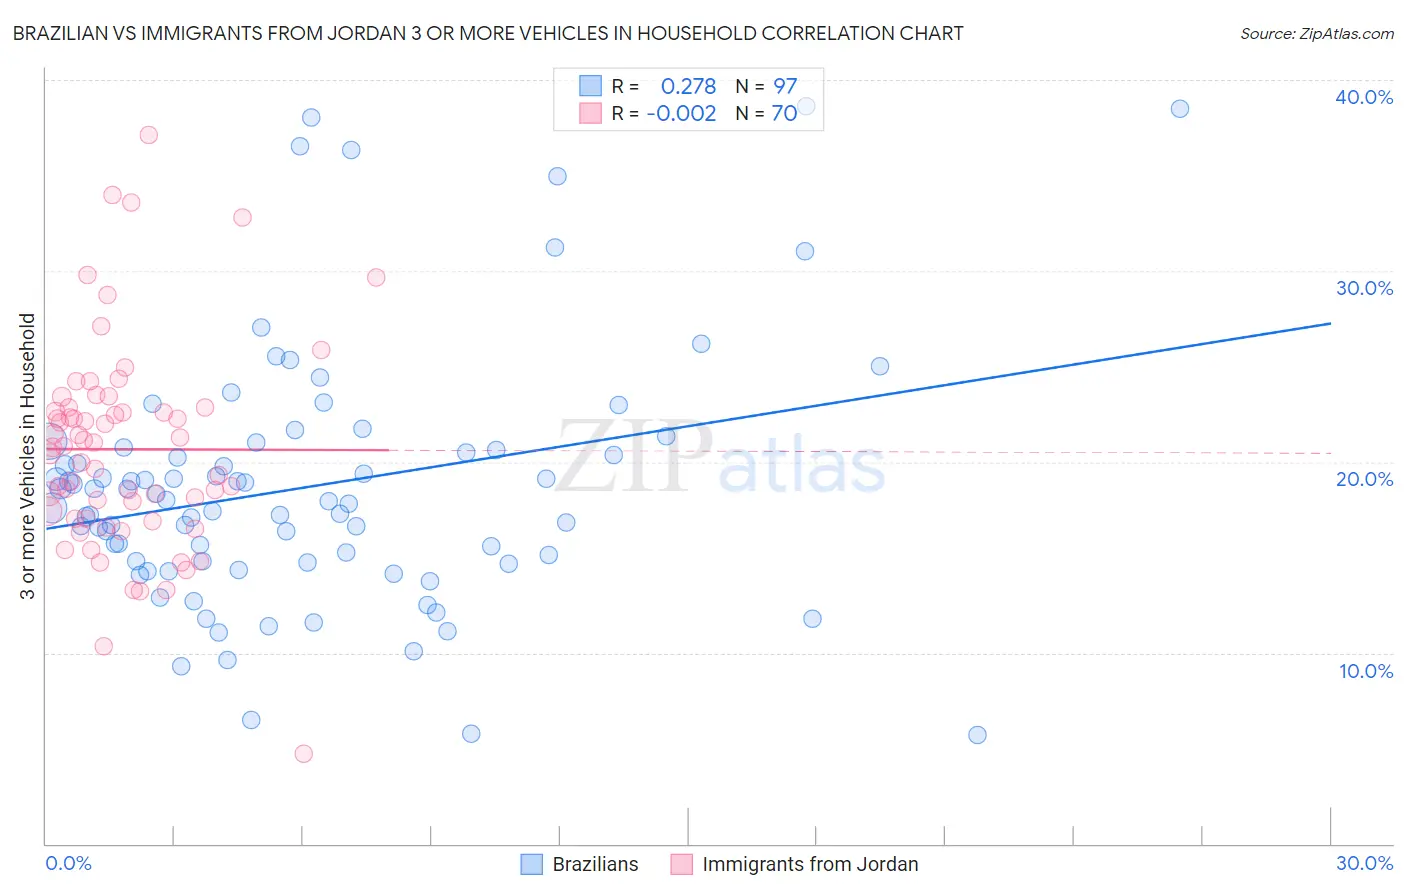
Brazilian vs Immigrants from Jordan 3 or more Vehicles in Household Correlation Chart
The statistical analysis conducted on geographies consisting of 323,603,230 people shows a weak positive correlation between the proportion of Brazilians and percentage of households with 3 or more vehicles available in the United States with a correlation coefficient (R) of 0.278 and weighted average of 17.4%. Similarly, the statistical analysis conducted on geographies consisting of 181,207,315 people shows no correlation between the proportion of Immigrants from Jordan and percentage of households with 3 or more vehicles available in the United States with a correlation coefficient (R) of -0.002 and weighted average of 19.9%, a difference of 14.3%.
3 or more Vehicles in Household Correlation Summary
| Measurement | Brazilian | Immigrants from Jordan |
| Minimum | 5.7% | 4.7% |
| Maximum | 38.6% | 37.1% |
| Range | 32.9% | 32.4% |
| Mean | 18.7% | 20.7% |
| Median | 17.9% | 20.8% |
| Interquartile 25% (IQ1) | 14.8% | 17.0% |
| Interquartile 75% (IQ3) | 20.7% | 22.8% |
| Interquartile Range (IQR) | 6.0% | 5.8% |
| Standard Deviation (Sample) | 6.7% | 5.5% |
| Standard Deviation (Population) | 6.7% | 5.5% |
Similar Demographics by 3 or more Vehicles in Household
Demographics Similar to Brazilians by 3 or more Vehicles in Household
In terms of 3 or more vehicles in household, the demographic groups most similar to Brazilians are Immigrants from Bahamas (17.4%, a difference of 0.090%), Immigrants from Kazakhstan (17.4%, a difference of 0.10%), Okinawan (17.4%, a difference of 0.14%), Immigrants from Eastern Europe (17.4%, a difference of 0.14%), and Immigrants from Latvia (17.4%, a difference of 0.19%).
| Demographics | Rating | Rank | 3 or more Vehicles in Household |
| Immigrants | Nepal | 0.6 /100 | #270 | Tragic 17.6% |
| South Americans | 0.6 /100 | #271 | Tragic 17.6% |
| Immigrants | Africa | 0.5 /100 | #272 | Tragic 17.6% |
| Immigrants | Sudan | 0.5 /100 | #273 | Tragic 17.6% |
| Immigrants | Bosnia and Herzegovina | 0.5 /100 | #274 | Tragic 17.5% |
| Immigrants | Ukraine | 0.4 /100 | #275 | Tragic 17.5% |
| Okinawans | 0.4 /100 | #276 | Tragic 17.4% |
| Brazilians | 0.4 /100 | #277 | Tragic 17.4% |
| Immigrants | Bahamas | 0.3 /100 | #278 | Tragic 17.4% |
| Immigrants | Kazakhstan | 0.3 /100 | #279 | Tragic 17.4% |
| Immigrants | Eastern Europe | 0.3 /100 | #280 | Tragic 17.4% |
| Immigrants | Latvia | 0.3 /100 | #281 | Tragic 17.4% |
| Immigrants | Ireland | 0.3 /100 | #282 | Tragic 17.3% |
| Blacks/African Americans | 0.3 /100 | #283 | Tragic 17.3% |
| Immigrants | Colombia | 0.3 /100 | #284 | Tragic 17.3% |
Demographics Similar to Immigrants from Jordan by 3 or more Vehicles in Household
In terms of 3 or more vehicles in household, the demographic groups most similar to Immigrants from Jordan are Yuman (19.9%, a difference of 0.060%), Tlingit-Haida (19.9%, a difference of 0.15%), Thai (19.8%, a difference of 0.37%), Hungarian (19.8%, a difference of 0.42%), and Lebanese (20.0%, a difference of 0.51%).
| Demographics | Rating | Rank | 3 or more Vehicles in Household |
| Slovaks | 83.0 /100 | #147 | Excellent 20.1% |
| Guatemalans | 82.6 /100 | #148 | Excellent 20.1% |
| Immigrants | Iran | 80.9 /100 | #149 | Excellent 20.0% |
| Immigrants | Immigrants | 80.8 /100 | #150 | Excellent 20.0% |
| Taiwanese | 80.6 /100 | #151 | Excellent 20.0% |
| Lebanese | 79.8 /100 | #152 | Good 20.0% |
| Yuman | 75.6 /100 | #153 | Good 19.9% |
| Immigrants | Jordan | 75.0 /100 | #154 | Good 19.9% |
| Tlingit-Haida | 73.4 /100 | #155 | Good 19.9% |
| Thais | 71.1 /100 | #156 | Good 19.8% |
| Hungarians | 70.5 /100 | #157 | Good 19.8% |
| Armenians | 68.8 /100 | #158 | Good 19.8% |
| Immigrants | Pakistan | 68.2 /100 | #159 | Good 19.8% |
| Immigrants | Lebanon | 67.6 /100 | #160 | Good 19.8% |
| Immigrants | Guatemala | 65.6 /100 | #161 | Good 19.7% |