Basque GED/Equivalency
COMPARE
Basque
Select to Compare
GED/Equivalency
Basque GED/Equivalency
86.4%
GED/EQUIVALENCY
79.5/ 100
METRIC RATING
146th/ 347
METRIC RANK
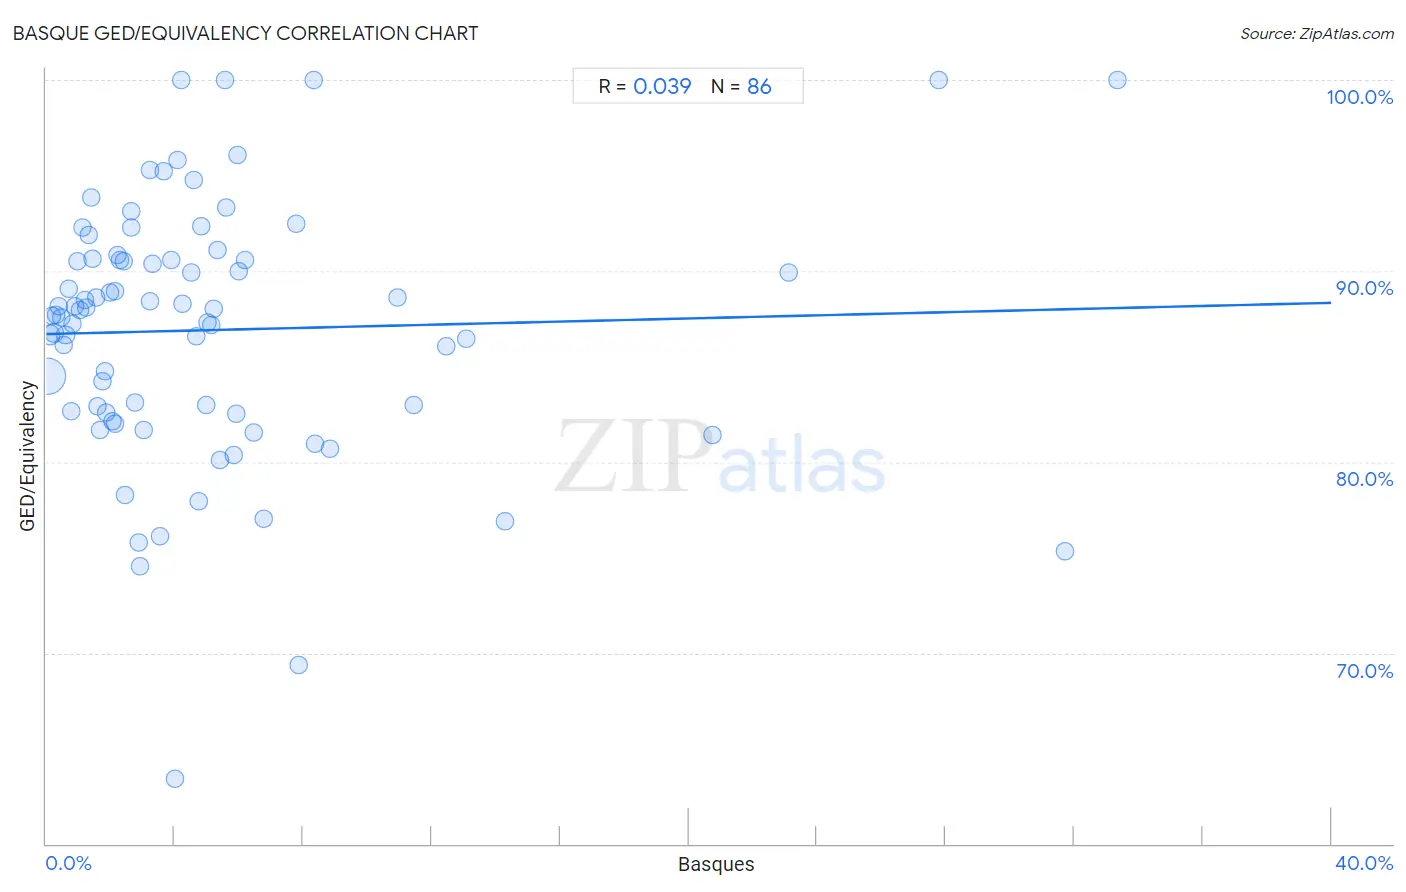
Basque GED/Equivalency Correlation Chart
The statistical analysis conducted on geographies consisting of 165,778,463 people shows no correlation between the proportion of Basques and percentage of population with at least ged/equivalency education in the United States with a correlation coefficient (R) of 0.039 and weighted average of 86.4%. On average, for every 1% (one percent) increase in Basques within a typical geography, there is an increase of 0.041% in percentage of population with at least ged/equivalency education.
It is essential to understand that the correlation between the percentage of Basques and percentage of population with at least ged/equivalency education does not imply a direct cause-and-effect relationship. It remains uncertain whether the presence of Basques influences an upward or downward trend in the level of percentage of population with at least ged/equivalency education within an area, or if Basques simply ended up residing in those areas with higher or lower levels of percentage of population with at least ged/equivalency education due to other factors.
Demographics Similar to Basques by GED/Equivalency
In terms of ged/equivalency, the demographic groups most similar to Basques are Immigrants from Northern Africa (86.3%, a difference of 0.0%), Immigrants from Poland (86.3%, a difference of 0.0%), Menominee (86.3%, a difference of 0.010%), Immigrants from Western Asia (86.3%, a difference of 0.020%), and Pakistani (86.4%, a difference of 0.030%).
| Demographics | Rating | Rank | GED/Equivalency |
| Immigrants from Malaysia | 85.0 /100 | #139 | Excellent 86.5% |
| Paraguayans | 84.1 /100 | #140 | Excellent 86.5% |
| Laotians | 83.2 /100 | #141 | Excellent 86.5% |
| Immigrants from Indonesia | 82.4 /100 | #142 | Excellent 86.4% |
| Immigrants from Pakistan | 82.4 /100 | #143 | Excellent 86.4% |
| Bolivians | 82.1 /100 | #144 | Excellent 86.4% |
| Pakistanis | 80.4 /100 | #145 | Excellent 86.4% |
| Basques | 79.5 /100 | #146 | Good 86.4% |
| Immigrants from Northern Africa | 79.3 /100 | #147 | Good 86.3% |
| Immigrants from Poland | 79.3 /100 | #148 | Good 86.3% |
| Menominee | 79.3 /100 | #149 | Good 86.3% |
| Immigrants from Western Asia | 78.8 /100 | #150 | Good 86.3% |
| Immigrants from Bosnia and Herzegovina | 77.9 /100 | #151 | Good 86.3% |
| Brazilians | 77.2 /100 | #152 | Good 86.3% |
| Kenyans | 76.6 /100 | #153 | Good 86.3% |
Basque GED/Equivalency Correlation Summary
| Measurement | Basque Data | GED/Equivalency Data |
| Minimum | 0.025% | 63.4% |
| Maximum | 33.3% | 100.0% |
| Range | 33.3% | 36.6% |
| Mean | 5.2% | 86.9% |
| Median | 3.3% | 87.8% |
| Interquartile 25% (IQ1) | 1.5% | 82.6% |
| Interquartile 75% (IQ3) | 5.8% | 90.6% |
| Interquartile Range (IQR) | 4.3% | 8.0% |
| Standard Deviation (Sample) | 6.4% | 6.8% |
| Standard Deviation (Population) | 6.4% | 6.7% |
Correlation Details
| Basque Percentile | Sample Size | GED/Equivalency |
[ 0.0% - 0.5% ] 0.025% | 131,624,311 | 84.5% |
[ 0.0% - 0.5% ] 0.098% | 18,970,639 | 86.7% |
[ 0.0% - 0.5% ] 0.18% | 6,090,964 | 87.7% |
[ 0.0% - 0.5% ] 0.24% | 3,289,273 | 86.8% |
[ 0.0% - 0.5% ] 0.32% | 1,953,698 | 87.7% |
[ 0.0% - 0.5% ] 0.39% | 847,706 | 88.2% |
[ 0.0% - 0.5% ] 0.46% | 402,099 | 87.6% |
[ 0.5% - 1.0% ] 0.54% | 625,357 | 86.1% |
[ 0.5% - 1.0% ] 0.60% | 310,317 | 86.6% |
[ 0.5% - 1.0% ] 0.69% | 139,015 | 89.1% |
[ 0.5% - 1.0% ] 0.77% | 139,943 | 82.6% |
[ 0.5% - 1.0% ] 0.82% | 81,136 | 87.2% |
[ 0.5% - 1.0% ] 0.90% | 112,011 | 88.1% |
[ 0.5% - 1.0% ] 0.97% | 174,069 | 90.5% |
[ 1.0% - 1.5% ] 1.06% | 54,614 | 87.9% |
[ 1.0% - 1.5% ] 1.11% | 15,951 | 92.3% |
[ 1.0% - 1.5% ] 1.19% | 378,538 | 88.5% |
[ 1.0% - 1.5% ] 1.25% | 88,951 | 88.1% |
[ 1.0% - 1.5% ] 1.32% | 51,018 | 91.9% |
[ 1.0% - 1.5% ] 1.41% | 28,929 | 93.8% |
[ 1.0% - 1.5% ] 1.46% | 33,396 | 90.6% |
[ 1.5% - 2.0% ] 1.54% | 16,722 | 88.6% |
[ 1.5% - 2.0% ] 1.60% | 37,372 | 82.9% |
[ 1.5% - 2.0% ] 1.67% | 51,828 | 81.7% |
[ 1.5% - 2.0% ] 1.75% | 18,087 | 84.2% |
[ 1.5% - 2.0% ] 1.83% | 43,183 | 84.8% |
[ 1.5% - 2.0% ] 1.88% | 16,691 | 82.6% |
[ 1.5% - 2.0% ] 1.97% | 12,219 | 88.9% |
[ 2.0% - 2.5% ] 2.05% | 26,023 | 82.1% |
[ 2.0% - 2.5% ] 2.13% | 1,924 | 82.0% |
[ 2.0% - 2.5% ] 2.16% | 4,265 | 88.9% |
[ 2.0% - 2.5% ] 2.23% | 1,746 | 90.8% |
[ 2.0% - 2.5% ] 2.30% | 44,796 | 90.6% |
[ 2.0% - 2.5% ] 2.40% | 1,747 | 90.5% |
[ 2.0% - 2.5% ] 2.45% | 13,351 | 78.2% |
[ 2.5% - 3.0% ] 2.63% | 4,594 | 92.3% |
[ 2.5% - 3.0% ] 2.66% | 6,324 | 93.1% |
[ 2.5% - 3.0% ] 2.78% | 3,673 | 83.1% |
[ 2.5% - 3.0% ] 2.89% | 3,360 | 75.8% |
[ 2.5% - 3.0% ] 2.94% | 4,664 | 74.6% |
[ 3.0% - 3.5% ] 3.05% | 295 | 81.7% |
[ 3.0% - 3.5% ] 3.21% | 498 | 88.4% |
[ 3.0% - 3.5% ] 3.24% | 9,217 | 95.3% |
[ 3.0% - 3.5% ] 3.32% | 1,325 | 90.4% |
[ 3.5% - 4.0% ] 3.54% | 254 | 76.1% |
[ 3.5% - 4.0% ] 3.65% | 1,315 | 95.2% |
[ 3.5% - 4.0% ] 3.89% | 566 | 90.6% |
[ 4.0% - 4.5% ] 4.02% | 1,665 | 63.4% |
[ 4.0% - 4.5% ] 4.07% | 491 | 95.8% |
[ 4.0% - 4.5% ] 4.19% | 191 | 100.0% |
[ 4.0% - 4.5% ] 4.24% | 542 | 88.3% |
[ 4.5% - 5.0% ] 4.51% | 1,753 | 89.9% |
[ 4.5% - 5.0% ] 4.57% | 962 | 94.8% |
[ 4.5% - 5.0% ] 4.68% | 940 | 86.6% |
[ 4.5% - 5.0% ] 4.75% | 1,874 | 77.9% |
[ 4.5% - 5.0% ] 4.83% | 2,381 | 92.3% |
[ 4.5% - 5.0% ] 4.99% | 8,170 | 83.0% |
[ 5.0% - 5.5% ] 5.03% | 2,643 | 87.3% |
[ 5.0% - 5.5% ] 5.13% | 234 | 87.2% |
[ 5.0% - 5.5% ] 5.21% | 1,036 | 88.0% |
[ 5.0% - 5.5% ] 5.34% | 356 | 91.1% |
[ 5.0% - 5.5% ] 5.39% | 1,540 | 80.1% |
[ 5.5% - 6.0% ] 5.56% | 18 | 100.0% |
[ 5.5% - 6.0% ] 5.62% | 783 | 93.3% |
[ 5.5% - 6.0% ] 5.85% | 496 | 80.3% |
[ 5.5% - 6.0% ] 5.90% | 627 | 82.5% |
[ 5.5% - 6.0% ] 5.95% | 336 | 96.1% |
[ 6.0% - 6.5% ] 6.00% | 50 | 90.0% |
[ 6.0% - 6.5% ] 6.18% | 3,041 | 90.6% |
[ 6.0% - 6.5% ] 6.47% | 6,169 | 81.5% |
[ 6.5% - 7.0% ] 6.76% | 74 | 77.0% |
[ 7.5% - 8.0% ] 7.77% | 309 | 92.5% |
[ 7.5% - 8.0% ] 7.84% | 51 | 69.4% |
[ 8.0% - 8.5% ] 8.33% | 84 | 100.0% |
[ 8.0% - 8.5% ] 8.38% | 167 | 80.9% |
[ 8.5% - 9.0% ] 8.82% | 68 | 80.7% |
[ 10.5% - 11.0% ] 10.93% | 787 | 88.6% |
[ 11.0% - 11.5% ] 11.43% | 105 | 83.0% |
[ 12.0% - 12.5% ] 12.46% | 690 | 86.1% |
[ 13.0% - 13.5% ] 13.08% | 107 | 86.5% |
[ 14.0% - 14.5% ] 14.29% | 14 | 76.9% |
[ 20.5% - 21.0% ] 20.74% | 897 | 81.4% |
[ 23.0% - 23.5% ] 23.13% | 320 | 89.9% |
[ 27.5% - 28.0% ] 27.78% | 108 | 100.0% |
[ 31.5% - 32.0% ] 31.73% | 353 | 75.3% |
[ 33.0% - 33.5% ] 33.33% | 57 | 100.0% |