Basque Unemployment Among Women with Children Ages 6 to 17 years

COMPARE

Basque
Race
Ancestry
AfghanAfricanAlaska NativeAlaskan AthabascanAlbanianAleutAlsatianAmericanApacheArabArapahoArgentineanArmenianAssyrian/Chaldean/SyriacAustralianAustrianBahamianBangladeshiBarbadianBasqueBelgianBelizeanBermudanBhutaneseBlackfeetBolivianBrazilianBritishBritish West IndianBulgarianBurmeseCajunCambodianCanadianCape VerdeanCarpatho RusynCelticCentral AmericanCentral American IndianCherokeeCheyenneChickasawChileanChineseChippewaChoctawColombianColvilleComancheCosta RicanCreeCreekCroatianCrowCubanCypriotCzechCzechoslovakianDanishDelawareDominicanDutchDutch West IndianEastern EuropeanEcuadorianEgyptianEnglishEstonianEthiopianEuropeanFijianFilipinoFinnishFrenchFrench American IndianFrench CanadianGermanGerman RussianGhanaianGreekGuamanian/ChamorroGuatemalanGuyaneseHaitianHmongHonduranHopiHoumaHungarianIcelanderIndian (Asian)IndonesianInupiatIranianIraqiIrishIroquoisIsraeliItalianJamaicanJapaneseJordanianKenyanKiowaKoreanLaotianLatvianLebaneseLiberianLithuanianLumbeeLuxembourgerMacedonianMalaysianMalteseMarshalleseMenomineeMexicanMexican American IndianMongolianMoroccanNative HawaiianNavajoNepaleseNew ZealanderNicaraguanNigerianNorthern EuropeanNorwegianOkinawanOsageOttawaPaiutePakistaniPalestinianPanamanianParaguayanPennsylvania GermanPeruvianPimaPolishPortuguesePotawatomiPuebloPuerto RicanPuget Sound SalishRomanianRussianSalvadoranSamoanScandinavianScotch-IrishScottishSeminoleSenegaleseSerbianShoshoneSierra LeoneanSiouxSlavicSlovakSloveneSomaliSouth AfricanSouth AmericanSouth American IndianSoviet UnionSpaniardSpanishSpanish AmericanSpanish American IndianSri LankanSubsaharan AfricanSudaneseSwedishSwissSyrianTaiwaneseThaiTlingit-HaidaTohono O'OdhamTonganTrinidadian and TobagonianTsimshianTurkishU.S. Virgin IslanderUgandanUkrainianUruguayanUteVenezuelanVietnameseWelshWest IndianYakamaYaquiYugoslavianYumanYup'ikZimbabwean
Immigration
NonimmigrantsImmigrantsAfghanistanAfricaAlbaniaArgentinaArmeniaAsiaAustraliaAustriaBahamasBangladeshBarbadosBelarusBelgiumBelizeBoliviaBosnia and HerzegovinaBrazilBulgariaBurma/MyanmarCabo VerdeCambodiaCameroonCanadaCaribbeanCentral AmericaChileChinaColombiaCongoCosta RicaCroatiaCubaCzechoslovakiaDenmarkDominicaDominican RepublicEastern AfricaEastern AsiaEastern EuropeEcuadorEgyptEl SalvadorEnglandEritreaEthiopiaEuropeFijiFranceGermanyGhanaGreeceGrenadaGuatemalaGuyanaHaitiHondurasHong KongHungaryIndiaIndonesiaIranIraqIrelandIsraelItalyJamaicaJapanJordanKazakhstanKenyaKoreaKuwaitLaosLatin AmericaLatviaLebanonLiberiaLithuaniaMalaysiaMexicoMicronesiaMiddle AfricaMoldovaMoroccoNepalNetherlandsNicaraguaNigeriaNorth AmericaNorth MacedoniaNorthern AfricaNorthern EuropeNorwayOceaniaPakistanPanamaPeruPhilippinesPolandPortugalRomaniaRussiaSaudi ArabiaScotlandSenegalSerbiaSierra LeoneSingaporeSomaliaSouth AfricaSouth AmericaSouth Central AsiaSouth Eastern AsiaSouthern EuropeSpainSri LankaSt. Vincent and the GrenadinesSudanSwedenSwitzerlandSyriaTaiwanThailandTrinidad and TobagoTurkeyUgandaUkraineUruguayUzbekistanVenezuelaVietnamWest IndiesWestern AfricaWestern AsiaWestern EuropeYemenZaireZimbabweAzores
Select to Compare
Race
Ancestry
AfghanAfricanAlaska NativeAlaskan AthabascanAlbanianAleutAlsatianAmericanApacheArabArapahoArgentineanArmenianAssyrian/Chaldean/SyriacAustralianAustrianBahamianBangladeshiBarbadianBelgianBelizeanBermudanBhutaneseBlackfeetBolivianBrazilianBritishBritish West IndianBulgarianBurmeseCajunCambodianCanadianCape VerdeanCarpatho RusynCelticCentral AmericanCentral American IndianCherokeeCheyenneChickasawChileanChineseChippewaChoctawColombianColvilleComancheCosta RicanCreeCreekCroatianCrowCubanCypriotCzechCzechoslovakianDanishDelawareDominicanDutchDutch West IndianEastern EuropeanEcuadorianEgyptianEnglishEstonianEthiopianEuropeanFijianFilipinoFinnishFrenchFrench American IndianFrench CanadianGermanGerman RussianGhanaianGreekGuamanian/ChamorroGuatemalanGuyaneseHaitianHmongHonduranHopiHoumaHungarianIcelanderIndian (Asian)IndonesianInupiatIranianIraqiIrishIroquoisIsraeliItalianJamaicanJapaneseJordanianKenyanKiowaKoreanLaotianLatvianLebaneseLiberianLithuanianLumbeeLuxembourgerMacedonianMalaysianMalteseMarshalleseMenomineeMexicanMexican American IndianMongolianMoroccanNative HawaiianNavajoNepaleseNew ZealanderNicaraguanNigerianNorthern EuropeanNorwegianOkinawanOsageOttawaPaiutePakistaniPalestinianPanamanianParaguayanPennsylvania GermanPeruvianPimaPolishPortuguesePotawatomiPuebloPuerto RicanPuget Sound SalishRomanianRussianSalvadoranSamoanScandinavianScotch-IrishScottishSeminoleSenegaleseSerbianShoshoneSierra LeoneanSiouxSlavicSlovakSloveneSomaliSouth AfricanSouth AmericanSouth American IndianSoviet UnionSpaniardSpanishSpanish AmericanSpanish American IndianSri LankanSubsaharan AfricanSudaneseSwedishSwissSyrianTaiwaneseThaiTlingit-HaidaTohono O'OdhamTonganTrinidadian and TobagonianTsimshianTurkishU.S. Virgin IslanderUgandanUkrainianUruguayanUteVenezuelanVietnameseWelshWest IndianYakamaYaquiYugoslavianYumanYup'ikZimbabwean
Immigration
NonimmigrantsImmigrantsAfghanistanAfricaAlbaniaArgentinaArmeniaAsiaAustraliaAustriaBahamasBangladeshBarbadosBelarusBelgiumBelizeBoliviaBosnia and HerzegovinaBrazilBulgariaBurma/MyanmarCabo VerdeCambodiaCameroonCanadaCaribbeanCentral AmericaChileChinaColombiaCongoCosta RicaCroatiaCubaCzechoslovakiaDenmarkDominicaDominican RepublicEastern AfricaEastern AsiaEastern EuropeEcuadorEgyptEl SalvadorEnglandEritreaEthiopiaEuropeFijiFranceGermanyGhanaGreeceGrenadaGuatemalaGuyanaHaitiHondurasHong KongHungaryIndiaIndonesiaIranIraqIrelandIsraelItalyJamaicaJapanJordanKazakhstanKenyaKoreaKuwaitLaosLatin AmericaLatviaLebanonLiberiaLithuaniaMalaysiaMexicoMicronesiaMiddle AfricaMoldovaMoroccoNepalNetherlandsNicaraguaNigeriaNorth AmericaNorth MacedoniaNorthern AfricaNorthern EuropeNorwayOceaniaPakistanPanamaPeruPhilippinesPolandPortugalRomaniaRussiaSaudi ArabiaScotlandSenegalSerbiaSierra LeoneSingaporeSomaliaSouth AfricaSouth AmericaSouth Central AsiaSouth Eastern AsiaSouthern EuropeSpainSri LankaSt. Vincent and the GrenadinesSudanSwedenSwitzerlandSyriaTaiwanThailandTrinidad and TobagoTurkeyUgandaUkraineUruguayUzbekistanVenezuelaVietnamWest IndiesWestern AfricaWestern AsiaWestern EuropeYemenZaireZimbabweAzores
Unemployment Among Women with Children Ages 6 to 17 years
Income
Poverty
Unemployment
Labor Participation
Family Structure
Vehicle Availability
Education Level
Disability

Basque Unemployment Among Women with Children Ages 6 to 17 years
Exceptional

8.2%
UNEMPLOYMENT | WOMEN W/ CHILDREN 6 TO 17
100.0/ 100
METRIC RATING
60th/ 347
METRIC RANK

Basque Unemployment Among Women with Children Ages 6 to 17 years Correlation Chart

The statistical analysis conducted on geographies consisting of 136,984,140 people shows a moderate positive correlation between the proportion of Basques and unemployment rate among women with children between the ages 6 and 17 in the United States with a correlation coefficient (R) of 0.484 and weighted average of 8.2%. On average, for every 1% (one percent) increase in Basques within a typical geography, there is an increase of 10.4% in unemployment rate among women with children between the ages 6 and 17.
Basque Unemployment Among Women with Children Ages 6 to 17 years
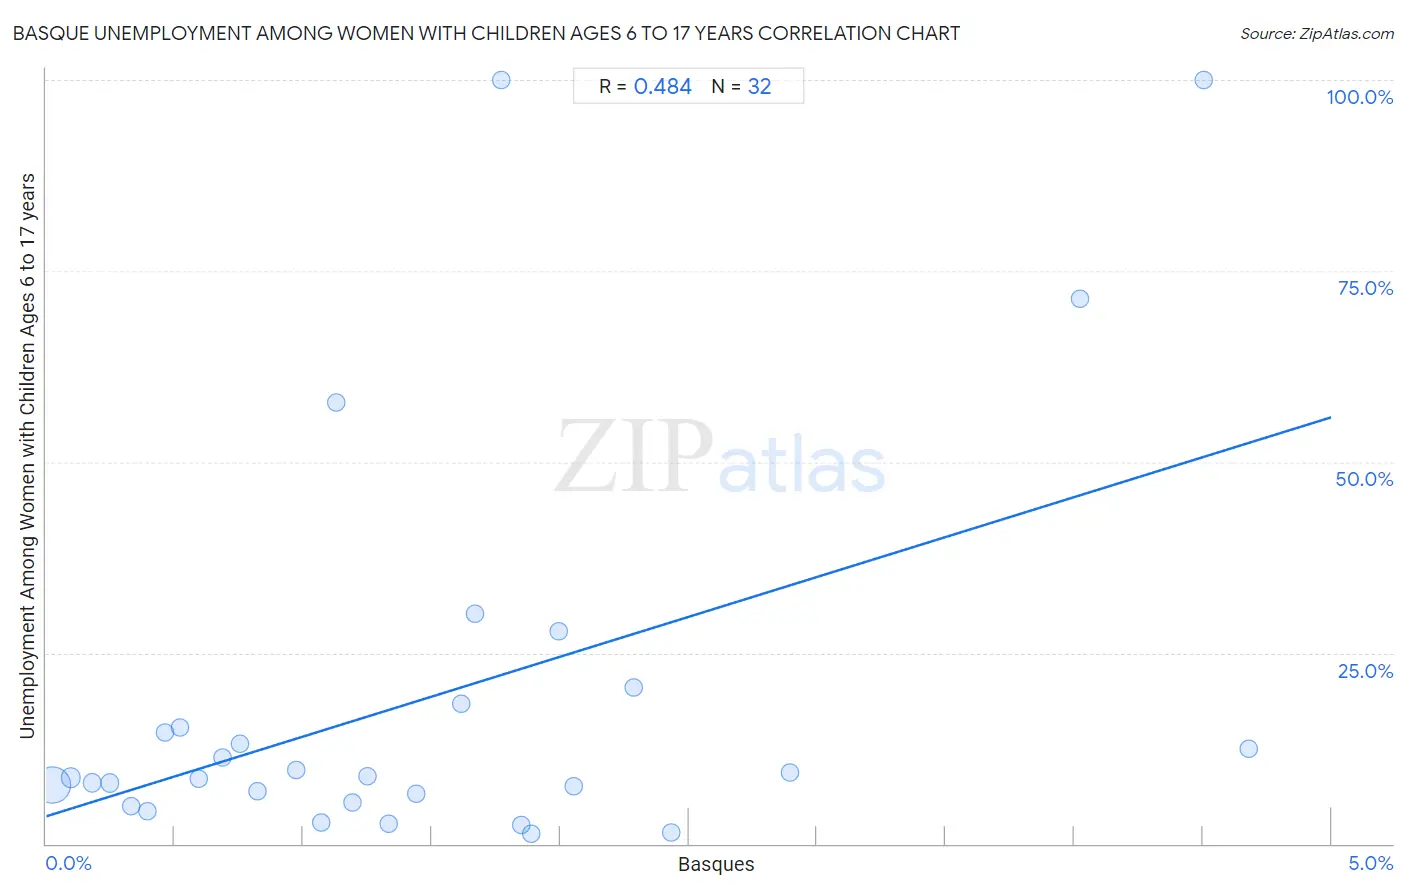
It is essential to understand that the correlation between the percentage of Basques and unemployment rate among women with children between the ages 6 and 17 does not imply a direct cause-and-effect relationship. It remains uncertain whether the presence of Basques influences an upward or downward trend in the level of unemployment rate among women with children between the ages 6 and 17 within an area, or if Basques simply ended up residing in those areas with higher or lower levels of unemployment rate among women with children between the ages 6 and 17 due to other factors.

Demographics Similar to Basques by Unemployment Among Women with Children Ages 6 to 17 years

In terms of unemployment among women with children ages 6 to 17 years, the demographic groups most similar to Basques are Immigrants from Philippines (8.2%, a difference of 0.0%), Immigrants from Malaysia (8.2%, a difference of 0.070%), Korean (8.2%, a difference of 0.18%), Spanish American Indian (8.2%, a difference of 0.22%), and Immigrants from Laos (8.2%, a difference of 0.26%).
DemographicsRating | RankUnemployment Among Women with Children Ages 6 to 17 years
Danes
100.0
/100
|
#53
Exceptional
8.1%
Immigrants from Armenia
100.0
/100
|
#54
Exceptional
8.2%
Immigrants from Japan
100.0
/100
|
#55
Exceptional
8.2%
Immigrants from Bosnia and Herzegovina
100.0
/100
|
#56
Exceptional
8.2%
Immigrants from Laos
100.0
/100
|
#57
Exceptional
8.2%
Immigrants from Malaysia
100.0
/100
|
#58
Exceptional
8.2%
Immigrants from Philippines
100.0
/100
|
#59
Exceptional
8.2%
Basques
100.0
/100
|
#60
Exceptional
8.2%
Koreans
100.0
/100
|
#61
Exceptional
8.2%
Spanish American Indians
100.0
/100
|
#62
Exceptional
8.2%
Immigrants from South Eastern Asia
99.9
/100
|
#63
Exceptional
8.2%
Immigrants from Kuwait
99.9
/100
|
#64
Exceptional
8.3%
Immigrants from Albania
99.9
/100
|
#65
Exceptional
8.3%
Luxembourgers
99.9
/100
|
#66
Exceptional
8.3%
Armenians
99.9
/100
|
#67
Exceptional
8.3%

Basque Unemployment Among Women with Children Ages 6 to 17 years Correlation Summary

MeasurementBasque DataUnemployment Among Women with Children Ages 6 to 17 years Data
Minimum0.023%1.3%
Maximum4.7%100.0%
Range4.7%98.7%
Mean1.5%19.0%
Median1.2%8.7%
Interquartile 25% (IQ1)0.56%6.0%
Interquartile 75% (IQ3)1.9%16.8%
Interquartile Range (IQR)1.4%10.8%
Standard Deviation (Sample)1.2%26.1%
Standard Deviation (Population)1.2%25.7%

Correlation Details

Basque PercentileSample SizeUnemployment Among Women with Children Ages 6 to 17 years
[
0.0%
-
0.5%
]
0.023%
115,815,7277.7%
[
0.0%
-
0.5%
]
0.096%
12,971,4658.7%
[
0.0%
-
0.5%
]
0.18%
3,886,6218.0%
[
0.0%
-
0.5%
]
0.25%
1,602,4427.9%
[
0.0%
-
0.5%
]
0.33%
1,011,4844.9%
[
0.0%
-
0.5%
]
0.39%
372,4374.3%
[
0.0%
-
0.5%
]
0.46%
250,24214.5%
[
0.5%
-
1.0%
]
0.52%
207,82915.1%
[
0.5%
-
1.0%
]
0.59%
67,4908.5%
[
0.5%
-
1.0%
]
0.69%
96,26811.4%
[
0.5%
-
1.0%
]
0.76%
36,78313.1%
[
0.5%
-
1.0%
]
0.82%
32,1696.9%
[
0.5%
-
1.0%
]
0.97%
43,1469.6%
[
1.0%
-
1.5%
]
1.07%
42,4482.8%
[
1.0%
-
1.5%
]
1.13%
2,92757.7%
[
1.0%
-
1.5%
]
1.19%
324,3095.4%
[
1.0%
-
1.5%
]
1.25%
41,1478.8%
[
1.0%
-
1.5%
]
1.33%
38,3222.6%
[
1.0%
-
1.5%
]
1.44%
20,6096.5%
[
1.5%
-
2.0%
]
1.61%
6,07618.4%
[
1.5%
-
2.0%
]
1.67%
30,19630.1%
[
1.5%
-
2.0%
]
1.77%
621100.0%
[
1.5%
-
2.0%
]
1.85%
20,5132.5%
[
1.5%
-
2.0%
]
1.89%
10,5451.3%
[
1.5%
-
2.0%
]
2.00%
3,95727.9%
[
2.0%
-
2.5%
]
2.05%
26,0237.6%
[
2.0%
-
2.5%
]
2.29%
7,21220.4%
[
2.0%
-
2.5%
]
2.43%
8,1821.5%
[
2.5%
-
3.0%
]
2.89%
2,7669.4%
[
4.0%
-
4.5%
]
4.02%
1,66571.4%
[
4.5%
-
5.0%
]
4.50%
1,643100.0%
[
4.5%
-
5.0%
]
4.68%
87612.5%