Moapa Valley, NV Map & Demographics
Moapa Valley Map
Moapa Valley Overview
$33,385
PER CAPITA INCOME
$89,018
AVG FAMILY INCOME
$82,592
AVG HOUSEHOLD INCOME
56.5%
WAGE / INCOME GAP [ % ]
43.5¢/ $1
WAGE / INCOME GAP [ $ ]
$13,501
FAMILY INCOME DEFICIT
0.42
INEQUALITY / GINI INDEX
7,144
TOTAL POPULATION
3,513
MALE POPULATION
3,631
FEMALE POPULATION
96.75
MALES / 100 FEMALES
103.36
FEMALES / 100 MALES
31.5
MEDIAN AGE
3.5
AVG FAMILY SIZE
3.1
AVG HOUSEHOLD SIZE
3,133
LABOR FORCE [ PEOPLE ]
61.8%
PERCENT IN LABOR FORCE
12.1%
UNEMPLOYMENT RATE
Income in Moapa Valley
Income Overview in Moapa Valley
Per Capita Income in Moapa Valley is $33,385, while median incomes of families and households are $89,018 and $82,592 respectively.
| Characteristic | Number | Measure |
| Per Capita Income | 7,144 | $33,385 |
| Median Family Income | 1,806 | $89,018 |
| Mean Family Income | 1,806 | $116,900 |
| Median Household Income | 2,335 | $82,592 |
| Mean Household Income | 2,335 | $100,395 |
| Income Deficit | 1,806 | $13,501 |
| Wage / Income Gap (%) | 7,144 | 56.47% |
| Wage / Income Gap ($) | 7,144 | 43.53¢ per $1 |
| Gini / Inequality Index | 7,144 | 0.42 |
Earnings by Sex in Moapa Valley
Average Earnings in Moapa Valley are $42,309, $58,958 for men and $25,666 for women, a difference of 56.5%.
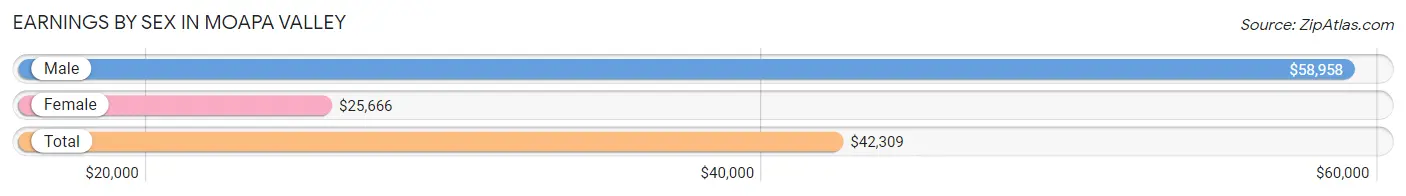
| Sex | Number | Average Earnings |
| Male | 1,834 (56.0%) | $58,958 |
| Female | 1,441 (44.0%) | $25,666 |
| Total | 3,275 (100.0%) | $42,309 |
Earnings by Sex by Income Bracket in Moapa Valley
The most common earnings brackets in Moapa Valley are $100,000+ for men (513 | 28.0%) and $55,000 to $64,999 for women (227 | 15.8%).
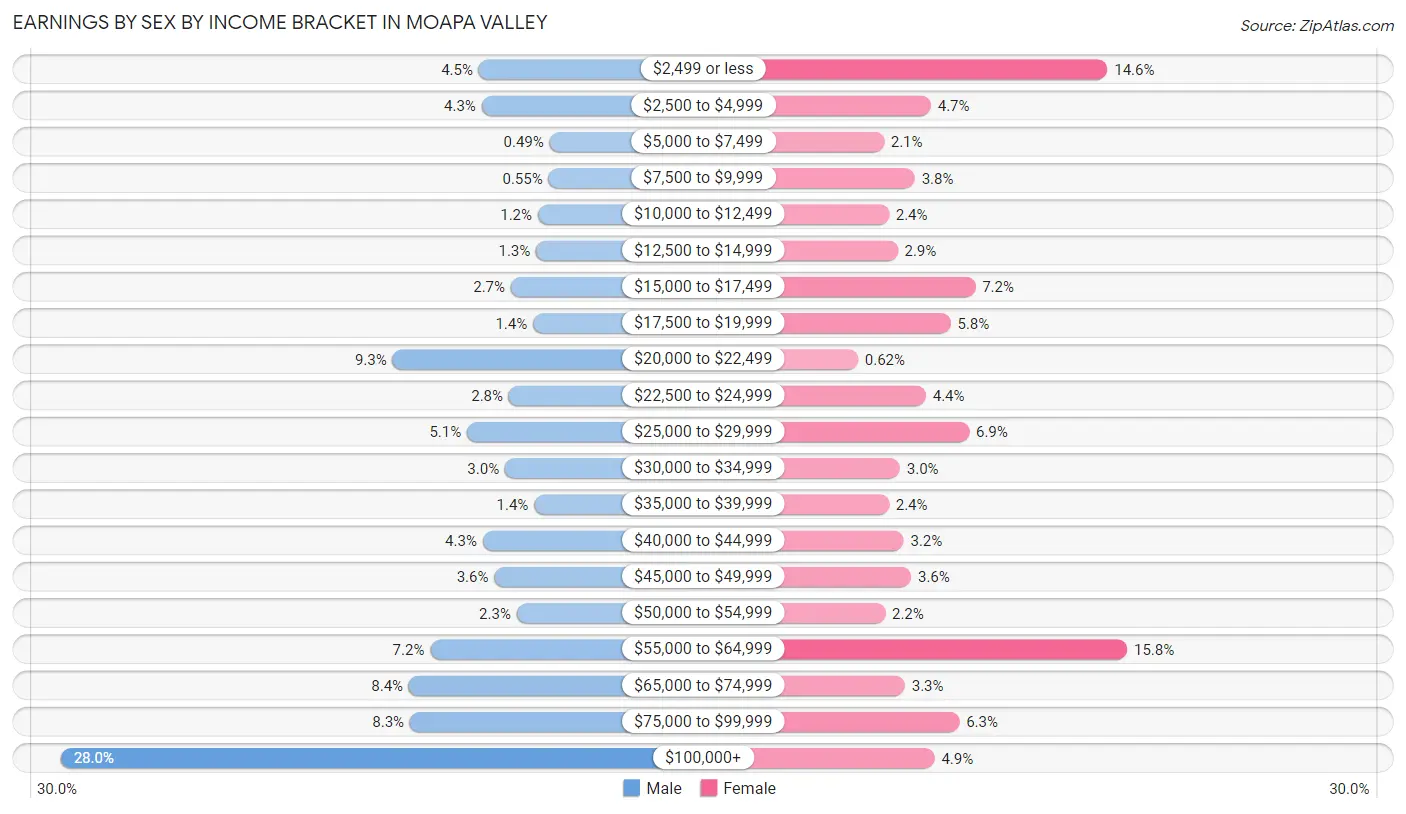
| Income | Male | Female |
| $2,499 or less | 82 (4.5%) | 211 (14.6%) |
| $2,500 to $4,999 | 79 (4.3%) | 68 (4.7%) |
| $5,000 to $7,499 | 9 (0.5%) | 30 (2.1%) |
| $7,500 to $9,999 | 10 (0.5%) | 55 (3.8%) |
| $10,000 to $12,499 | 21 (1.1%) | 34 (2.4%) |
| $12,500 to $14,999 | 23 (1.3%) | 41 (2.9%) |
| $15,000 to $17,499 | 49 (2.7%) | 104 (7.2%) |
| $17,500 to $19,999 | 26 (1.4%) | 84 (5.8%) |
| $20,000 to $22,499 | 171 (9.3%) | 9 (0.6%) |
| $22,500 to $24,999 | 51 (2.8%) | 64 (4.4%) |
| $25,000 to $29,999 | 94 (5.1%) | 99 (6.9%) |
| $30,000 to $34,999 | 55 (3.0%) | 43 (3.0%) |
| $35,000 to $39,999 | 25 (1.4%) | 34 (2.4%) |
| $40,000 to $44,999 | 78 (4.3%) | 46 (3.2%) |
| $45,000 to $49,999 | 66 (3.6%) | 52 (3.6%) |
| $50,000 to $54,999 | 43 (2.3%) | 31 (2.1%) |
| $55,000 to $64,999 | 132 (7.2%) | 227 (15.8%) |
| $65,000 to $74,999 | 154 (8.4%) | 47 (3.3%) |
| $75,000 to $99,999 | 153 (8.3%) | 91 (6.3%) |
| $100,000+ | 513 (28.0%) | 71 (4.9%) |
| Total | 1,834 (100.0%) | 1,441 (100.0%) |
Earnings by Sex by Educational Attainment in Moapa Valley
Average earnings in Moapa Valley are $62,853 for men and $38,346 for women, a difference of 39.0%. Men with an educational attainment of college or associate's degree enjoy the highest average annual earnings of $79,667, while those with high school diploma education earn the least with $40,938. Women with an educational attainment of bachelor's degree earn the most with the average annual earnings of $64,453, while those with high school diploma education have the smallest earnings of $24,924.
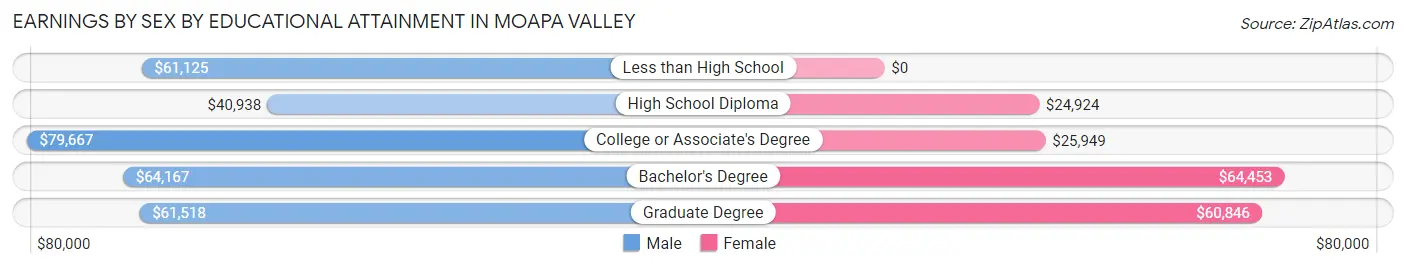
| Educational Attainment | Male Income | Female Income |
| Less than High School | $61,125 | $0 |
| High School Diploma | $40,938 | $24,924 |
| College or Associate's Degree | $79,667 | $25,949 |
| Bachelor's Degree | $64,167 | $64,453 |
| Graduate Degree | $61,518 | $60,846 |
| Total | $62,853 | $38,346 |
Family Income in Moapa Valley
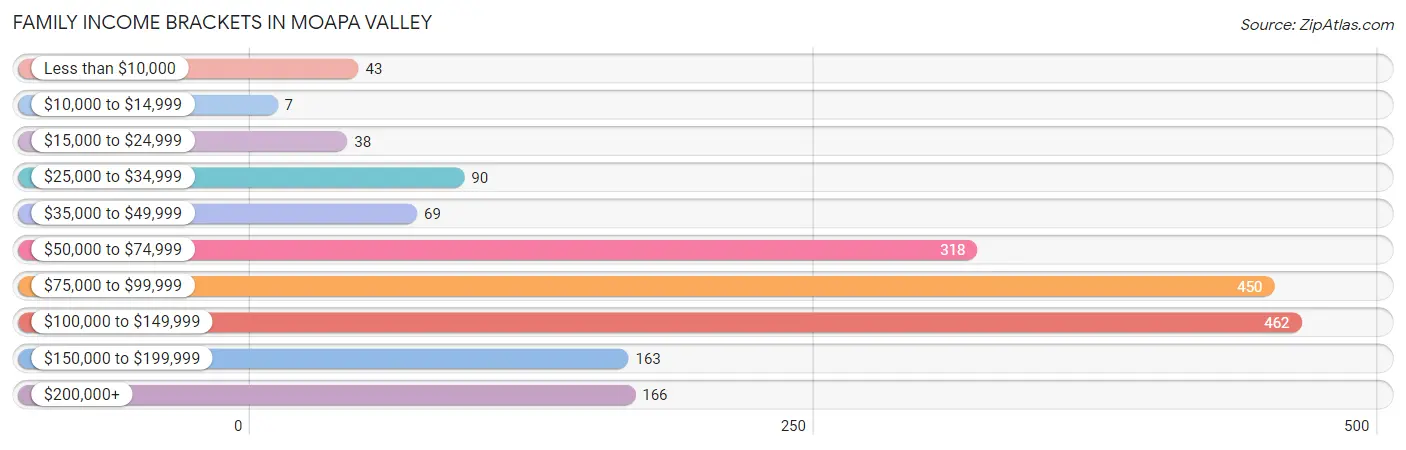
Family Income Brackets in Moapa Valley
According to the Moapa Valley family income data, there are 462 families falling into the $100,000 to $149,999 income range, which is the most common income bracket and makes up 25.6% of all families. Conversely, the $10,000 to $14,999 income bracket is the least frequent group with only 7 families (0.4%) belonging to this category.
| Income Bracket | # Families | % Families |
| Less than $10,000 | 43 | 2.4% |
| $10,000 to $14,999 | 7 | 0.4% |
| $15,000 to $24,999 | 38 | 2.1% |
| $25,000 to $34,999 | 90 | 5.0% |
| $35,000 to $49,999 | 69 | 3.8% |
| $50,000 to $74,999 | 318 | 17.6% |
| $75,000 to $99,999 | 450 | 24.9% |
| $100,000 to $149,999 | 462 | 25.6% |
| $150,000 to $199,999 | 163 | 9.0% |
| $200,000+ | 166 | 9.2% |
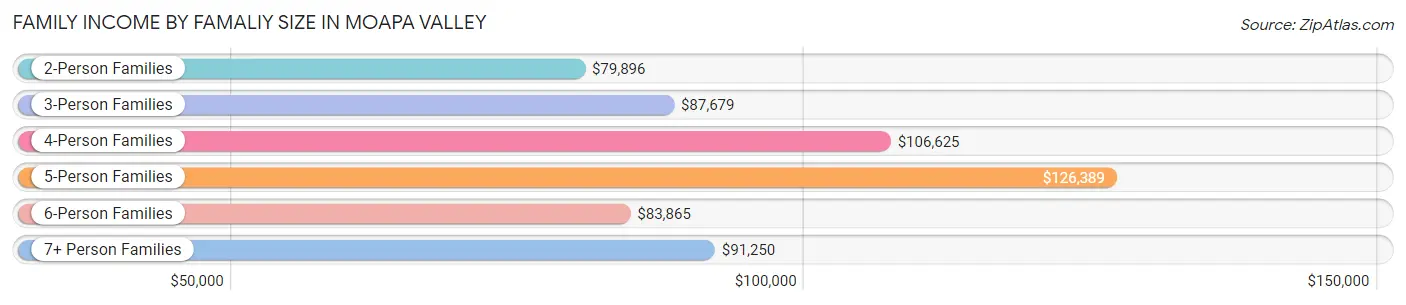
Family Income by Famaliy Size in Moapa Valley
5-person families (188 | 10.4%) account for the highest median family income in Moapa Valley with $126,389 per family, while 2-person families (747 | 41.4%) have the highest median income of $39,948 per family member.
| Income Bracket | # Families | Median Income |
| 2-Person Families | 747 (41.4%) | $79,896 |
| 3-Person Families | 234 (13.0%) | $87,679 |
| 4-Person Families | 343 (19.0%) | $106,625 |
| 5-Person Families | 188 (10.4%) | $126,389 |
| 6-Person Families | 240 (13.3%) | $83,865 |
| 7+ Person Families | 54 (3.0%) | $91,250 |
| Total | 1,806 (100.0%) | $89,018 |
Family Income by Number of Earners in Moapa Valley
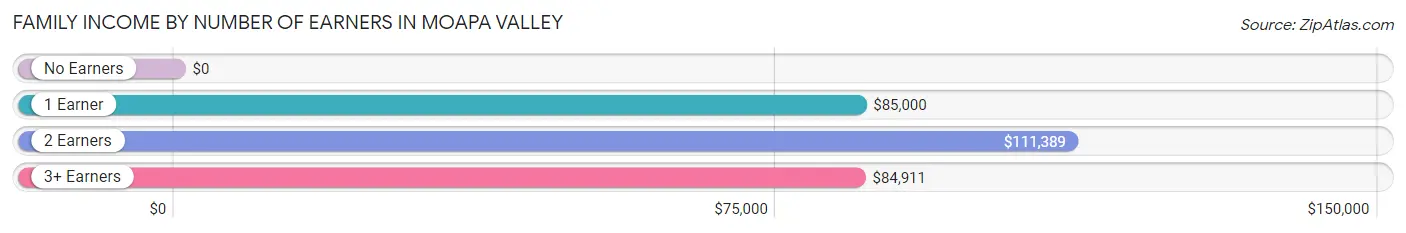
| Number of Earners | # Families | Median Income |
| No Earners | 158 (8.7%) | $0 |
| 1 Earner | 690 (38.2%) | $85,000 |
| 2 Earners | 666 (36.9%) | $111,389 |
| 3+ Earners | 292 (16.2%) | $84,911 |
| Total | 1,806 (100.0%) | $89,018 |
Household Income in Moapa Valley
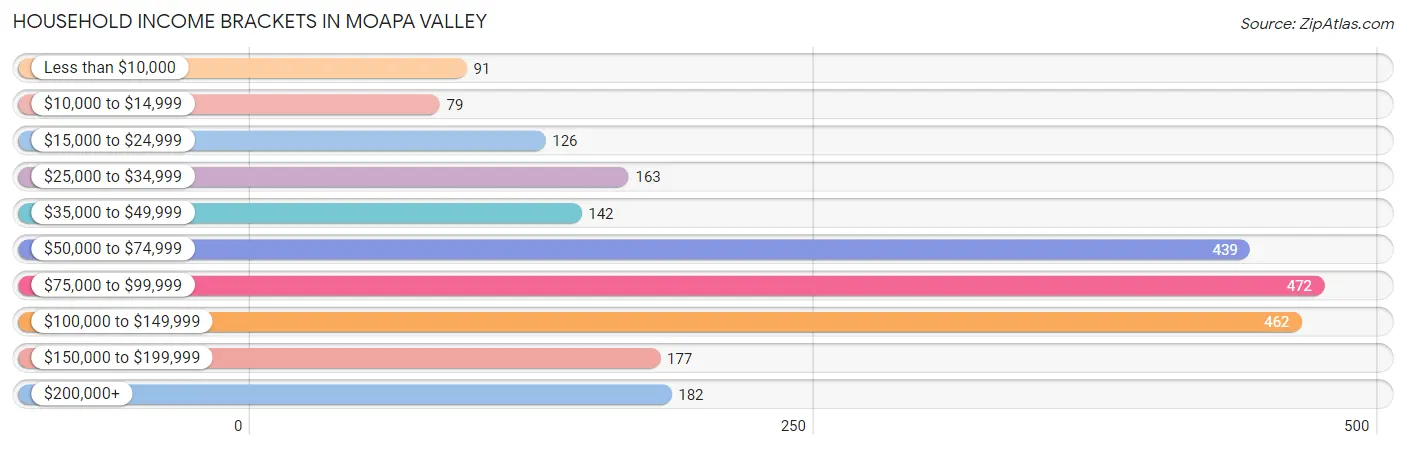
Household Income Brackets in Moapa Valley
With 472 households falling in the category, the $75,000 to $99,999 income range is the most frequent in Moapa Valley, accounting for 20.2% of all households. In contrast, only 79 households (3.4%) fall into the $10,000 to $14,999 income bracket, making it the least populous group.
| Income Bracket | # Households | % Households |
| Less than $10,000 | 91 | 3.9% |
| $10,000 to $14,999 | 79 | 3.4% |
| $15,000 to $24,999 | 126 | 5.4% |
| $25,000 to $34,999 | 163 | 7.0% |
| $35,000 to $49,999 | 142 | 6.1% |
| $50,000 to $74,999 | 439 | 18.8% |
| $75,000 to $99,999 | 472 | 20.2% |
| $100,000 to $149,999 | 462 | 19.8% |
| $150,000 to $199,999 | 177 | 7.6% |
| $200,000+ | 182 | 7.8% |
Household Income by Householder Age in Moapa Valley
The median household income in Moapa Valley is $82,592, with the highest median household income of $89,085 found in the 25 to 44 years age bracket for the primary householder. A total of 808 households (34.6%) fall into this category. Meanwhile, the 15 to 24 years age bracket for the primary householder has the lowest median household income of $0, with 6 households (0.3%) in this group.
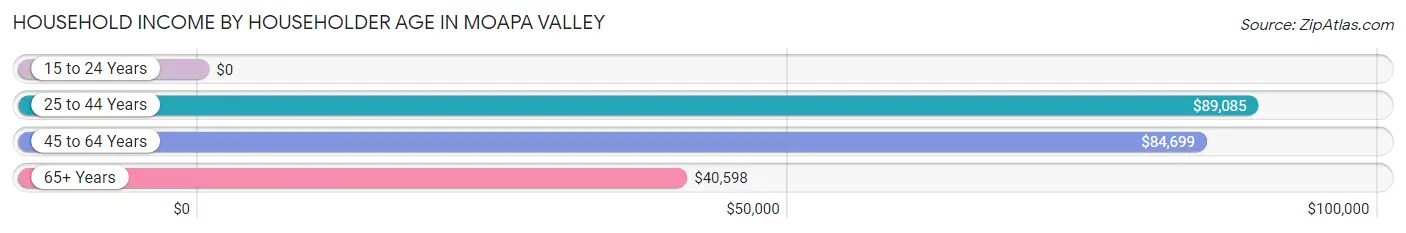
| Income Bracket | # Households | Median Income |
| 15 to 24 Years | 6 (0.3%) | $0 |
| 25 to 44 Years | 808 (34.6%) | $89,085 |
| 45 to 64 Years | 904 (38.7%) | $84,699 |
| 65+ Years | 617 (26.4%) | $40,598 |
| Total | 2,335 (100.0%) | $82,592 |
Poverty in Moapa Valley
Income Below Poverty by Sex and Age in Moapa Valley
With 7.3% poverty level for males and 8.3% for females among the residents of Moapa Valley, 45 to 54 year old males and 55 to 64 year old females are the most vulnerable to poverty, with 107 males (20.3%) and 46 females (15.1%) in their respective age groups living below the poverty level.
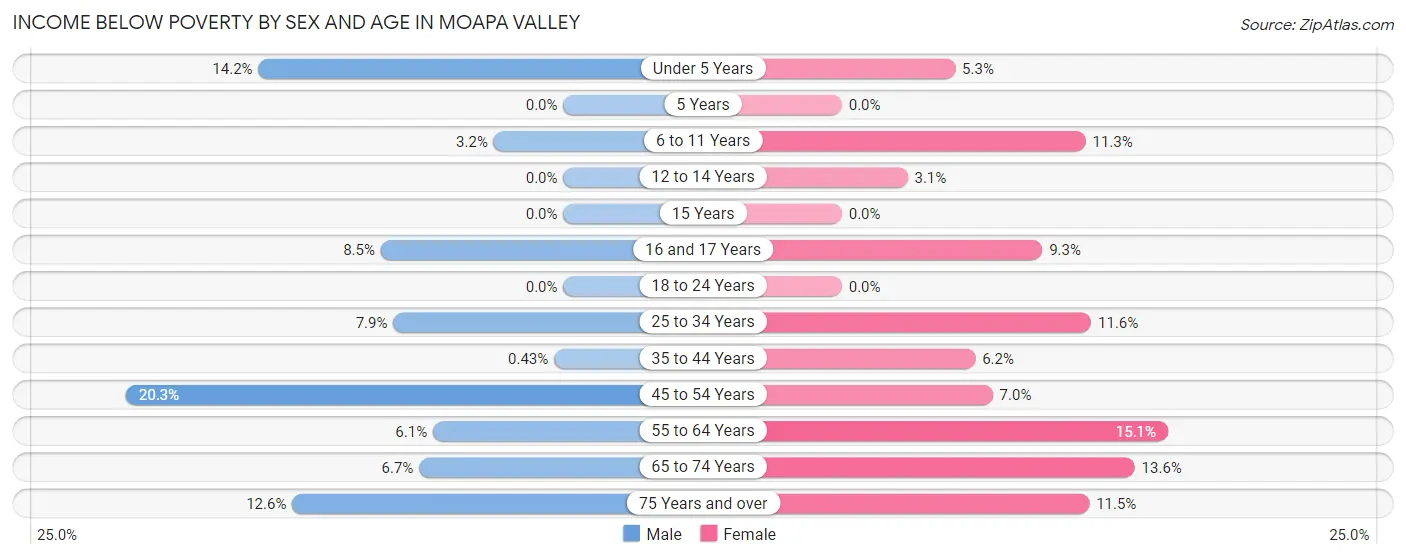
| Age Bracket | Male | Female |
| Under 5 Years | 30 (14.1%) | 12 (5.3%) |
| 5 Years | 0 (0.0%) | 0 (0.0%) |
| 6 to 11 Years | 13 (3.2%) | 45 (11.3%) |
| 12 to 14 Years | 0 (0.0%) | 10 (3.0%) |
| 15 Years | 0 (0.0%) | 0 (0.0%) |
| 16 and 17 Years | 10 (8.5%) | 8 (9.3%) |
| 18 to 24 Years | 0 (0.0%) | 0 (0.0%) |
| 25 to 34 Years | 40 (7.9%) | 53 (11.6%) |
| 35 to 44 Years | 2 (0.4%) | 21 (6.2%) |
| 45 to 54 Years | 107 (20.3%) | 34 (7.0%) |
| 55 to 64 Years | 19 (6.0%) | 46 (15.1%) |
| 65 to 74 Years | 16 (6.7%) | 53 (13.6%) |
| 75 Years and over | 20 (12.6%) | 21 (11.5%) |
| Total | 257 (7.3%) | 303 (8.3%) |
Income Above Poverty by Sex and Age in Moapa Valley
According to the poverty statistics in Moapa Valley, males aged 5 years and females aged 5 years are the age groups that are most secure financially, with 100.0% of males and 100.0% of females in these age groups living above the poverty line.
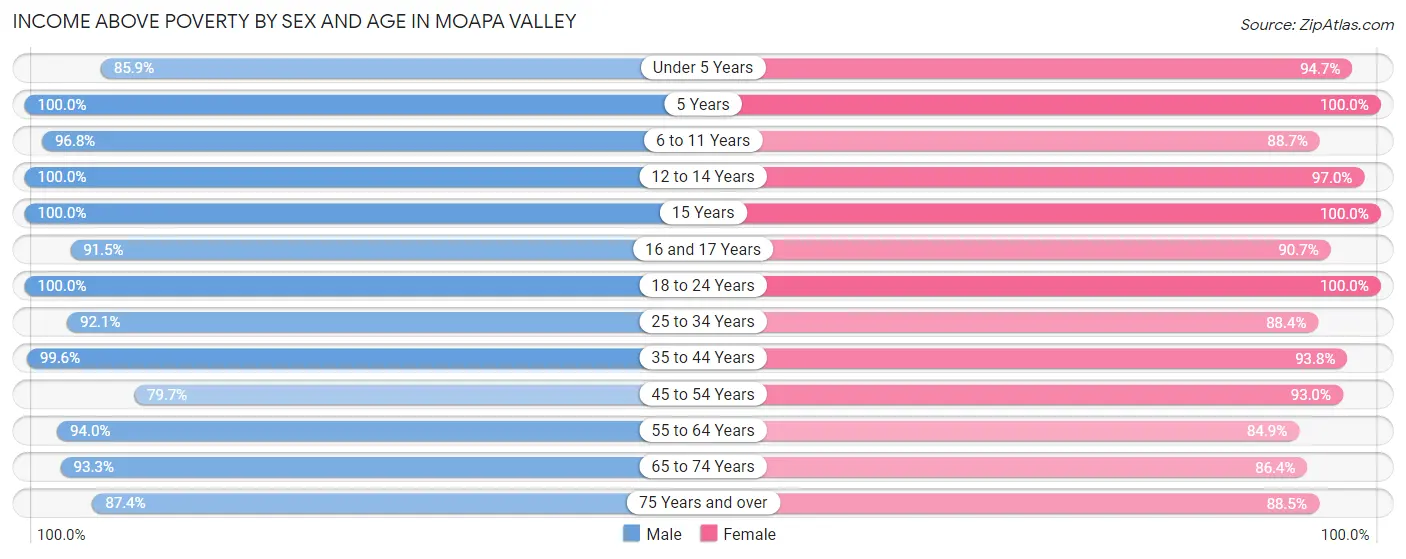
| Age Bracket | Male | Female |
| Under 5 Years | 182 (85.9%) | 216 (94.7%) |
| 5 Years | 72 (100.0%) | 59 (100.0%) |
| 6 to 11 Years | 390 (96.8%) | 353 (88.7%) |
| 12 to 14 Years | 207 (100.0%) | 318 (97.0%) |
| 15 Years | 50 (100.0%) | 117 (100.0%) |
| 16 and 17 Years | 108 (91.5%) | 78 (90.7%) |
| 18 to 24 Years | 239 (100.0%) | 255 (100.0%) |
| 25 to 34 Years | 467 (92.1%) | 405 (88.4%) |
| 35 to 44 Years | 464 (99.6%) | 318 (93.8%) |
| 45 to 54 Years | 420 (79.7%) | 452 (93.0%) |
| 55 to 64 Years | 295 (94.0%) | 258 (84.9%) |
| 65 to 74 Years | 223 (93.3%) | 337 (86.4%) |
| 75 Years and over | 139 (87.4%) | 162 (88.5%) |
| Total | 3,256 (92.7%) | 3,328 (91.7%) |
Income Below Poverty Among Married-Couple Families in Moapa Valley
The poverty statistics for married-couple families in Moapa Valley show that 3.5% or 54 of the total 1,531 families live below the poverty line. Families with 1 or 2 children have the highest poverty rate of 6.1%, comprising of 35 families. On the other hand, families with 3 or 4 children have the lowest poverty rate of 0.0%, which includes 0 families.
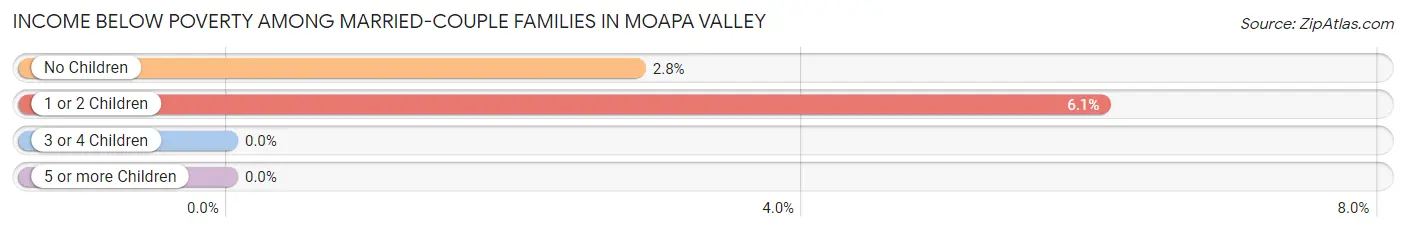
| Children | Above Poverty | Below Poverty |
| No Children | 651 (97.2%) | 19 (2.8%) |
| 1 or 2 Children | 541 (93.9%) | 35 (6.1%) |
| 3 or 4 Children | 256 (100.0%) | 0 (0.0%) |
| 5 or more Children | 29 (100.0%) | 0 (0.0%) |
| Total | 1,477 (96.5%) | 54 (3.5%) |
Income Below Poverty Among Single-Parent Households in Moapa Valley
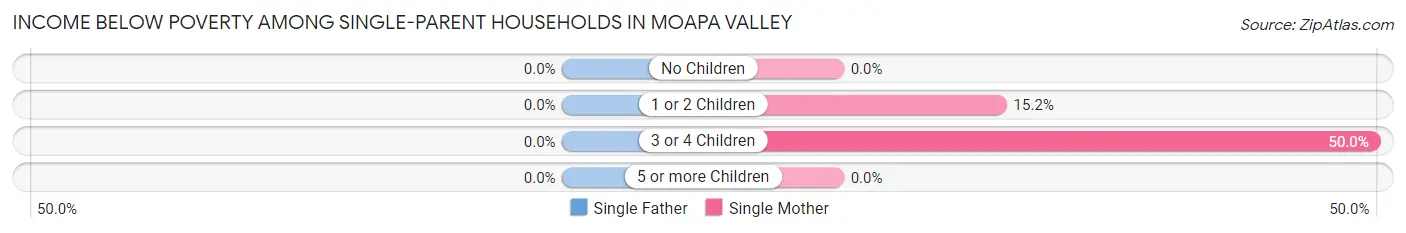
| Children | Single Father | Single Mother |
| No Children | 0 (0.0%) | 0 (0.0%) |
| 1 or 2 Children | 0 (0.0%) | 17 (15.2%) |
| 3 or 4 Children | 0 (0.0%) | 19 (50.0%) |
| 5 or more Children | 0 (0.0%) | 0 (0.0%) |
| Total | 0 (0.0%) | 36 (19.6%) |
Income Below Poverty Among Married-Couple vs Single-Parent Households in Moapa Valley
The poverty data for Moapa Valley shows that 54 of the married-couple family households (3.5%) and 36 of the single-parent households (13.1%) are living below the poverty level. Within the married-couple family households, those with 1 or 2 children have the highest poverty rate, with 35 households (6.1%) falling below the poverty line. Among the single-parent households, those with 3 or 4 children have the highest poverty rate, with 19 household (50.0%) living below poverty.
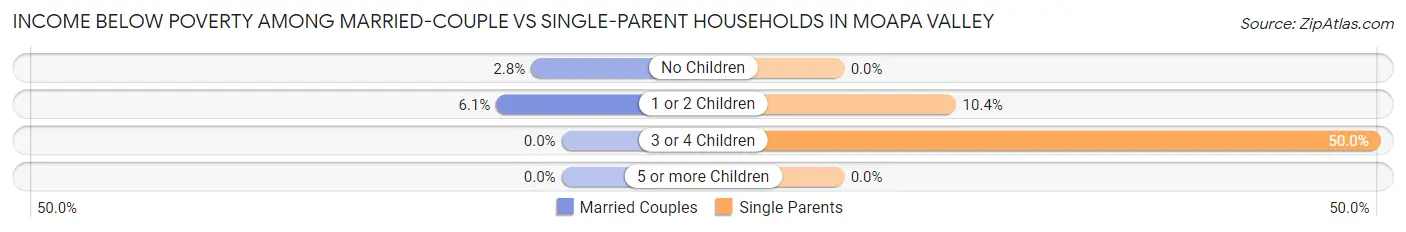
| Children | Married-Couple Families | Single-Parent Households |
| No Children | 19 (2.8%) | 0 (0.0%) |
| 1 or 2 Children | 35 (6.1%) | 17 (10.4%) |
| 3 or 4 Children | 0 (0.0%) | 19 (50.0%) |
| 5 or more Children | 0 (0.0%) | 0 (0.0%) |
| Total | 54 (3.5%) | 36 (13.1%) |
Race in Moapa Valley
The most populous races in Moapa Valley are White / Caucasian (6,410 | 89.7%), Hispanic or Latino (917 | 12.8%), and Two or more Races (419 | 5.9%).
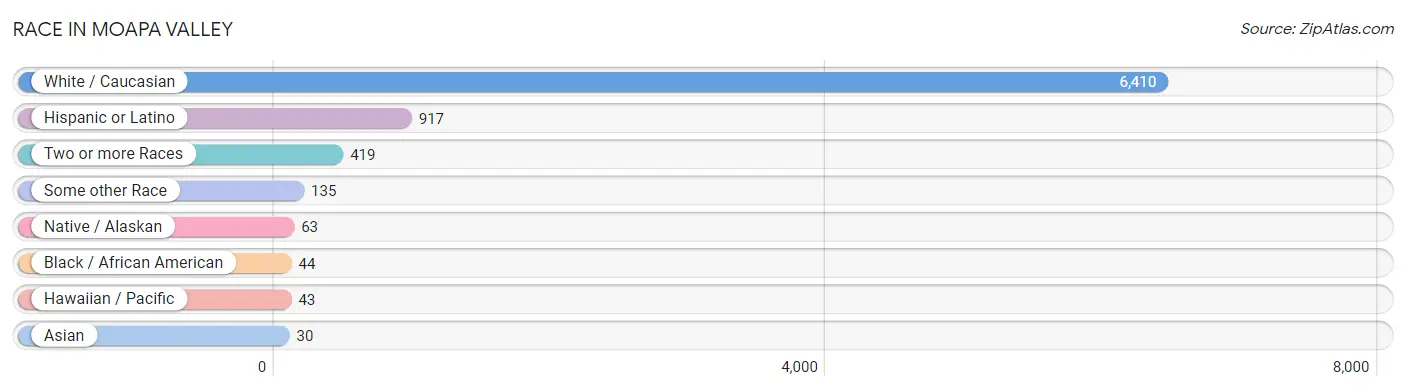
| Race | # Population | % Population |
| Asian | 30 | 0.4% |
| Black / African American | 44 | 0.6% |
| Hawaiian / Pacific | 43 | 0.6% |
| Hispanic or Latino | 917 | 12.8% |
| Native / Alaskan | 63 | 0.9% |
| White / Caucasian | 6,410 | 89.7% |
| Two or more Races | 419 | 5.9% |
| Some other Race | 135 | 1.9% |
| Total | 7,144 | 100.0% |
Ancestry in Moapa Valley
The most populous ancestries reported in Moapa Valley are English (2,188 | 30.6%), German (1,121 | 15.7%), Irish (921 | 12.9%), Scottish (863 | 12.1%), and Welsh (825 | 11.6%), together accounting for 82.8% of all Moapa Valley residents.
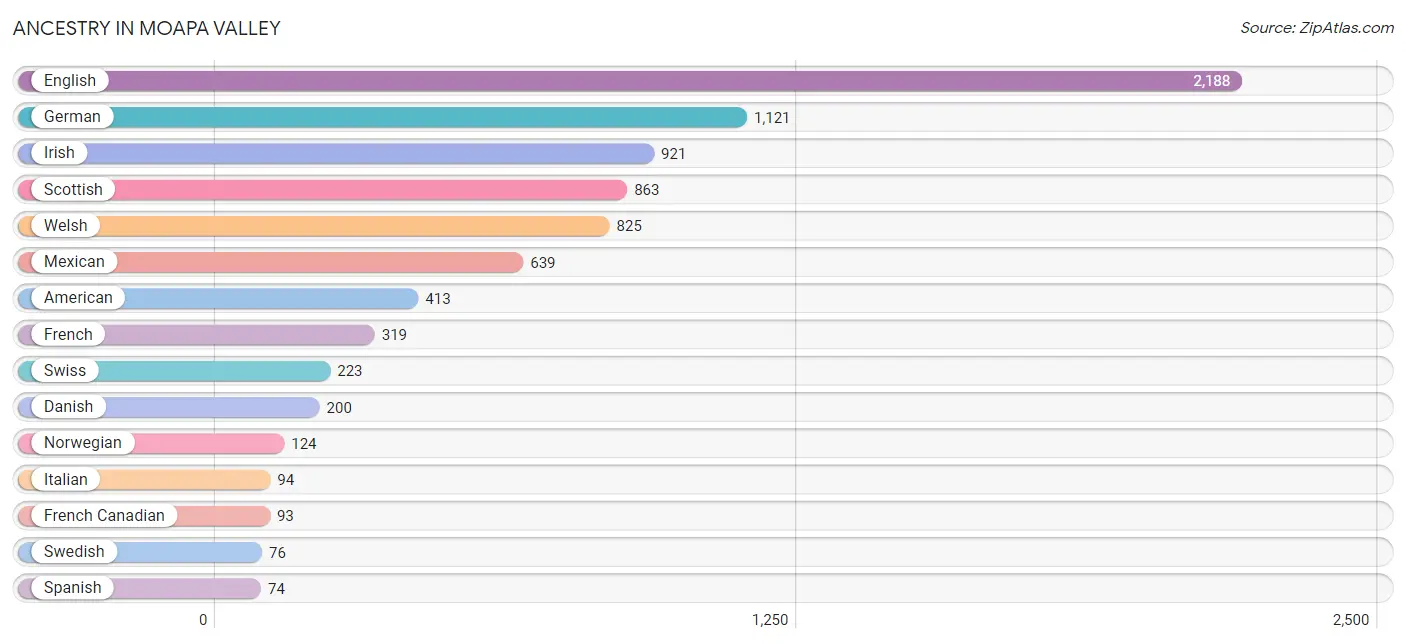
| Ancestry | # Population | % Population |
| American | 413 | 5.8% |
| Arab | 19 | 0.3% |
| Austrian | 10 | 0.1% |
| British | 18 | 0.3% |
| Canadian | 27 | 0.4% |
| Cherokee | 33 | 0.5% |
| Chippewa | 9 | 0.1% |
| Danish | 200 | 2.8% |
| Dominican | 9 | 0.1% |
| Dutch | 46 | 0.6% |
| Ecuadorian | 6 | 0.1% |
| English | 2,188 | 30.6% |
| European | 21 | 0.3% |
| French | 319 | 4.5% |
| French Canadian | 93 | 1.3% |
| German | 1,121 | 15.7% |
| Irish | 921 | 12.9% |
| Italian | 94 | 1.3% |
| Korean | 41 | 0.6% |
| Lebanese | 19 | 0.3% |
| Mexican | 639 | 8.9% |
| Native Hawaiian | 43 | 0.6% |
| Norwegian | 124 | 1.7% |
| Paiute | 23 | 0.3% |
| Pennsylvania German | 11 | 0.2% |
| Peruvian | 9 | 0.1% |
| Polish | 67 | 0.9% |
| Portuguese | 47 | 0.7% |
| Puerto Rican | 25 | 0.4% |
| Romanian | 14 | 0.2% |
| Russian | 20 | 0.3% |
| Scandinavian | 40 | 0.6% |
| Scotch-Irish | 61 | 0.9% |
| Scottish | 863 | 12.1% |
| Shoshone | 8 | 0.1% |
| Sioux | 9 | 0.1% |
| Slovak | 18 | 0.3% |
| South American | 15 | 0.2% |
| Spaniard | 62 | 0.9% |
| Spanish | 74 | 1.0% |
| Swedish | 76 | 1.1% |
| Swiss | 223 | 3.1% |
| Welsh | 825 | 11.6% |
| Yugoslavian | 26 | 0.4% | View All 44 Rows |
Immigrants in Moapa Valley
The most numerous immigrant groups reported in Moapa Valley came from Latin America (189 | 2.6%), Central America (183 | 2.6%), Mexico (183 | 2.6%), Canada (41 | 0.6%), and Asia (30 | 0.4%), together accounting for 8.8% of all Moapa Valley residents.
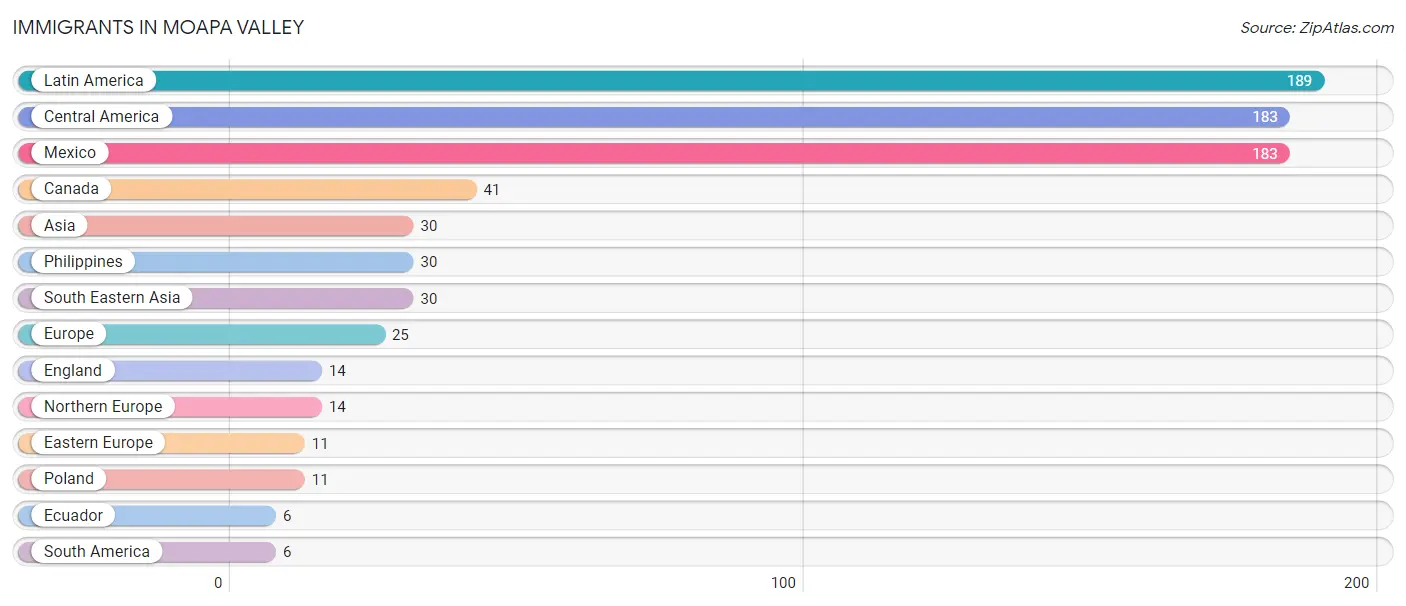
| Immigration Origin | # Population | % Population |
| Asia | 30 | 0.4% |
| Canada | 41 | 0.6% |
| Central America | 183 | 2.6% |
| Eastern Europe | 11 | 0.2% |
| Ecuador | 6 | 0.1% |
| England | 14 | 0.2% |
| Europe | 25 | 0.4% |
| Latin America | 189 | 2.6% |
| Mexico | 183 | 2.6% |
| Northern Europe | 14 | 0.2% |
| Philippines | 30 | 0.4% |
| Poland | 11 | 0.2% |
| South America | 6 | 0.1% |
| South Eastern Asia | 30 | 0.4% | View All 14 Rows |
Sex and Age in Moapa Valley
Sex and Age in Moapa Valley
The most populous age groups in Moapa Valley are 10 to 14 Years (395 | 11.2%) for men and 10 to 14 Years (500 | 13.8%) for women.
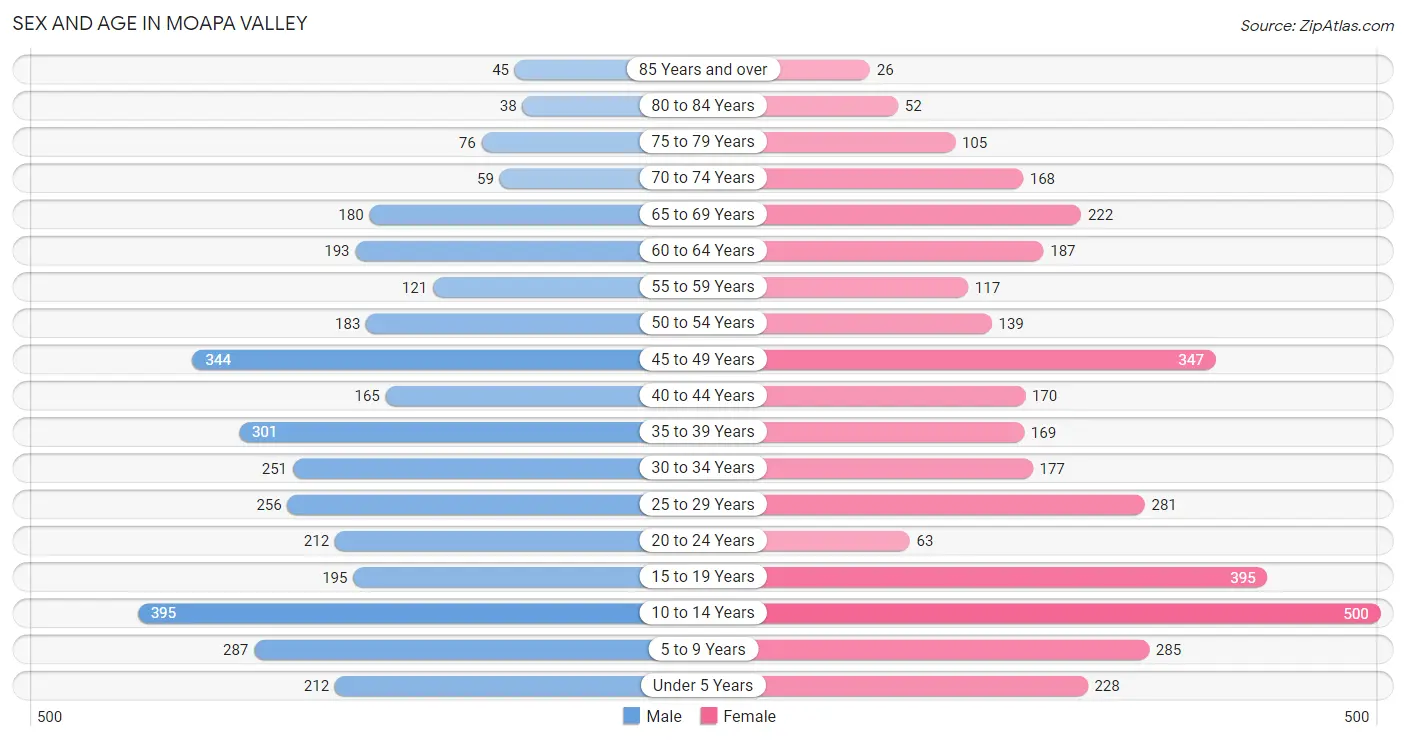
| Age Bracket | Male | Female |
| Under 5 Years | 212 (6.0%) | 228 (6.3%) |
| 5 to 9 Years | 287 (8.2%) | 285 (7.9%) |
| 10 to 14 Years | 395 (11.2%) | 500 (13.8%) |
| 15 to 19 Years | 195 (5.6%) | 395 (10.9%) |
| 20 to 24 Years | 212 (6.0%) | 63 (1.7%) |
| 25 to 29 Years | 256 (7.3%) | 281 (7.7%) |
| 30 to 34 Years | 251 (7.1%) | 177 (4.9%) |
| 35 to 39 Years | 301 (8.6%) | 169 (4.6%) |
| 40 to 44 Years | 165 (4.7%) | 170 (4.7%) |
| 45 to 49 Years | 344 (9.8%) | 347 (9.6%) |
| 50 to 54 Years | 183 (5.2%) | 139 (3.8%) |
| 55 to 59 Years | 121 (3.4%) | 117 (3.2%) |
| 60 to 64 Years | 193 (5.5%) | 187 (5.1%) |
| 65 to 69 Years | 180 (5.1%) | 222 (6.1%) |
| 70 to 74 Years | 59 (1.7%) | 168 (4.6%) |
| 75 to 79 Years | 76 (2.2%) | 105 (2.9%) |
| 80 to 84 Years | 38 (1.1%) | 52 (1.4%) |
| 85 Years and over | 45 (1.3%) | 26 (0.7%) |
| Total | 3,513 (100.0%) | 3,631 (100.0%) |
Families and Households in Moapa Valley
Median Family Size in Moapa Valley
The median family size in Moapa Valley is 3.54 persons per family, with single female/mother families (184 | 10.2%) accounting for the largest median family size of 3.65 persons per family. On the other hand, single male/father families (91 | 5.0%) represent the smallest median family size with 2.30 persons per family.
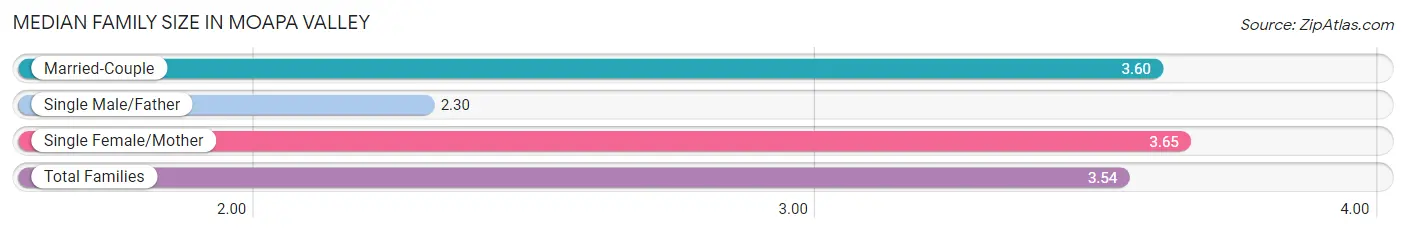
| Family Type | # Families | Family Size |
| Married-Couple | 1,531 (84.8%) | 3.60 |
| Single Male/Father | 91 (5.0%) | 2.30 |
| Single Female/Mother | 184 (10.2%) | 3.65 |
| Total Families | 1,806 (100.0%) | 3.54 |
Median Household Size in Moapa Valley
The median household size in Moapa Valley is 3.06 persons per household, with single female/mother households (184 | 7.9%) accounting for the largest median household size of 4.04 persons per household. non-family households (529 | 22.7%) represent the smallest median household size with 1.21 persons per household.
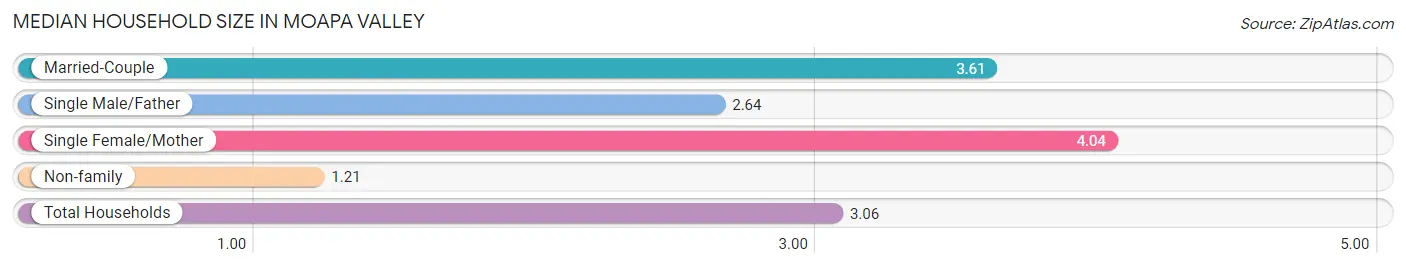
| Household Type | # Households | Household Size |
| Married-Couple | 1,531 (65.6%) | 3.61 |
| Single Male/Father | 91 (3.9%) | 2.64 |
| Single Female/Mother | 184 (7.9%) | 4.04 |
| Non-family | 529 (22.7%) | 1.21 |
| Total Households | 2,335 (100.0%) | 3.06 |
Household Size by Marriage Status in Moapa Valley
Out of a total of 2,335 households in Moapa Valley, 1,806 (77.3%) are family households, while 529 (22.7%) are nonfamily households. The most numerous type of family households are 2-person households, comprising 691, and the most common type of nonfamily households are 1-person households, comprising 445.
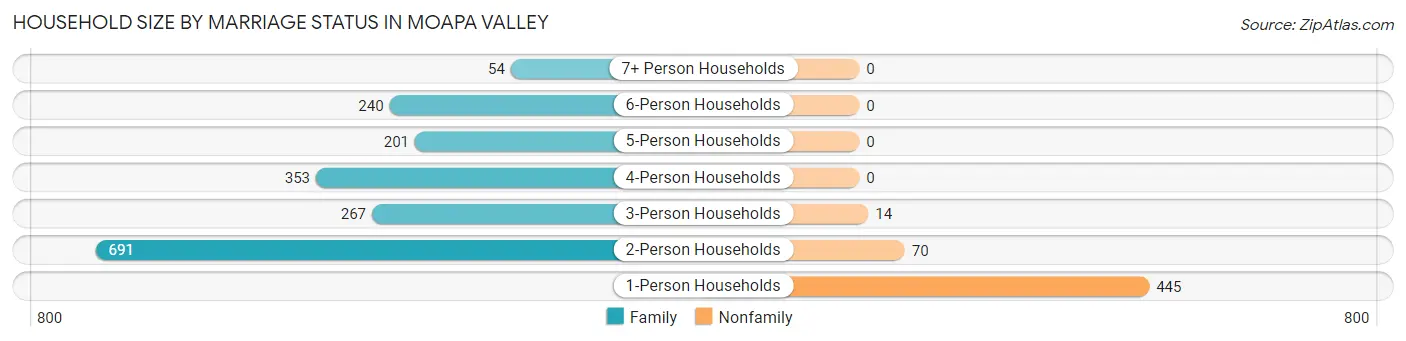
| Household Size | Family Households | Nonfamily Households |
| 1-Person Households | - | 445 (19.1%) |
| 2-Person Households | 691 (29.6%) | 70 (3.0%) |
| 3-Person Households | 267 (11.4%) | 14 (0.6%) |
| 4-Person Households | 353 (15.1%) | 0 (0.0%) |
| 5-Person Households | 201 (8.6%) | 0 (0.0%) |
| 6-Person Households | 240 (10.3%) | 0 (0.0%) |
| 7+ Person Households | 54 (2.3%) | 0 (0.0%) |
| Total | 1,806 (77.3%) | 529 (22.7%) |
Female Fertility in Moapa Valley
Fertility by Age in Moapa Valley
Average fertility rate in Moapa Valley is 26.0 births per 1,000 women. Women in the age bracket of 20 to 34 years have the highest fertility rate with 83.0 births per 1,000 women. Women in the age bracket of 20 to 34 years acount for 100.0% of all women with births.
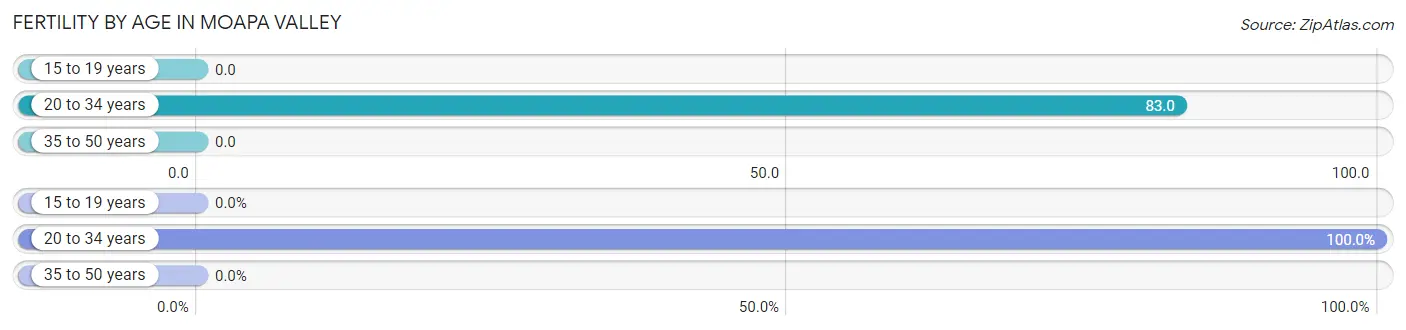
| Age Bracket | Women with Births | Births / 1,000 Women |
| 15 to 19 years | 0 (0.0%) | 0.0 |
| 20 to 34 years | 43 (100.0%) | 83.0 |
| 35 to 50 years | 0 (0.0%) | 0.0 |
| Total | 43 (100.0%) | 26.0 |
Fertility by Age by Marriage Status in Moapa Valley
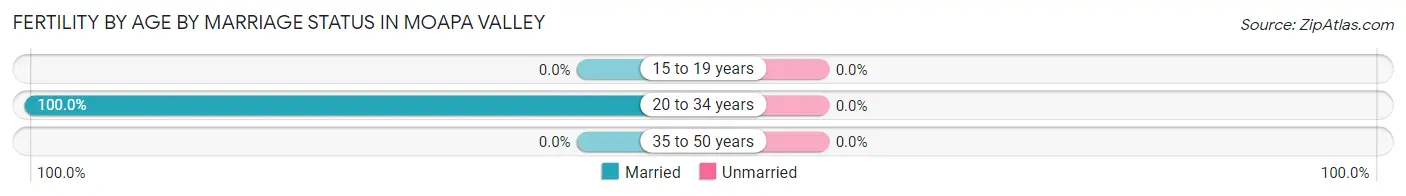
| Age Bracket | Married | Unmarried |
| 15 to 19 years | 0 (0.0%) | 0 (0.0%) |
| 20 to 34 years | 43 (100.0%) | 0 (0.0%) |
| 35 to 50 years | 0 (0.0%) | 0 (0.0%) |
| Total | 43 (100.0%) | 0 (0.0%) |
Fertility by Education in Moapa Valley
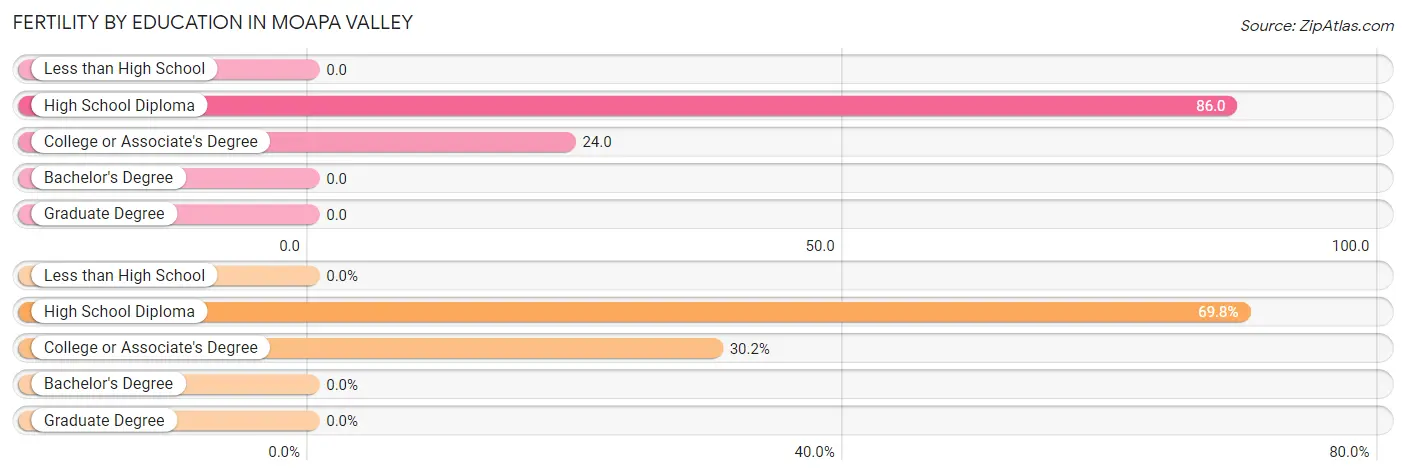
| Educational Attainment | Women with Births | Births / 1,000 Women |
| Less than High School | 0 (0.0%) | 0.0 |
| High School Diploma | 30 (69.8%) | 86.0 |
| College or Associate's Degree | 13 (30.2%) | 24.0 |
| Bachelor's Degree | 0 (0.0%) | 0.0 |
| Graduate Degree | 0 (0.0%) | 0.0 |
| Total | 43 (100.0%) | 26.0 |
Fertility by Education by Marriage Status in Moapa Valley
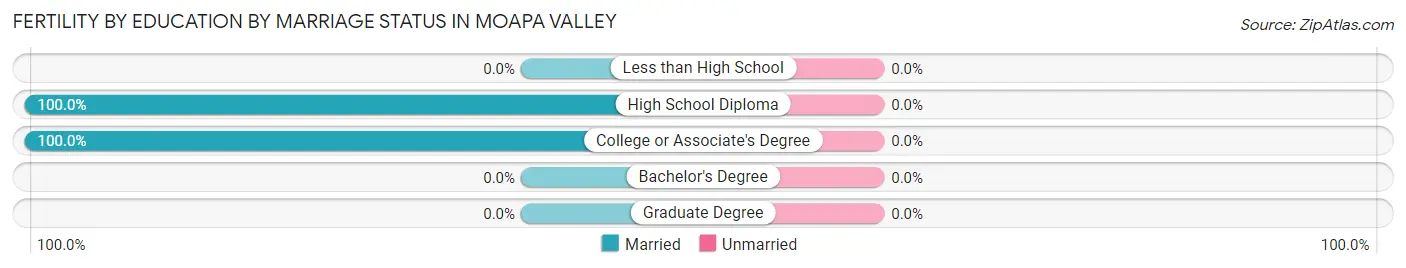
| Educational Attainment | Married | Unmarried |
| Less than High School | 0 (0.0%) | 0 (0.0%) |
| High School Diploma | 30 (100.0%) | 0 (0.0%) |
| College or Associate's Degree | 13 (100.0%) | 0 (0.0%) |
| Bachelor's Degree | 0 (0.0%) | 0 (0.0%) |
| Graduate Degree | 0 (0.0%) | 0 (0.0%) |
| Total | 43 (100.0%) | 0 (0.0%) |
Employment Characteristics in Moapa Valley
Employment by Class of Employer in Moapa Valley
Among the 2,709 employed individuals in Moapa Valley, private company employees (1,575 | 58.1%), local government employees (744 | 27.5%), and self-employed (incorporated) (117 | 4.3%) make up the most common classes of employment.
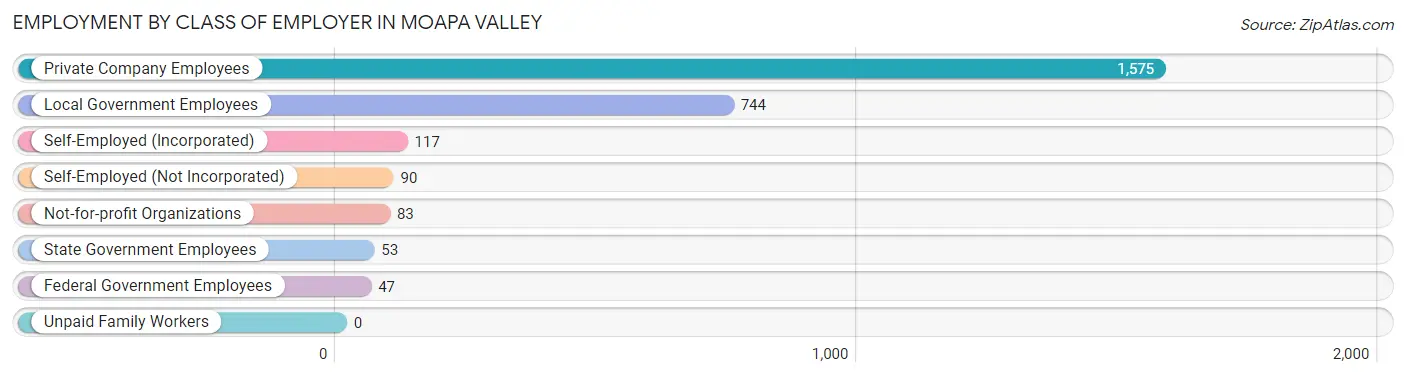
| Employer Class | # Employees | % Employees |
| Private Company Employees | 1,575 | 58.1% |
| Self-Employed (Incorporated) | 117 | 4.3% |
| Self-Employed (Not Incorporated) | 90 | 3.3% |
| Not-for-profit Organizations | 83 | 3.1% |
| Local Government Employees | 744 | 27.5% |
| State Government Employees | 53 | 2.0% |
| Federal Government Employees | 47 | 1.7% |
| Unpaid Family Workers | 0 | 0.0% |
| Total | 2,709 | 100.0% |
Employment Status by Age in Moapa Valley
According to the labor force statistics for Moapa Valley, out of the total population over 16 years of age (5,070), 61.8% or 3,133 individuals are in the labor force, with 12.1% or 379 of them unemployed. The age group with the highest labor force participation rate is 45 to 54 years, with 85.0% or 861 individuals in the labor force. Within the labor force, the 16 to 19 years age range has the highest percentage of unemployed individuals, with 54.9% or 135 of them being unemployed.
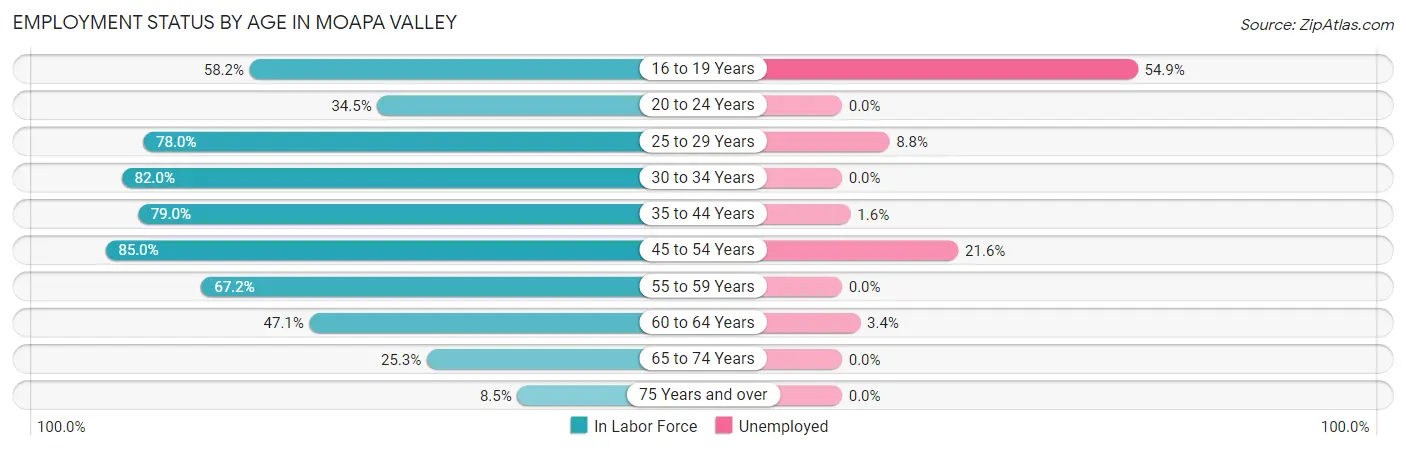
| Age Bracket | In Labor Force | Unemployed |
| 16 to 19 Years | 246 (58.2%) | 135 (54.9%) |
| 20 to 24 Years | 95 (34.5%) | 0 (0.0%) |
| 25 to 29 Years | 419 (78.0%) | 37 (8.8%) |
| 30 to 34 Years | 351 (82.0%) | 0 (0.0%) |
| 35 to 44 Years | 636 (79.0%) | 10 (1.6%) |
| 45 to 54 Years | 861 (85.0%) | 186 (21.6%) |
| 55 to 59 Years | 160 (67.2%) | 0 (0.0%) |
| 60 to 64 Years | 179 (47.1%) | 6 (3.4%) |
| 65 to 74 Years | 159 (25.3%) | 0 (0.0%) |
| 75 Years and over | 29 (8.5%) | 0 (0.0%) |
| Total | 3,133 (61.8%) | 379 (12.1%) |
Employment Status by Educational Attainment in Moapa Valley
According to labor force statistics for Moapa Valley, 76.6% of individuals (2,605) out of the total population between 25 and 64 years of age (3,401) are in the labor force, with 9.3% or 242 of them being unemployed. The group with the highest labor force participation rate are those with the educational attainment of bachelor's degree or higher, with 93.3% or 631 individuals in the labor force. Within the labor force, individuals with high school diploma education have the highest percentage of unemployment, with 16.2% or 141 of them being unemployed.
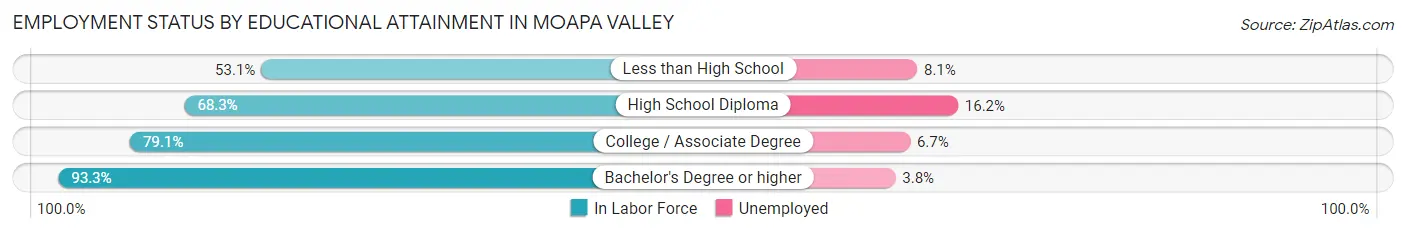
| Educational Attainment | In Labor Force | Unemployed |
| Less than High School | 86 (53.1%) | 13 (8.1%) |
| High School Diploma | 870 (68.3%) | 206 (16.2%) |
| College / Associate Degree | 1,020 (79.1%) | 86 (6.7%) |
| Bachelor's Degree or higher | 631 (93.3%) | 26 (3.8%) |
| Total | 2,605 (76.6%) | 316 (9.3%) |
Employment Occupations by Sex in Moapa Valley
Management, Business, Science and Arts Occupations
The most common Management, Business, Science and Arts occupations in Moapa Valley are Community & Social Service (556 | 20.4%), Education Instruction & Library (457 | 16.8%), Management (292 | 10.7%), Health Diagnosing & Treating (103 | 3.8%), and Computers, Engineering & Science (93 | 3.4%).
Management, Business, Science and Arts Occupations by Sex
Within the Management, Business, Science and Arts occupations in Moapa Valley, the most male-oriented occupations are Architecture & Engineering (100.0%), Computers, Engineering & Science (87.1%), and Computers & Mathematics (78.9%), while the most female-oriented occupations are Education, Arts & Media (100.0%), Health Technologists (100.0%), and Education Instruction & Library (74.8%).
| Occupation | Male | Female |
| Management | 213 (73.0%) | 79 (27.1%) |
| Business & Financial | 21 (39.6%) | 32 (60.4%) |
| Computers, Engineering & Science | 81 (87.1%) | 12 (12.9%) |
| Computers & Mathematics | 45 (78.9%) | 12 (21.0%) |
| Architecture & Engineering | 36 (100.0%) | 0 (0.0%) |
| Life, Physical & Social Science | 0 (0.0%) | 0 (0.0%) |
| Community & Social Service | 149 (26.8%) | 407 (73.2%) |
| Education, Arts & Media | 0 (0.0%) | 9 (100.0%) |
| Legal Services & Support | 0 (0.0%) | 0 (0.0%) |
| Education Instruction & Library | 115 (25.2%) | 342 (74.8%) |
| Arts, Media & Entertainment | 34 (37.8%) | 56 (62.2%) |
| Health Diagnosing & Treating | 37 (35.9%) | 66 (64.1%) |
| Health Technologists | 0 (0.0%) | 52 (100.0%) |
| Total (Category) | 501 (45.7%) | 596 (54.3%) |
| Total (Overall) | 1,515 (55.5%) | 1,213 (44.5%) |
Services Occupations
The most common Services occupations in Moapa Valley are Security & Protection (176 | 6.5%), Law Enforcement (122 | 4.5%), Food Preparation & Serving (112 | 4.1%), Healthcare Support (95 | 3.5%), and Cleaning & Maintenance (57 | 2.1%).
Services Occupations by Sex
Within the Services occupations in Moapa Valley, the most male-oriented occupations are Security & Protection (100.0%), Firefighting & Prevention (100.0%), and Law Enforcement (100.0%), while the most female-oriented occupations are Healthcare Support (100.0%), Personal Care & Service (80.0%), and Food Preparation & Serving (64.3%).
| Occupation | Male | Female |
| Healthcare Support | 0 (0.0%) | 95 (100.0%) |
| Security & Protection | 176 (100.0%) | 0 (0.0%) |
| Firefighting & Prevention | 54 (100.0%) | 0 (0.0%) |
| Law Enforcement | 122 (100.0%) | 0 (0.0%) |
| Food Preparation & Serving | 40 (35.7%) | 72 (64.3%) |
| Cleaning & Maintenance | 36 (63.2%) | 21 (36.8%) |
| Personal Care & Service | 9 (20.0%) | 36 (80.0%) |
| Total (Category) | 261 (53.8%) | 224 (46.2%) |
| Total (Overall) | 1,515 (55.5%) | 1,213 (44.5%) |
Sales and Office Occupations
The most common Sales and Office occupations in Moapa Valley are Sales & Related (258 | 9.5%), and Office & Administration (244 | 8.9%).
Sales and Office Occupations by Sex
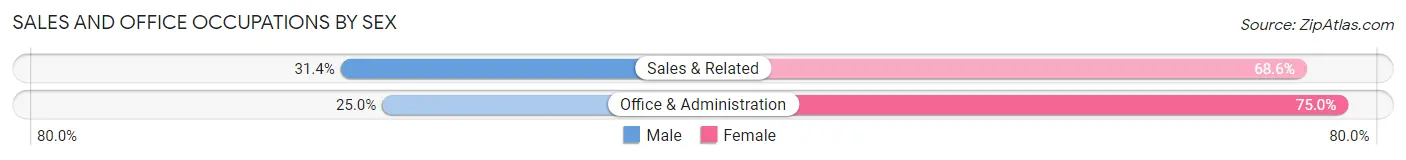
| Occupation | Male | Female |
| Sales & Related | 81 (31.4%) | 177 (68.6%) |
| Office & Administration | 61 (25.0%) | 183 (75.0%) |
| Total (Category) | 142 (28.3%) | 360 (71.7%) |
| Total (Overall) | 1,515 (55.5%) | 1,213 (44.5%) |
Natural Resources, Construction and Maintenance Occupations
The most common Natural Resources, Construction and Maintenance occupations in Moapa Valley are Construction & Extraction (201 | 7.4%), Installation, Maintenance & Repair (92 | 3.4%), and Farming, Fishing & Forestry (13 | 0.5%).
Natural Resources, Construction and Maintenance Occupations by Sex
| Occupation | Male | Female |
| Farming, Fishing & Forestry | 13 (100.0%) | 0 (0.0%) |
| Construction & Extraction | 201 (100.0%) | 0 (0.0%) |
| Installation, Maintenance & Repair | 92 (100.0%) | 0 (0.0%) |
| Total (Category) | 306 (100.0%) | 0 (0.0%) |
| Total (Overall) | 1,515 (55.5%) | 1,213 (44.5%) |
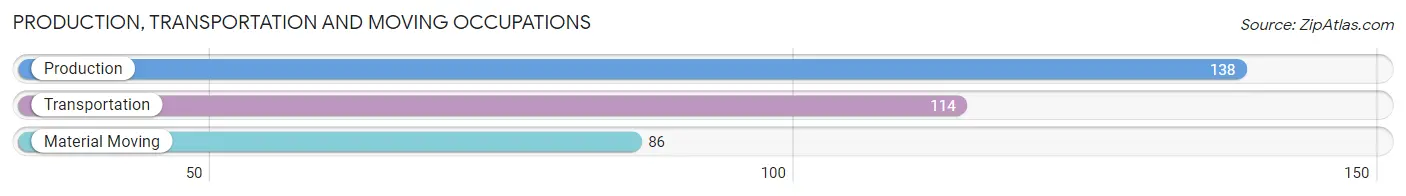
Production, Transportation and Moving Occupations
The most common Production, Transportation and Moving occupations in Moapa Valley are Production (138 | 5.1%), Transportation (114 | 4.2%), and Material Moving (86 | 3.2%).
Production, Transportation and Moving Occupations by Sex
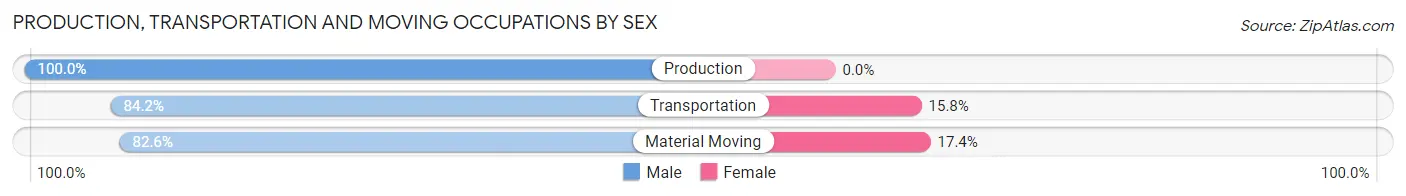
| Occupation | Male | Female |
| Production | 138 (100.0%) | 0 (0.0%) |
| Transportation | 96 (84.2%) | 18 (15.8%) |
| Material Moving | 71 (82.6%) | 15 (17.4%) |
| Total (Category) | 305 (90.2%) | 33 (9.8%) |
| Total (Overall) | 1,515 (55.5%) | 1,213 (44.5%) |
Employment Industries by Sex in Moapa Valley
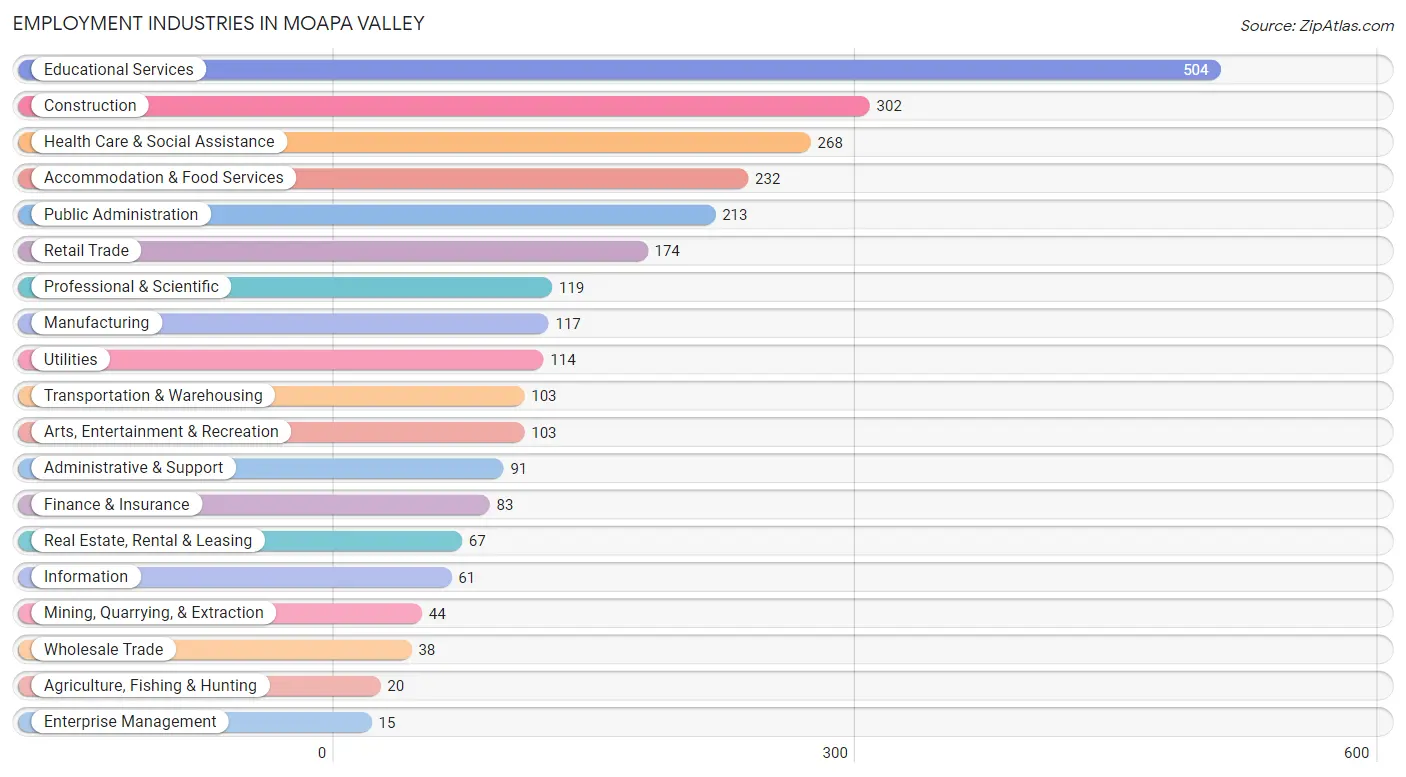
Employment Industries in Moapa Valley
The major employment industries in Moapa Valley include Educational Services (504 | 18.5%), Construction (302 | 11.1%), Health Care & Social Assistance (268 | 9.8%), Accommodation & Food Services (232 | 8.5%), and Public Administration (213 | 7.8%).
Employment Industries by Sex in Moapa Valley
The Moapa Valley industries that see more men than women are Agriculture, Fishing & Hunting (100.0%), Mining, Quarrying, & Extraction (100.0%), and Transportation & Warehousing (100.0%), whereas the industries that tend to have a higher number of women are Health Care & Social Assistance (86.2%), Educational Services (76.8%), and Information (67.2%).
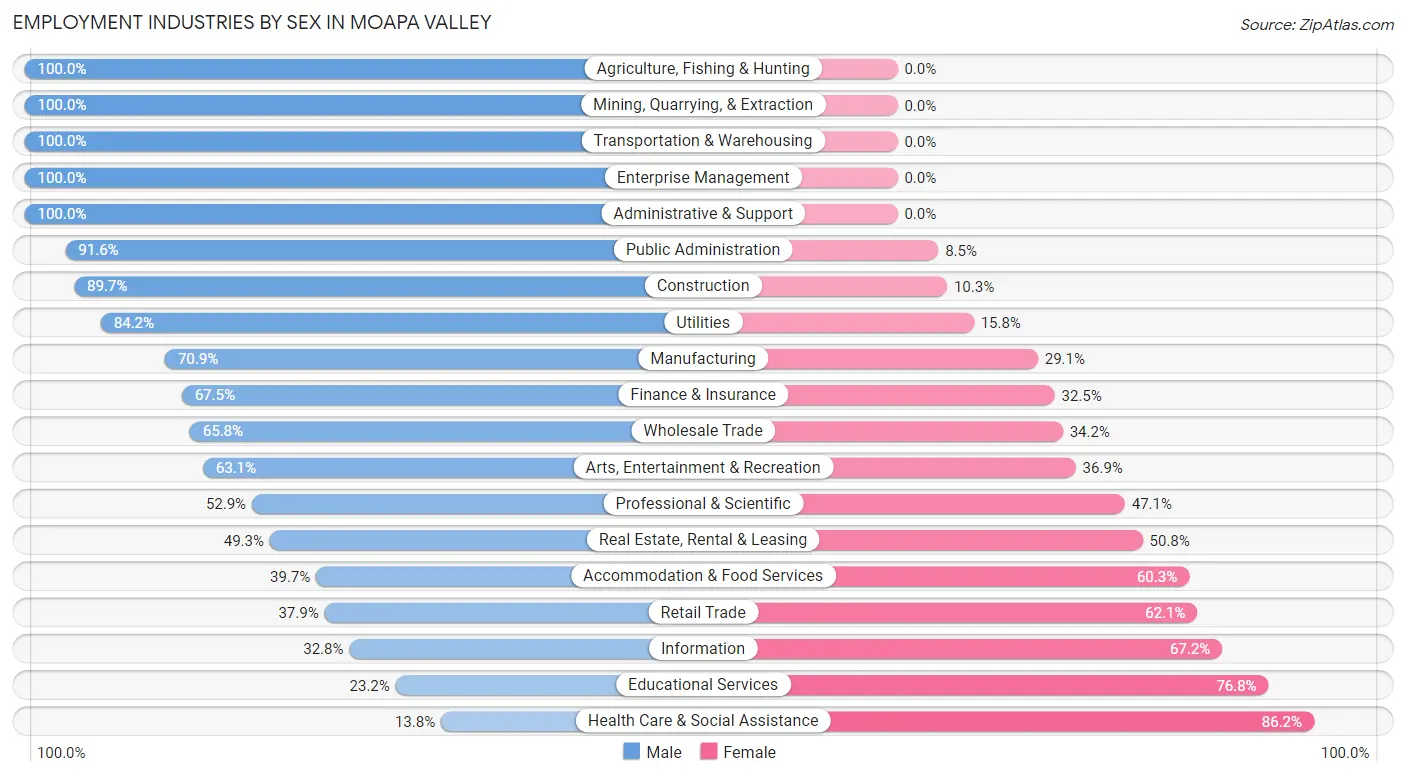
| Industry | Male | Female |
| Agriculture, Fishing & Hunting | 20 (100.0%) | 0 (0.0%) |
| Mining, Quarrying, & Extraction | 44 (100.0%) | 0 (0.0%) |
| Construction | 271 (89.7%) | 31 (10.3%) |
| Manufacturing | 83 (70.9%) | 34 (29.1%) |
| Wholesale Trade | 25 (65.8%) | 13 (34.2%) |
| Retail Trade | 66 (37.9%) | 108 (62.1%) |
| Transportation & Warehousing | 103 (100.0%) | 0 (0.0%) |
| Utilities | 96 (84.2%) | 18 (15.8%) |
| Information | 20 (32.8%) | 41 (67.2%) |
| Finance & Insurance | 56 (67.5%) | 27 (32.5%) |
| Real Estate, Rental & Leasing | 33 (49.2%) | 34 (50.7%) |
| Professional & Scientific | 63 (52.9%) | 56 (47.1%) |
| Enterprise Management | 15 (100.0%) | 0 (0.0%) |
| Administrative & Support | 91 (100.0%) | 0 (0.0%) |
| Educational Services | 117 (23.2%) | 387 (76.8%) |
| Health Care & Social Assistance | 37 (13.8%) | 231 (86.2%) |
| Arts, Entertainment & Recreation | 65 (63.1%) | 38 (36.9%) |
| Accommodation & Food Services | 92 (39.7%) | 140 (60.3%) |
| Public Administration | 195 (91.5%) | 18 (8.5%) |
| Total | 1,515 (55.5%) | 1,213 (44.5%) |
Education in Moapa Valley
School Enrollment in Moapa Valley
The most common levels of schooling among the 2,149 students in Moapa Valley are middle school (741 | 34.5%), elementary school (492 | 22.9%), and high school (487 | 22.7%).
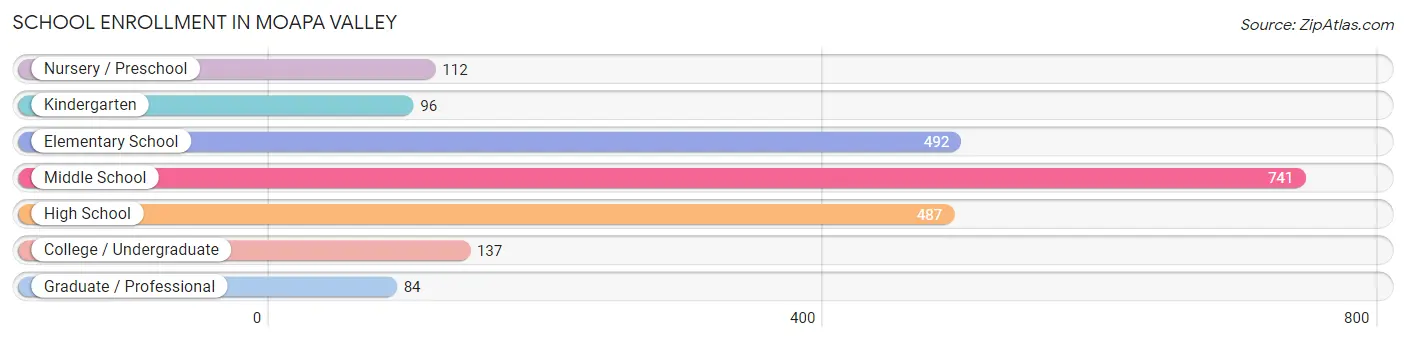
| School Level | # Students | % Students |
| Nursery / Preschool | 112 | 5.2% |
| Kindergarten | 96 | 4.5% |
| Elementary School | 492 | 22.9% |
| Middle School | 741 | 34.5% |
| High School | 487 | 22.7% |
| College / Undergraduate | 137 | 6.4% |
| Graduate / Professional | 84 | 3.9% |
| Total | 2,149 | 100.0% |
School Enrollment by Age by Funding Source in Moapa Valley
Out of a total of 2,149 students who are enrolled in schools in Moapa Valley, 275 (12.8%) attend a private institution, while the remaining 1,874 (87.2%) are enrolled in public schools. The age group of 35 years and over has the highest likelihood of being enrolled in private schools, with 41 (39.8% in the age bracket) enrolled. Conversely, the age group of 18 to 19 year olds has the lowest likelihood of being enrolled in a private school, with 57 (100.0% in the age bracket) attending a public institution.
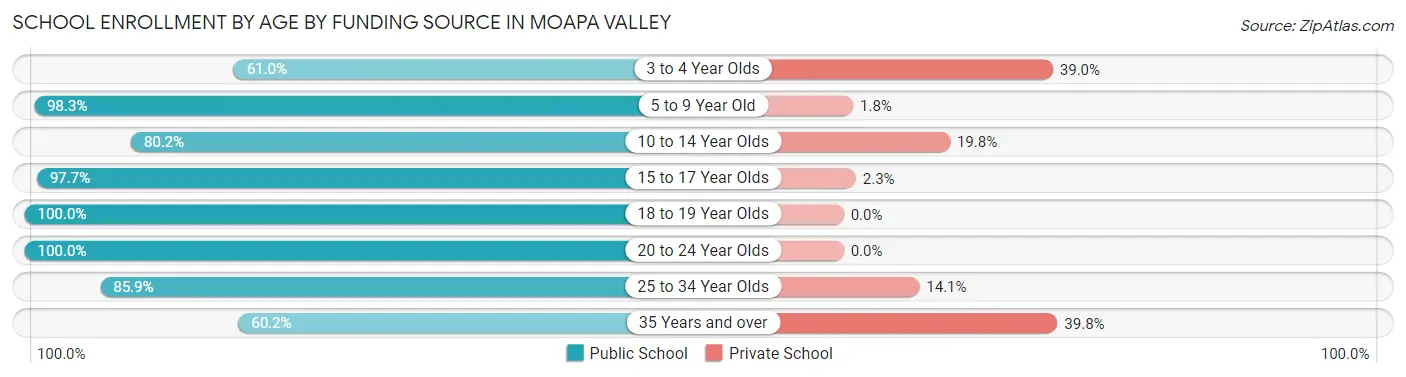
| Age Bracket | Public School | Private School |
| 3 to 4 Year Olds | 47 (61.0%) | 30 (39.0%) |
| 5 to 9 Year Old | 562 (98.3%) | 10 (1.8%) |
| 10 to 14 Year Olds | 709 (80.2%) | 175 (19.8%) |
| 15 to 17 Year Olds | 344 (97.7%) | 8 (2.3%) |
| 18 to 19 Year Olds | 57 (100.0%) | 0 (0.0%) |
| 20 to 24 Year Olds | 26 (100.0%) | 0 (0.0%) |
| 25 to 34 Year Olds | 67 (85.9%) | 11 (14.1%) |
| 35 Years and over | 62 (60.2%) | 41 (39.8%) |
| Total | 1,874 (87.2%) | 275 (12.8%) |
Educational Attainment by Field of Study in Moapa Valley
Education (190 | 22.3%), psychology (170 | 19.9%), business (135 | 15.8%), bio, nature & agricultural (101 | 11.8%), and physical & health sciences (54 | 6.3%) are the most common fields of study among 853 individuals in Moapa Valley who have obtained a bachelor's degree or higher.
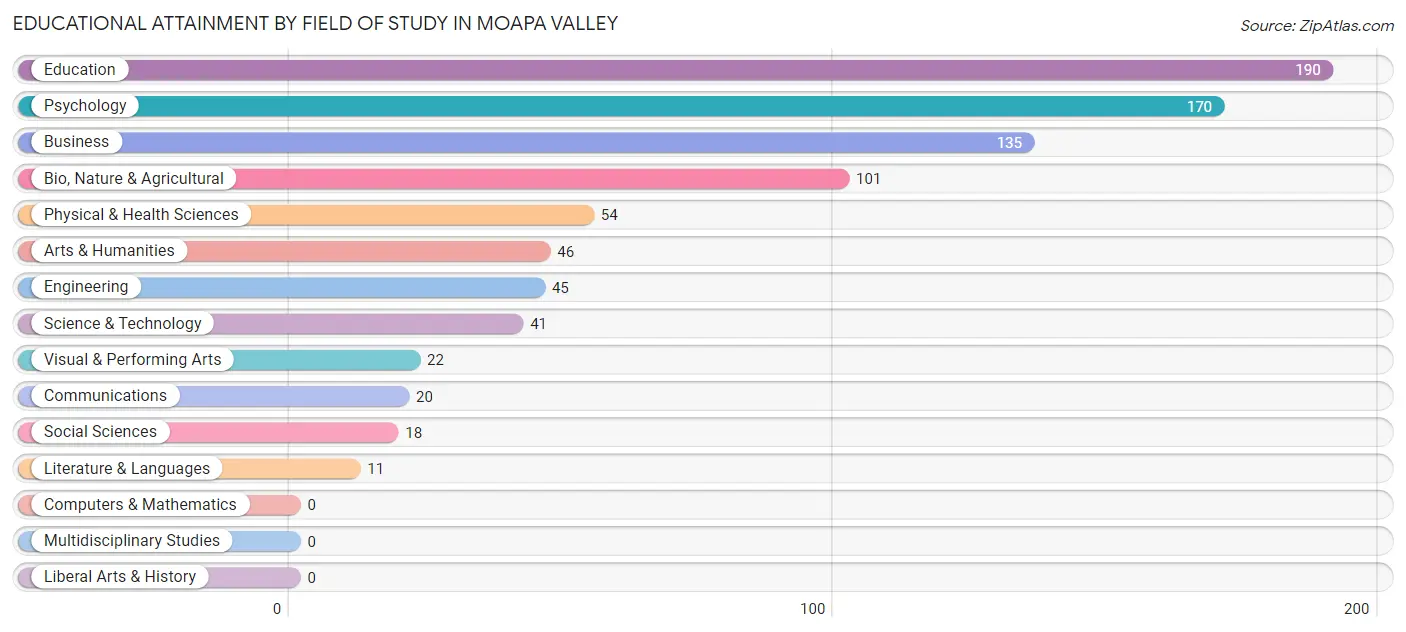
| Field of Study | # Graduates | % Graduates |
| Computers & Mathematics | 0 | 0.0% |
| Bio, Nature & Agricultural | 101 | 11.8% |
| Physical & Health Sciences | 54 | 6.3% |
| Psychology | 170 | 19.9% |
| Social Sciences | 18 | 2.1% |
| Engineering | 45 | 5.3% |
| Multidisciplinary Studies | 0 | 0.0% |
| Science & Technology | 41 | 4.8% |
| Business | 135 | 15.8% |
| Education | 190 | 22.3% |
| Literature & Languages | 11 | 1.3% |
| Liberal Arts & History | 0 | 0.0% |
| Visual & Performing Arts | 22 | 2.6% |
| Communications | 20 | 2.3% |
| Arts & Humanities | 46 | 5.4% |
| Total | 853 | 100.0% |
Transportation & Commute in Moapa Valley
Vehicle Availability by Sex in Moapa Valley
The most prevalent vehicle ownership categories in Moapa Valley are males with 3 vehicles (500, accounting for 32.9%) and females with 3 vehicles (242, making up 42.1%).
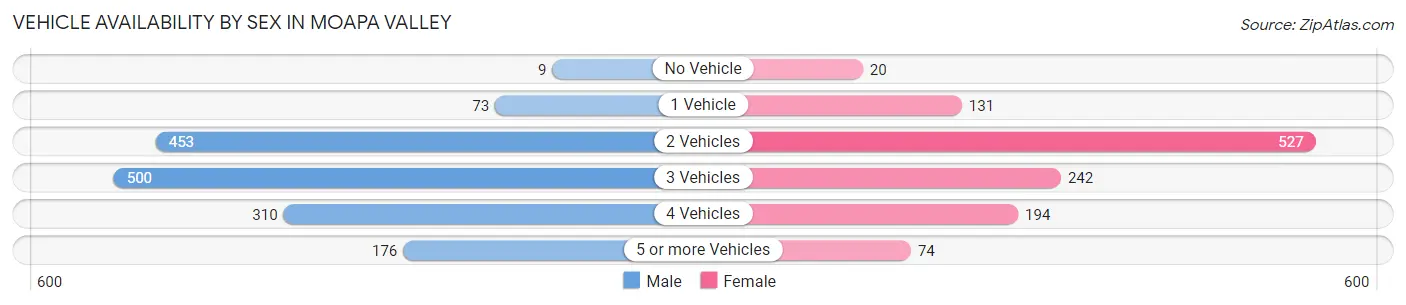
| Vehicles Available | Male | Female |
| No Vehicle | 9 (0.6%) | 20 (1.7%) |
| 1 Vehicle | 73 (4.8%) | 131 (11.0%) |
| 2 Vehicles | 453 (29.8%) | 527 (44.4%) |
| 3 Vehicles | 500 (32.9%) | 242 (20.4%) |
| 4 Vehicles | 310 (20.4%) | 194 (16.3%) |
| 5 or more Vehicles | 176 (11.6%) | 74 (6.2%) |
| Total | 1,521 (100.0%) | 1,188 (100.0%) |
Commute Time in Moapa Valley
The most frequently occuring commute durations in Moapa Valley are 60 to 89 minutes (664 commuters, 26.6%), 45 to 59 minutes (397 commuters, 15.9%), and 5 to 9 minutes (387 commuters, 15.5%).
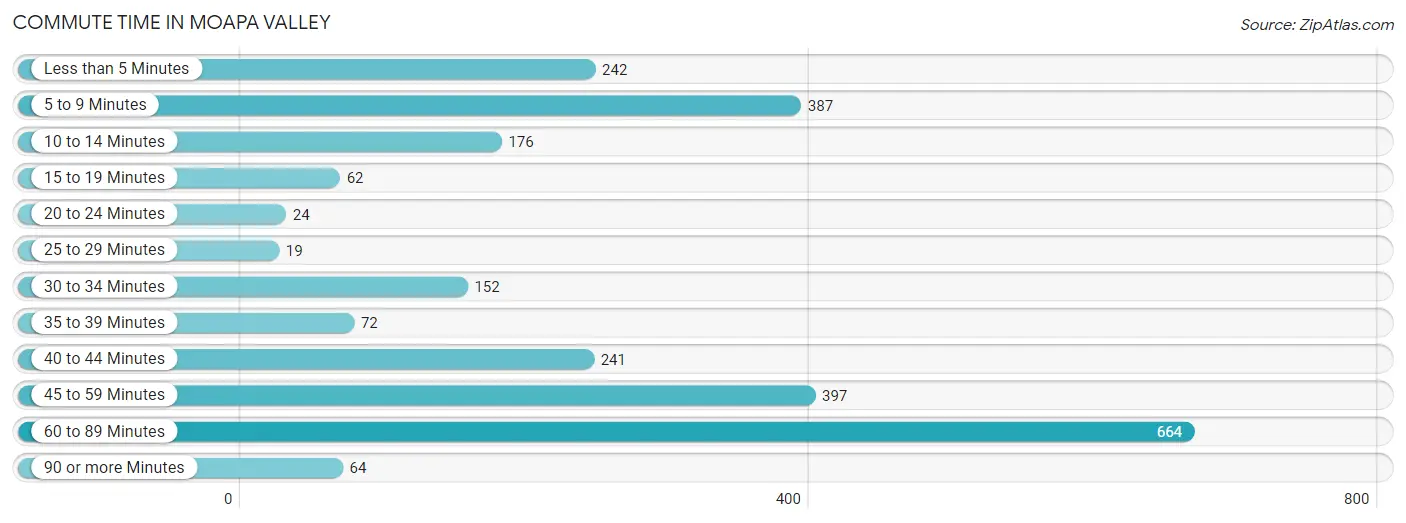
| Commute Time | # Commuters | % Commuters |
| Less than 5 Minutes | 242 | 9.7% |
| 5 to 9 Minutes | 387 | 15.5% |
| 10 to 14 Minutes | 176 | 7.0% |
| 15 to 19 Minutes | 62 | 2.5% |
| 20 to 24 Minutes | 24 | 1.0% |
| 25 to 29 Minutes | 19 | 0.8% |
| 30 to 34 Minutes | 152 | 6.1% |
| 35 to 39 Minutes | 72 | 2.9% |
| 40 to 44 Minutes | 241 | 9.6% |
| 45 to 59 Minutes | 397 | 15.9% |
| 60 to 89 Minutes | 664 | 26.6% |
| 90 or more Minutes | 64 | 2.6% |
Commute Time by Sex in Moapa Valley
The most common commute times in Moapa Valley are 60 to 89 minutes (520 commuters, 38.1%) for males and 5 to 9 minutes (263 commuters, 23.2%) for females.
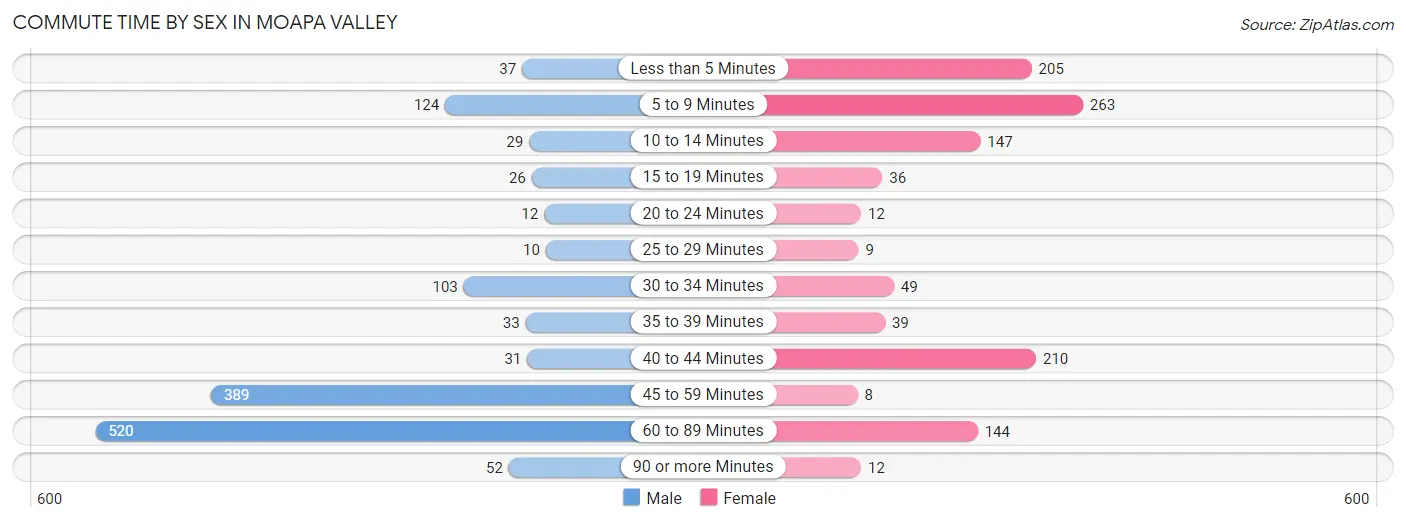
| Commute Time | Male | Female |
| Less than 5 Minutes | 37 (2.7%) | 205 (18.1%) |
| 5 to 9 Minutes | 124 (9.1%) | 263 (23.2%) |
| 10 to 14 Minutes | 29 (2.1%) | 147 (13.0%) |
| 15 to 19 Minutes | 26 (1.9%) | 36 (3.2%) |
| 20 to 24 Minutes | 12 (0.9%) | 12 (1.1%) |
| 25 to 29 Minutes | 10 (0.7%) | 9 (0.8%) |
| 30 to 34 Minutes | 103 (7.5%) | 49 (4.3%) |
| 35 to 39 Minutes | 33 (2.4%) | 39 (3.4%) |
| 40 to 44 Minutes | 31 (2.3%) | 210 (18.5%) |
| 45 to 59 Minutes | 389 (28.5%) | 8 (0.7%) |
| 60 to 89 Minutes | 520 (38.1%) | 144 (12.7%) |
| 90 or more Minutes | 52 (3.8%) | 12 (1.1%) |
Time of Departure to Work by Sex in Moapa Valley
The most frequent times of departure to work in Moapa Valley are 12:00 AM to 4:59 AM (414, 30.3%) for males and 6:30 AM to 6:59 AM (215, 19.0%) for females.
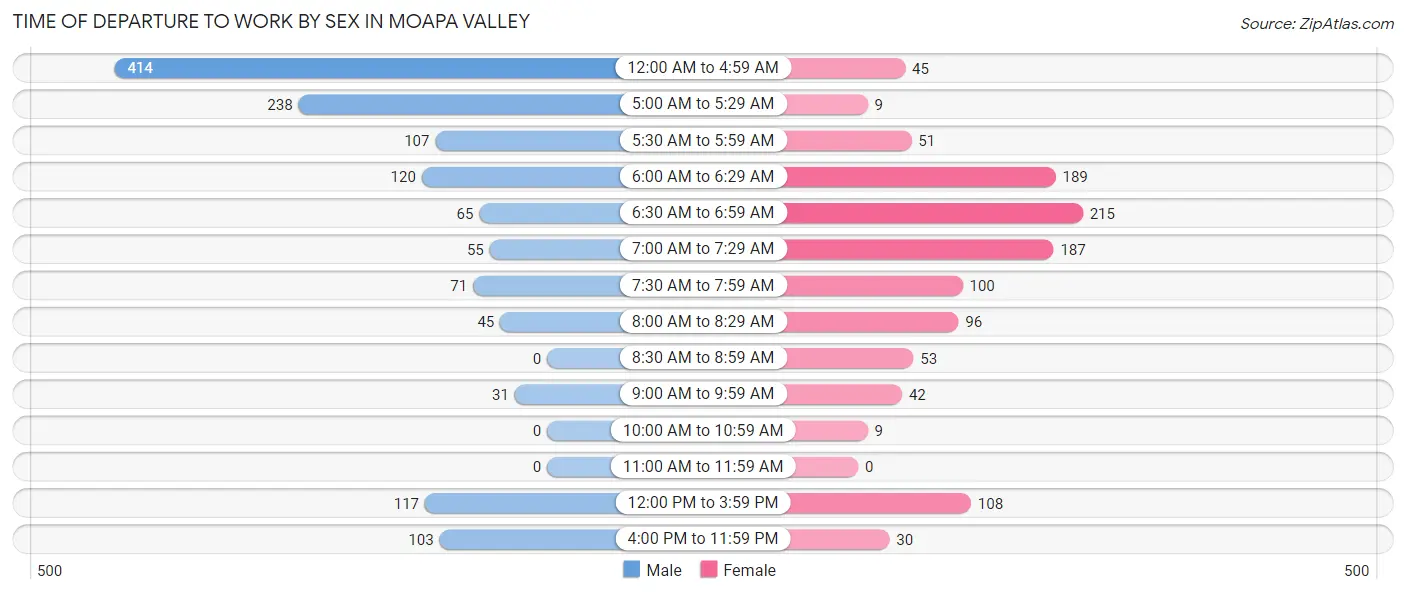
| Time of Departure | Male | Female |
| 12:00 AM to 4:59 AM | 414 (30.3%) | 45 (4.0%) |
| 5:00 AM to 5:29 AM | 238 (17.4%) | 9 (0.8%) |
| 5:30 AM to 5:59 AM | 107 (7.8%) | 51 (4.5%) |
| 6:00 AM to 6:29 AM | 120 (8.8%) | 189 (16.7%) |
| 6:30 AM to 6:59 AM | 65 (4.8%) | 215 (19.0%) |
| 7:00 AM to 7:29 AM | 55 (4.0%) | 187 (16.5%) |
| 7:30 AM to 7:59 AM | 71 (5.2%) | 100 (8.8%) |
| 8:00 AM to 8:29 AM | 45 (3.3%) | 96 (8.5%) |
| 8:30 AM to 8:59 AM | 0 (0.0%) | 53 (4.7%) |
| 9:00 AM to 9:59 AM | 31 (2.3%) | 42 (3.7%) |
| 10:00 AM to 10:59 AM | 0 (0.0%) | 9 (0.8%) |
| 11:00 AM to 11:59 AM | 0 (0.0%) | 0 (0.0%) |
| 12:00 PM to 3:59 PM | 117 (8.6%) | 108 (9.5%) |
| 4:00 PM to 11:59 PM | 103 (7.5%) | 30 (2.6%) |
| Total | 1,366 (100.0%) | 1,134 (100.0%) |
Housing Occupancy in Moapa Valley
Occupancy by Ownership in Moapa Valley
Of the total 2,335 dwellings in Moapa Valley, owner-occupied units account for 1,841 (78.8%), while renter-occupied units make up 494 (21.2%).

| Occupancy | # Housing Units | % Housing Units |
| Owner Occupied Housing Units | 1,841 | 78.8% |
| Renter-Occupied Housing Units | 494 | 21.2% |
| Total Occupied Housing Units | 2,335 | 100.0% |
Occupancy by Household Size in Moapa Valley
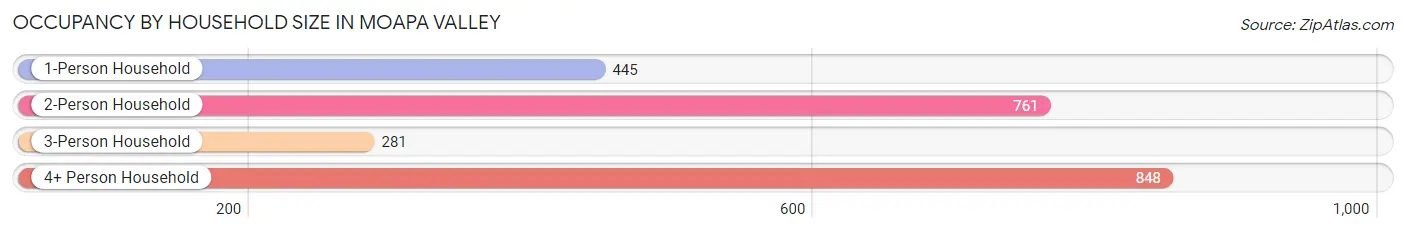
| Household Size | # Housing Units | % Housing Units |
| 1-Person Household | 445 | 19.1% |
| 2-Person Household | 761 | 32.6% |
| 3-Person Household | 281 | 12.0% |
| 4+ Person Household | 848 | 36.3% |
| Total Housing Units | 2,335 | 100.0% |
Occupancy by Ownership by Household Size in Moapa Valley
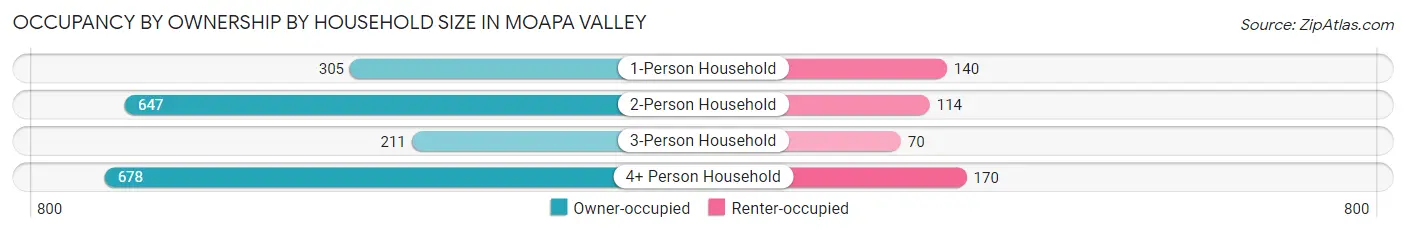
| Household Size | Owner-occupied | Renter-occupied |
| 1-Person Household | 305 (68.5%) | 140 (31.5%) |
| 2-Person Household | 647 (85.0%) | 114 (15.0%) |
| 3-Person Household | 211 (75.1%) | 70 (24.9%) |
| 4+ Person Household | 678 (79.9%) | 170 (20.1%) |
| Total Housing Units | 1,841 (78.8%) | 494 (21.2%) |
Occupancy by Educational Attainment in Moapa Valley
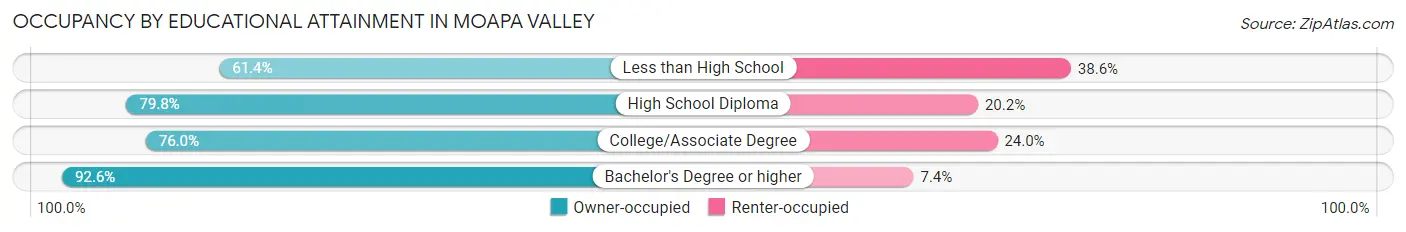
| Household Size | Owner-occupied | Renter-occupied |
| Less than High School | 97 (61.4%) | 61 (38.6%) |
| High School Diploma | 664 (79.8%) | 168 (20.2%) |
| College/Associate Degree | 755 (76.0%) | 239 (24.0%) |
| Bachelor's Degree or higher | 325 (92.6%) | 26 (7.4%) |
Occupancy by Age of Householder in Moapa Valley
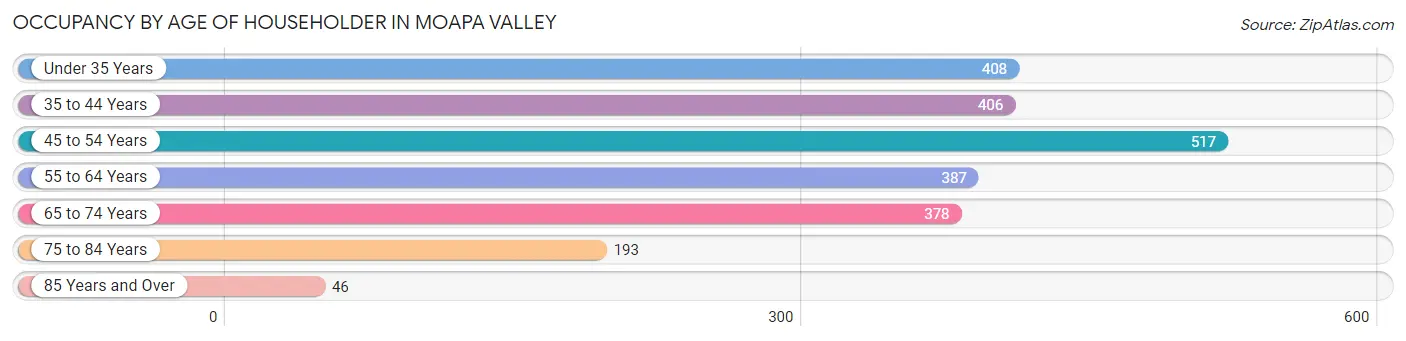
| Age Bracket | # Households | % Households |
| Under 35 Years | 408 | 17.5% |
| 35 to 44 Years | 406 | 17.4% |
| 45 to 54 Years | 517 | 22.1% |
| 55 to 64 Years | 387 | 16.6% |
| 65 to 74 Years | 378 | 16.2% |
| 75 to 84 Years | 193 | 8.3% |
| 85 Years and Over | 46 | 2.0% |
| Total | 2,335 | 100.0% |
Housing Finances in Moapa Valley
Median Income by Occupancy in Moapa Valley
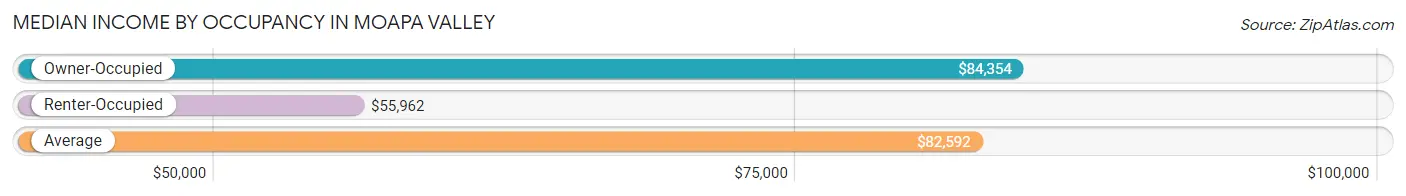
| Occupancy Type | # Households | Median Income |
| Owner-Occupied | 1,841 (78.8%) | $84,354 |
| Renter-Occupied | 494 (21.2%) | $55,962 |
| Average | 2,335 (100.0%) | $82,592 |
Occupancy by Householder Income Bracket in Moapa Valley
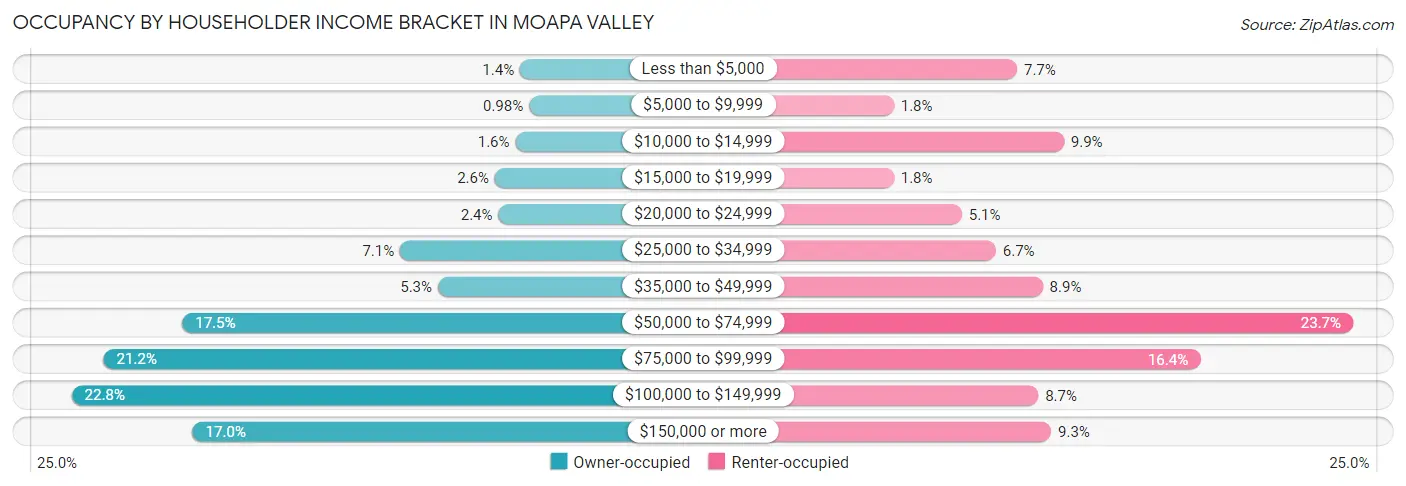
| Income Bracket | Owner-occupied | Renter-occupied |
| Less than $5,000 | 26 (1.4%) | 38 (7.7%) |
| $5,000 to $9,999 | 18 (1.0%) | 9 (1.8%) |
| $10,000 to $14,999 | 30 (1.6%) | 49 (9.9%) |
| $15,000 to $19,999 | 48 (2.6%) | 9 (1.8%) |
| $20,000 to $24,999 | 45 (2.4%) | 25 (5.1%) |
| $25,000 to $34,999 | 131 (7.1%) | 33 (6.7%) |
| $35,000 to $49,999 | 98 (5.3%) | 44 (8.9%) |
| $50,000 to $74,999 | 322 (17.5%) | 117 (23.7%) |
| $75,000 to $99,999 | 391 (21.2%) | 81 (16.4%) |
| $100,000 to $149,999 | 419 (22.8%) | 43 (8.7%) |
| $150,000 or more | 313 (17.0%) | 46 (9.3%) |
| Total | 1,841 (100.0%) | 494 (100.0%) |
Monthly Housing Cost Tiers in Moapa Valley
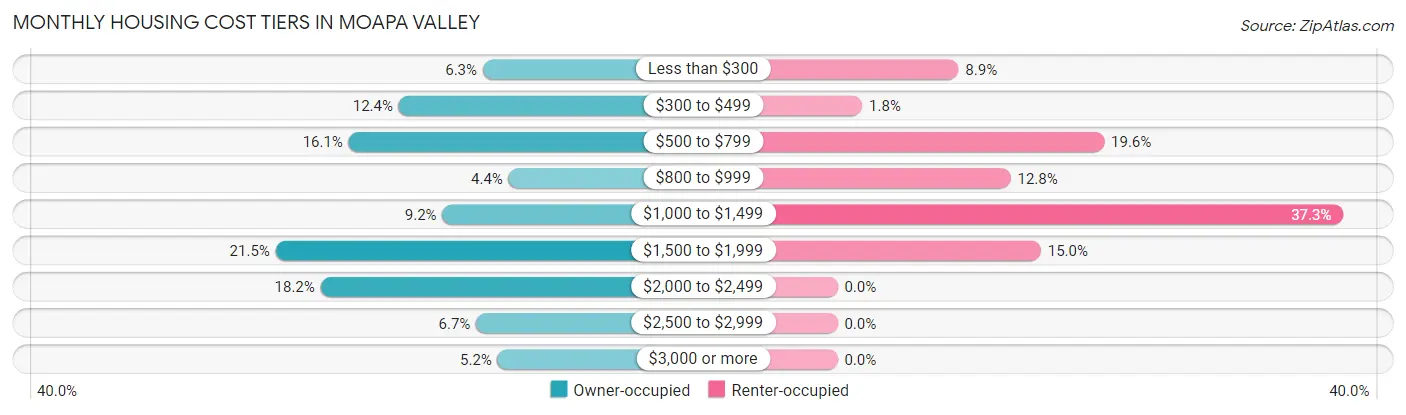
| Monthly Cost | Owner-occupied | Renter-occupied |
| Less than $300 | 115 (6.2%) | 44 (8.9%) |
| $300 to $499 | 229 (12.4%) | 9 (1.8%) |
| $500 to $799 | 297 (16.1%) | 97 (19.6%) |
| $800 to $999 | 80 (4.3%) | 63 (12.8%) |
| $1,000 to $1,499 | 170 (9.2%) | 184 (37.2%) |
| $1,500 to $1,999 | 396 (21.5%) | 74 (15.0%) |
| $2,000 to $2,499 | 335 (18.2%) | 0 (0.0%) |
| $2,500 to $2,999 | 124 (6.7%) | 0 (0.0%) |
| $3,000 or more | 95 (5.2%) | 0 (0.0%) |
| Total | 1,841 (100.0%) | 494 (100.0%) |
Physical Housing Characteristics in Moapa Valley
Housing Structures in Moapa Valley
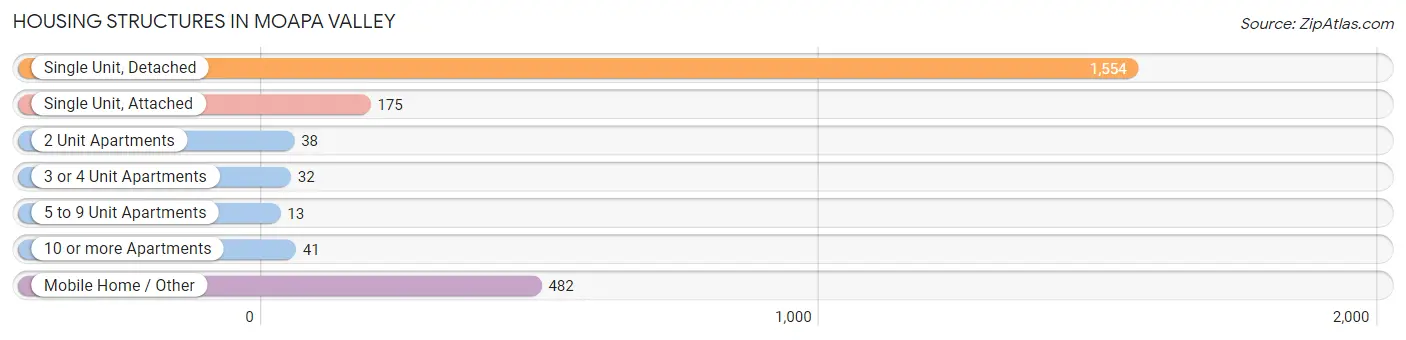
| Structure Type | # Housing Units | % Housing Units |
| Single Unit, Detached | 1,554 | 66.5% |
| Single Unit, Attached | 175 | 7.5% |
| 2 Unit Apartments | 38 | 1.6% |
| 3 or 4 Unit Apartments | 32 | 1.4% |
| 5 to 9 Unit Apartments | 13 | 0.6% |
| 10 or more Apartments | 41 | 1.8% |
| Mobile Home / Other | 482 | 20.6% |
| Total | 2,335 | 100.0% |
Housing Structures by Occupancy in Moapa Valley
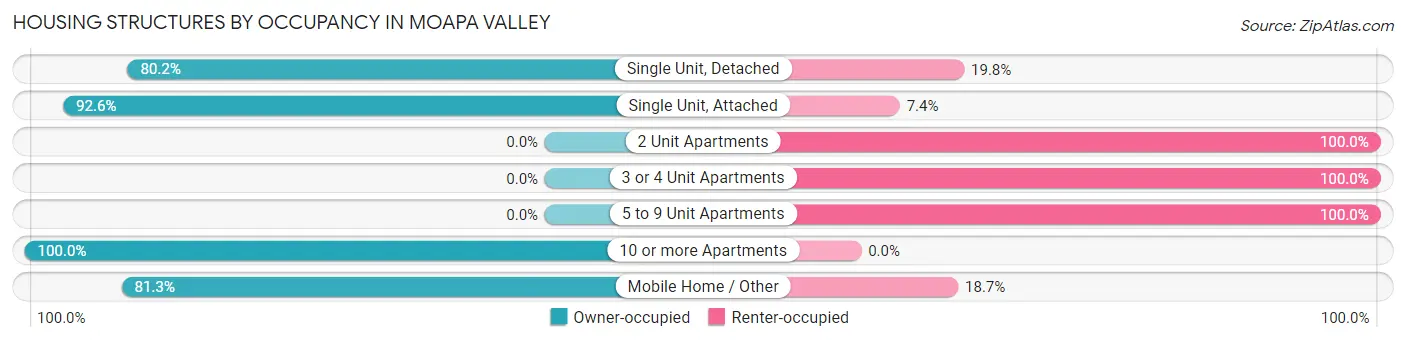
| Structure Type | Owner-occupied | Renter-occupied |
| Single Unit, Detached | 1,246 (80.2%) | 308 (19.8%) |
| Single Unit, Attached | 162 (92.6%) | 13 (7.4%) |
| 2 Unit Apartments | 0 (0.0%) | 38 (100.0%) |
| 3 or 4 Unit Apartments | 0 (0.0%) | 32 (100.0%) |
| 5 to 9 Unit Apartments | 0 (0.0%) | 13 (100.0%) |
| 10 or more Apartments | 41 (100.0%) | 0 (0.0%) |
| Mobile Home / Other | 392 (81.3%) | 90 (18.7%) |
| Total | 1,841 (78.8%) | 494 (21.2%) |
Housing Structures by Number of Rooms in Moapa Valley
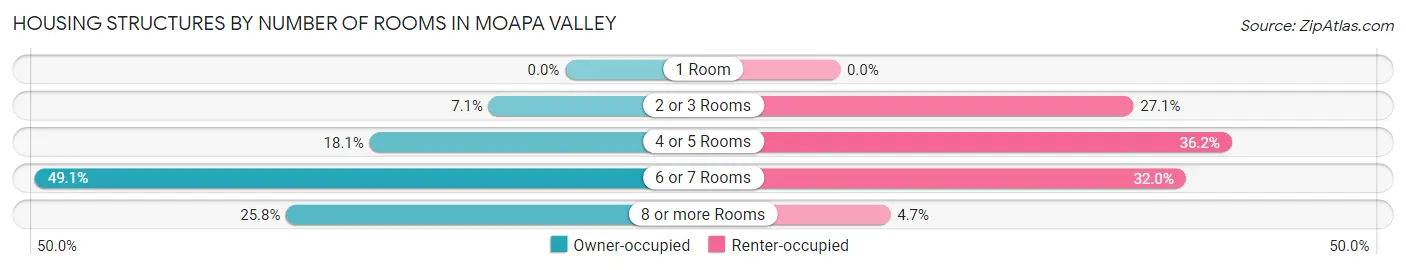
| Number of Rooms | Owner-occupied | Renter-occupied |
| 1 Room | 0 (0.0%) | 0 (0.0%) |
| 2 or 3 Rooms | 130 (7.1%) | 134 (27.1%) |
| 4 or 5 Rooms | 333 (18.1%) | 179 (36.2%) |
| 6 or 7 Rooms | 903 (49.0%) | 158 (32.0%) |
| 8 or more Rooms | 475 (25.8%) | 23 (4.7%) |
| Total | 1,841 (100.0%) | 494 (100.0%) |
Housing Structure by Heating Type in Moapa Valley
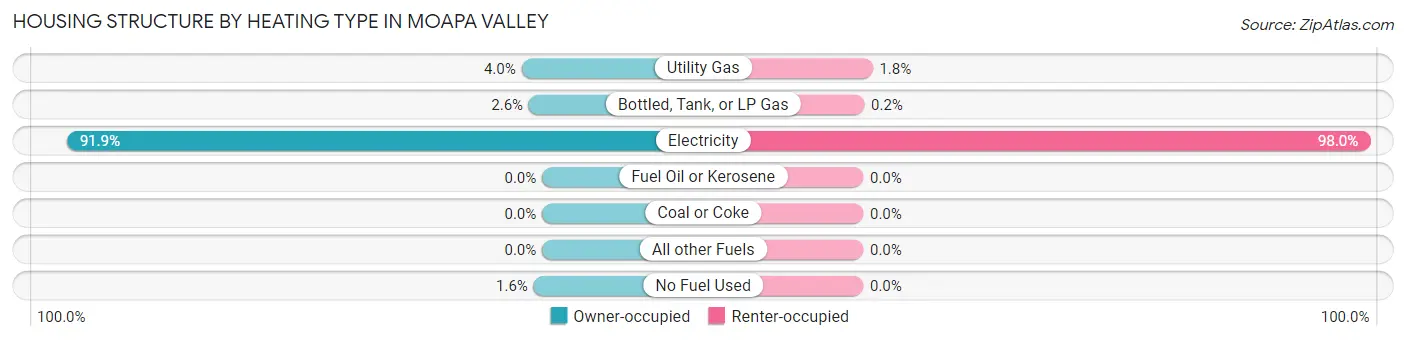
| Heating Type | Owner-occupied | Renter-occupied |
| Utility Gas | 73 (4.0%) | 9 (1.8%) |
| Bottled, Tank, or LP Gas | 47 (2.5%) | 1 (0.2%) |
| Electricity | 1,691 (91.8%) | 484 (98.0%) |
| Fuel Oil or Kerosene | 0 (0.0%) | 0 (0.0%) |
| Coal or Coke | 0 (0.0%) | 0 (0.0%) |
| All other Fuels | 0 (0.0%) | 0 (0.0%) |
| No Fuel Used | 30 (1.6%) | 0 (0.0%) |
| Total | 1,841 (100.0%) | 494 (100.0%) |
Household Vehicle Usage in Moapa Valley
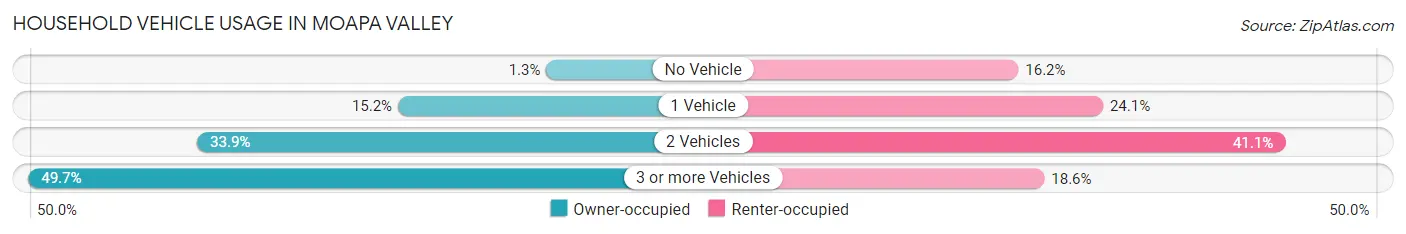
| Vehicles per Household | Owner-occupied | Renter-occupied |
| No Vehicle | 24 (1.3%) | 80 (16.2%) |
| 1 Vehicle | 279 (15.1%) | 119 (24.1%) |
| 2 Vehicles | 624 (33.9%) | 203 (41.1%) |
| 3 or more Vehicles | 914 (49.6%) | 92 (18.6%) |
| Total | 1,841 (100.0%) | 494 (100.0%) |
Real Estate & Mortgages in Moapa Valley
Real Estate and Mortgage Overview in Moapa Valley
| Characteristic | Without Mortgage | With Mortgage |
| Housing Units | 591 | 1,250 |
| Median Property Value | $143,100 | $342,200 |
| Median Household Income | $61,875 | $277 |
| Monthly Housing Costs | $470 | $95 |
| Real Estate Taxes | $1,038 | $24 |
Property Value by Mortgage Status in Moapa Valley
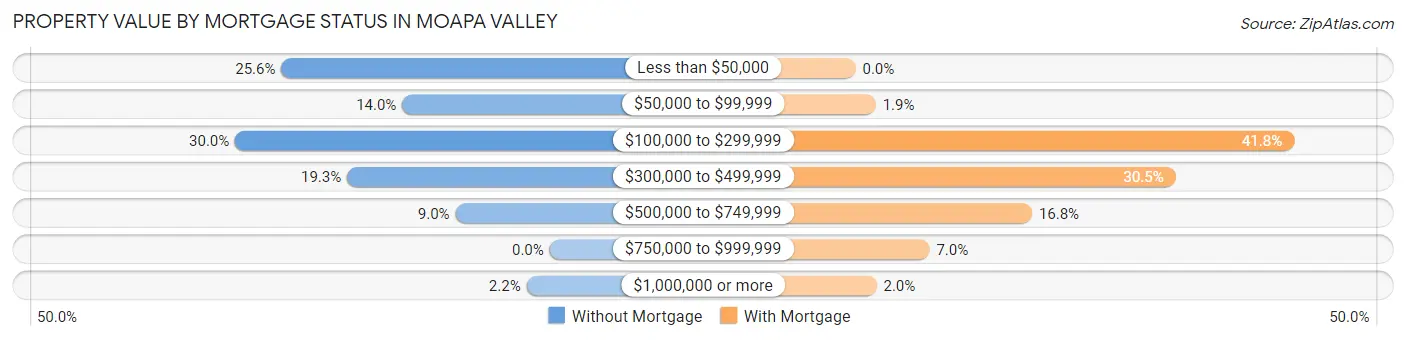
| Property Value | Without Mortgage | With Mortgage |
| Less than $50,000 | 151 (25.6%) | 0 (0.0%) |
| $50,000 to $99,999 | 83 (14.0%) | 24 (1.9%) |
| $100,000 to $299,999 | 177 (29.9%) | 522 (41.8%) |
| $300,000 to $499,999 | 114 (19.3%) | 381 (30.5%) |
| $500,000 to $749,999 | 53 (9.0%) | 210 (16.8%) |
| $750,000 to $999,999 | 0 (0.0%) | 88 (7.0%) |
| $1,000,000 or more | 13 (2.2%) | 25 (2.0%) |
| Total | 591 (100.0%) | 1,250 (100.0%) |
Household Income by Mortgage Status in Moapa Valley
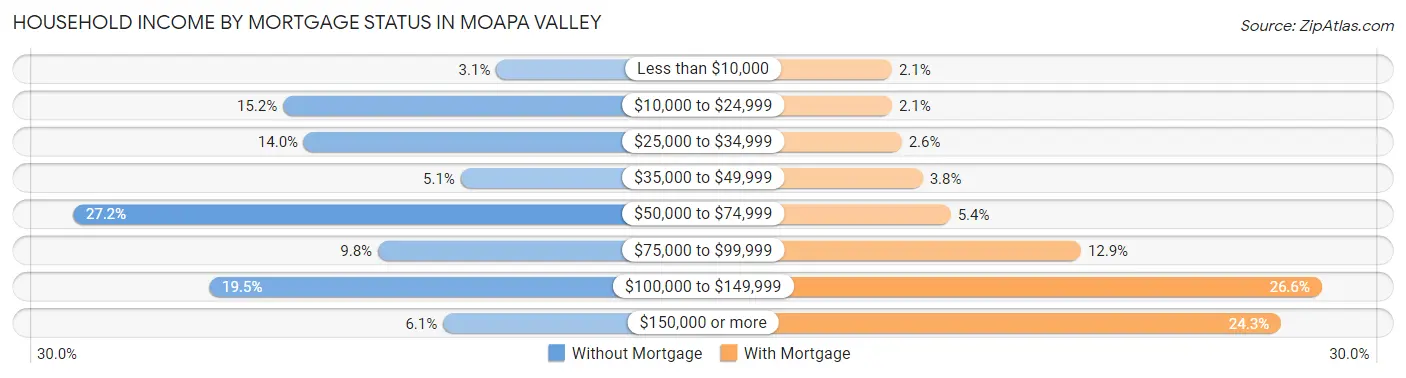
| Household Income | Without Mortgage | With Mortgage |
| Less than $10,000 | 18 (3.0%) | 26 (2.1%) |
| $10,000 to $24,999 | 90 (15.2%) | 26 (2.1%) |
| $25,000 to $34,999 | 83 (14.0%) | 33 (2.6%) |
| $35,000 to $49,999 | 30 (5.1%) | 48 (3.8%) |
| $50,000 to $74,999 | 161 (27.2%) | 68 (5.4%) |
| $75,000 to $99,999 | 58 (9.8%) | 161 (12.9%) |
| $100,000 to $149,999 | 115 (19.5%) | 333 (26.6%) |
| $150,000 or more | 36 (6.1%) | 304 (24.3%) |
| Total | 591 (100.0%) | 1,250 (100.0%) |
Property Value to Household Income Ratio in Moapa Valley
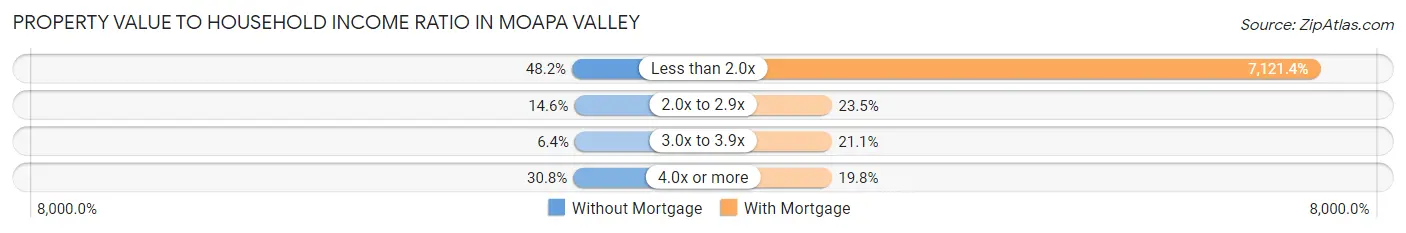
| Value-to-Income Ratio | Without Mortgage | With Mortgage |
| Less than 2.0x | 285 (48.2%) | 89,018 (7,121.4%) |
| 2.0x to 2.9x | 86 (14.5%) | 294 (23.5%) |
| 3.0x to 3.9x | 38 (6.4%) | 264 (21.1%) |
| 4.0x or more | 182 (30.8%) | 247 (19.8%) |
| Total | 591 (100.0%) | 1,250 (100.0%) |
Real Estate Taxes by Mortgage Status in Moapa Valley
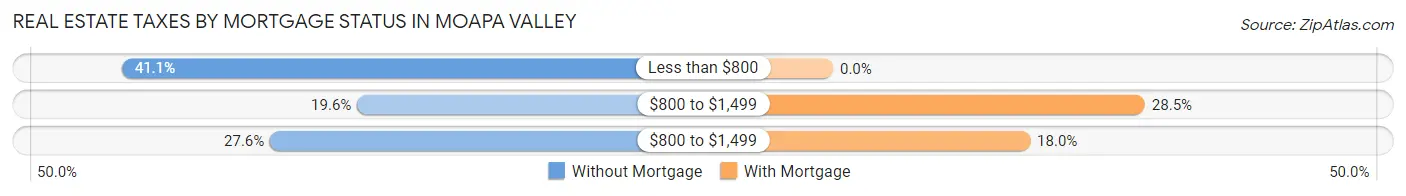
| Property Taxes | Without Mortgage | With Mortgage |
| Less than $800 | 243 (41.1%) | 0 (0.0%) |
| $800 to $1,499 | 116 (19.6%) | 356 (28.5%) |
| $800 to $1,499 | 163 (27.6%) | 225 (18.0%) |
| Total | 591 (100.0%) | 1,250 (100.0%) |
Health & Disability in Moapa Valley
Health Insurance Coverage by Age in Moapa Valley
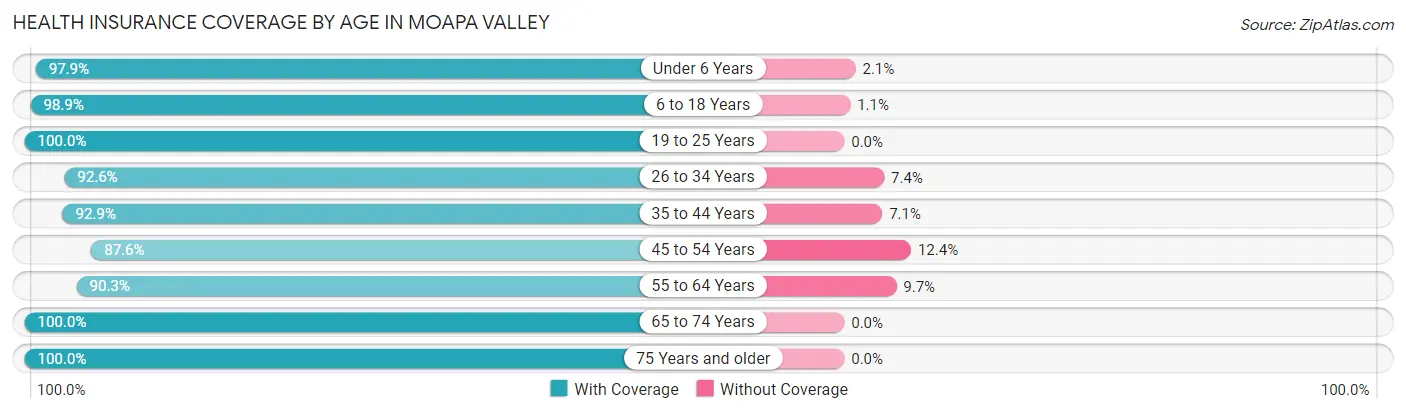
| Age Bracket | With Coverage | Without Coverage |
| Under 6 Years | 559 (97.9%) | 12 (2.1%) |
| 6 to 18 Years | 1,881 (98.9%) | 21 (1.1%) |
| 19 to 25 Years | 396 (100.0%) | 0 (0.0%) |
| 26 to 34 Years | 773 (92.6%) | 62 (7.4%) |
| 35 to 44 Years | 748 (92.9%) | 57 (7.1%) |
| 45 to 54 Years | 887 (87.6%) | 126 (12.4%) |
| 55 to 64 Years | 558 (90.3%) | 60 (9.7%) |
| 65 to 74 Years | 629 (100.0%) | 0 (0.0%) |
| 75 Years and older | 342 (100.0%) | 0 (0.0%) |
| Total | 6,773 (95.3%) | 338 (4.8%) |
Health Insurance Coverage by Citizenship Status in Moapa Valley
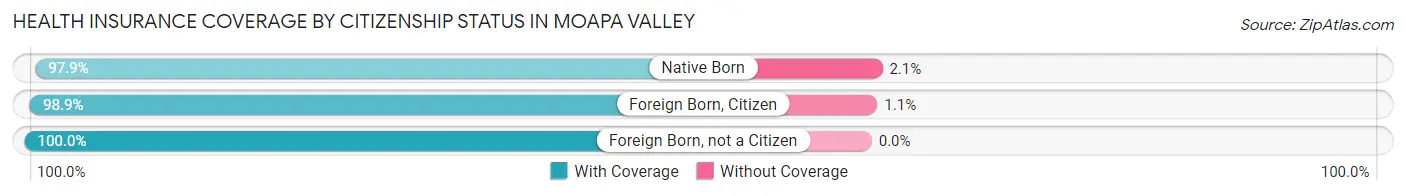
| Citizenship Status | With Coverage | Without Coverage |
| Native Born | 559 (97.9%) | 12 (2.1%) |
| Foreign Born, Citizen | 1,881 (98.9%) | 21 (1.1%) |
| Foreign Born, not a Citizen | 396 (100.0%) | 0 (0.0%) |
Health Insurance Coverage by Household Income in Moapa Valley
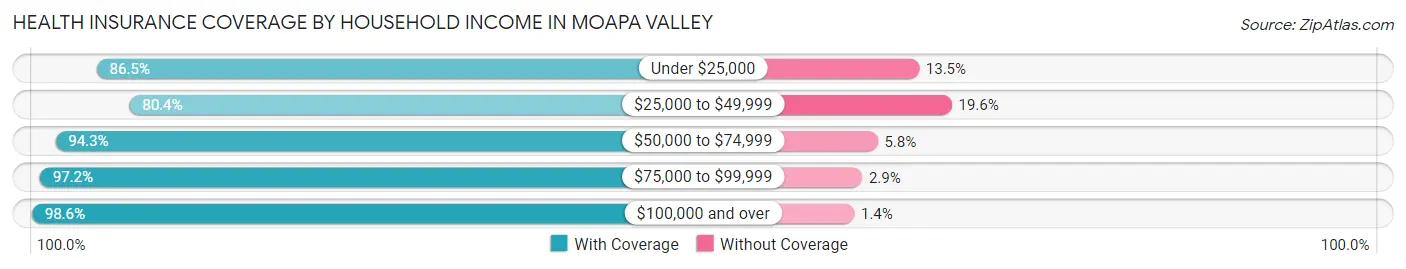
| Household Income | With Coverage | Without Coverage |
| Under $25,000 | 442 (86.5%) | 69 (13.5%) |
| $25,000 to $49,999 | 426 (80.4%) | 104 (19.6%) |
| $50,000 to $74,999 | 1,163 (94.3%) | 71 (5.8%) |
| $75,000 to $99,999 | 1,844 (97.2%) | 54 (2.9%) |
| $100,000 and over | 2,898 (98.6%) | 40 (1.4%) |
Public vs Private Health Insurance Coverage by Age in Moapa Valley
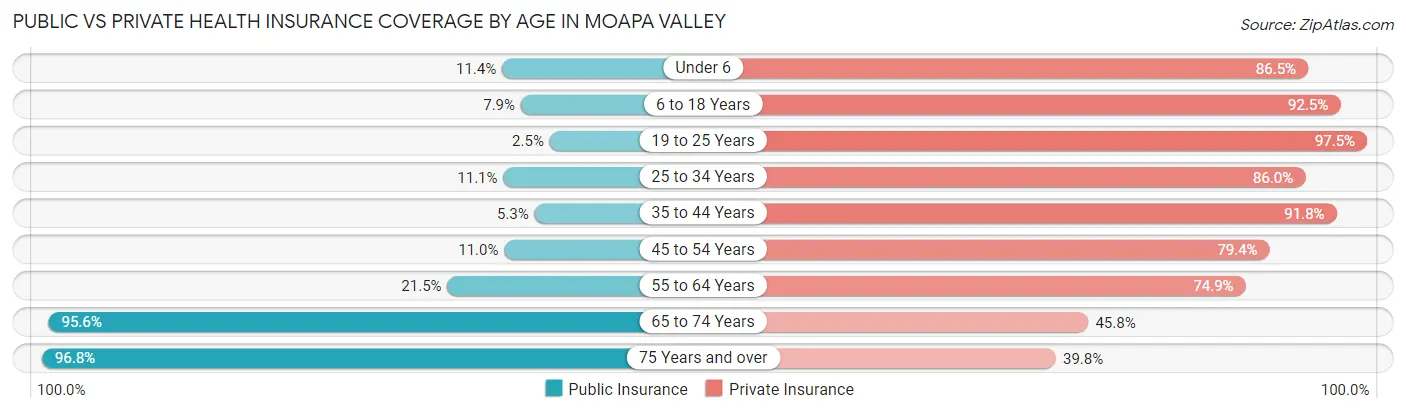
| Age Bracket | Public Insurance | Private Insurance |
| Under 6 | 65 (11.4%) | 494 (86.5%) |
| 6 to 18 Years | 150 (7.9%) | 1,759 (92.5%) |
| 19 to 25 Years | 10 (2.5%) | 386 (97.5%) |
| 25 to 34 Years | 93 (11.1%) | 718 (86.0%) |
| 35 to 44 Years | 43 (5.3%) | 739 (91.8%) |
| 45 to 54 Years | 111 (11.0%) | 804 (79.4%) |
| 55 to 64 Years | 133 (21.5%) | 463 (74.9%) |
| 65 to 74 Years | 601 (95.6%) | 288 (45.8%) |
| 75 Years and over | 331 (96.8%) | 136 (39.8%) |
| Total | 1,537 (21.6%) | 5,787 (81.4%) |
Disability Status by Sex by Age in Moapa Valley
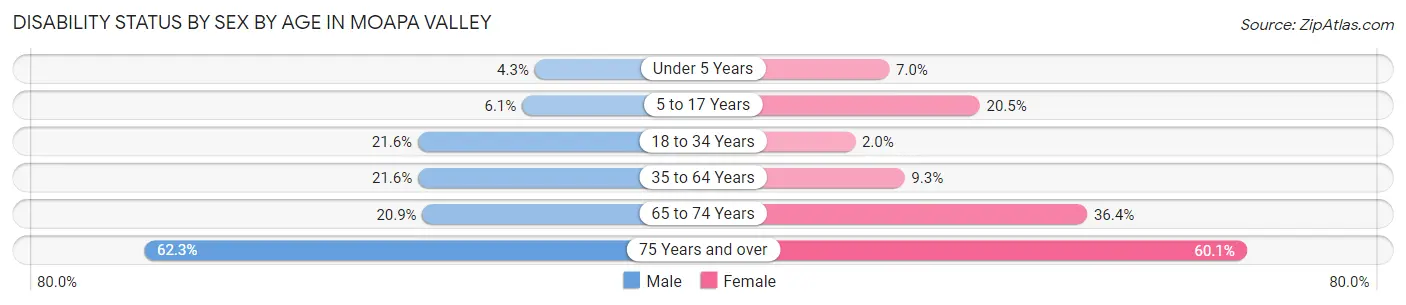
| Age Bracket | Male | Female |
| Under 5 Years | 9 (4.3%) | 16 (7.0%) |
| 5 to 17 Years | 52 (6.1%) | 202 (20.4%) |
| 18 to 34 Years | 154 (21.6%) | 14 (2.0%) |
| 35 to 64 Years | 282 (21.6%) | 105 (9.3%) |
| 65 to 74 Years | 50 (20.9%) | 142 (36.4%) |
| 75 Years and over | 99 (62.3%) | 110 (60.1%) |
Disability Class by Sex by Age in Moapa Valley
Disability Class: Hearing Difficulty
| Age Bracket | Male | Female |
| Under 5 Years | 9 (4.3%) | 0 (0.0%) |
| 5 to 17 Years | 0 (0.0%) | 0 (0.0%) |
| 18 to 34 Years | 154 (21.6%) | 14 (2.0%) |
| 35 to 64 Years | 138 (10.6%) | 0 (0.0%) |
| 65 to 74 Years | 26 (10.9%) | 95 (24.4%) |
| 75 Years and over | 40 (25.2%) | 37 (20.2%) |
Disability Class: Vision Difficulty
| Age Bracket | Male | Female |
| Under 5 Years | 0 (0.0%) | 16 (7.0%) |
| 5 to 17 Years | 0 (0.0%) | 10 (1.0%) |
| 18 to 34 Years | 0 (0.0%) | 14 (2.0%) |
| 35 to 64 Years | 53 (4.1%) | 19 (1.7%) |
| 65 to 74 Years | 7 (2.9%) | 27 (6.9%) |
| 75 Years and over | 17 (10.7%) | 34 (18.6%) |
Disability Class: Cognitive Difficulty
| Age Bracket | Male | Female |
| 5 to 17 Years | 40 (4.7%) | 202 (20.4%) |
| 18 to 34 Years | 154 (21.6%) | 14 (2.0%) |
| 35 to 64 Years | 67 (5.1%) | 8 (0.7%) |
| 65 to 74 Years | 0 (0.0%) | 30 (7.7%) |
| 75 Years and over | 19 (11.9%) | 49 (26.8%) |
Disability Class: Ambulatory Difficulty
| Age Bracket | Male | Female |
| 5 to 17 Years | 12 (1.4%) | 13 (1.3%) |
| 18 to 34 Years | 0 (0.0%) | 14 (2.0%) |
| 35 to 64 Years | 162 (12.4%) | 88 (7.8%) |
| 65 to 74 Years | 25 (10.5%) | 69 (17.7%) |
| 75 Years and over | 91 (57.2%) | 67 (36.6%) |
Disability Class: Self-Care Difficulty
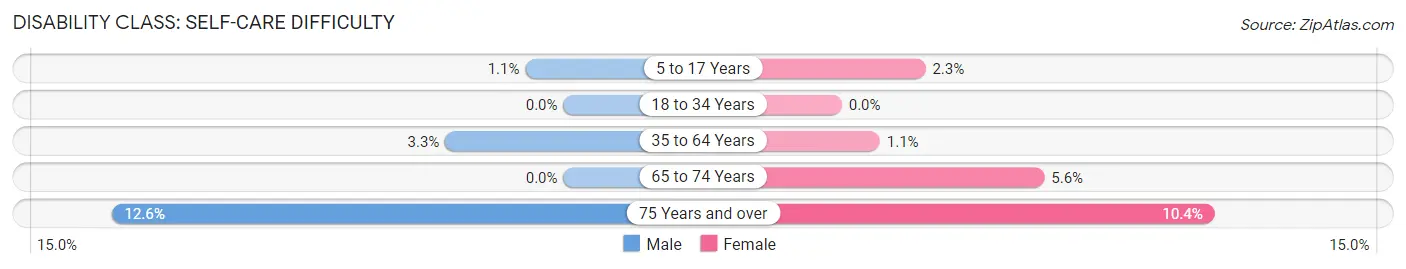
| Age Bracket | Male | Female |
| 5 to 17 Years | 9 (1.1%) | 23 (2.3%) |
| 18 to 34 Years | 0 (0.0%) | 0 (0.0%) |
| 35 to 64 Years | 43 (3.3%) | 12 (1.1%) |
| 65 to 74 Years | 0 (0.0%) | 22 (5.6%) |
| 75 Years and over | 20 (12.6%) | 19 (10.4%) |
Technology Access in Moapa Valley
Computing Device Access in Moapa Valley
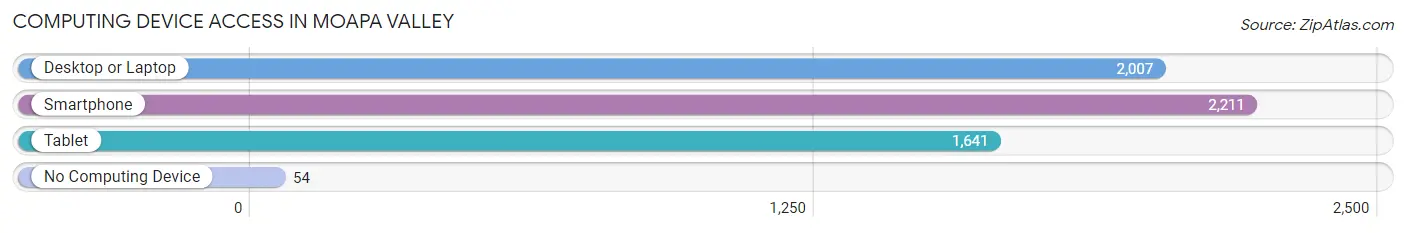
| Device Type | # Households | % Households |
| Desktop or Laptop | 2,007 | 86.0% |
| Smartphone | 2,211 | 94.7% |
| Tablet | 1,641 | 70.3% |
| No Computing Device | 54 | 2.3% |
| Total | 2,335 | 100.0% |
Internet Access in Moapa Valley
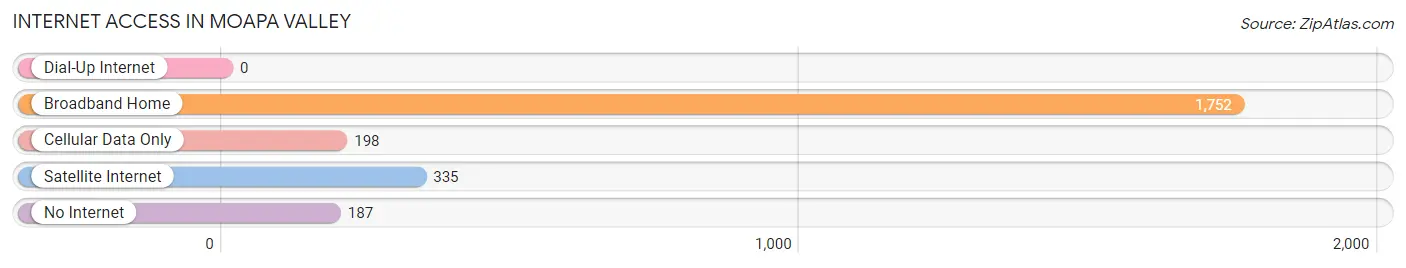
| Internet Type | # Households | % Households |
| Dial-Up Internet | 0 | 0.0% |
| Broadband Home | 1,752 | 75.0% |
| Cellular Data Only | 198 | 8.5% |
| Satellite Internet | 335 | 14.3% |
| No Internet | 187 | 8.0% |
| Total | 2,335 | 100.0% |
Moapa Valley Summary
Moapa Valley is a small rural community located in Clark County, Nevada, approximately 40 miles northeast of Las Vegas. The valley is bordered by the Muddy Mountains to the north, the Virgin Mountains to the east, and the Sheep Range to the south. The valley is home to the Moapa River Indian Reservation, which is the only federally recognized Indian reservation in the state of Nevada.
Geography
Moapa Valley is located in the Mojave Desert, and is characterized by its dry climate and sparse vegetation. The valley is approximately 25 miles long and 10 miles wide, and is situated at an elevation of 2,400 feet. The valley is home to several small communities, including Glendale, Logandale, Overton, and Moapa Town. The valley is also home to the Moapa River Indian Reservation, which is the only federally recognized Indian reservation in the state of Nevada.
The valley is home to several natural features, including the Moapa River, which flows through the valley and is a major source of water for the area. The valley is also home to several springs, which provide water for the local wildlife and vegetation. The valley is also home to several species of wildlife, including bighorn sheep, mule deer, coyotes, and bobcats.
Economy
The economy of Moapa Valley is largely based on agriculture and tourism. The valley is home to several farms and ranches, which produce a variety of crops, including alfalfa, hay, corn, and wheat. The valley is also home to several tourist attractions, including the Valley of Fire State Park, which is a popular destination for hikers, campers, and rock climbers.
The valley is also home to several casinos, which attract visitors from all over the world. The casinos provide employment opportunities for local residents, as well as a source of revenue for the local economy.
Demographics
As of the 2010 census, the population of Moapa Valley was 7,890. The population is largely composed of Native Americans, with the majority of the population being members of the Moapa River Indian Tribe. The population is also composed of a small number of non-Native Americans, primarily of Hispanic or Latino origin.
The median household income in Moapa Valley is $41,944, and the median home value is $133,400. The unemployment rate in the valley is 8.2%, which is slightly higher than the national average.
Conclusion
Moapa Valley is a small rural community located in Clark County, Nevada, approximately 40 miles northeast of Las Vegas. The valley is home to the Moapa River Indian Reservation, which is the only federally recognized Indian reservation in the state of Nevada. The economy of Moapa Valley is largely based on agriculture and tourism, and the population is largely composed of Native Americans. The median household income in Moapa Valley is $41,944, and the median home value is $133,400. The unemployment rate in the valley is 8.2%, which is slightly higher than the national average.
Common Questions
What is Per Capita Income in Moapa Valley?
Per Capita income in Moapa Valley is $33,385.
What is the Median Family Income in Moapa Valley?
Median Family Income in Moapa Valley is $89,018.
What is the Median Household income in Moapa Valley?
Median Household Income in Moapa Valley is $82,592.
What is Income or Wage Gap in Moapa Valley?
Income or Wage Gap in Moapa Valley is 56.5%.
Women in Moapa Valley earn 43.5 cents for every dollar earned by a man.
What is Family Income Deficit in Moapa Valley?
Family Income Deficit in Moapa Valley is $13,501.
Families that are below poverty line in Moapa Valley earn $13,501 less on average than the poverty threshold level.
What is Inequality or Gini Index in Moapa Valley?
Inequality or Gini Index in Moapa Valley is 0.42.
What is the Total Population of Moapa Valley?
Total Population of Moapa Valley is 7,144.
What is the Total Male Population of Moapa Valley?
Total Male Population of Moapa Valley is 3,513.
What is the Total Female Population of Moapa Valley?
Total Female Population of Moapa Valley is 3,631.
What is the Ratio of Males per 100 Females in Moapa Valley?
There are 96.75 Males per 100 Females in Moapa Valley.
What is the Ratio of Females per 100 Males in Moapa Valley?
There are 103.36 Females per 100 Males in Moapa Valley.
What is the Median Population Age in Moapa Valley?
Median Population Age in Moapa Valley is 31.5 Years.
What is the Average Family Size in Moapa Valley
Average Family Size in Moapa Valley is 3.5 People.
What is the Average Household Size in Moapa Valley
Average Household Size in Moapa Valley is 3.1 People.
How Large is the Labor Force in Moapa Valley?
There are 3,133 People in the Labor Forcein in Moapa Valley.
What is the Percentage of People in the Labor Force in Moapa Valley?
61.8% of People are in the Labor Force in Moapa Valley.
What is the Unemployment Rate in Moapa Valley?
Unemployment Rate in Moapa Valley is 12.1%.