Bunkerville, NV Map & Demographics
Bunkerville Map
Bunkerville Overview
$25,833
PER CAPITA INCOME
$144,293
AVG FAMILY INCOME
$142,500
AVG HOUSEHOLD INCOME
0.31
INEQUALITY / GINI INDEX
1,008
TOTAL POPULATION
441
MALE POPULATION
567
FEMALE POPULATION
77.78
MALES / 100 FEMALES
128.57
FEMALES / 100 MALES
31.6
MEDIAN AGE
5.2
AVG FAMILY SIZE
4.7
AVG HOUSEHOLD SIZE
243
LABOR FORCE [ PEOPLE ]
42.4%
PERCENT IN LABOR FORCE
Bunkerville Zip Codes
Bunkerville Area Codes
Income in Bunkerville
Income Overview in Bunkerville
Per Capita Income in Bunkerville is $25,833, while median incomes of families and households are $144,293 and $142,500 respectively.
| Characteristic | Number | Measure |
| Per Capita Income | 1,008 | $25,833 |
| Median Family Income | 183 | $144,293 |
| Mean Family Income | 183 | $129,774 |
| Median Household Income | 216 | $142,500 |
| Mean Household Income | 216 | $115,310 |
| Income Deficit | 183 | $0 |
| Wage / Income Gap (%) | 1,008 | 0.00% |
| Wage / Income Gap ($) | 1,008 | 100.00¢ per $1 |
| Gini / Inequality Index | 1,008 | 0.31 |
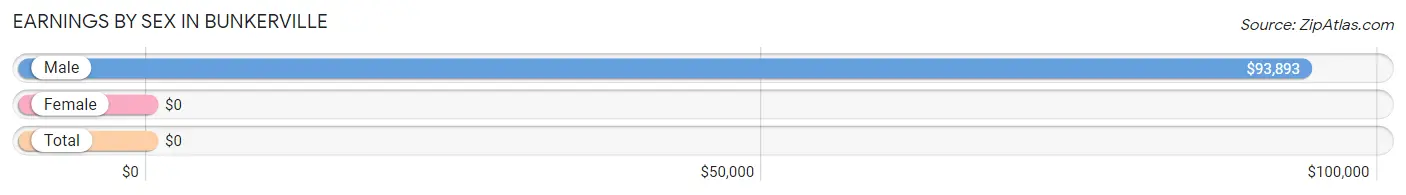
Earnings by Sex in Bunkerville
| Sex | Number | Average Earnings |
| Male | 175 (57.0%) | $93,893 |
| Female | 132 (43.0%) | $0 |
| Total | 307 (100.0%) | $0 |
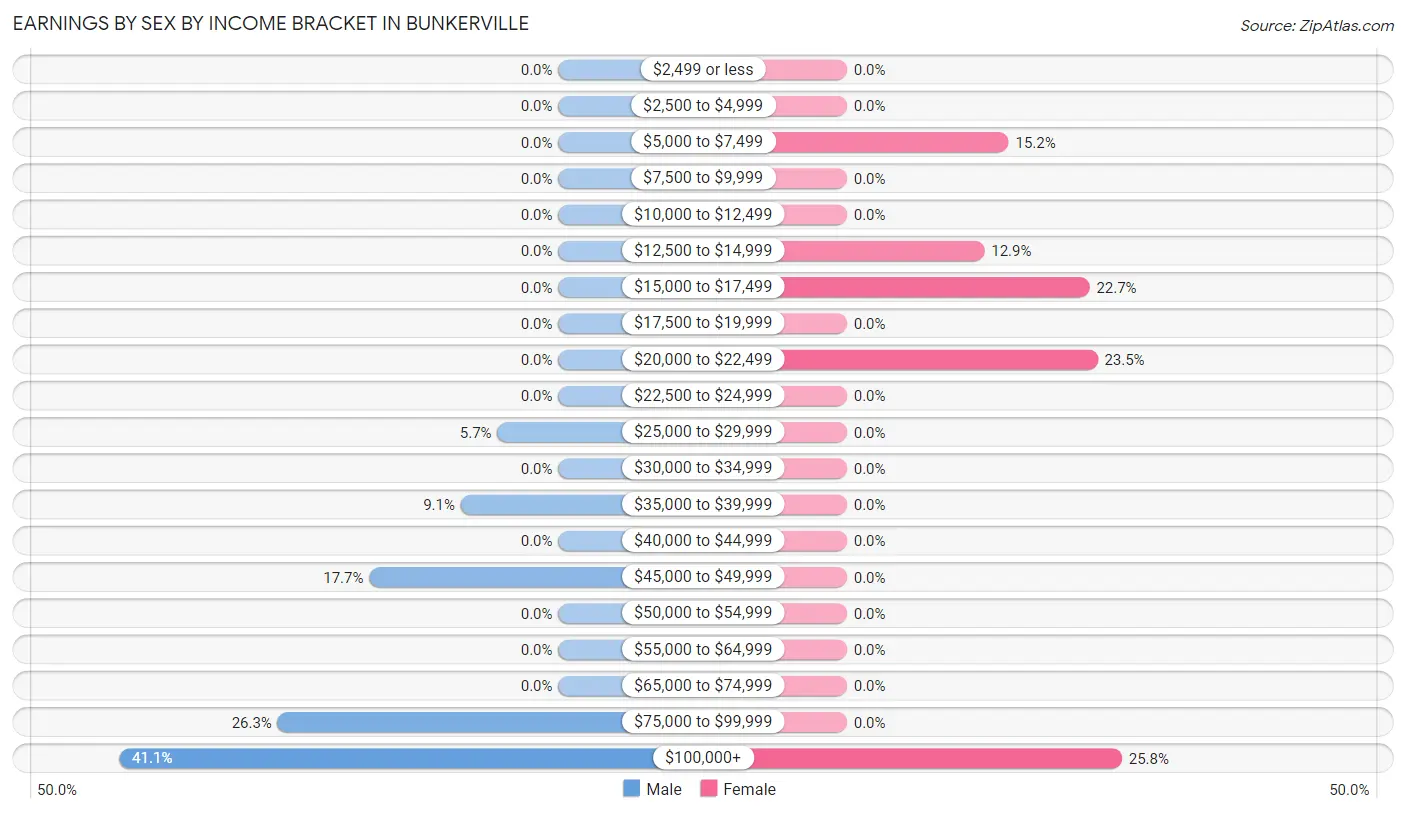
Earnings by Sex by Income Bracket in Bunkerville
The most common earnings brackets in Bunkerville are $100,000+ for men (72 | 41.1%) and $100,000+ for women (34 | 25.8%).
| Income | Male | Female |
| $2,499 or less | 0 (0.0%) | 0 (0.0%) |
| $2,500 to $4,999 | 0 (0.0%) | 0 (0.0%) |
| $5,000 to $7,499 | 0 (0.0%) | 20 (15.1%) |
| $7,500 to $9,999 | 0 (0.0%) | 0 (0.0%) |
| $10,000 to $12,499 | 0 (0.0%) | 0 (0.0%) |
| $12,500 to $14,999 | 0 (0.0%) | 17 (12.9%) |
| $15,000 to $17,499 | 0 (0.0%) | 30 (22.7%) |
| $17,500 to $19,999 | 0 (0.0%) | 0 (0.0%) |
| $20,000 to $22,499 | 0 (0.0%) | 31 (23.5%) |
| $22,500 to $24,999 | 0 (0.0%) | 0 (0.0%) |
| $25,000 to $29,999 | 10 (5.7%) | 0 (0.0%) |
| $30,000 to $34,999 | 0 (0.0%) | 0 (0.0%) |
| $35,000 to $39,999 | 16 (9.1%) | 0 (0.0%) |
| $40,000 to $44,999 | 0 (0.0%) | 0 (0.0%) |
| $45,000 to $49,999 | 31 (17.7%) | 0 (0.0%) |
| $50,000 to $54,999 | 0 (0.0%) | 0 (0.0%) |
| $55,000 to $64,999 | 0 (0.0%) | 0 (0.0%) |
| $65,000 to $74,999 | 0 (0.0%) | 0 (0.0%) |
| $75,000 to $99,999 | 46 (26.3%) | 0 (0.0%) |
| $100,000+ | 72 (41.1%) | 34 (25.8%) |
| Total | 175 (100.0%) | 132 (100.0%) |
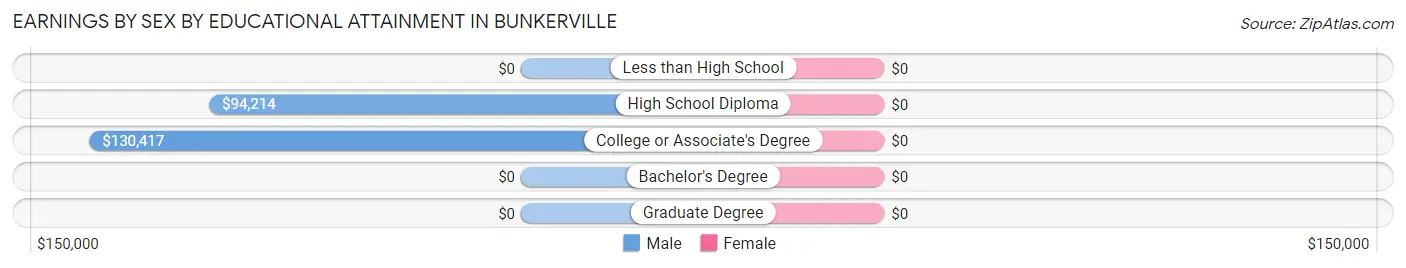
Earnings by Sex by Educational Attainment in Bunkerville
| Educational Attainment | Male Income | Female Income |
| Less than High School | - | - |
| High School Diploma | $94,214 | $0 |
| College or Associate's Degree | $130,417 | $0 |
| Bachelor's Degree | - | - |
| Graduate Degree | - | - |
| Total | $93,893 | $0 |
Family Income in Bunkerville
Family Income Brackets in Bunkerville
According to the Bunkerville family income data, there are 93 families falling into the $100,000 to $149,999 income range, which is the most common income bracket and makes up 50.8% of all families.
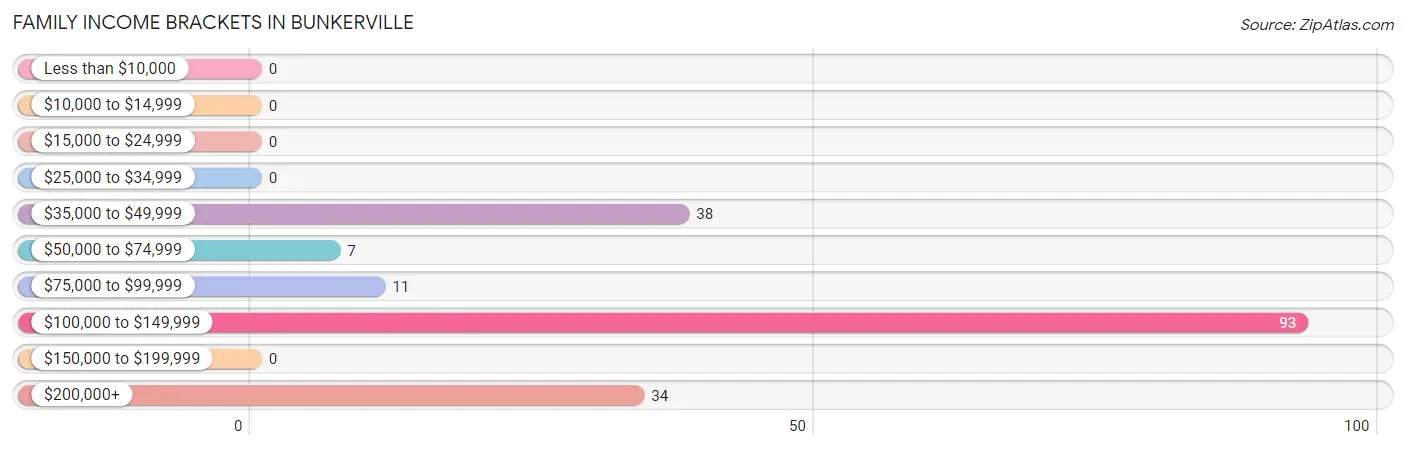
| Income Bracket | # Families | % Families |
| Less than $10,000 | 0 | 0.0% |
| $10,000 to $14,999 | 0 | 0.0% |
| $15,000 to $24,999 | 0 | 0.0% |
| $25,000 to $34,999 | 0 | 0.0% |
| $35,000 to $49,999 | 38 | 20.8% |
| $50,000 to $74,999 | 7 | 3.8% |
| $75,000 to $99,999 | 11 | 6.0% |
| $100,000 to $149,999 | 93 | 50.8% |
| $150,000 to $199,999 | 0 | 0.0% |
| $200,000+ | 34 | 18.6% |
Family Income by Famaliy Size in Bunkerville
7+ person families (87 | 47.5%) account for the highest median family income in Bunkerville with $146,708 per family, while 7+ person families (87 | 47.5%) have the highest median income of $20,958 per family member.
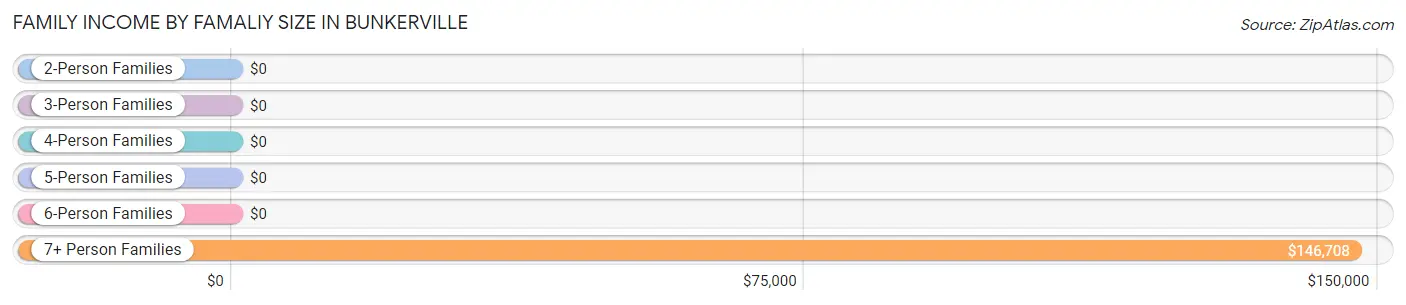
| Income Bracket | # Families | Median Income |
| 2-Person Families | 78 (42.6%) | $0 |
| 3-Person Families | 0 (0.0%) | $0 |
| 4-Person Families | 7 (3.8%) | $0 |
| 5-Person Families | 0 (0.0%) | $0 |
| 6-Person Families | 11 (6.0%) | $0 |
| 7+ Person Families | 87 (47.5%) | $146,708 |
| Total | 183 (100.0%) | $144,293 |
Family Income by Number of Earners in Bunkerville
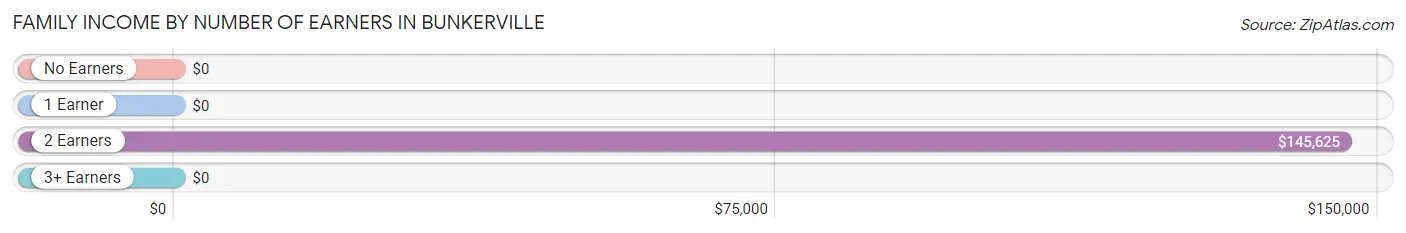
| Number of Earners | # Families | Median Income |
| No Earners | 21 (11.5%) | $0 |
| 1 Earner | 49 (26.8%) | $0 |
| 2 Earners | 113 (61.8%) | $145,625 |
| 3+ Earners | 0 (0.0%) | $0 |
| Total | 183 (100.0%) | $144,293 |
Household Income in Bunkerville
Household Income Brackets in Bunkerville
With 100 households falling in the category, the $100,000 to $149,999 income range is the most frequent in Bunkerville, accounting for 46.3% of all households.
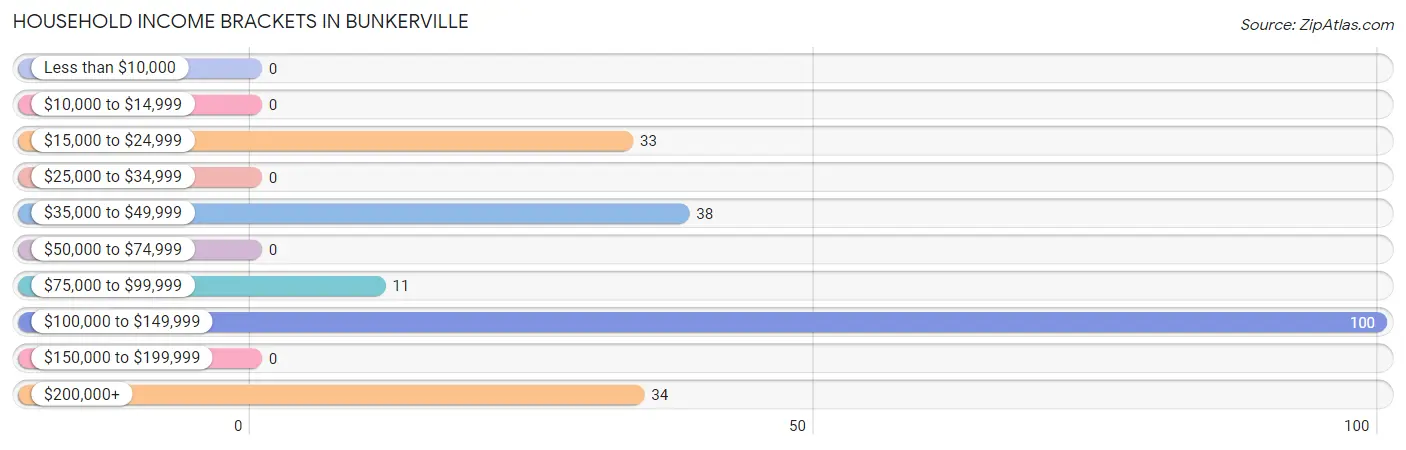
| Income Bracket | # Households | % Households |
| Less than $10,000 | 0 | 0.0% |
| $10,000 to $14,999 | 0 | 0.0% |
| $15,000 to $24,999 | 33 | 15.3% |
| $25,000 to $34,999 | 0 | 0.0% |
| $35,000 to $49,999 | 38 | 17.6% |
| $50,000 to $74,999 | 0 | 0.0% |
| $75,000 to $99,999 | 11 | 5.1% |
| $100,000 to $149,999 | 100 | 46.3% |
| $150,000 to $199,999 | 0 | 0.0% |
| $200,000+ | 34 | 15.7% |
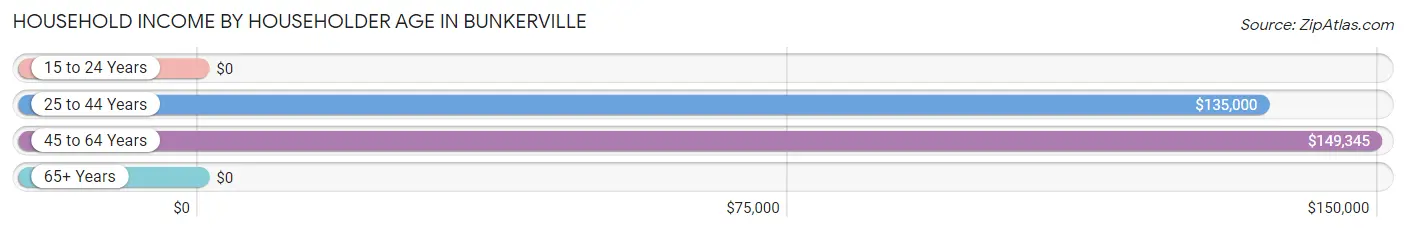
Household Income by Householder Age in Bunkerville
The median household income in Bunkerville is $142,500, with the highest median household income of $149,345 found in the 45 to 64 years age bracket for the primary householder. A total of 79 households (36.6%) fall into this category.
| Income Bracket | # Households | Median Income |
| 15 to 24 Years | 0 (0.0%) | $0 |
| 25 to 44 Years | 60 (27.8%) | $135,000 |
| 45 to 64 Years | 79 (36.6%) | $149,345 |
| 65+ Years | 77 (35.6%) | $0 |
| Total | 216 (100.0%) | $142,500 |
Poverty in Bunkerville
Income Below Poverty by Sex and Age in Bunkerville

| Age Bracket | Male | Female |
| Under 5 Years | 0 (0.0%) | 0 (0.0%) |
| 5 Years | 0 (0.0%) | 0 (0.0%) |
| 6 to 11 Years | 0 (0.0%) | 0 (0.0%) |
| 12 to 14 Years | 0 (0.0%) | 0 (0.0%) |
| 15 Years | 0 (0.0%) | 0 (0.0%) |
| 16 and 17 Years | 0 (0.0%) | 0 (0.0%) |
| 18 to 24 Years | 0 (0.0%) | 0 (0.0%) |
| 25 to 34 Years | 0 (0.0%) | 0 (0.0%) |
| 35 to 44 Years | 0 (0.0%) | 0 (0.0%) |
| 45 to 54 Years | 0 (0.0%) | 0 (0.0%) |
| 55 to 64 Years | 0 (0.0%) | 0 (0.0%) |
| 65 to 74 Years | 0 (0.0%) | 0 (0.0%) |
| 75 Years and over | 0 (0.0%) | 0 (0.0%) |
| Total | 0 (0.0%) | 0 (0.0%) |
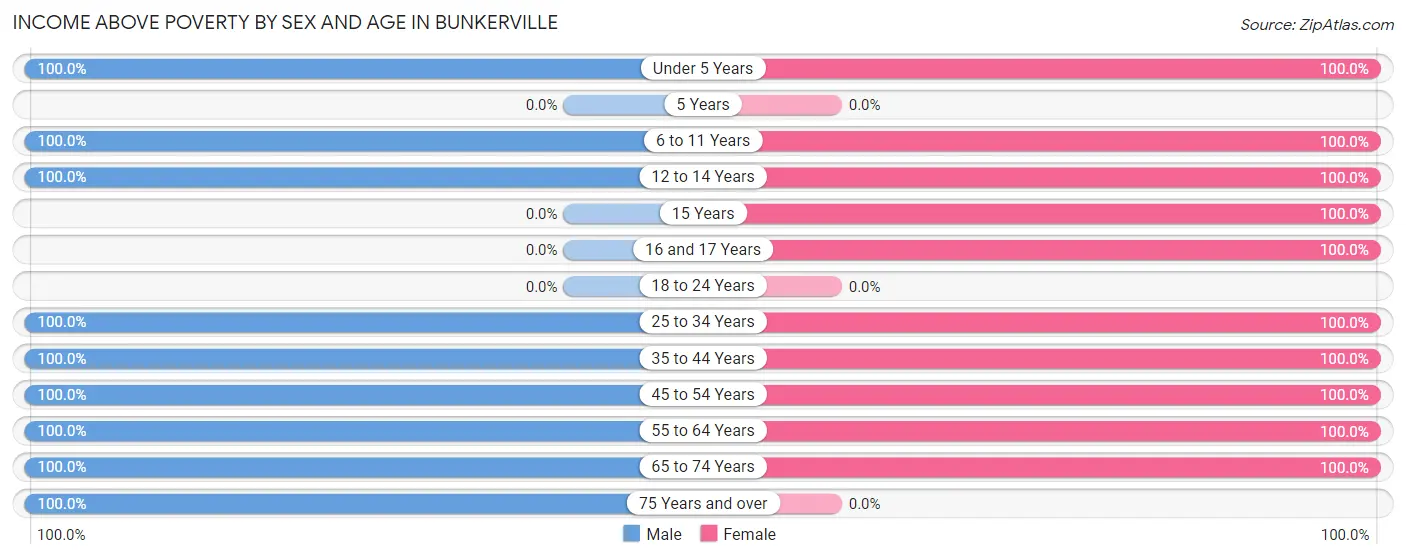
Income Above Poverty by Sex and Age in Bunkerville
According to the poverty statistics in Bunkerville, males aged under 5 years and females aged under 5 years are the age groups that are most secure financially, with 100.0% of males and 100.0% of females in these age groups living above the poverty line.
| Age Bracket | Male | Female |
| Under 5 Years | 24 (100.0%) | 75 (100.0%) |
| 5 Years | 0 (0.0%) | 0 (0.0%) |
| 6 to 11 Years | 135 (100.0%) | 122 (100.0%) |
| 12 to 14 Years | 30 (100.0%) | 26 (100.0%) |
| 15 Years | 0 (0.0%) | 23 (100.0%) |
| 16 and 17 Years | 0 (0.0%) | 53 (100.0%) |
| 18 to 24 Years | 0 (0.0%) | 0 (0.0%) |
| 25 to 34 Years | 28 (100.0%) | 31 (100.0%) |
| 35 to 44 Years | 72 (100.0%) | 114 (100.0%) |
| 45 to 54 Years | 33 (100.0%) | 28 (100.0%) |
| 55 to 64 Years | 42 (100.0%) | 51 (100.0%) |
| 65 to 74 Years | 60 (100.0%) | 44 (100.0%) |
| 75 Years and over | 17 (100.0%) | 0 (0.0%) |
| Total | 441 (100.0%) | 567 (100.0%) |
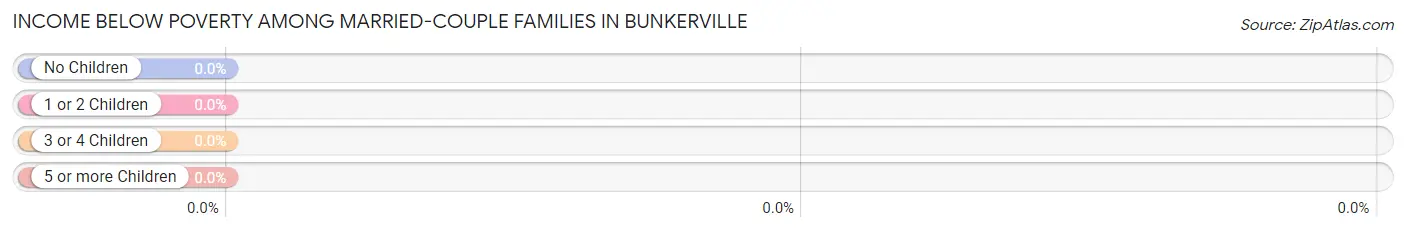
Income Below Poverty Among Married-Couple Families in Bunkerville
| Children | Above Poverty | Below Poverty |
| No Children | 85 (100.0%) | 0 (0.0%) |
| 1 or 2 Children | 0 (0.0%) | 0 (0.0%) |
| 3 or 4 Children | 45 (100.0%) | 0 (0.0%) |
| 5 or more Children | 30 (100.0%) | 0 (0.0%) |
| Total | 160 (100.0%) | 0 (0.0%) |
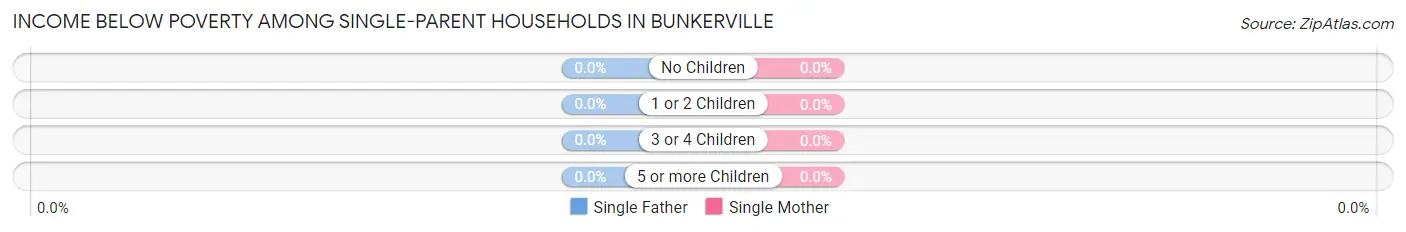
Income Below Poverty Among Single-Parent Households in Bunkerville
| Children | Single Father | Single Mother |
| No Children | 0 (0.0%) | 0 (0.0%) |
| 1 or 2 Children | 0 (0.0%) | 0 (0.0%) |
| 3 or 4 Children | 0 (0.0%) | 0 (0.0%) |
| 5 or more Children | 0 (0.0%) | 0 (0.0%) |
| Total | 0 (0.0%) | 0 (0.0%) |
Income Below Poverty Among Married-Couple vs Single-Parent Households in Bunkerville
| Children | Married-Couple Families | Single-Parent Households |
| No Children | 0 (0.0%) | 0 (0.0%) |
| 1 or 2 Children | 0 (0.0%) | 0 (0.0%) |
| 3 or 4 Children | 0 (0.0%) | 0 (0.0%) |
| 5 or more Children | 0 (0.0%) | 0 (0.0%) |
| Total | 0 (0.0%) | 0 (0.0%) |
Race in Bunkerville
The most populous races in Bunkerville are White / Caucasian (959 | 95.1%), Hawaiian / Pacific (33 | 3.3%), and Hispanic or Latino (16 | 1.6%).
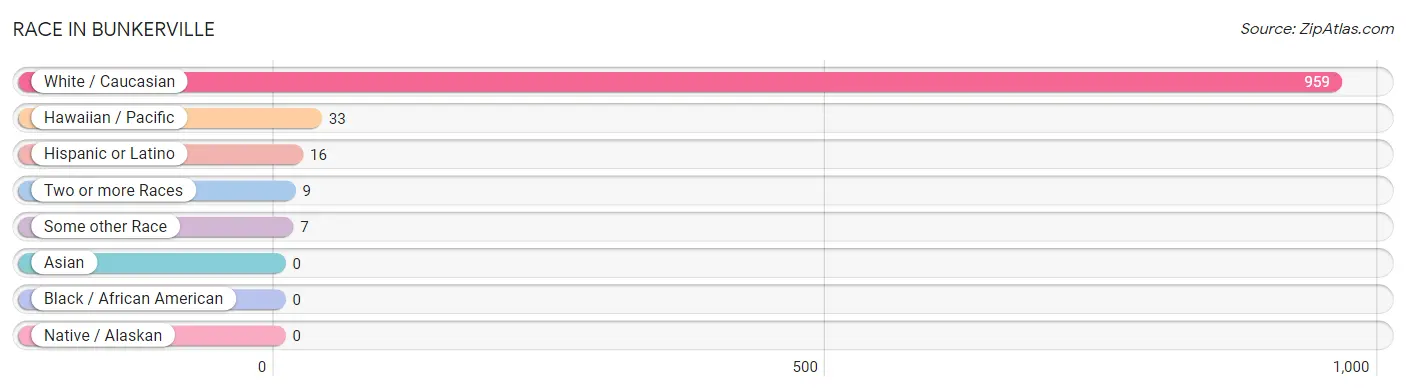
| Race | # Population | % Population |
| Asian | 0 | 0.0% |
| Black / African American | 0 | 0.0% |
| Hawaiian / Pacific | 33 | 3.3% |
| Hispanic or Latino | 16 | 1.6% |
| Native / Alaskan | 0 | 0.0% |
| White / Caucasian | 959 | 95.1% |
| Two or more Races | 9 | 0.9% |
| Some other Race | 7 | 0.7% |
| Total | 1,008 | 100.0% |
Ancestry in Bunkerville
The most populous ancestries reported in Bunkerville are Swiss (375 | 37.2%), English (249 | 24.7%), Irish (170 | 16.9%), European (38 | 3.8%), and German (36 | 3.6%), together accounting for 86.1% of all Bunkerville residents.
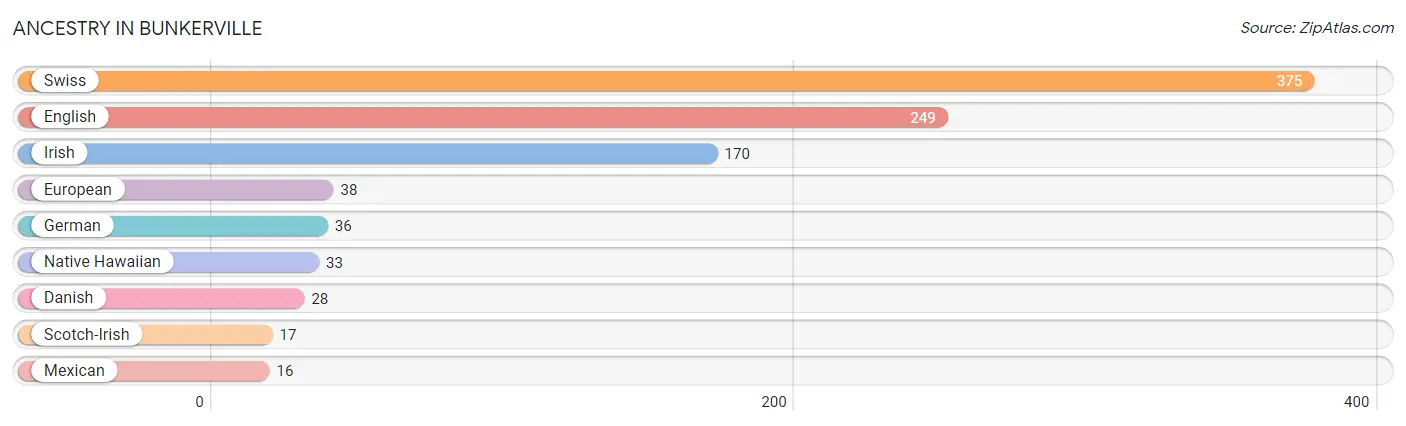
| Ancestry | # Population | % Population |
| Danish | 28 | 2.8% |
| English | 249 | 24.7% |
| European | 38 | 3.8% |
| German | 36 | 3.6% |
| Irish | 170 | 16.9% |
| Mexican | 16 | 1.6% |
| Native Hawaiian | 33 | 3.3% |
| Scotch-Irish | 17 | 1.7% |
| Swiss | 375 | 37.2% | View All 9 Rows |
Immigrants in Bunkerville

| Immigration Origin | # Population | % Population | View All 0 Rows |
Sex and Age in Bunkerville
Sex and Age in Bunkerville
The most populous age groups in Bunkerville are 10 to 14 Years (106 | 24.0%) for men and 5 to 9 Years (122 | 21.5%) for women.
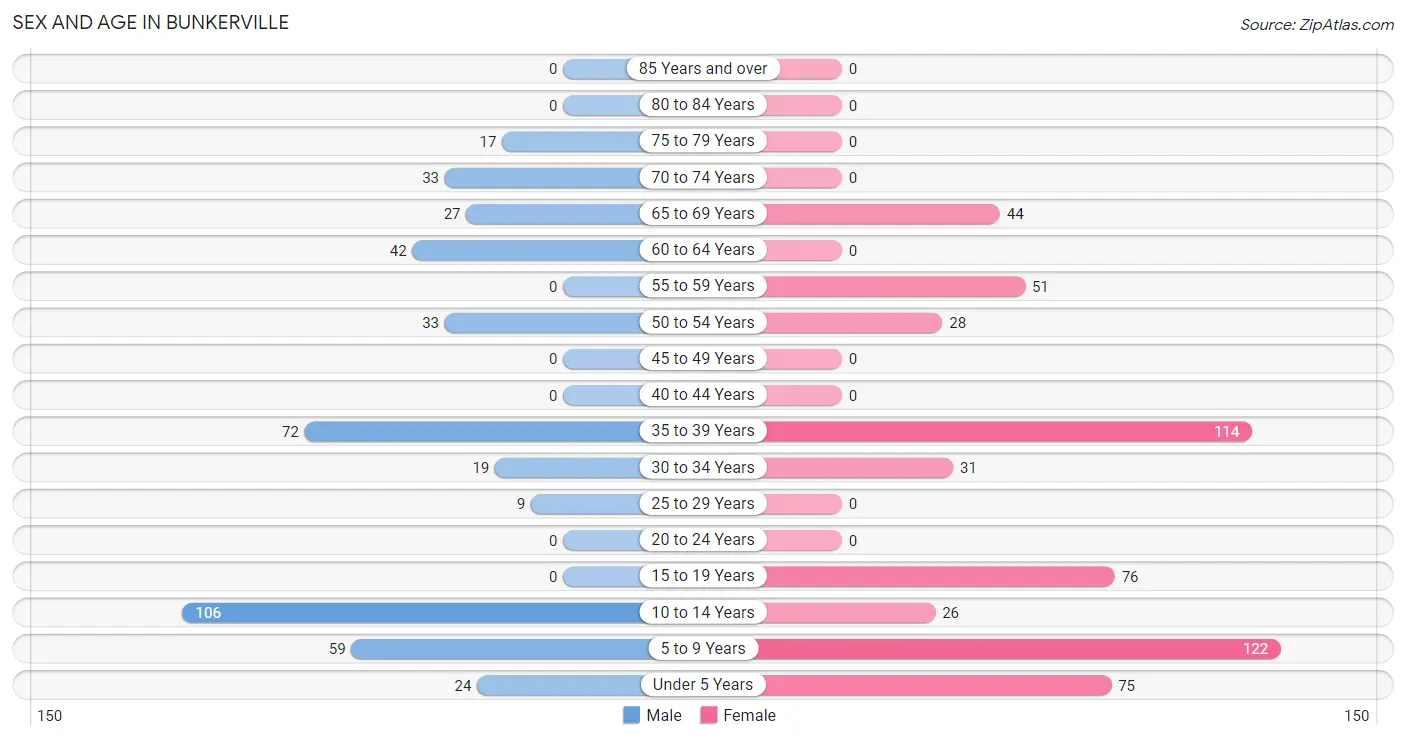
| Age Bracket | Male | Female |
| Under 5 Years | 24 (5.4%) | 75 (13.2%) |
| 5 to 9 Years | 59 (13.4%) | 122 (21.5%) |
| 10 to 14 Years | 106 (24.0%) | 26 (4.6%) |
| 15 to 19 Years | 0 (0.0%) | 76 (13.4%) |
| 20 to 24 Years | 0 (0.0%) | 0 (0.0%) |
| 25 to 29 Years | 9 (2.0%) | 0 (0.0%) |
| 30 to 34 Years | 19 (4.3%) | 31 (5.5%) |
| 35 to 39 Years | 72 (16.3%) | 114 (20.1%) |
| 40 to 44 Years | 0 (0.0%) | 0 (0.0%) |
| 45 to 49 Years | 0 (0.0%) | 0 (0.0%) |
| 50 to 54 Years | 33 (7.5%) | 28 (4.9%) |
| 55 to 59 Years | 0 (0.0%) | 51 (9.0%) |
| 60 to 64 Years | 42 (9.5%) | 0 (0.0%) |
| 65 to 69 Years | 27 (6.1%) | 44 (7.8%) |
| 70 to 74 Years | 33 (7.5%) | 0 (0.0%) |
| 75 to 79 Years | 17 (3.8%) | 0 (0.0%) |
| 80 to 84 Years | 0 (0.0%) | 0 (0.0%) |
| 85 Years and over | 0 (0.0%) | 0 (0.0%) |
| Total | 441 (100.0%) | 567 (100.0%) |
Families and Households in Bunkerville
Median Family Size in Bunkerville
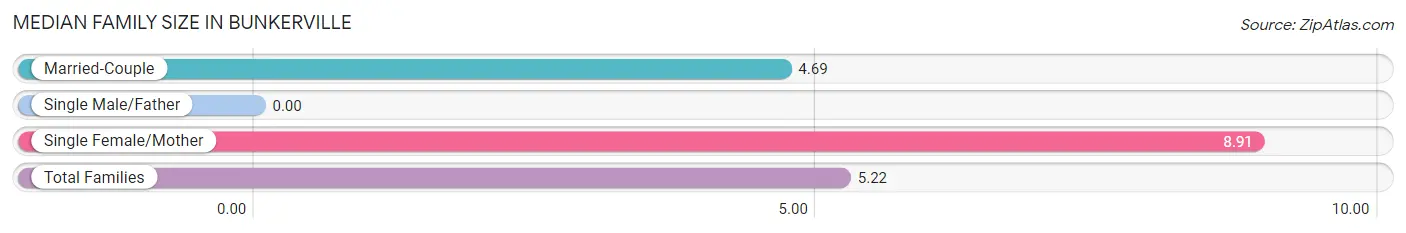
| Family Type | # Families | Family Size |
| Married-Couple | 160 (87.4%) | 4.69 |
| Single Male/Father | 0 (0.0%) | - |
| Single Female/Mother | 23 (12.6%) | 8.91 |
| Total Families | 183 (100.0%) | 5.22 |
Median Household Size in Bunkerville
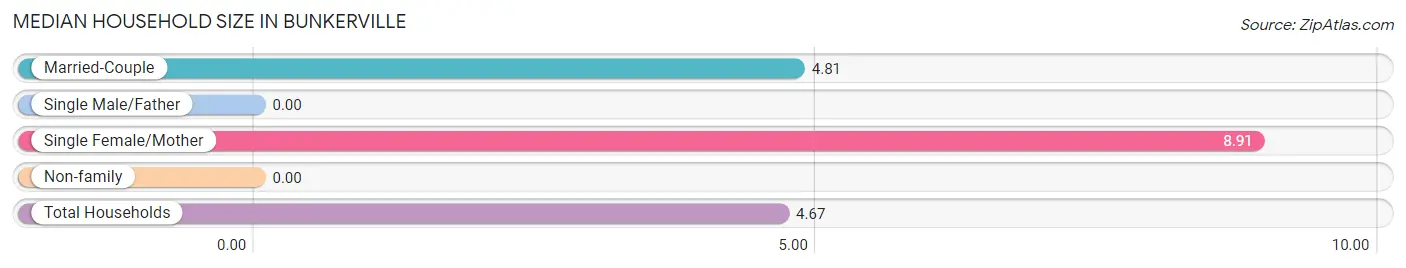
| Household Type | # Households | Household Size |
| Married-Couple | 160 (74.1%) | 4.81 |
| Single Male/Father | 0 (0.0%) | - |
| Single Female/Mother | 23 (10.6%) | 8.91 |
| Non-family | 33 (15.3%) | - |
| Total Households | 216 (100.0%) | 4.67 |
Household Size by Marriage Status in Bunkerville
Out of a total of 216 households in Bunkerville, 183 (84.7%) are family households, while 33 (15.3%) are nonfamily households. The most numerous type of family households are 7+ person households, comprising 87, and the most common type of nonfamily households are 1-person households, comprising 33.
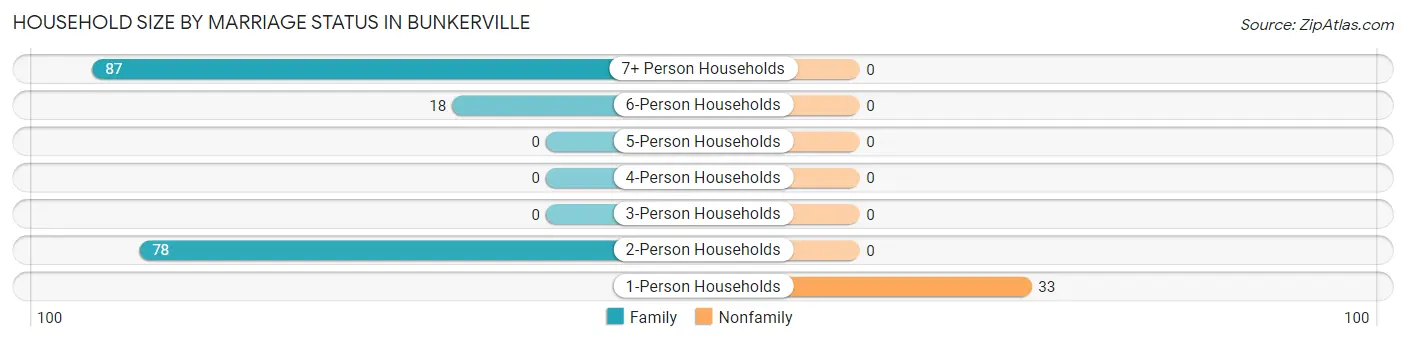
| Household Size | Family Households | Nonfamily Households |
| 1-Person Households | - | 33 (15.3%) |
| 2-Person Households | 78 (36.1%) | 0 (0.0%) |
| 3-Person Households | 0 (0.0%) | 0 (0.0%) |
| 4-Person Households | 0 (0.0%) | 0 (0.0%) |
| 5-Person Households | 0 (0.0%) | 0 (0.0%) |
| 6-Person Households | 18 (8.3%) | 0 (0.0%) |
| 7+ Person Households | 87 (40.3%) | 0 (0.0%) |
| Total | 183 (84.7%) | 33 (15.3%) |
Female Fertility in Bunkerville
Fertility by Age in Bunkerville
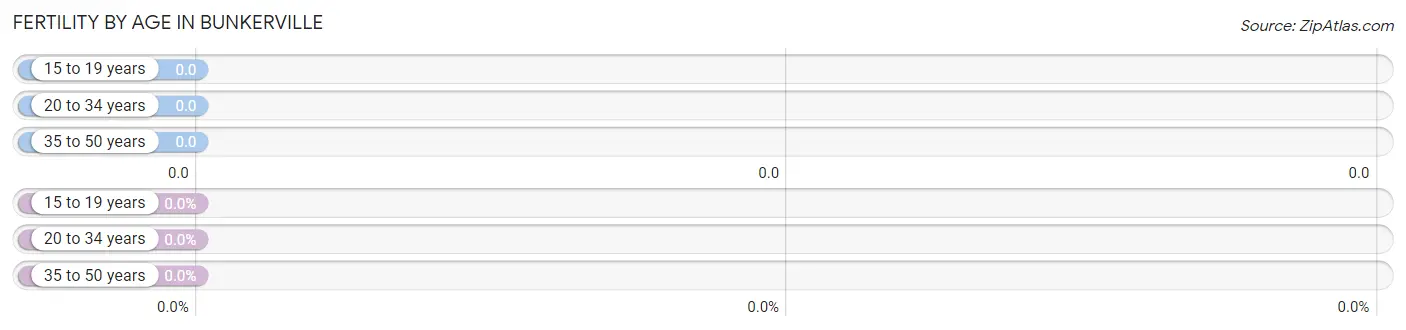
| Age Bracket | Women with Births | Births / 1,000 Women |
| 15 to 19 years | 0 (0.0%) | 0.0 |
| 20 to 34 years | 0 (0.0%) | 0.0 |
| 35 to 50 years | 0 (0.0%) | 0.0 |
| Total | 0 (0.0%) | 0.0 |
Fertility by Age by Marriage Status in Bunkerville
| Age Bracket | Married | Unmarried |
| 15 to 19 years | 0 (0.0%) | 0 (0.0%) |
| 20 to 34 years | 0 (0.0%) | 0 (0.0%) |
| 35 to 50 years | 0 (0.0%) | 0 (0.0%) |
| Total | 0 (0.0%) | 0 (0.0%) |
Fertility by Education in Bunkerville
| Educational Attainment | Women with Births | Births / 1,000 Women |
| Less than High School | 0 (0.0%) | 0.0 |
| High School Diploma | 0 (0.0%) | 0.0 |
| College or Associate's Degree | 0 (0.0%) | 0.0 |
| Bachelor's Degree | 0 (0.0%) | 0.0 |
| Graduate Degree | 0 (0.0%) | 0.0 |
| Total | 0 (0.0%) | 0.0 |
Fertility by Education by Marriage Status in Bunkerville
| Educational Attainment | Married | Unmarried |
| Less than High School | 0 (0.0%) | 0 (0.0%) |
| High School Diploma | 0 (0.0%) | 0 (0.0%) |
| College or Associate's Degree | 0 (0.0%) | 0 (0.0%) |
| Bachelor's Degree | 0 (0.0%) | 0 (0.0%) |
| Graduate Degree | 0 (0.0%) | 0 (0.0%) |
| Total | 0 (0.0%) | 0 (0.0%) |
Employment Characteristics in Bunkerville
Employment by Class of Employer in Bunkerville
Among the 212 employed individuals in Bunkerville, private company employees (154 | 72.6%), and local government employees (58 | 27.4%) make up the most common classes of employment.
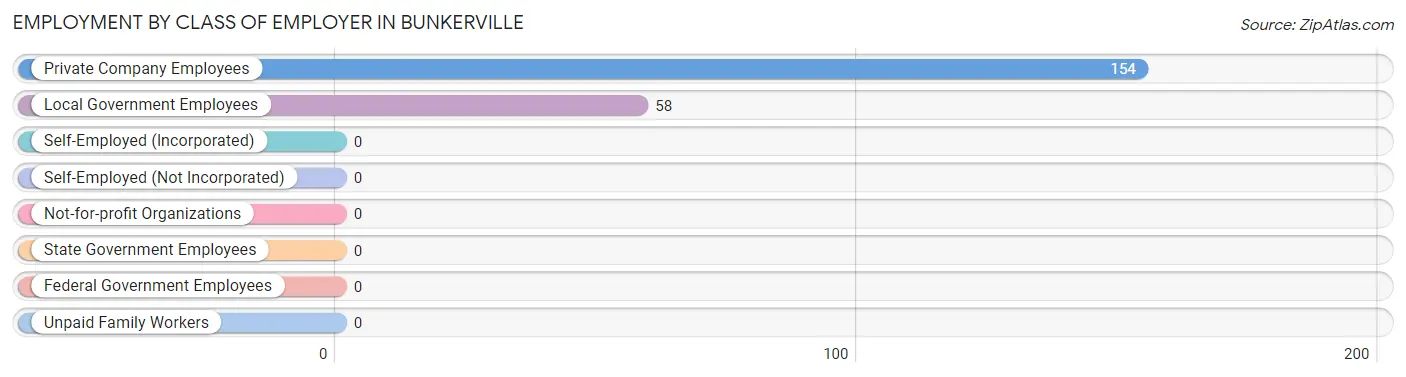
| Employer Class | # Employees | % Employees |
| Private Company Employees | 154 | 72.6% |
| Self-Employed (Incorporated) | 0 | 0.0% |
| Self-Employed (Not Incorporated) | 0 | 0.0% |
| Not-for-profit Organizations | 0 | 0.0% |
| Local Government Employees | 58 | 27.4% |
| State Government Employees | 0 | 0.0% |
| Federal Government Employees | 0 | 0.0% |
| Unpaid Family Workers | 0 | 0.0% |
| Total | 212 | 100.0% |
Employment Status by Age in Bunkerville
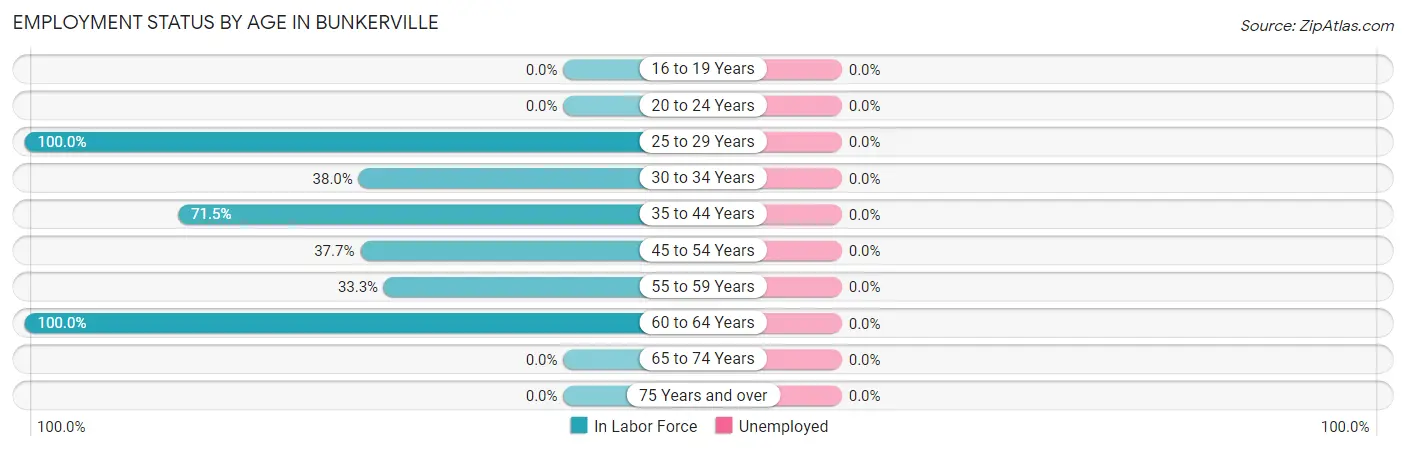
| Age Bracket | In Labor Force | Unemployed |
| 16 to 19 Years | 0 (0.0%) | 0 (0.0%) |
| 20 to 24 Years | 0 (0.0%) | 0 (0.0%) |
| 25 to 29 Years | 9 (100.0%) | 0 (0.0%) |
| 30 to 34 Years | 19 (38.0%) | 0 (0.0%) |
| 35 to 44 Years | 133 (71.5%) | 0 (0.0%) |
| 45 to 54 Years | 23 (37.7%) | 0 (0.0%) |
| 55 to 59 Years | 17 (33.3%) | 0 (0.0%) |
| 60 to 64 Years | 42 (100.0%) | 0 (0.0%) |
| 65 to 74 Years | 0 (0.0%) | 0 (0.0%) |
| 75 Years and over | 0 (0.0%) | 0 (0.0%) |
| Total | 243 (42.4%) | 0 (0.0%) |
Employment Status by Educational Attainment in Bunkerville
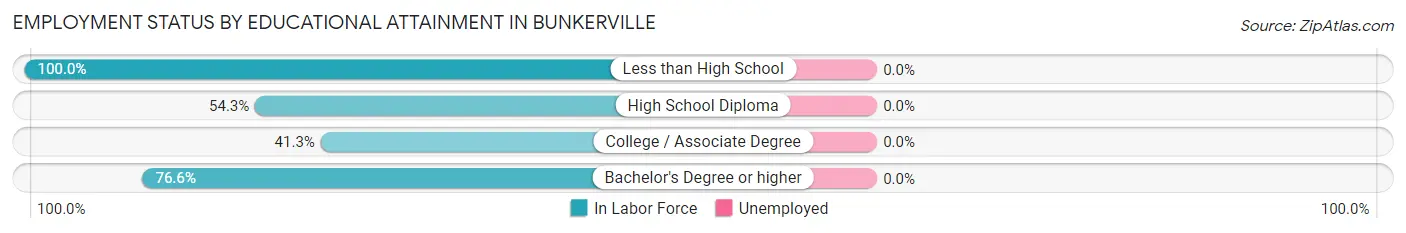
| Educational Attainment | In Labor Force | Unemployed |
| Less than High School | 69 (100.0%) | 0 (0.0%) |
| High School Diploma | 88 (54.3%) | 0 (0.0%) |
| College / Associate Degree | 50 (41.3%) | 0 (0.0%) |
| Bachelor's Degree or higher | 36 (76.6%) | 0 (0.0%) |
| Total | 243 (60.9%) | 0 (0.0%) |
Employment Occupations by Sex in Bunkerville
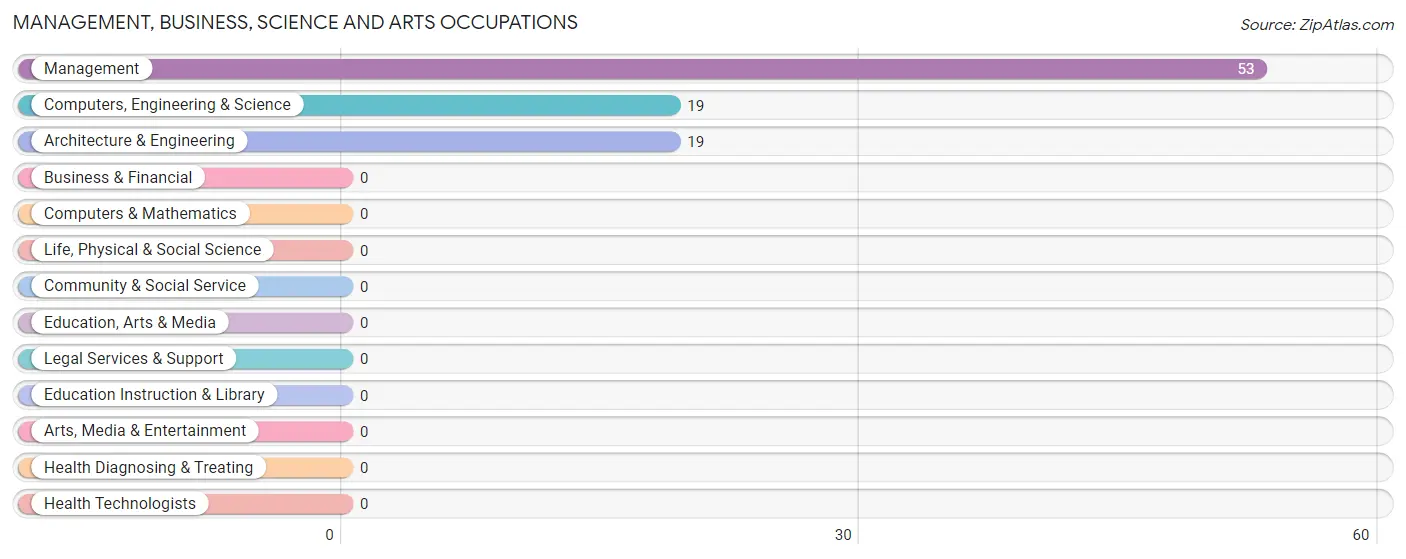
Management, Business, Science and Arts Occupations
The most common Management, Business, Science and Arts occupations in Bunkerville are Management (53 | 21.8%), Computers, Engineering & Science (19 | 7.8%), and Architecture & Engineering (19 | 7.8%).
Management, Business, Science and Arts Occupations by Sex
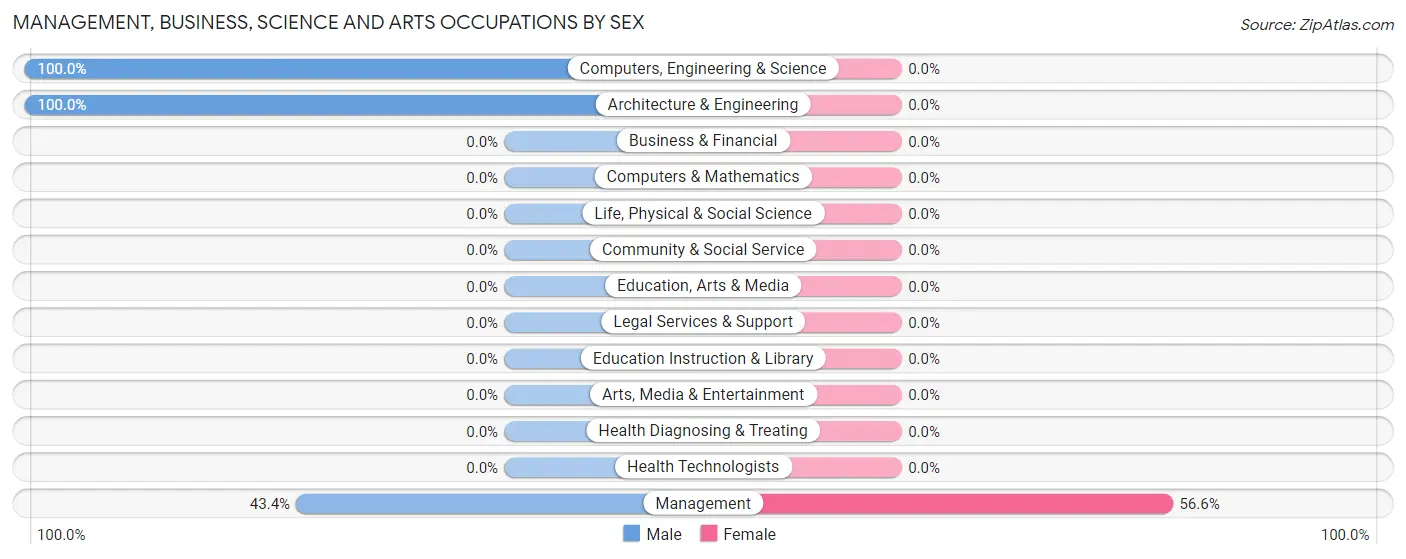
| Occupation | Male | Female |
| Management | 23 (43.4%) | 30 (56.6%) |
| Business & Financial | 0 (0.0%) | 0 (0.0%) |
| Computers, Engineering & Science | 19 (100.0%) | 0 (0.0%) |
| Computers & Mathematics | 0 (0.0%) | 0 (0.0%) |
| Architecture & Engineering | 19 (100.0%) | 0 (0.0%) |
| Life, Physical & Social Science | 0 (0.0%) | 0 (0.0%) |
| Community & Social Service | 0 (0.0%) | 0 (0.0%) |
| Education, Arts & Media | 0 (0.0%) | 0 (0.0%) |
| Legal Services & Support | 0 (0.0%) | 0 (0.0%) |
| Education Instruction & Library | 0 (0.0%) | 0 (0.0%) |
| Arts, Media & Entertainment | 0 (0.0%) | 0 (0.0%) |
| Health Diagnosing & Treating | 0 (0.0%) | 0 (0.0%) |
| Health Technologists | 0 (0.0%) | 0 (0.0%) |
| Total (Category) | 42 (58.3%) | 30 (41.7%) |
| Total (Overall) | 165 (67.9%) | 78 (32.1%) |
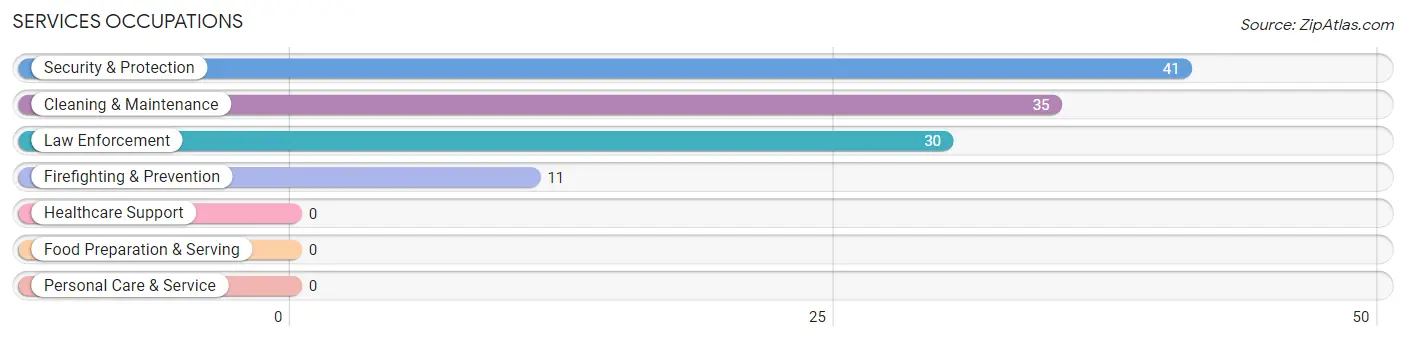
Services Occupations
The most common Services occupations in Bunkerville are Security & Protection (41 | 16.9%), Cleaning & Maintenance (35 | 14.4%), Law Enforcement (30 | 12.3%), and Firefighting & Prevention (11 | 4.5%).
Services Occupations by Sex
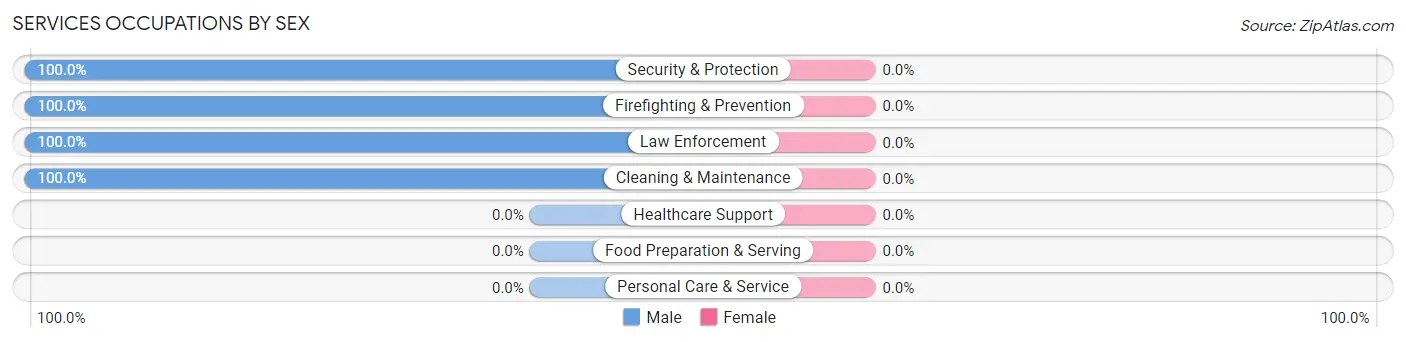
| Occupation | Male | Female |
| Healthcare Support | 0 (0.0%) | 0 (0.0%) |
| Security & Protection | 41 (100.0%) | 0 (0.0%) |
| Firefighting & Prevention | 11 (100.0%) | 0 (0.0%) |
| Law Enforcement | 30 (100.0%) | 0 (0.0%) |
| Food Preparation & Serving | 0 (0.0%) | 0 (0.0%) |
| Cleaning & Maintenance | 35 (100.0%) | 0 (0.0%) |
| Personal Care & Service | 0 (0.0%) | 0 (0.0%) |
| Total (Category) | 76 (100.0%) | 0 (0.0%) |
| Total (Overall) | 165 (67.9%) | 78 (32.1%) |
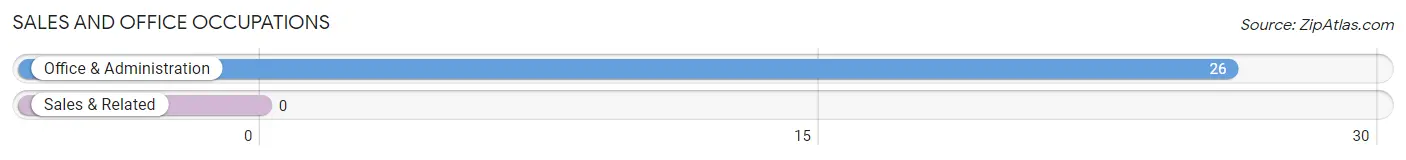
Sales and Office Occupations
The most common Sales and Office occupations in Bunkerville are , and Office & Administration (26 | 10.7%).
Sales and Office Occupations by Sex
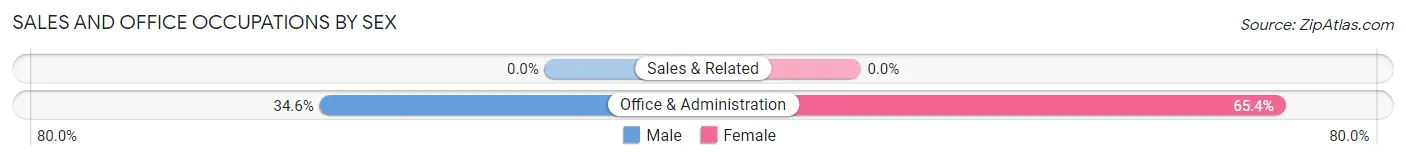
| Occupation | Male | Female |
| Sales & Related | 0 (0.0%) | 0 (0.0%) |
| Office & Administration | 9 (34.6%) | 17 (65.4%) |
| Total (Category) | 9 (34.6%) | 17 (65.4%) |
| Total (Overall) | 165 (67.9%) | 78 (32.1%) |
Natural Resources, Construction and Maintenance Occupations
The most common Natural Resources, Construction and Maintenance occupations in Bunkerville are , and Installation, Maintenance & Repair (31 | 12.8%).
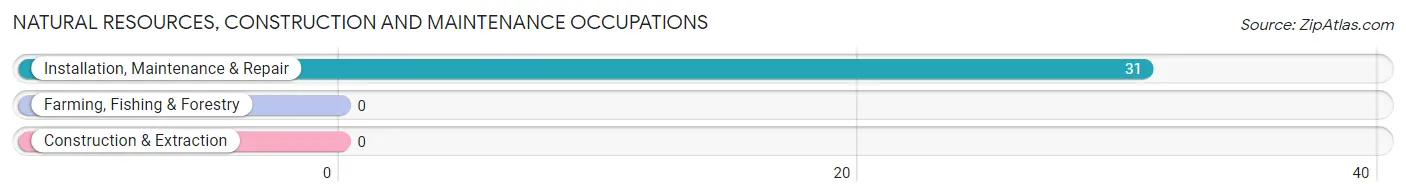
Natural Resources, Construction and Maintenance Occupations by Sex
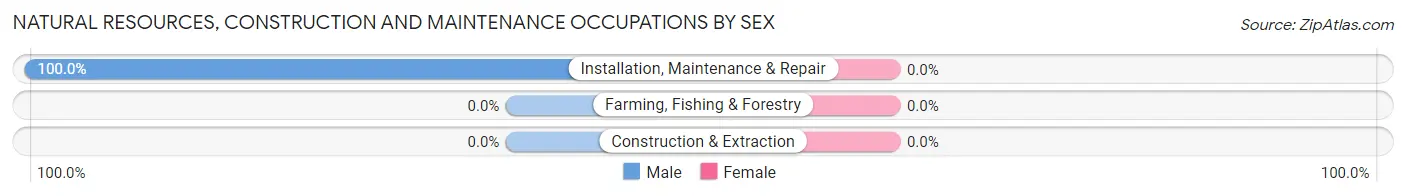
| Occupation | Male | Female |
| Farming, Fishing & Forestry | 0 (0.0%) | 0 (0.0%) |
| Construction & Extraction | 0 (0.0%) | 0 (0.0%) |
| Installation, Maintenance & Repair | 31 (100.0%) | 0 (0.0%) |
| Total (Category) | 31 (100.0%) | 0 (0.0%) |
| Total (Overall) | 165 (67.9%) | 78 (32.1%) |
Production, Transportation and Moving Occupations
The most common Production, Transportation and Moving occupations in Bunkerville are Production (31 | 12.8%), and Transportation (7 | 2.9%).
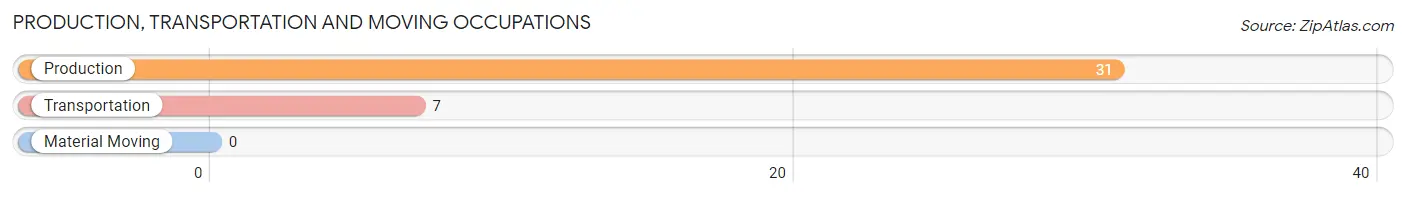
Production, Transportation and Moving Occupations by Sex
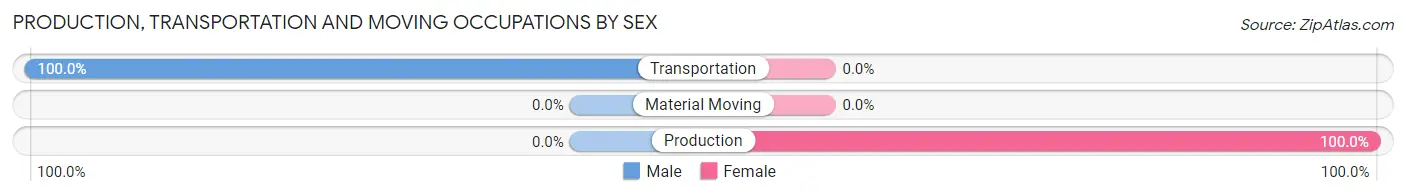
| Occupation | Male | Female |
| Production | 0 (0.0%) | 31 (100.0%) |
| Transportation | 7 (100.0%) | 0 (0.0%) |
| Material Moving | 0 (0.0%) | 0 (0.0%) |
| Total (Category) | 7 (18.4%) | 31 (81.6%) |
| Total (Overall) | 165 (67.9%) | 78 (32.1%) |
Employment Industries by Sex in Bunkerville
Employment Industries in Bunkerville
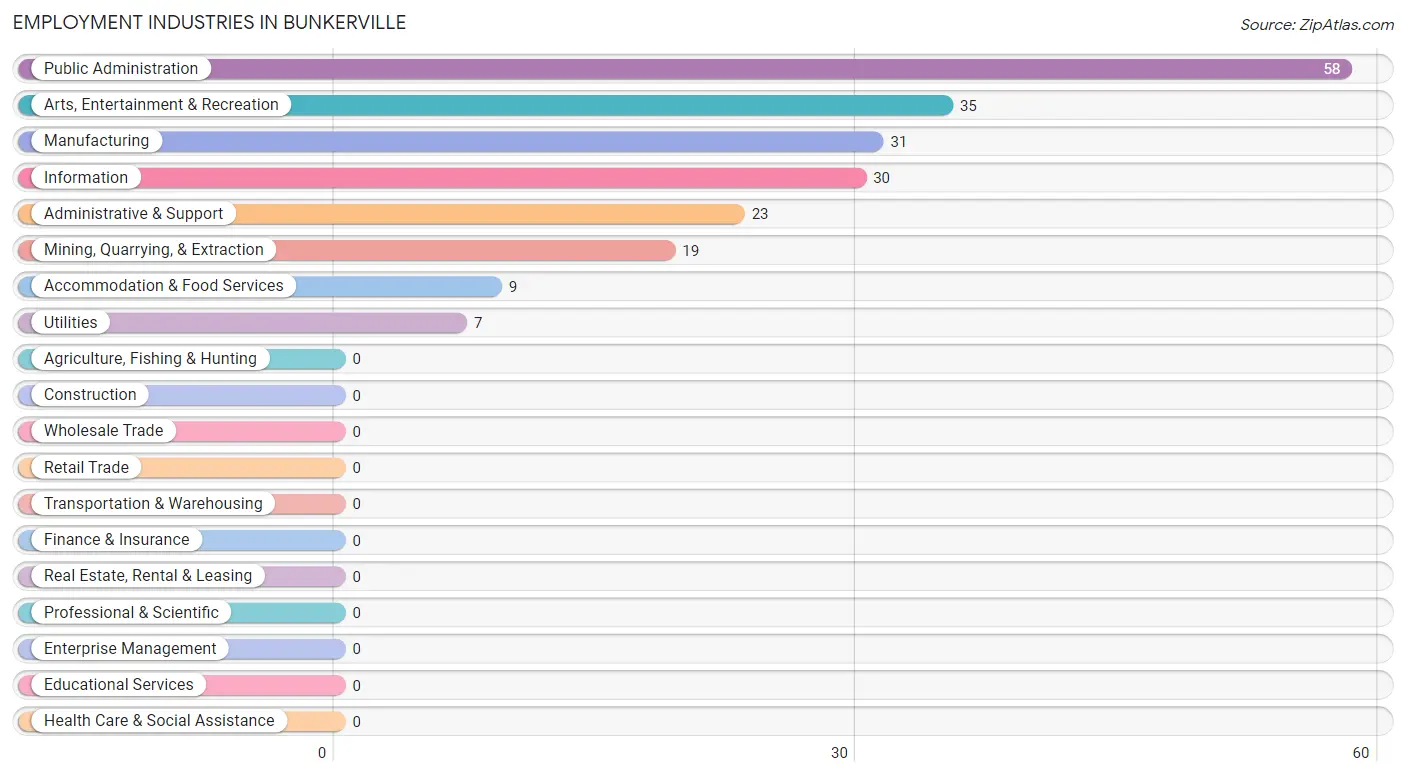
The major employment industries in Bunkerville include Public Administration (58 | 23.9%), Arts, Entertainment & Recreation (35 | 14.4%), Manufacturing (31 | 12.8%), Information (30 | 12.3%), and Administrative & Support (23 | 9.5%).
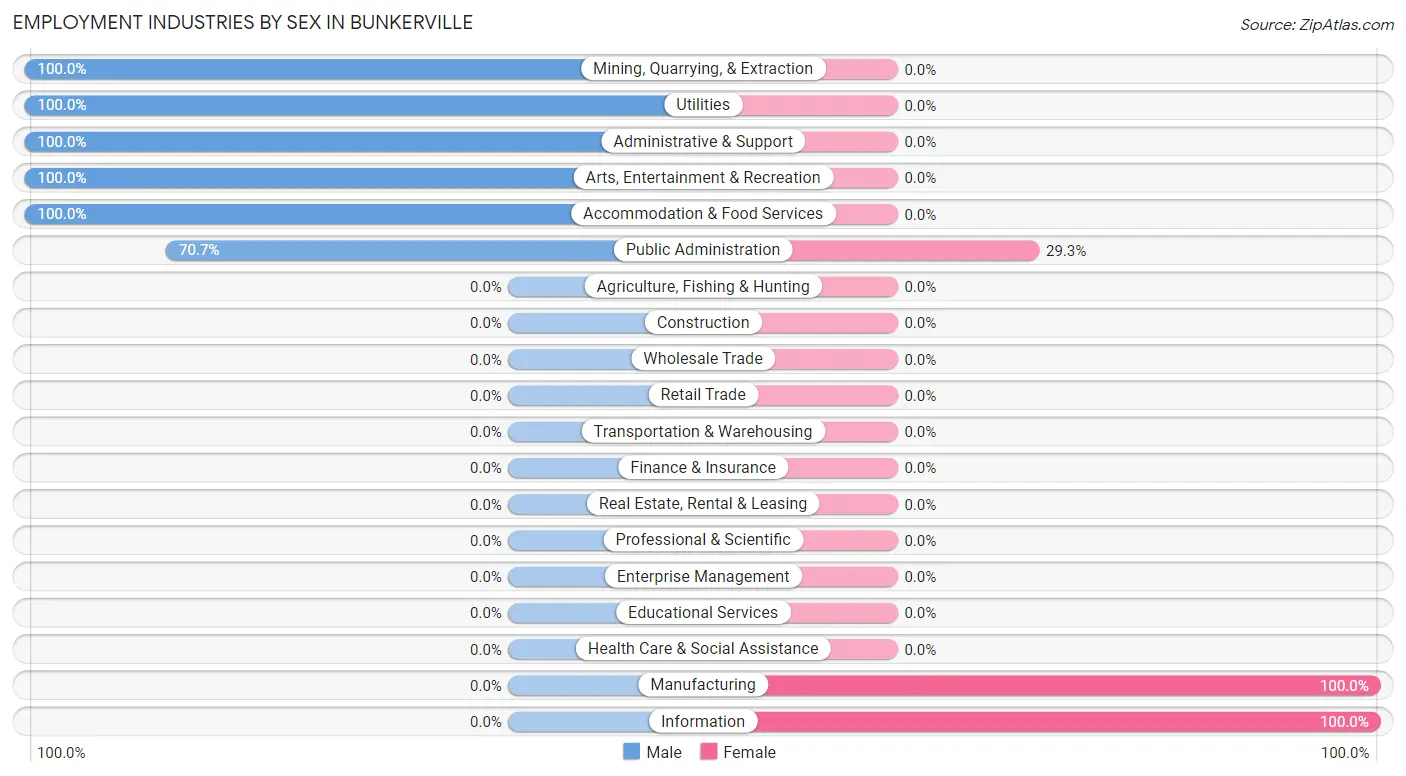
Employment Industries by Sex in Bunkerville
The Bunkerville industries that see more men than women are Mining, Quarrying, & Extraction (100.0%), Utilities (100.0%), and Administrative & Support (100.0%), whereas the industries that tend to have a higher number of women are Manufacturing (100.0%), Information (100.0%), and Public Administration (29.3%).
| Industry | Male | Female |
| Agriculture, Fishing & Hunting | 0 (0.0%) | 0 (0.0%) |
| Mining, Quarrying, & Extraction | 19 (100.0%) | 0 (0.0%) |
| Construction | 0 (0.0%) | 0 (0.0%) |
| Manufacturing | 0 (0.0%) | 31 (100.0%) |
| Wholesale Trade | 0 (0.0%) | 0 (0.0%) |
| Retail Trade | 0 (0.0%) | 0 (0.0%) |
| Transportation & Warehousing | 0 (0.0%) | 0 (0.0%) |
| Utilities | 7 (100.0%) | 0 (0.0%) |
| Information | 0 (0.0%) | 30 (100.0%) |
| Finance & Insurance | 0 (0.0%) | 0 (0.0%) |
| Real Estate, Rental & Leasing | 0 (0.0%) | 0 (0.0%) |
| Professional & Scientific | 0 (0.0%) | 0 (0.0%) |
| Enterprise Management | 0 (0.0%) | 0 (0.0%) |
| Administrative & Support | 23 (100.0%) | 0 (0.0%) |
| Educational Services | 0 (0.0%) | 0 (0.0%) |
| Health Care & Social Assistance | 0 (0.0%) | 0 (0.0%) |
| Arts, Entertainment & Recreation | 35 (100.0%) | 0 (0.0%) |
| Accommodation & Food Services | 9 (100.0%) | 0 (0.0%) |
| Public Administration | 41 (70.7%) | 17 (29.3%) |
| Total | 165 (67.9%) | 78 (32.1%) |
Education in Bunkerville
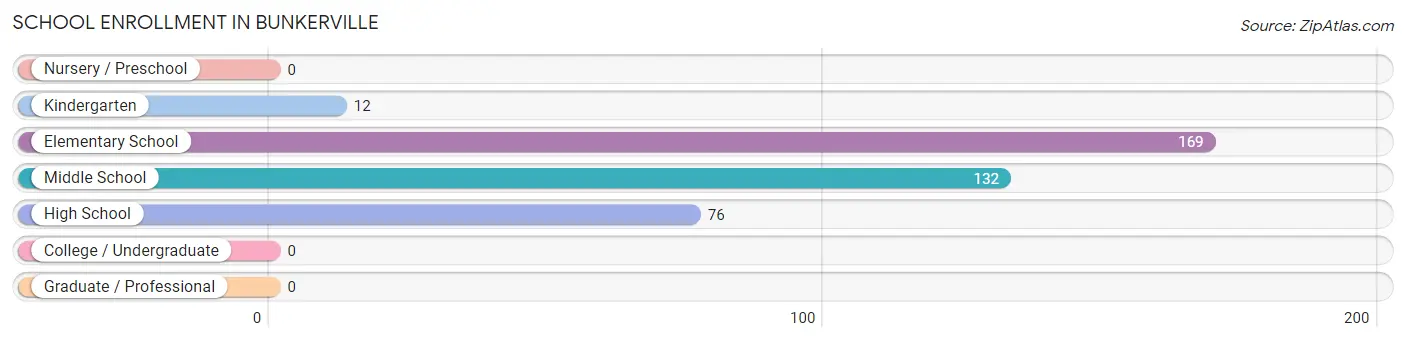
School Enrollment in Bunkerville
The most common levels of schooling among the 389 students in Bunkerville are elementary school (169 | 43.4%), middle school (132 | 33.9%), and high school (76 | 19.5%).
| School Level | # Students | % Students |
| Nursery / Preschool | 0 | 0.0% |
| Kindergarten | 12 | 3.1% |
| Elementary School | 169 | 43.4% |
| Middle School | 132 | 33.9% |
| High School | 76 | 19.5% |
| College / Undergraduate | 0 | 0.0% |
| Graduate / Professional | 0 | 0.0% |
| Total | 389 | 100.0% |
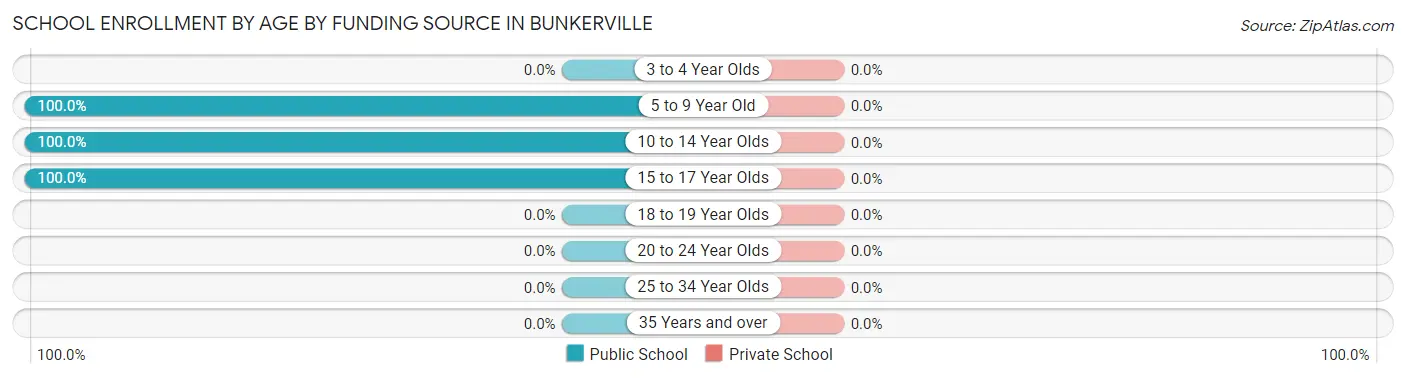
School Enrollment by Age by Funding Source in Bunkerville
| Age Bracket | Public School | Private School |
| 3 to 4 Year Olds | 0 (0.0%) | 0 (0.0%) |
| 5 to 9 Year Old | 181 (100.0%) | 0 (0.0%) |
| 10 to 14 Year Olds | 132 (100.0%) | 0 (0.0%) |
| 15 to 17 Year Olds | 76 (100.0%) | 0 (0.0%) |
| 18 to 19 Year Olds | 0 (0.0%) | 0 (0.0%) |
| 20 to 24 Year Olds | 0 (0.0%) | 0 (0.0%) |
| 25 to 34 Year Olds | 0 (0.0%) | 0 (0.0%) |
| 35 Years and over | 0 (0.0%) | 0 (0.0%) |
| Total | 389 (100.0%) | 0 (0.0%) |
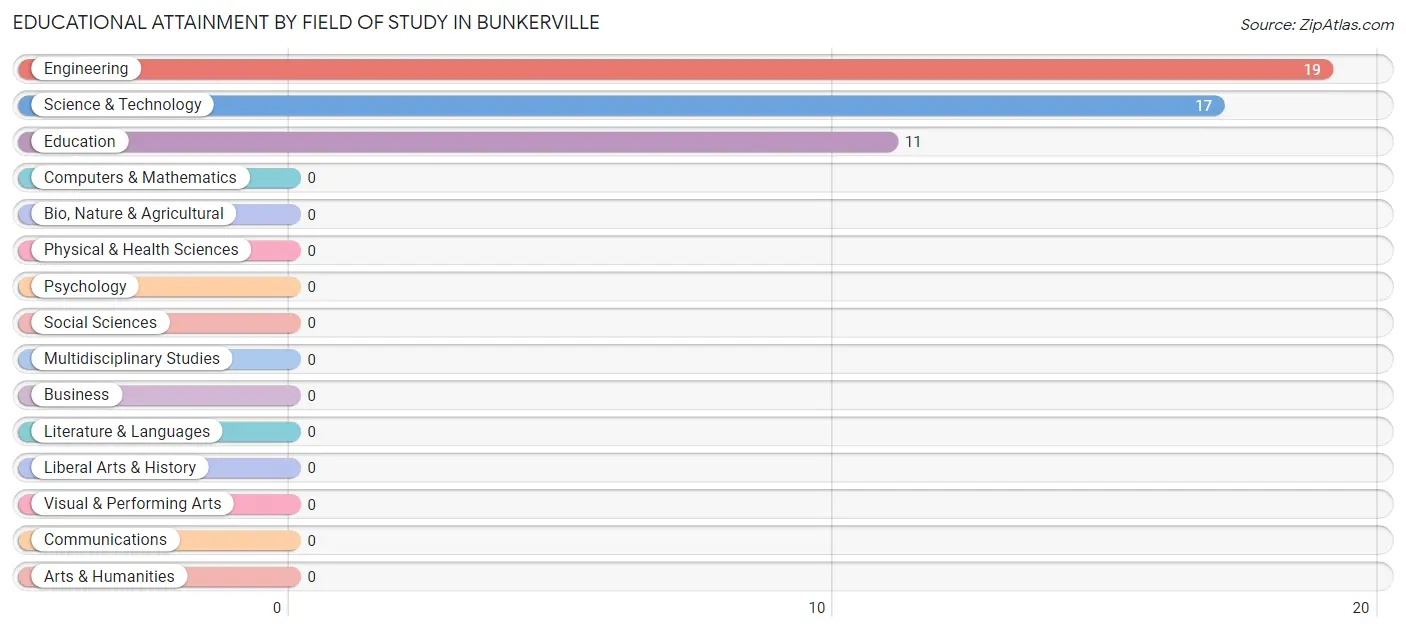
Educational Attainment by Field of Study in Bunkerville
Engineering (19 | 40.4%), science & technology (17 | 36.2%), and education (11 | 23.4%) are the most common fields of study among 47 individuals in Bunkerville who have obtained a bachelor's degree or higher.
| Field of Study | # Graduates | % Graduates |
| Computers & Mathematics | 0 | 0.0% |
| Bio, Nature & Agricultural | 0 | 0.0% |
| Physical & Health Sciences | 0 | 0.0% |
| Psychology | 0 | 0.0% |
| Social Sciences | 0 | 0.0% |
| Engineering | 19 | 40.4% |
| Multidisciplinary Studies | 0 | 0.0% |
| Science & Technology | 17 | 36.2% |
| Business | 0 | 0.0% |
| Education | 11 | 23.4% |
| Literature & Languages | 0 | 0.0% |
| Liberal Arts & History | 0 | 0.0% |
| Visual & Performing Arts | 0 | 0.0% |
| Communications | 0 | 0.0% |
| Arts & Humanities | 0 | 0.0% |
| Total | 47 | 100.0% |
Transportation & Commute in Bunkerville
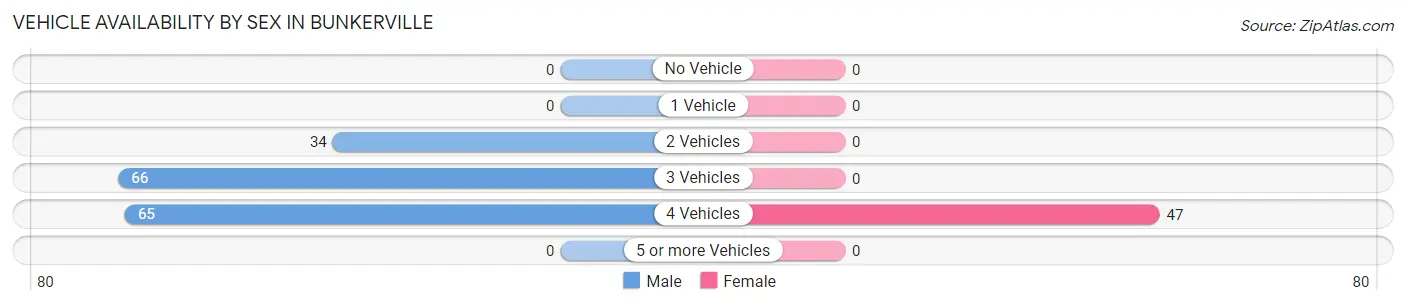
Vehicle Availability by Sex in Bunkerville
The most prevalent vehicle ownership categories in Bunkerville are males with 3 vehicles (66, accounting for 40.0%) and females with 3 vehicles (0, making up 140.4%).
| Vehicles Available | Male | Female |
| No Vehicle | 0 (0.0%) | 0 (0.0%) |
| 1 Vehicle | 0 (0.0%) | 0 (0.0%) |
| 2 Vehicles | 34 (20.6%) | 0 (0.0%) |
| 3 Vehicles | 66 (40.0%) | 0 (0.0%) |
| 4 Vehicles | 65 (39.4%) | 47 (100.0%) |
| 5 or more Vehicles | 0 (0.0%) | 0 (0.0%) |
| Total | 165 (100.0%) | 47 (100.0%) |
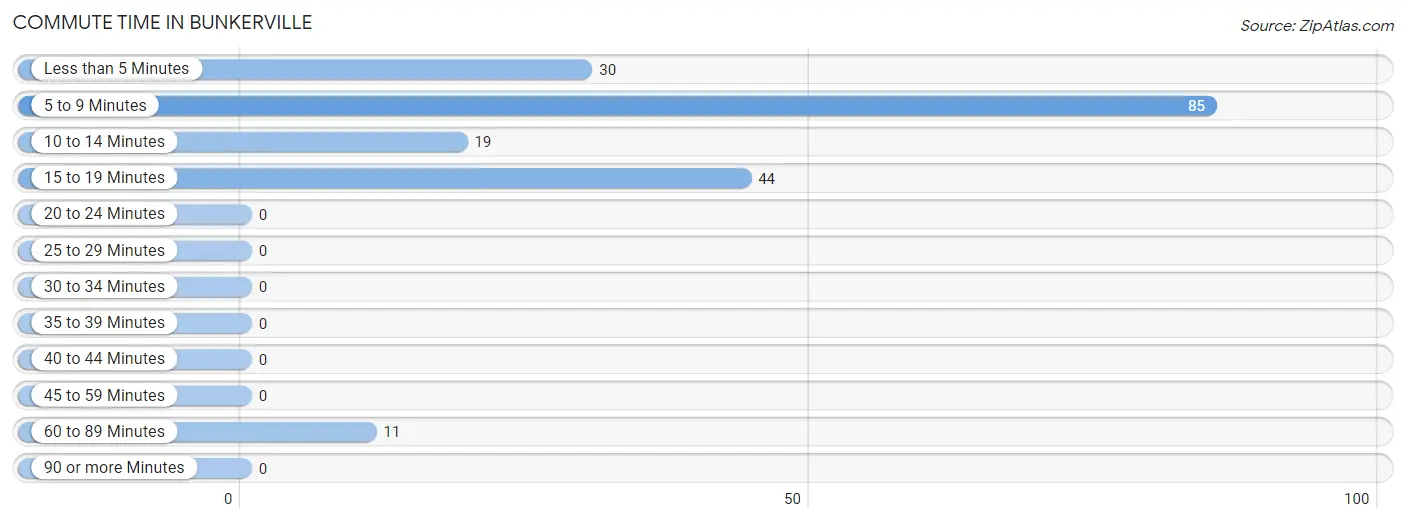
Commute Time in Bunkerville
The most frequently occuring commute durations in Bunkerville are 5 to 9 minutes (85 commuters, 45.0%), 15 to 19 minutes (44 commuters, 23.3%), and less than 5 minutes (30 commuters, 15.9%).
| Commute Time | # Commuters | % Commuters |
| Less than 5 Minutes | 30 | 15.9% |
| 5 to 9 Minutes | 85 | 45.0% |
| 10 to 14 Minutes | 19 | 10.1% |
| 15 to 19 Minutes | 44 | 23.3% |
| 20 to 24 Minutes | 0 | 0.0% |
| 25 to 29 Minutes | 0 | 0.0% |
| 30 to 34 Minutes | 0 | 0.0% |
| 35 to 39 Minutes | 0 | 0.0% |
| 40 to 44 Minutes | 0 | 0.0% |
| 45 to 59 Minutes | 0 | 0.0% |
| 60 to 89 Minutes | 11 | 5.8% |
| 90 or more Minutes | 0 | 0.0% |
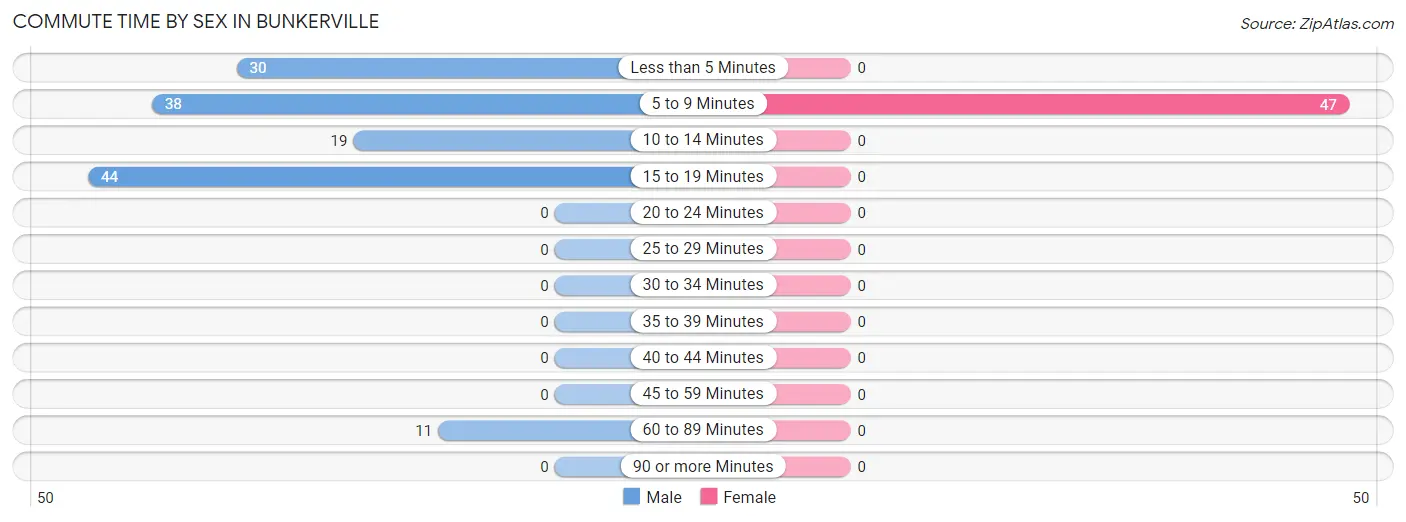
Commute Time by Sex in Bunkerville
The most common commute times in Bunkerville are 15 to 19 minutes (44 commuters, 31.0%) for males and 5 to 9 minutes (47 commuters, 100.0%) for females.
| Commute Time | Male | Female |
| Less than 5 Minutes | 30 (21.1%) | 0 (0.0%) |
| 5 to 9 Minutes | 38 (26.8%) | 47 (100.0%) |
| 10 to 14 Minutes | 19 (13.4%) | 0 (0.0%) |
| 15 to 19 Minutes | 44 (31.0%) | 0 (0.0%) |
| 20 to 24 Minutes | 0 (0.0%) | 0 (0.0%) |
| 25 to 29 Minutes | 0 (0.0%) | 0 (0.0%) |
| 30 to 34 Minutes | 0 (0.0%) | 0 (0.0%) |
| 35 to 39 Minutes | 0 (0.0%) | 0 (0.0%) |
| 40 to 44 Minutes | 0 (0.0%) | 0 (0.0%) |
| 45 to 59 Minutes | 0 (0.0%) | 0 (0.0%) |
| 60 to 89 Minutes | 11 (7.7%) | 0 (0.0%) |
| 90 or more Minutes | 0 (0.0%) | 0 (0.0%) |
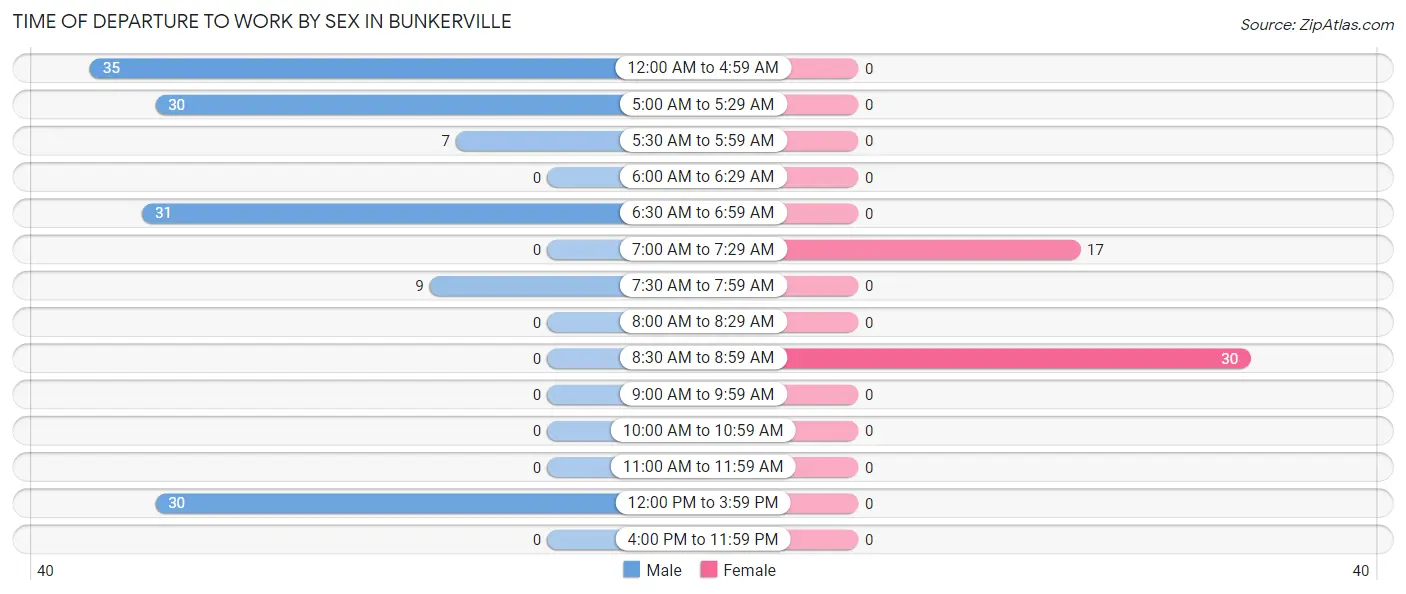
Time of Departure to Work by Sex in Bunkerville
The most frequent times of departure to work in Bunkerville are 12:00 AM to 4:59 AM (35, 24.6%) for males and 8:30 AM to 8:59 AM (30, 63.8%) for females.
| Time of Departure | Male | Female |
| 12:00 AM to 4:59 AM | 35 (24.6%) | 0 (0.0%) |
| 5:00 AM to 5:29 AM | 30 (21.1%) | 0 (0.0%) |
| 5:30 AM to 5:59 AM | 7 (4.9%) | 0 (0.0%) |
| 6:00 AM to 6:29 AM | 0 (0.0%) | 0 (0.0%) |
| 6:30 AM to 6:59 AM | 31 (21.8%) | 0 (0.0%) |
| 7:00 AM to 7:29 AM | 0 (0.0%) | 17 (36.2%) |
| 7:30 AM to 7:59 AM | 9 (6.3%) | 0 (0.0%) |
| 8:00 AM to 8:29 AM | 0 (0.0%) | 0 (0.0%) |
| 8:30 AM to 8:59 AM | 0 (0.0%) | 30 (63.8%) |
| 9:00 AM to 9:59 AM | 0 (0.0%) | 0 (0.0%) |
| 10:00 AM to 10:59 AM | 0 (0.0%) | 0 (0.0%) |
| 11:00 AM to 11:59 AM | 0 (0.0%) | 0 (0.0%) |
| 12:00 PM to 3:59 PM | 30 (21.1%) | 0 (0.0%) |
| 4:00 PM to 11:59 PM | 0 (0.0%) | 0 (0.0%) |
| Total | 142 (100.0%) | 47 (100.0%) |
Housing Occupancy in Bunkerville
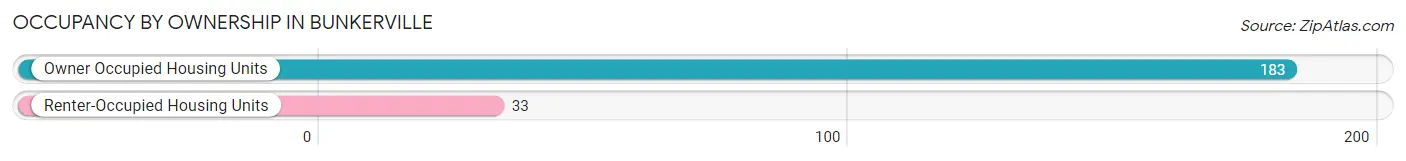
Occupancy by Ownership in Bunkerville
Of the total 216 dwellings in Bunkerville, owner-occupied units account for 183 (84.7%), while renter-occupied units make up 33 (15.3%).
| Occupancy | # Housing Units | % Housing Units |
| Owner Occupied Housing Units | 183 | 84.7% |
| Renter-Occupied Housing Units | 33 | 15.3% |
| Total Occupied Housing Units | 216 | 100.0% |
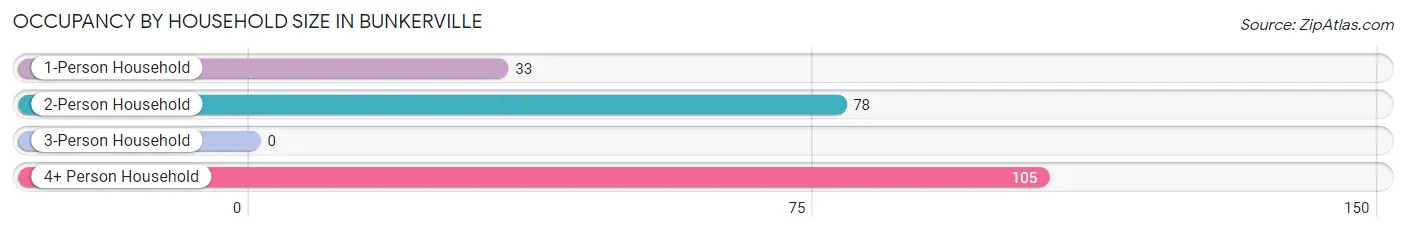
Occupancy by Household Size in Bunkerville
| Household Size | # Housing Units | % Housing Units |
| 1-Person Household | 33 | 15.3% |
| 2-Person Household | 78 | 36.1% |
| 3-Person Household | 0 | 0.0% |
| 4+ Person Household | 105 | 48.6% |
| Total Housing Units | 216 | 100.0% |
Occupancy by Ownership by Household Size in Bunkerville
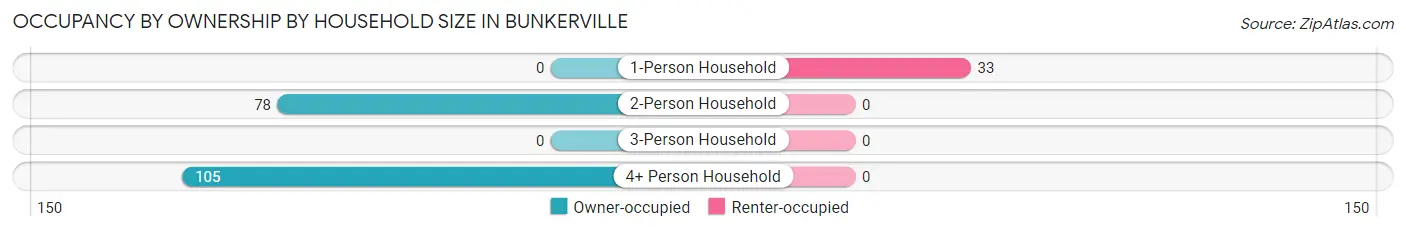
| Household Size | Owner-occupied | Renter-occupied |
| 1-Person Household | 0 (0.0%) | 33 (100.0%) |
| 2-Person Household | 78 (100.0%) | 0 (0.0%) |
| 3-Person Household | 0 (0.0%) | 0 (0.0%) |
| 4+ Person Household | 105 (100.0%) | 0 (0.0%) |
| Total Housing Units | 183 (84.7%) | 33 (15.3%) |
Occupancy by Educational Attainment in Bunkerville
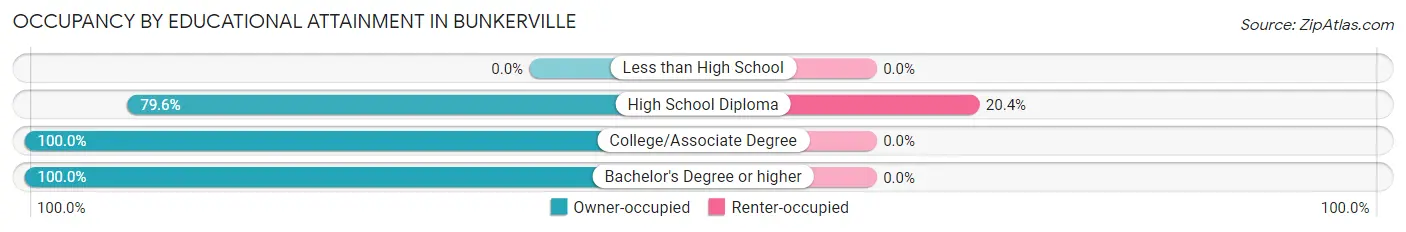
| Household Size | Owner-occupied | Renter-occupied |
| Less than High School | 0 (0.0%) | 0 (0.0%) |
| High School Diploma | 129 (79.6%) | 33 (20.4%) |
| College/Associate Degree | 18 (100.0%) | 0 (0.0%) |
| Bachelor's Degree or higher | 36 (100.0%) | 0 (0.0%) |
Occupancy by Age of Householder in Bunkerville
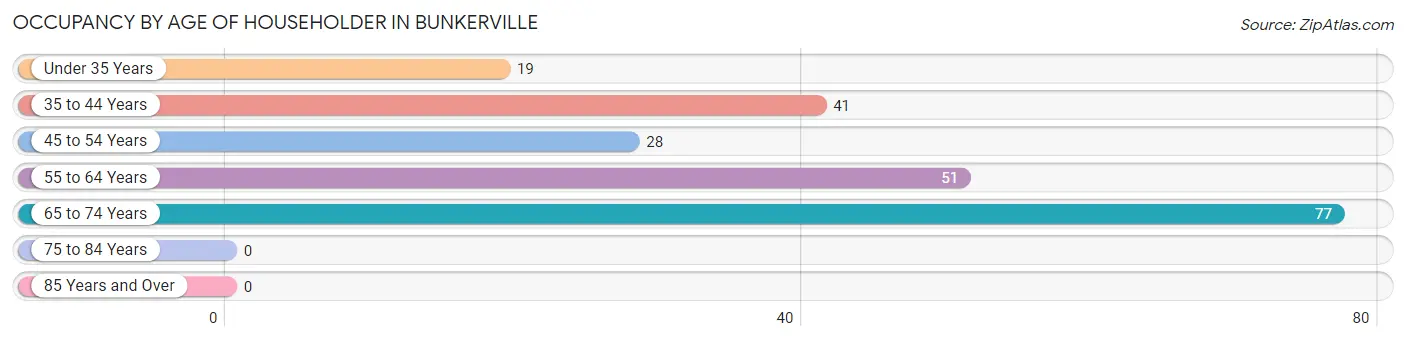
| Age Bracket | # Households | % Households |
| Under 35 Years | 19 | 8.8% |
| 35 to 44 Years | 41 | 19.0% |
| 45 to 54 Years | 28 | 13.0% |
| 55 to 64 Years | 51 | 23.6% |
| 65 to 74 Years | 77 | 35.6% |
| 75 to 84 Years | 0 | 0.0% |
| 85 Years and Over | 0 | 0.0% |
| Total | 216 | 100.0% |
Housing Finances in Bunkerville
Median Income by Occupancy in Bunkerville
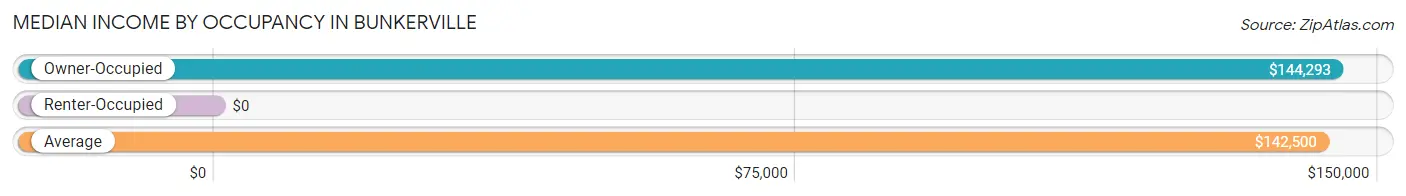
| Occupancy Type | # Households | Median Income |
| Owner-Occupied | 183 (84.7%) | $144,293 |
| Renter-Occupied | 33 (15.3%) | $0 |
| Average | 216 (100.0%) | $142,500 |
Occupancy by Householder Income Bracket in Bunkerville
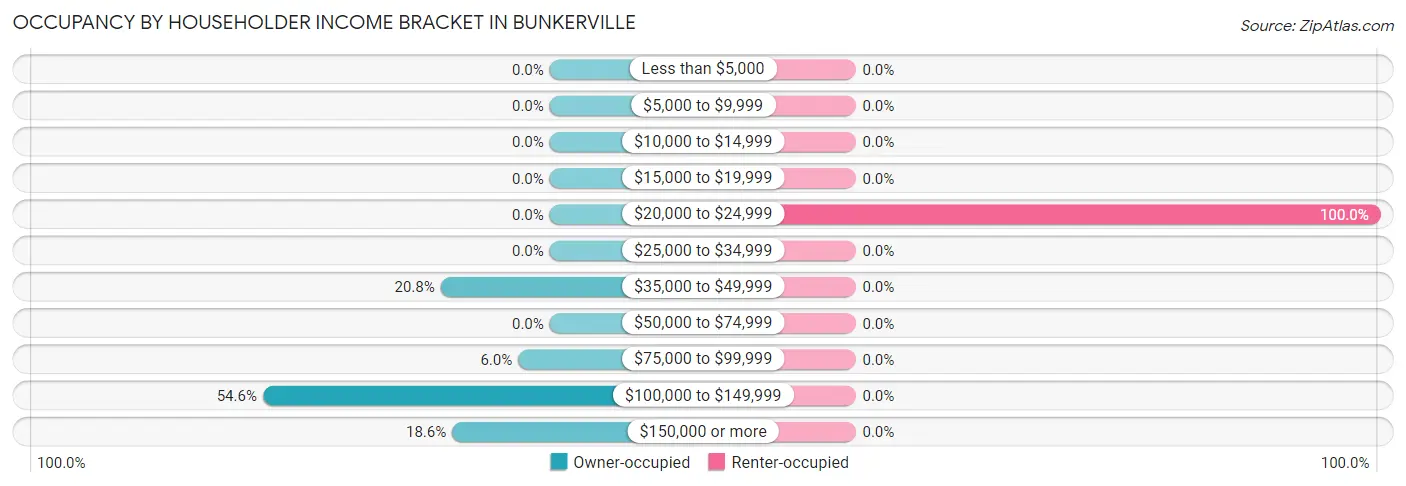
| Income Bracket | Owner-occupied | Renter-occupied |
| Less than $5,000 | 0 (0.0%) | 0 (0.0%) |
| $5,000 to $9,999 | 0 (0.0%) | 0 (0.0%) |
| $10,000 to $14,999 | 0 (0.0%) | 0 (0.0%) |
| $15,000 to $19,999 | 0 (0.0%) | 0 (0.0%) |
| $20,000 to $24,999 | 0 (0.0%) | 33 (100.0%) |
| $25,000 to $34,999 | 0 (0.0%) | 0 (0.0%) |
| $35,000 to $49,999 | 38 (20.8%) | 0 (0.0%) |
| $50,000 to $74,999 | 0 (0.0%) | 0 (0.0%) |
| $75,000 to $99,999 | 11 (6.0%) | 0 (0.0%) |
| $100,000 to $149,999 | 100 (54.6%) | 0 (0.0%) |
| $150,000 or more | 34 (18.6%) | 0 (0.0%) |
| Total | 183 (100.0%) | 33 (100.0%) |
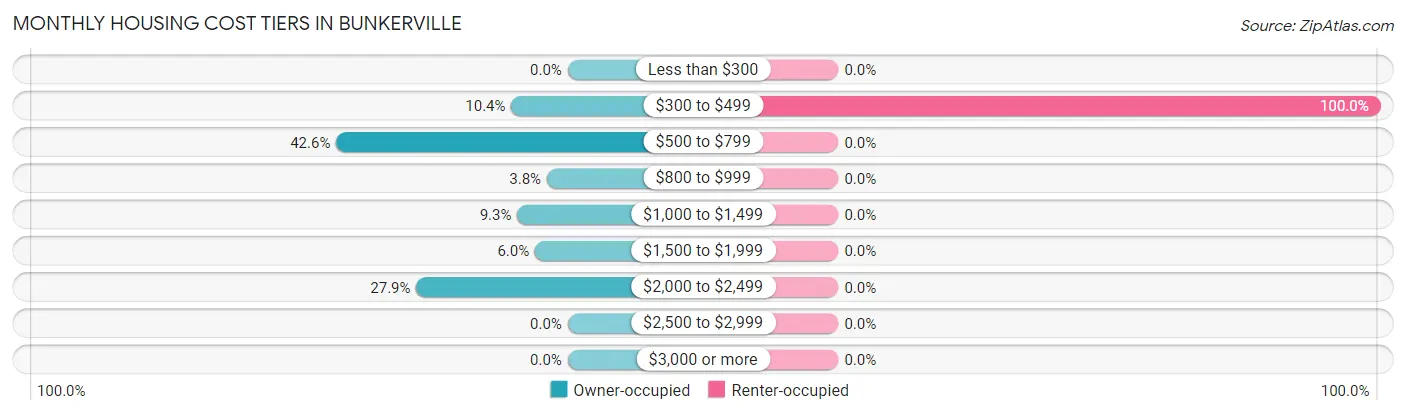
Monthly Housing Cost Tiers in Bunkerville
| Monthly Cost | Owner-occupied | Renter-occupied |
| Less than $300 | 0 (0.0%) | 0 (0.0%) |
| $300 to $499 | 19 (10.4%) | 33 (100.0%) |
| $500 to $799 | 78 (42.6%) | 0 (0.0%) |
| $800 to $999 | 7 (3.8%) | 0 (0.0%) |
| $1,000 to $1,499 | 17 (9.3%) | 0 (0.0%) |
| $1,500 to $1,999 | 11 (6.0%) | 0 (0.0%) |
| $2,000 to $2,499 | 51 (27.9%) | 0 (0.0%) |
| $2,500 to $2,999 | 0 (0.0%) | 0 (0.0%) |
| $3,000 or more | 0 (0.0%) | 0 (0.0%) |
| Total | 183 (100.0%) | 33 (100.0%) |
Physical Housing Characteristics in Bunkerville
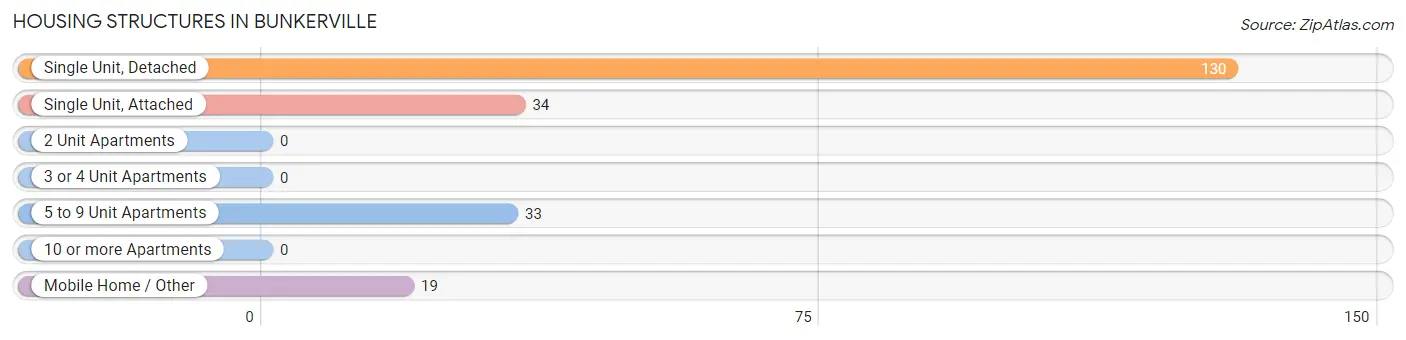
Housing Structures in Bunkerville
| Structure Type | # Housing Units | % Housing Units |
| Single Unit, Detached | 130 | 60.2% |
| Single Unit, Attached | 34 | 15.7% |
| 2 Unit Apartments | 0 | 0.0% |
| 3 or 4 Unit Apartments | 0 | 0.0% |
| 5 to 9 Unit Apartments | 33 | 15.3% |
| 10 or more Apartments | 0 | 0.0% |
| Mobile Home / Other | 19 | 8.8% |
| Total | 216 | 100.0% |
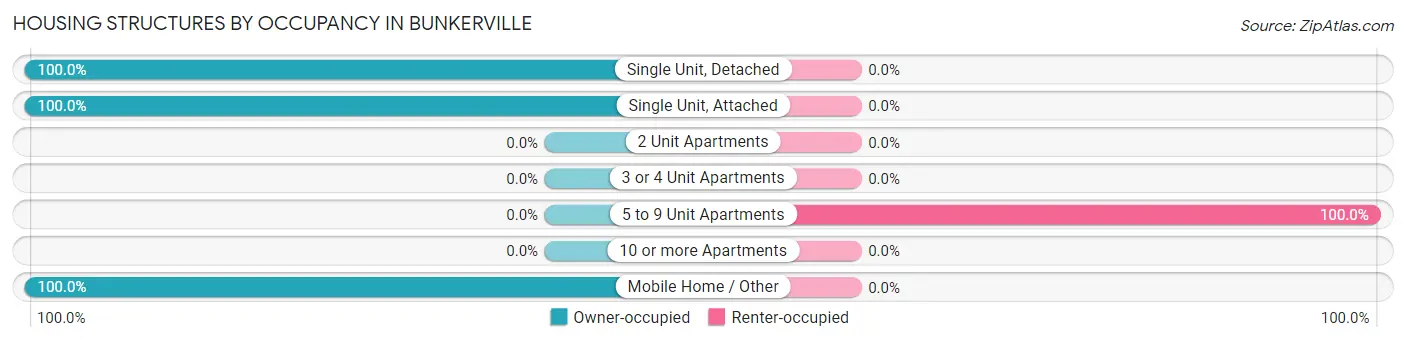
Housing Structures by Occupancy in Bunkerville
| Structure Type | Owner-occupied | Renter-occupied |
| Single Unit, Detached | 130 (100.0%) | 0 (0.0%) |
| Single Unit, Attached | 34 (100.0%) | 0 (0.0%) |
| 2 Unit Apartments | 0 (0.0%) | 0 (0.0%) |
| 3 or 4 Unit Apartments | 0 (0.0%) | 0 (0.0%) |
| 5 to 9 Unit Apartments | 0 (0.0%) | 33 (100.0%) |
| 10 or more Apartments | 0 (0.0%) | 0 (0.0%) |
| Mobile Home / Other | 19 (100.0%) | 0 (0.0%) |
| Total | 183 (84.7%) | 33 (15.3%) |
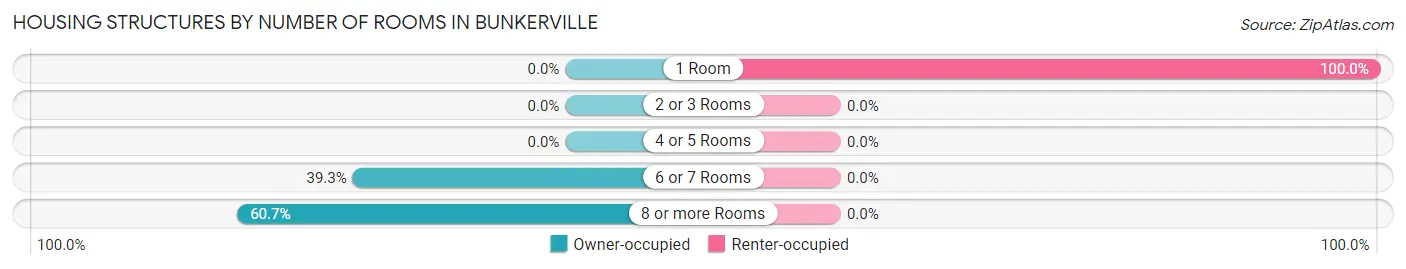
Housing Structures by Number of Rooms in Bunkerville
| Number of Rooms | Owner-occupied | Renter-occupied |
| 1 Room | 0 (0.0%) | 33 (100.0%) |
| 2 or 3 Rooms | 0 (0.0%) | 0 (0.0%) |
| 4 or 5 Rooms | 0 (0.0%) | 0 (0.0%) |
| 6 or 7 Rooms | 72 (39.3%) | 0 (0.0%) |
| 8 or more Rooms | 111 (60.7%) | 0 (0.0%) |
| Total | 183 (100.0%) | 33 (100.0%) |
Housing Structure by Heating Type in Bunkerville
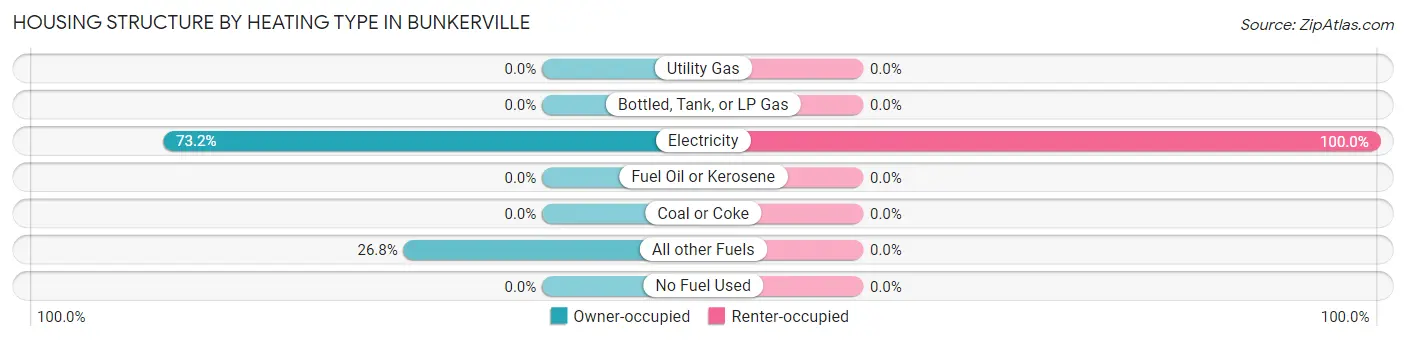
| Heating Type | Owner-occupied | Renter-occupied |
| Utility Gas | 0 (0.0%) | 0 (0.0%) |
| Bottled, Tank, or LP Gas | 0 (0.0%) | 0 (0.0%) |
| Electricity | 134 (73.2%) | 33 (100.0%) |
| Fuel Oil or Kerosene | 0 (0.0%) | 0 (0.0%) |
| Coal or Coke | 0 (0.0%) | 0 (0.0%) |
| All other Fuels | 49 (26.8%) | 0 (0.0%) |
| No Fuel Used | 0 (0.0%) | 0 (0.0%) |
| Total | 183 (100.0%) | 33 (100.0%) |
Household Vehicle Usage in Bunkerville
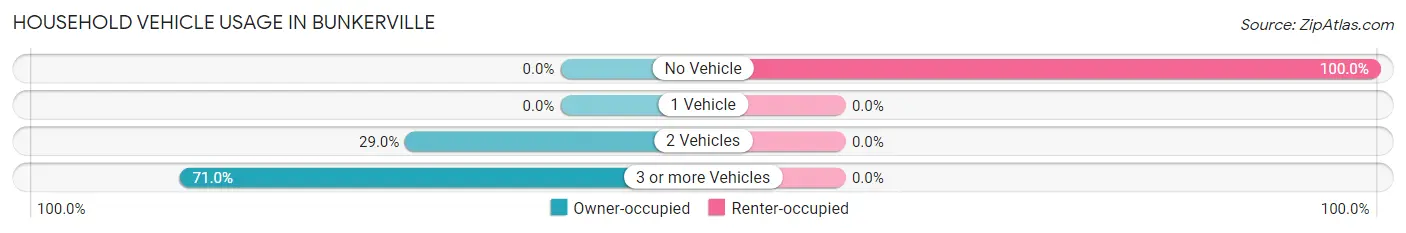
| Vehicles per Household | Owner-occupied | Renter-occupied |
| No Vehicle | 0 (0.0%) | 33 (100.0%) |
| 1 Vehicle | 0 (0.0%) | 0 (0.0%) |
| 2 Vehicles | 53 (29.0%) | 0 (0.0%) |
| 3 or more Vehicles | 130 (71.0%) | 0 (0.0%) |
| Total | 183 (100.0%) | 33 (100.0%) |
Real Estate & Mortgages in Bunkerville
Real Estate and Mortgage Overview in Bunkerville
| Characteristic | Without Mortgage | With Mortgage |
| Housing Units | 97 | 86 |
| Median Property Value | $268,100 | $566,700 |
| Median Household Income | $143,424 | $0 |
| Monthly Housing Costs | $587 | $0 |
| Real Estate Taxes | $950 | $0 |
Property Value by Mortgage Status in Bunkerville
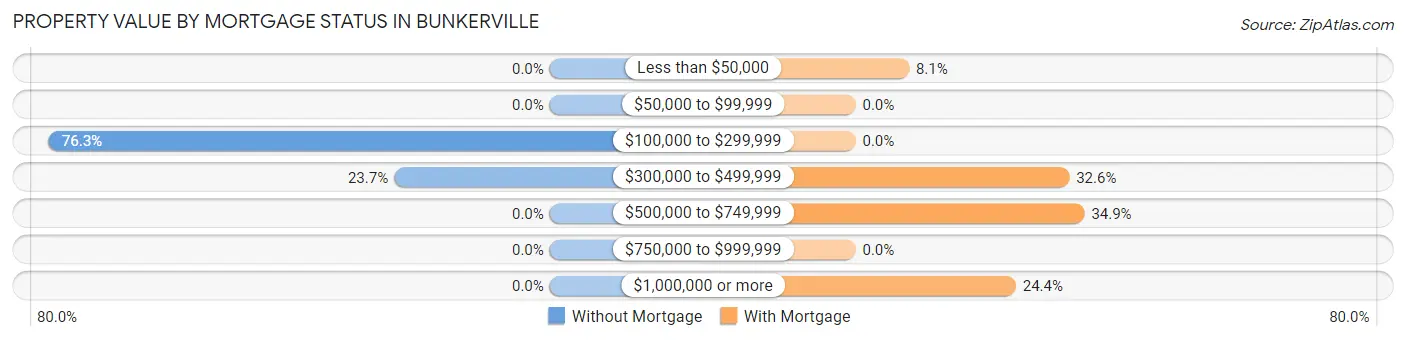
| Property Value | Without Mortgage | With Mortgage |
| Less than $50,000 | 0 (0.0%) | 7 (8.1%) |
| $50,000 to $99,999 | 0 (0.0%) | 0 (0.0%) |
| $100,000 to $299,999 | 74 (76.3%) | 0 (0.0%) |
| $300,000 to $499,999 | 23 (23.7%) | 28 (32.6%) |
| $500,000 to $749,999 | 0 (0.0%) | 30 (34.9%) |
| $750,000 to $999,999 | 0 (0.0%) | 0 (0.0%) |
| $1,000,000 or more | 0 (0.0%) | 21 (24.4%) |
| Total | 97 (100.0%) | 86 (100.0%) |
Household Income by Mortgage Status in Bunkerville
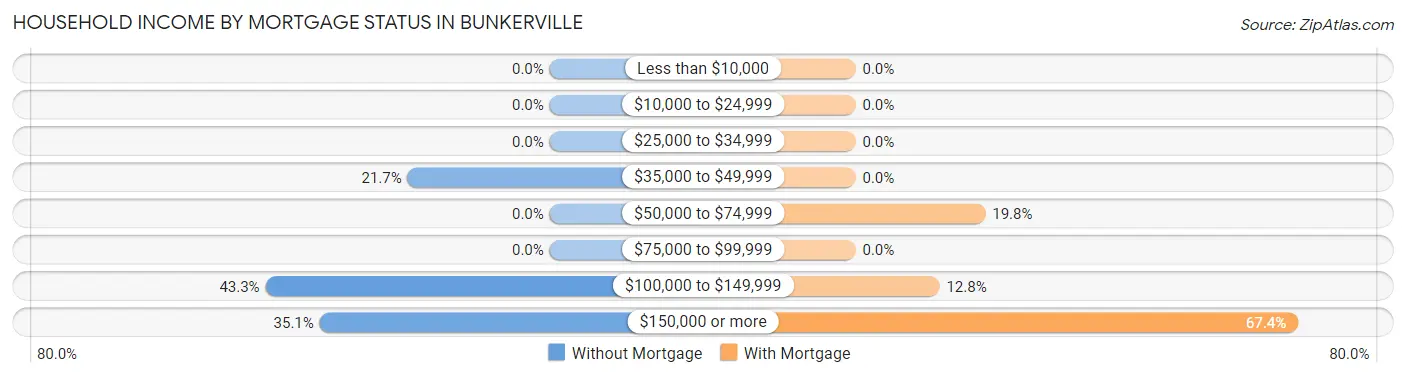
| Household Income | Without Mortgage | With Mortgage |
| Less than $10,000 | 0 (0.0%) | 0 (0.0%) |
| $10,000 to $24,999 | 0 (0.0%) | 0 (0.0%) |
| $25,000 to $34,999 | 0 (0.0%) | 0 (0.0%) |
| $35,000 to $49,999 | 21 (21.6%) | 0 (0.0%) |
| $50,000 to $74,999 | 0 (0.0%) | 17 (19.8%) |
| $75,000 to $99,999 | 0 (0.0%) | 0 (0.0%) |
| $100,000 to $149,999 | 42 (43.3%) | 11 (12.8%) |
| $150,000 or more | 34 (35.0%) | 58 (67.4%) |
| Total | 97 (100.0%) | 86 (100.0%) |
Property Value to Household Income Ratio in Bunkerville
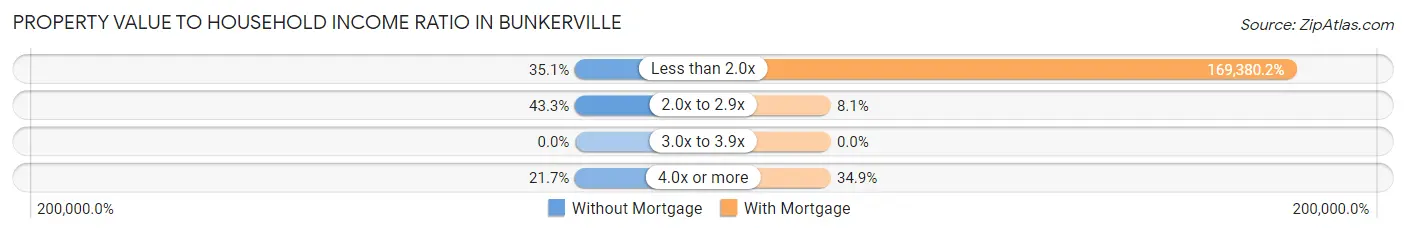
| Value-to-Income Ratio | Without Mortgage | With Mortgage |
| Less than 2.0x | 34 (35.0%) | 145,667 (169,380.2%) |
| 2.0x to 2.9x | 42 (43.3%) | 7 (8.1%) |
| 3.0x to 3.9x | 0 (0.0%) | 0 (0.0%) |
| 4.0x or more | 21 (21.6%) | 30 (34.9%) |
| Total | 97 (100.0%) | 86 (100.0%) |
Real Estate Taxes by Mortgage Status in Bunkerville
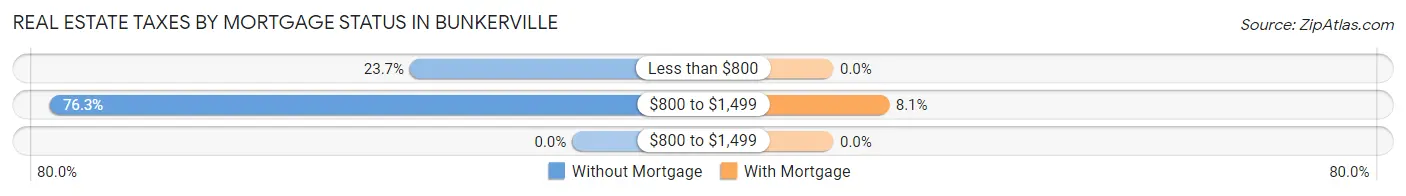
| Property Taxes | Without Mortgage | With Mortgage |
| Less than $800 | 23 (23.7%) | 0 (0.0%) |
| $800 to $1,499 | 74 (76.3%) | 7 (8.1%) |
| $800 to $1,499 | 0 (0.0%) | 0 (0.0%) |
| Total | 97 (100.0%) | 86 (100.0%) |
Health & Disability in Bunkerville
Health Insurance Coverage by Age in Bunkerville
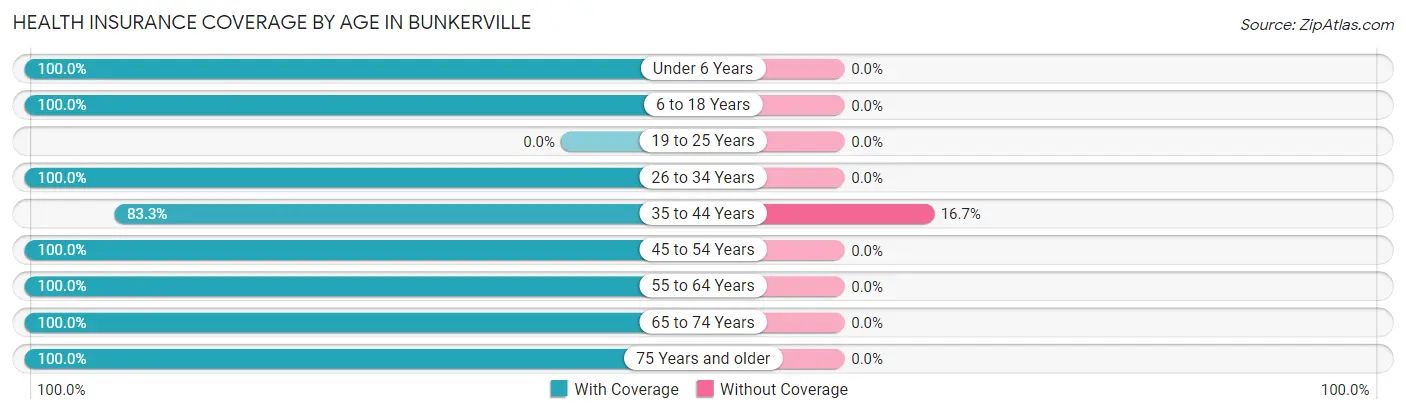
| Age Bracket | With Coverage | Without Coverage |
| Under 6 Years | 99 (100.0%) | 0 (0.0%) |
| 6 to 18 Years | 389 (100.0%) | 0 (0.0%) |
| 19 to 25 Years | 0 (0.0%) | 0 (0.0%) |
| 26 to 34 Years | 59 (100.0%) | 0 (0.0%) |
| 35 to 44 Years | 155 (83.3%) | 31 (16.7%) |
| 45 to 54 Years | 61 (100.0%) | 0 (0.0%) |
| 55 to 64 Years | 93 (100.0%) | 0 (0.0%) |
| 65 to 74 Years | 104 (100.0%) | 0 (0.0%) |
| 75 Years and older | 17 (100.0%) | 0 (0.0%) |
| Total | 977 (96.9%) | 31 (3.1%) |
Health Insurance Coverage by Citizenship Status in Bunkerville
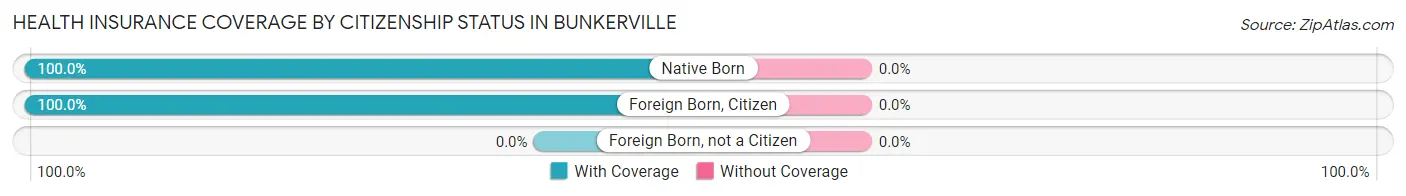
| Citizenship Status | With Coverage | Without Coverage |
| Native Born | 99 (100.0%) | 0 (0.0%) |
| Foreign Born, Citizen | 389 (100.0%) | 0 (0.0%) |
| Foreign Born, not a Citizen | 0 (0.0%) | 0 (0.0%) |
Health Insurance Coverage by Household Income in Bunkerville
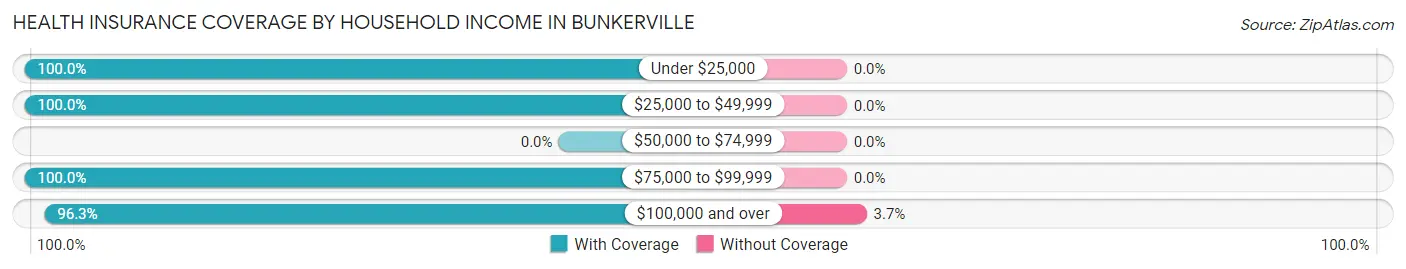
| Household Income | With Coverage | Without Coverage |
| Under $25,000 | 33 (100.0%) | 0 (0.0%) |
| $25,000 to $49,999 | 72 (100.0%) | 0 (0.0%) |
| $50,000 to $74,999 | 0 (0.0%) | 0 (0.0%) |
| $75,000 to $99,999 | 68 (100.0%) | 0 (0.0%) |
| $100,000 and over | 804 (96.3%) | 31 (3.7%) |
Public vs Private Health Insurance Coverage by Age in Bunkerville
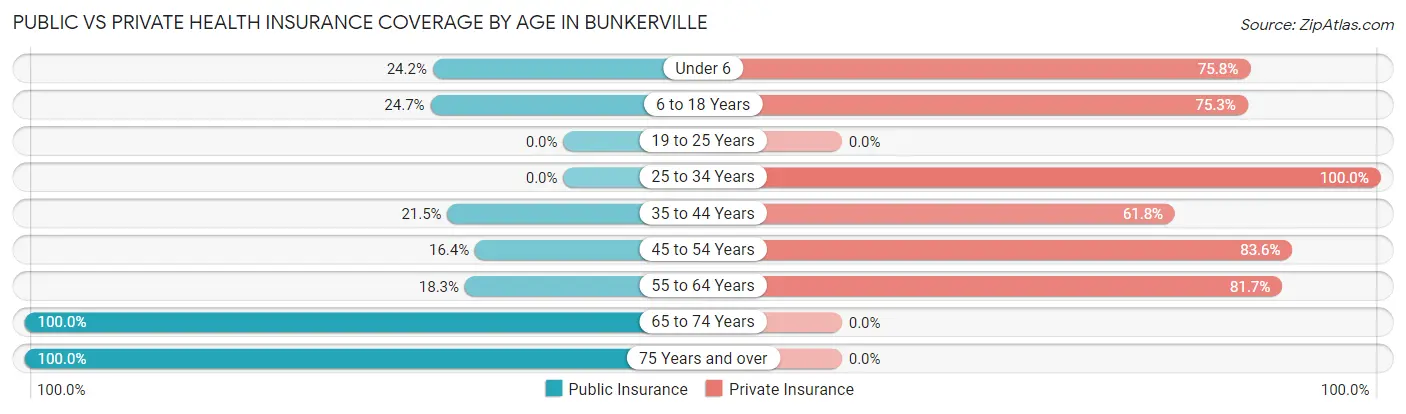
| Age Bracket | Public Insurance | Private Insurance |
| Under 6 | 24 (24.2%) | 75 (75.8%) |
| 6 to 18 Years | 96 (24.7%) | 293 (75.3%) |
| 19 to 25 Years | 0 (0.0%) | 0 (0.0%) |
| 25 to 34 Years | 0 (0.0%) | 59 (100.0%) |
| 35 to 44 Years | 40 (21.5%) | 115 (61.8%) |
| 45 to 54 Years | 10 (16.4%) | 51 (83.6%) |
| 55 to 64 Years | 17 (18.3%) | 76 (81.7%) |
| 65 to 74 Years | 104 (100.0%) | 0 (0.0%) |
| 75 Years and over | 17 (100.0%) | 0 (0.0%) |
| Total | 308 (30.6%) | 669 (66.4%) |
Disability Status by Sex by Age in Bunkerville
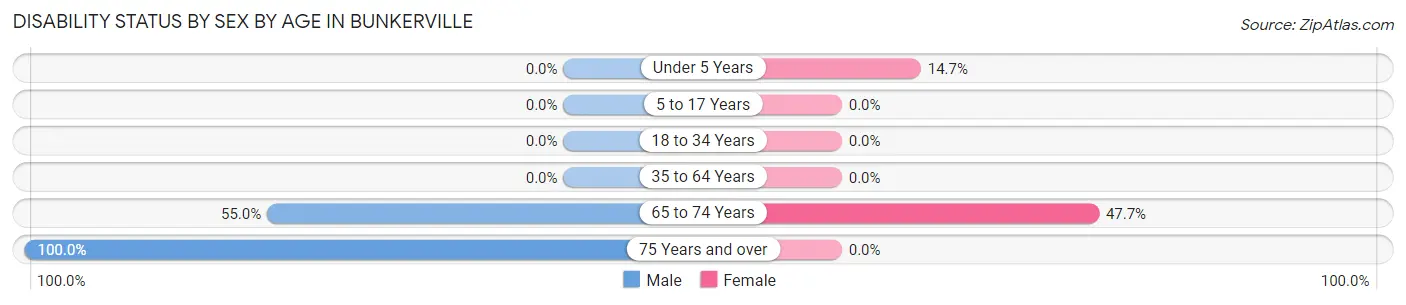
| Age Bracket | Male | Female |
| Under 5 Years | 0 (0.0%) | 11 (14.7%) |
| 5 to 17 Years | 0 (0.0%) | 0 (0.0%) |
| 18 to 34 Years | 0 (0.0%) | 0 (0.0%) |
| 35 to 64 Years | 0 (0.0%) | 0 (0.0%) |
| 65 to 74 Years | 33 (55.0%) | 21 (47.7%) |
| 75 Years and over | 17 (100.0%) | 0 (0.0%) |
Disability Class by Sex by Age in Bunkerville
Disability Class: Hearing Difficulty
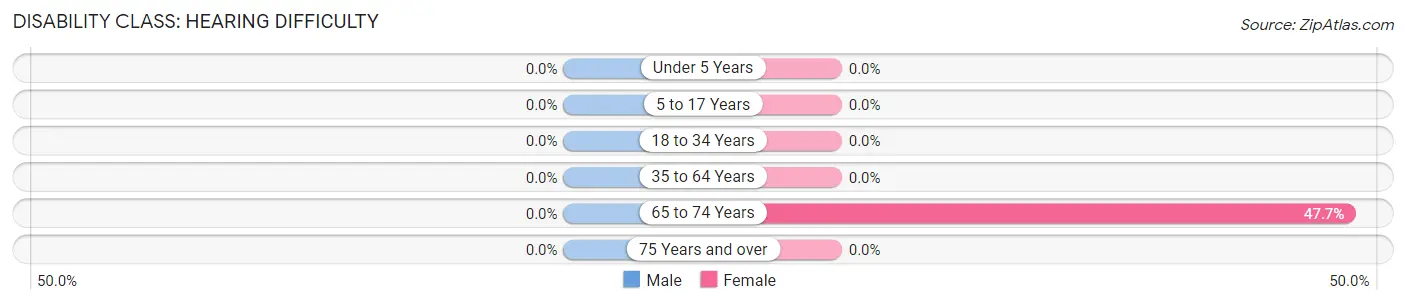
| Age Bracket | Male | Female |
| Under 5 Years | 0 (0.0%) | 0 (0.0%) |
| 5 to 17 Years | 0 (0.0%) | 0 (0.0%) |
| 18 to 34 Years | 0 (0.0%) | 0 (0.0%) |
| 35 to 64 Years | 0 (0.0%) | 0 (0.0%) |
| 65 to 74 Years | 0 (0.0%) | 21 (47.7%) |
| 75 Years and over | 0 (0.0%) | 0 (0.0%) |
Disability Class: Vision Difficulty
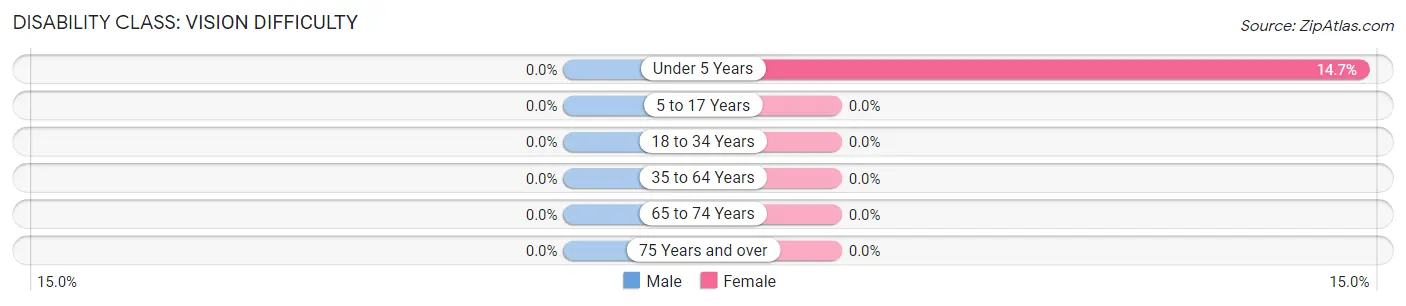
| Age Bracket | Male | Female |
| Under 5 Years | 0 (0.0%) | 11 (14.7%) |
| 5 to 17 Years | 0 (0.0%) | 0 (0.0%) |
| 18 to 34 Years | 0 (0.0%) | 0 (0.0%) |
| 35 to 64 Years | 0 (0.0%) | 0 (0.0%) |
| 65 to 74 Years | 0 (0.0%) | 0 (0.0%) |
| 75 Years and over | 0 (0.0%) | 0 (0.0%) |
Disability Class: Cognitive Difficulty
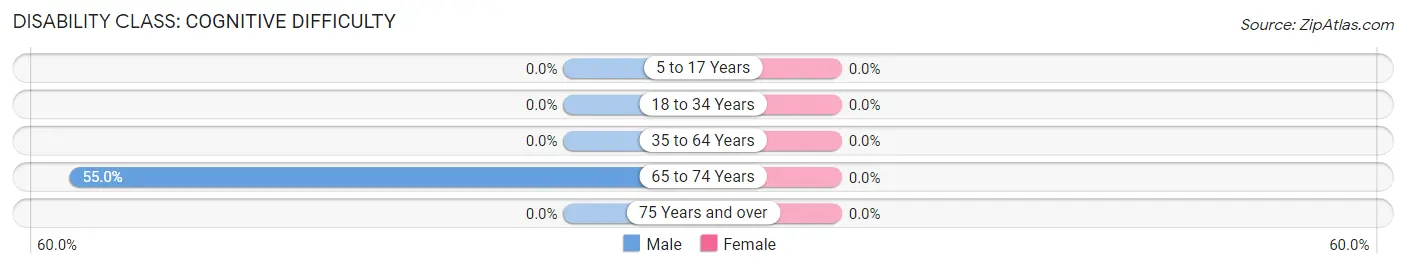
| Age Bracket | Male | Female |
| 5 to 17 Years | 0 (0.0%) | 0 (0.0%) |
| 18 to 34 Years | 0 (0.0%) | 0 (0.0%) |
| 35 to 64 Years | 0 (0.0%) | 0 (0.0%) |
| 65 to 74 Years | 33 (55.0%) | 0 (0.0%) |
| 75 Years and over | 0 (0.0%) | 0 (0.0%) |
Disability Class: Ambulatory Difficulty
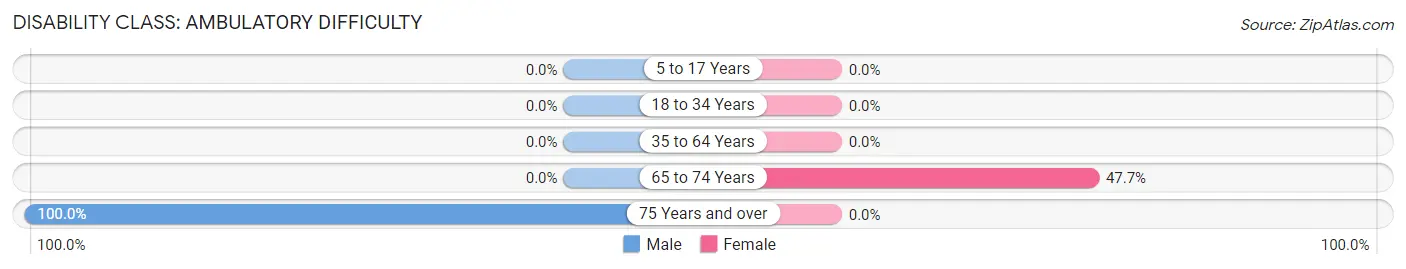
| Age Bracket | Male | Female |
| 5 to 17 Years | 0 (0.0%) | 0 (0.0%) |
| 18 to 34 Years | 0 (0.0%) | 0 (0.0%) |
| 35 to 64 Years | 0 (0.0%) | 0 (0.0%) |
| 65 to 74 Years | 0 (0.0%) | 21 (47.7%) |
| 75 Years and over | 17 (100.0%) | 0 (0.0%) |
Disability Class: Self-Care Difficulty
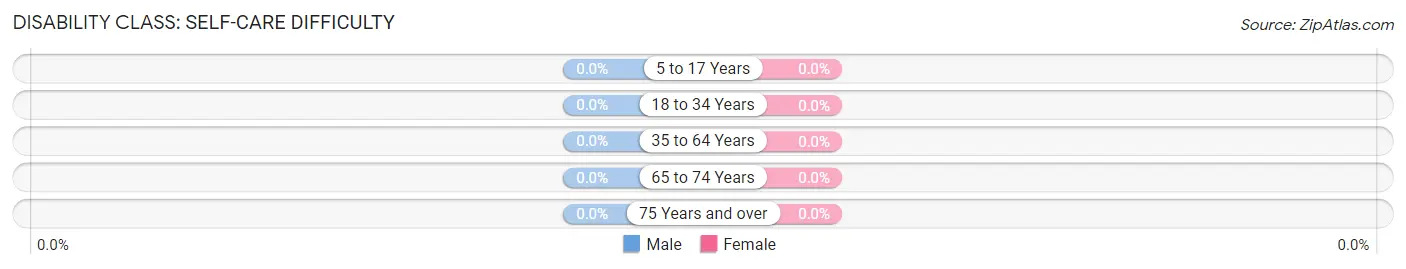
| Age Bracket | Male | Female |
| 5 to 17 Years | 0 (0.0%) | 0 (0.0%) |
| 18 to 34 Years | 0 (0.0%) | 0 (0.0%) |
| 35 to 64 Years | 0 (0.0%) | 0 (0.0%) |
| 65 to 74 Years | 0 (0.0%) | 0 (0.0%) |
| 75 Years and over | 0 (0.0%) | 0 (0.0%) |
Technology Access in Bunkerville
Computing Device Access in Bunkerville
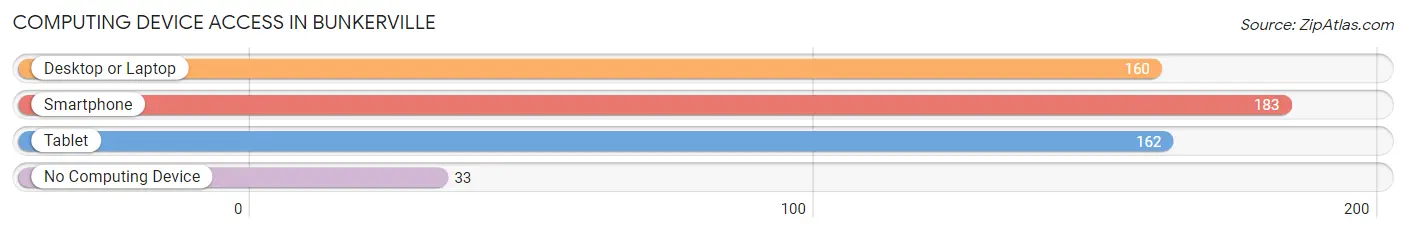
| Device Type | # Households | % Households |
| Desktop or Laptop | 160 | 74.1% |
| Smartphone | 183 | 84.7% |
| Tablet | 162 | 75.0% |
| No Computing Device | 33 | 15.3% |
| Total | 216 | 100.0% |
Internet Access in Bunkerville
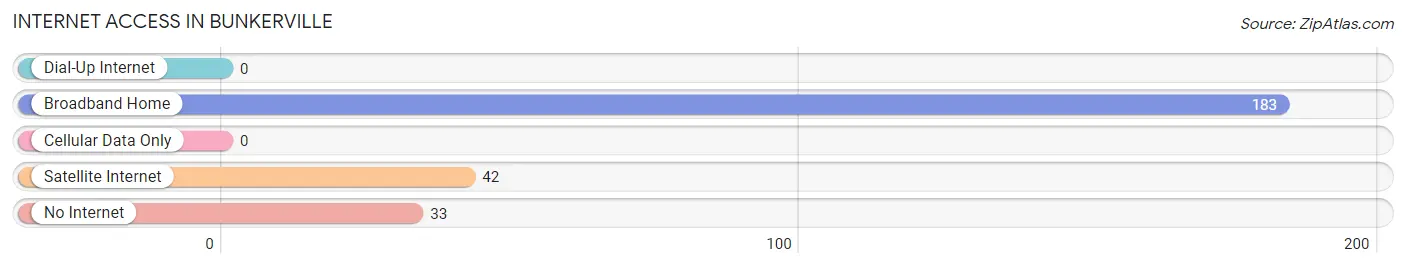
| Internet Type | # Households | % Households |
| Dial-Up Internet | 0 | 0.0% |
| Broadband Home | 183 | 84.7% |
| Cellular Data Only | 0 | 0.0% |
| Satellite Internet | 42 | 19.4% |
| No Internet | 33 | 15.3% |
| Total | 216 | 100.0% |
Bunkerville Summary
Bunkerville is a small town located in Clark County, Nevada, United States. It is situated in the Virgin River Valley, about 20 miles northeast of Las Vegas. The town was founded in 1877 by Mormon settlers and was named after Edward Bunker, a leader of the Church of Jesus Christ of Latter-day Saints. The population of Bunkerville was 1,304 at the 2010 census.
Geography
Bunkerville is located at 36°37'17" North, 114°7'17" West (36.6214, -114.1214). It is situated in the Virgin River Valley, about 20 miles northeast of Las Vegas. The town is located on the banks of the Virgin River, which is a tributary of the Colorado River. The elevation of Bunkerville is 2,619 feet (798 m).
The town has a total area of 0.9 square miles (2.3 km2), all of it land. The climate is arid desert, with hot summers and mild winters. The average annual precipitation is 4.5 inches (114 mm).
Economy
The economy of Bunkerville is largely based on agriculture and tourism. The town is home to several farms and ranches, which produce hay, alfalfa, and other crops. The town is also a popular destination for tourists, who come to enjoy the scenic beauty of the Virgin River Valley.
The town is home to several businesses, including a grocery store, a gas station, a post office, and a few restaurants. There is also a small airport located in the town.
Demographics
As of the 2010 census, there were 1,304 people, 441 households, and 339 families residing in Bunkerville. The population density was 1,444.2 people per square mile (558.7/km2). The racial makeup of the town was 91.2% White, 0.2% African American, 0.2% Native American, 0.2% Asian, 0.2% Pacific Islander, 6.2% from other races, and 1.9% from two or more races. Hispanic or Latino of any race were 11.2% of the population.
There were 441 households, out of which 37.2% had children under the age of 18 living with them, 58.2% were married couples living together, 10.2% had a female householder with no husband present, and 25.2% were non-families. 20.2% of all households were made up of individuals, and 8.2% had someone living alone who was 65 years of age or older. The average household size was 2.95 and the average family size was 3.41.
In the town, the population was spread out, with 30.2% under the age of 18, 8.2% from 18 to 24, 25.2% from 25 to 44, 24.2% from 45 to 64, and 12.2% who were 65 years of age or older. The median age was 36 years. For every 100 females, there were 103.2 males. For every 100 females age 18 and over, there were 103.2 males.
The median income for a household in the town was $41,250, and the median income for a family was $45,000. Males had a median income of $31,250 versus $21,250 for females. The per capita income for the town was $15,945. About 8.2% of families and 10.2% of the population were below the poverty line, including 11.2% of those under age 18 and 8.2% of those age 65 or over.
Common Questions
What is Per Capita Income in Bunkerville?
Per Capita income in Bunkerville is $25,833.
What is the Median Family Income in Bunkerville?
Median Family Income in Bunkerville is $144,293.
What is the Median Household income in Bunkerville?
Median Household Income in Bunkerville is $142,500.
What is Inequality or Gini Index in Bunkerville?
Inequality or Gini Index in Bunkerville is 0.31.
What is the Total Population of Bunkerville?
Total Population of Bunkerville is 1,008.
What is the Total Male Population of Bunkerville?
Total Male Population of Bunkerville is 441.
What is the Total Female Population of Bunkerville?
Total Female Population of Bunkerville is 567.
What is the Ratio of Males per 100 Females in Bunkerville?
There are 77.78 Males per 100 Females in Bunkerville.
What is the Ratio of Females per 100 Males in Bunkerville?
There are 128.57 Females per 100 Males in Bunkerville.
What is the Median Population Age in Bunkerville?
Median Population Age in Bunkerville is 31.6 Years.
What is the Average Family Size in Bunkerville
Average Family Size in Bunkerville is 5.2 People.
What is the Average Household Size in Bunkerville
Average Household Size in Bunkerville is 4.7 People.
How Large is the Labor Force in Bunkerville?
There are 243 People in the Labor Forcein in Bunkerville.
What is the Percentage of People in the Labor Force in Bunkerville?
42.4% of People are in the Labor Force in Bunkerville.