Carter Springs, NV Map & Demographics
Carter Springs Map
Carter Springs Overview
$41,725
PER CAPITA INCOME
$101,181
AVG FAMILY INCOME
$98,750
AVG HOUSEHOLD INCOME
11.9%
WAGE / INCOME GAP [ % ]
88.1¢/ $1
WAGE / INCOME GAP [ $ ]
0.32
INEQUALITY / GINI INDEX
450
TOTAL POPULATION
221
MALE POPULATION
229
FEMALE POPULATION
96.51
MALES / 100 FEMALES
103.62
FEMALES / 100 MALES
47.4
MEDIAN AGE
2.8
AVG FAMILY SIZE
2.5
AVG HOUSEHOLD SIZE
228
LABOR FORCE [ PEOPLE ]
61.5%
PERCENT IN LABOR FORCE
3.6%
UNEMPLOYMENT RATE
Income in Carter Springs
Income Overview in Carter Springs
Per Capita Income in Carter Springs is $41,725, while median incomes of families and households are $101,181 and $98,750 respectively.
| Characteristic | Number | Measure |
| Per Capita Income | 450 | $41,725 |
| Median Family Income | 135 | $101,181 |
| Mean Family Income | 135 | $102,582 |
| Median Household Income | 184 | $98,750 |
| Mean Household Income | 184 | $96,164 |
| Income Deficit | 135 | $0 |
| Wage / Income Gap (%) | 450 | 11.87% |
| Wage / Income Gap ($) | 450 | 88.13¢ per $1 |
| Gini / Inequality Index | 450 | 0.32 |
Earnings by Sex in Carter Springs
Average Earnings in Carter Springs are $53,125, $55,313 for men and $48,750 for women, a difference of 11.9%.
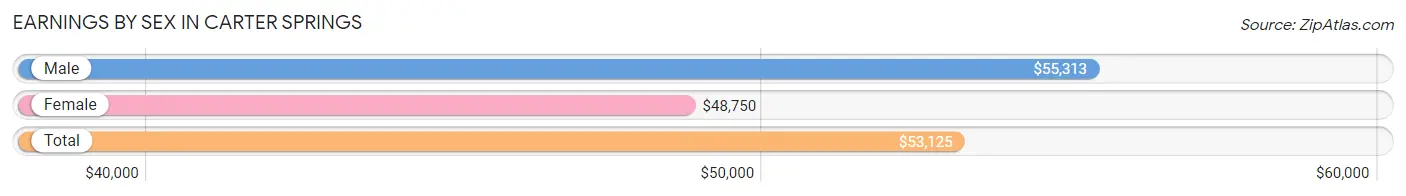
| Sex | Number | Average Earnings |
| Male | 115 (49.8%) | $55,313 |
| Female | 116 (50.2%) | $48,750 |
| Total | 231 (100.0%) | $53,125 |
Earnings by Sex by Income Bracket in Carter Springs
The most common earnings brackets in Carter Springs are $75,000 to $99,999 for men (17 | 14.8%) and $65,000 to $74,999 for women (34 | 29.3%).
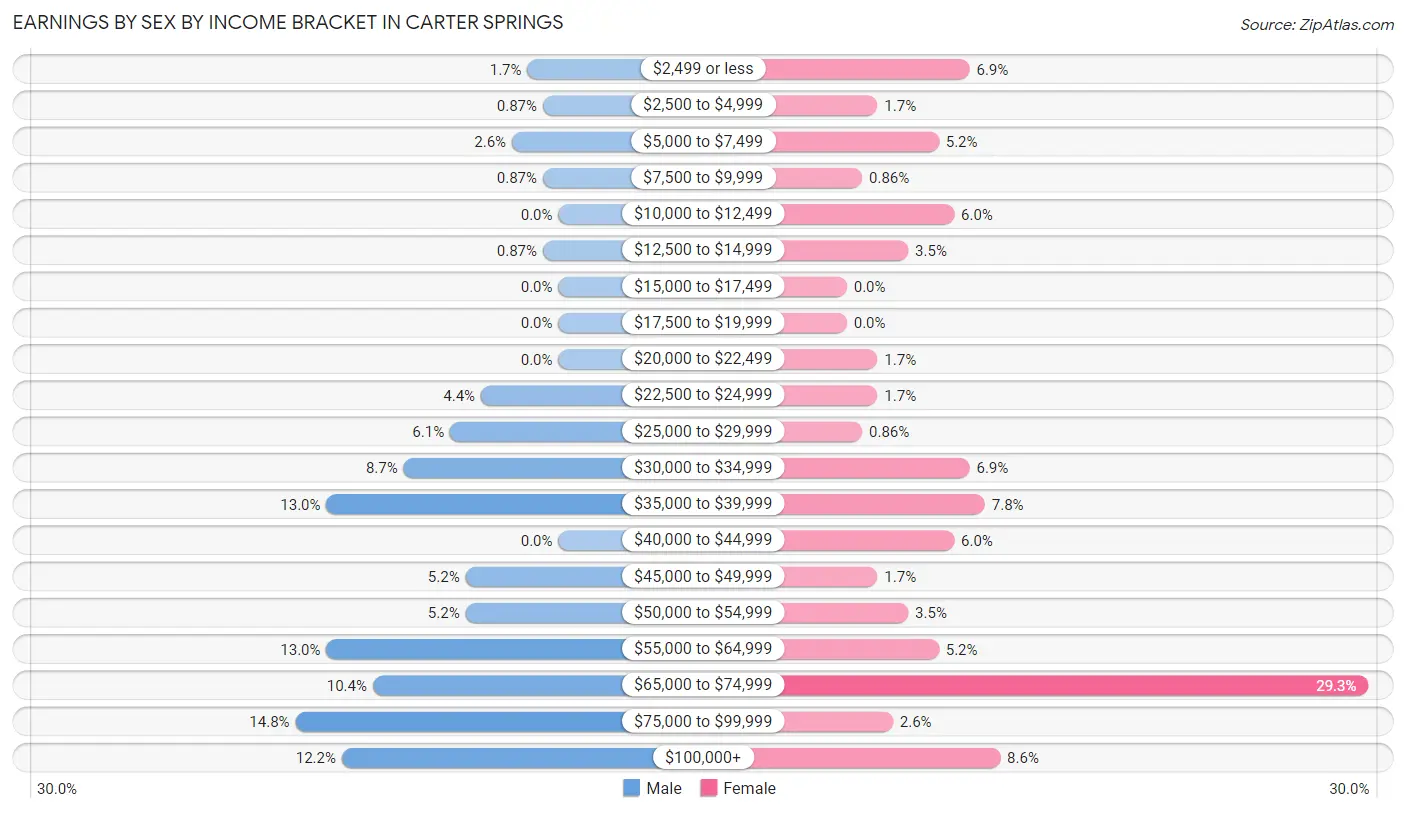
| Income | Male | Female |
| $2,499 or less | 2 (1.7%) | 8 (6.9%) |
| $2,500 to $4,999 | 1 (0.9%) | 2 (1.7%) |
| $5,000 to $7,499 | 3 (2.6%) | 6 (5.2%) |
| $7,500 to $9,999 | 1 (0.9%) | 1 (0.9%) |
| $10,000 to $12,499 | 0 (0.0%) | 7 (6.0%) |
| $12,500 to $14,999 | 1 (0.9%) | 4 (3.5%) |
| $15,000 to $17,499 | 0 (0.0%) | 0 (0.0%) |
| $17,500 to $19,999 | 0 (0.0%) | 0 (0.0%) |
| $20,000 to $22,499 | 0 (0.0%) | 2 (1.7%) |
| $22,500 to $24,999 | 5 (4.3%) | 2 (1.7%) |
| $25,000 to $29,999 | 7 (6.1%) | 1 (0.9%) |
| $30,000 to $34,999 | 10 (8.7%) | 8 (6.9%) |
| $35,000 to $39,999 | 15 (13.0%) | 9 (7.8%) |
| $40,000 to $44,999 | 0 (0.0%) | 7 (6.0%) |
| $45,000 to $49,999 | 6 (5.2%) | 2 (1.7%) |
| $50,000 to $54,999 | 6 (5.2%) | 4 (3.5%) |
| $55,000 to $64,999 | 15 (13.0%) | 6 (5.2%) |
| $65,000 to $74,999 | 12 (10.4%) | 34 (29.3%) |
| $75,000 to $99,999 | 17 (14.8%) | 3 (2.6%) |
| $100,000+ | 14 (12.2%) | 10 (8.6%) |
| Total | 115 (100.0%) | 116 (100.0%) |
Earnings by Sex by Educational Attainment in Carter Springs
Average earnings in Carter Springs are $61,071 for men and $58,750 for women, a difference of 3.8%. Men with an educational attainment of bachelor's degree enjoy the highest average annual earnings of $120,000, while those with college or associate's degree education earn the least with $36,705. Women with an educational attainment of college or associate's degree earn the most with the average annual earnings of $61,250, while those with high school diploma education have the smallest earnings of $40,938.
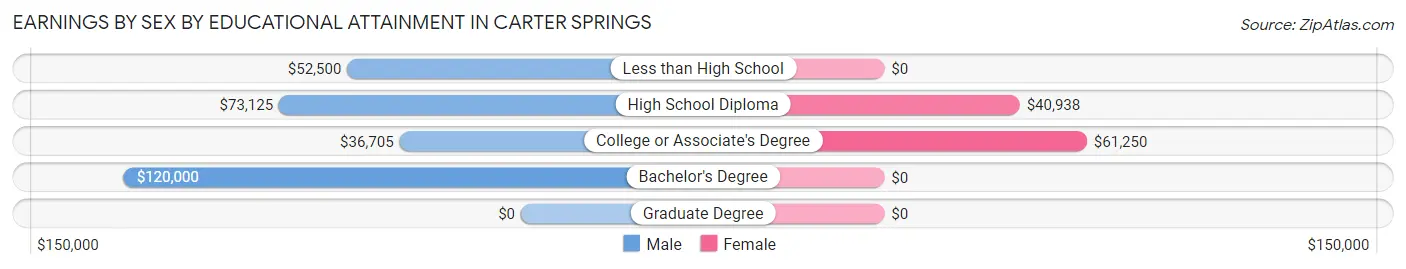
| Educational Attainment | Male Income | Female Income |
| Less than High School | $52,500 | $0 |
| High School Diploma | $73,125 | $40,938 |
| College or Associate's Degree | $36,705 | $61,250 |
| Bachelor's Degree | $120,000 | $0 |
| Graduate Degree | - | - |
| Total | $61,071 | $58,750 |
Family Income in Carter Springs
Family Income Brackets in Carter Springs
According to the Carter Springs family income data, there are 59 families falling into the $100,000 to $149,999 income range, which is the most common income bracket and makes up 43.7% of all families. Conversely, the less than $10,000 income bracket is the least frequent group with only 1 families (0.7%) belonging to this category.
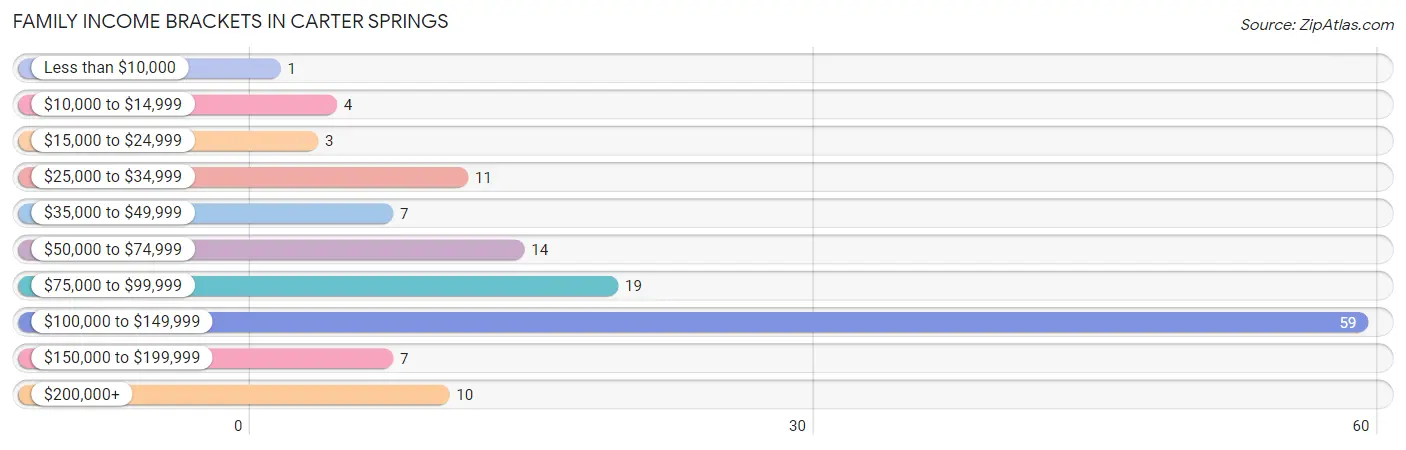
| Income Bracket | # Families | % Families |
| Less than $10,000 | 1 | 0.7% |
| $10,000 to $14,999 | 4 | 3.0% |
| $15,000 to $24,999 | 3 | 2.2% |
| $25,000 to $34,999 | 11 | 8.1% |
| $35,000 to $49,999 | 7 | 5.2% |
| $50,000 to $74,999 | 14 | 10.4% |
| $75,000 to $99,999 | 19 | 14.1% |
| $100,000 to $149,999 | 59 | 43.7% |
| $150,000 to $199,999 | 7 | 5.2% |
| $200,000+ | 10 | 7.4% |
Family Income by Famaliy Size in Carter Springs
4-person families (7 | 5.2%) account for the highest median family income in Carter Springs with $104,688 per family, while 2-person families (83 | 61.5%) have the highest median income of $44,375 per family member.
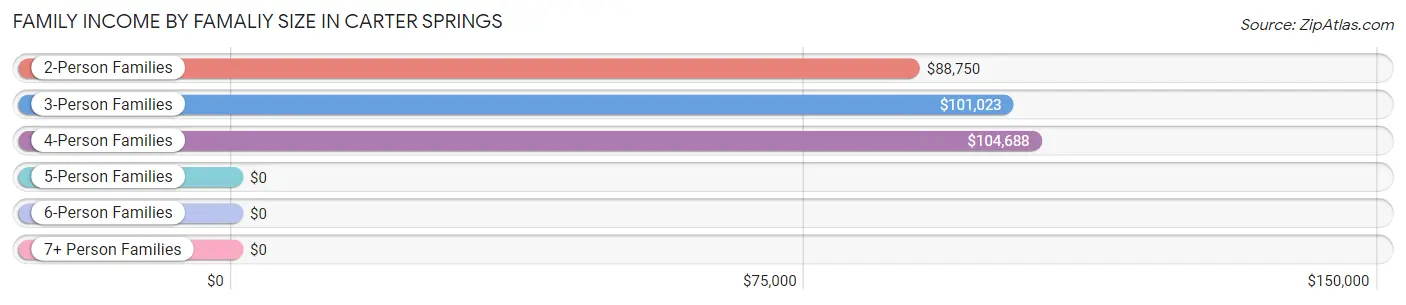
| Income Bracket | # Families | Median Income |
| 2-Person Families | 83 (61.5%) | $88,750 |
| 3-Person Families | 37 (27.4%) | $101,023 |
| 4-Person Families | 7 (5.2%) | $104,688 |
| 5-Person Families | 4 (3.0%) | $0 |
| 6-Person Families | 2 (1.5%) | $0 |
| 7+ Person Families | 2 (1.5%) | $0 |
| Total | 135 (100.0%) | $101,181 |
Family Income by Number of Earners in Carter Springs
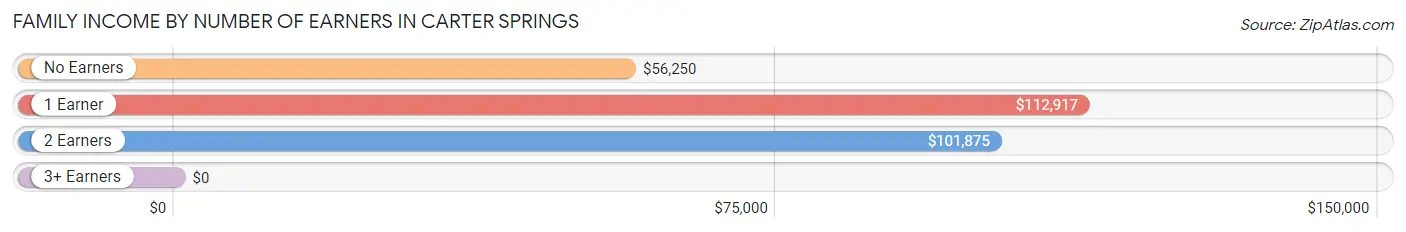
| Number of Earners | # Families | Median Income |
| No Earners | 28 (20.7%) | $56,250 |
| 1 Earner | 42 (31.1%) | $112,917 |
| 2 Earners | 61 (45.2%) | $101,875 |
| 3+ Earners | 4 (3.0%) | $0 |
| Total | 135 (100.0%) | $101,181 |
Household Income in Carter Springs
Household Income Brackets in Carter Springs
With 69 households falling in the category, the $100,000 to $149,999 income range is the most frequent in Carter Springs, accounting for 37.5% of all households. In contrast, only 3 households (1.6%) fall into the less than $10,000 income bracket, making it the least populous group.
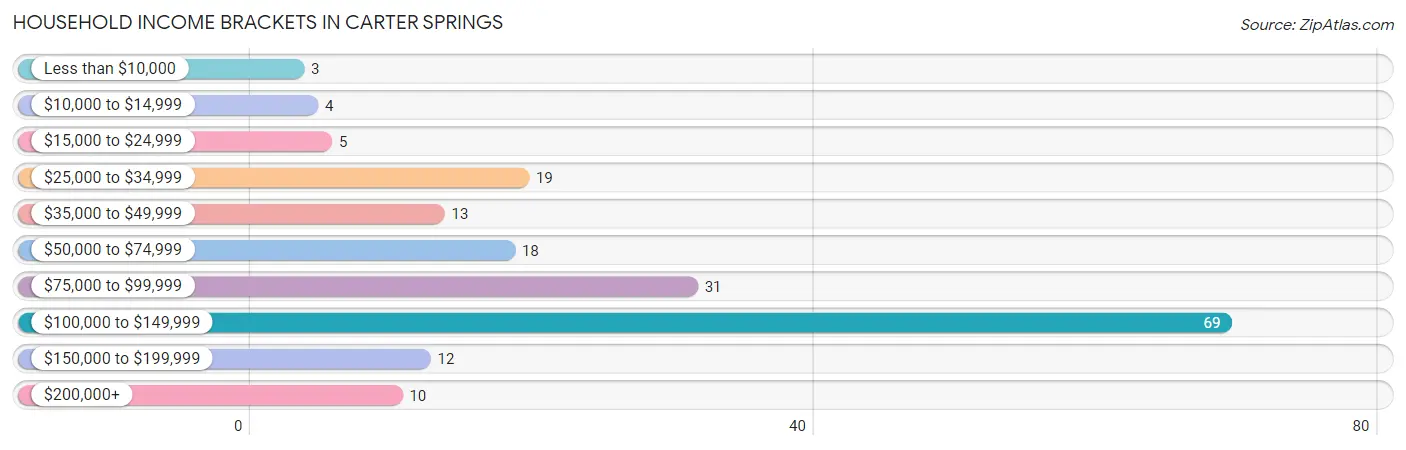
| Income Bracket | # Households | % Households |
| Less than $10,000 | 3 | 1.6% |
| $10,000 to $14,999 | 4 | 2.2% |
| $15,000 to $24,999 | 5 | 2.7% |
| $25,000 to $34,999 | 19 | 10.3% |
| $35,000 to $49,999 | 13 | 7.1% |
| $50,000 to $74,999 | 18 | 9.8% |
| $75,000 to $99,999 | 31 | 16.8% |
| $100,000 to $149,999 | 69 | 37.5% |
| $150,000 to $199,999 | 12 | 6.5% |
| $200,000+ | 10 | 5.4% |
Household Income by Householder Age in Carter Springs
The median household income in Carter Springs is $98,750, with the highest median household income of $102,500 found in the 25 to 44 years age bracket for the primary householder. A total of 42 households (22.8%) fall into this category. Meanwhile, the 15 to 24 years age bracket for the primary householder has the lowest median household income of $0, with 5 households (2.7%) in this group.
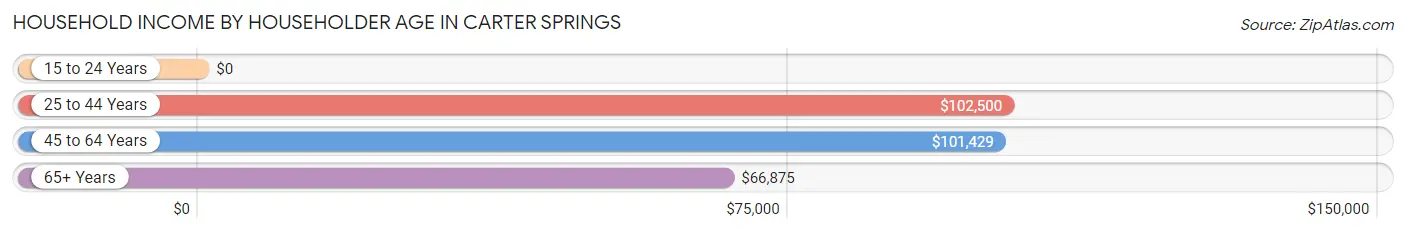
| Income Bracket | # Households | Median Income |
| 15 to 24 Years | 5 (2.7%) | $0 |
| 25 to 44 Years | 42 (22.8%) | $102,500 |
| 45 to 64 Years | 72 (39.1%) | $101,429 |
| 65+ Years | 65 (35.3%) | $66,875 |
| Total | 184 (100.0%) | $98,750 |
Poverty in Carter Springs
Income Below Poverty by Sex and Age in Carter Springs
With 7.7% poverty level for males and 6.1% for females among the residents of Carter Springs, 45 to 54 year old males and 18 to 24 year old females are the most vulnerable to poverty, with 11 males (22.5%) and 6 females (42.9%) in their respective age groups living below the poverty level.
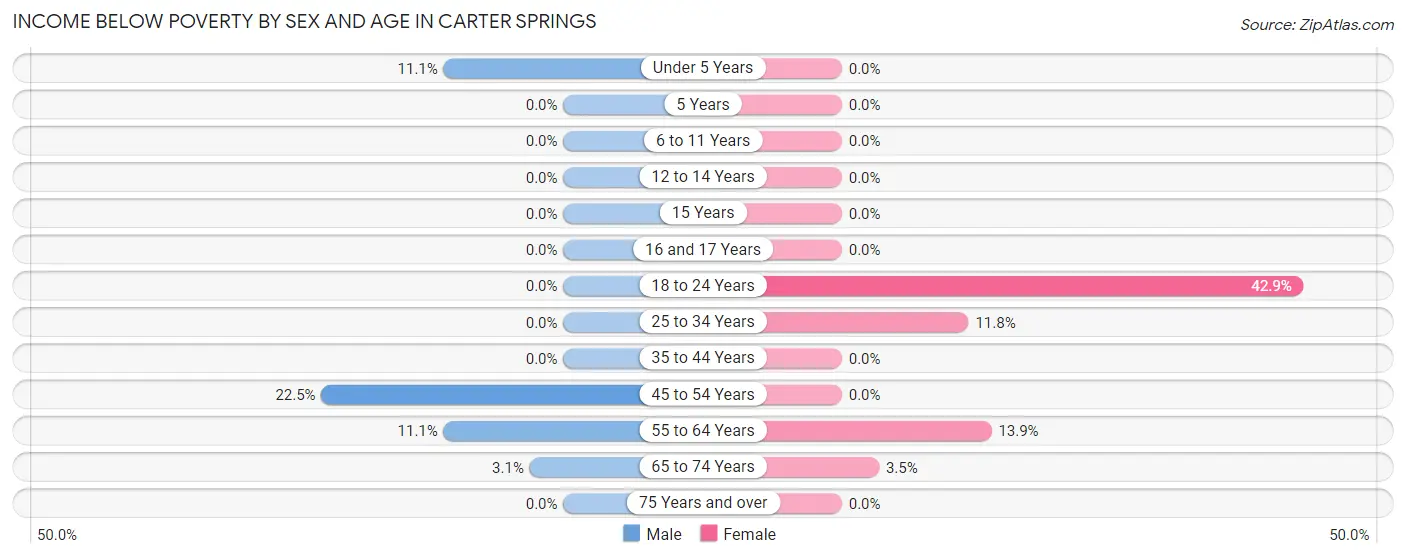
| Age Bracket | Male | Female |
| Under 5 Years | 1 (11.1%) | 0 (0.0%) |
| 5 Years | 0 (0.0%) | 0 (0.0%) |
| 6 to 11 Years | 0 (0.0%) | 0 (0.0%) |
| 12 to 14 Years | 0 (0.0%) | 0 (0.0%) |
| 15 Years | 0 (0.0%) | 0 (0.0%) |
| 16 and 17 Years | 0 (0.0%) | 0 (0.0%) |
| 18 to 24 Years | 0 (0.0%) | 6 (42.9%) |
| 25 to 34 Years | 0 (0.0%) | 2 (11.8%) |
| 35 to 44 Years | 0 (0.0%) | 0 (0.0%) |
| 45 to 54 Years | 11 (22.5%) | 0 (0.0%) |
| 55 to 64 Years | 4 (11.1%) | 5 (13.9%) |
| 65 to 74 Years | 1 (3.1%) | 1 (3.5%) |
| 75 Years and over | 0 (0.0%) | 0 (0.0%) |
| Total | 17 (7.7%) | 14 (6.1%) |
Income Above Poverty by Sex and Age in Carter Springs
According to the poverty statistics in Carter Springs, males aged 6 to 11 years and females aged under 5 years are the age groups that are most secure financially, with 100.0% of males and 100.0% of females in these age groups living above the poverty line.
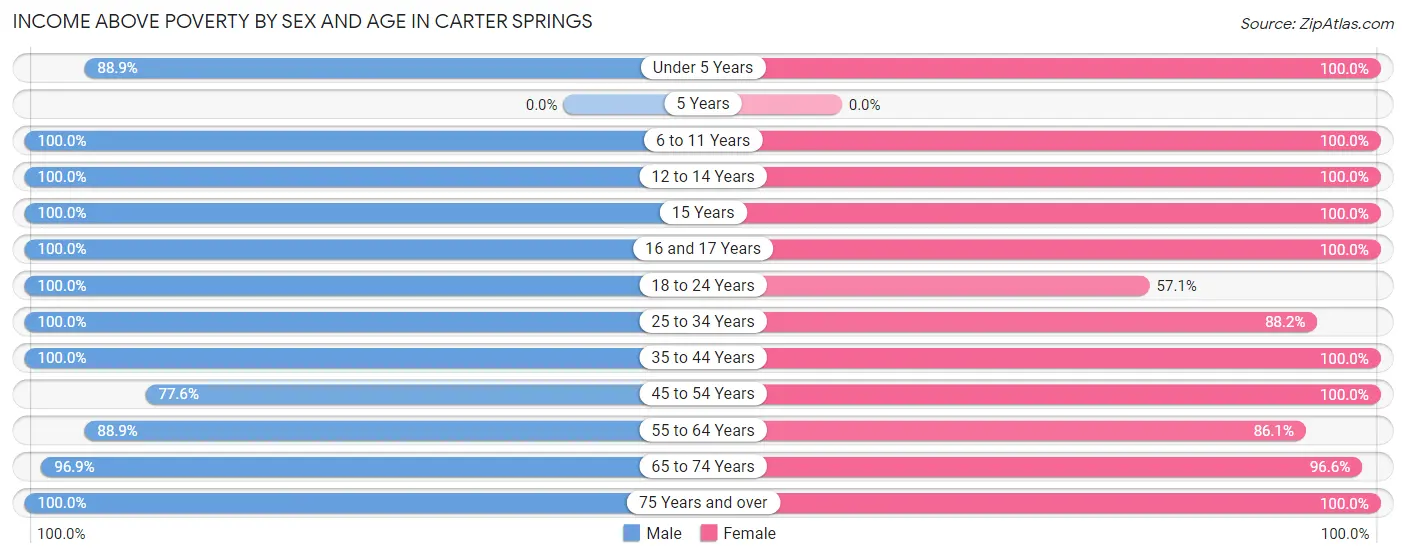
| Age Bracket | Male | Female |
| Under 5 Years | 8 (88.9%) | 7 (100.0%) |
| 5 Years | 0 (0.0%) | 0 (0.0%) |
| 6 to 11 Years | 16 (100.0%) | 9 (100.0%) |
| 12 to 14 Years | 9 (100.0%) | 5 (100.0%) |
| 15 Years | 1 (100.0%) | 23 (100.0%) |
| 16 and 17 Years | 1 (100.0%) | 12 (100.0%) |
| 18 to 24 Years | 18 (100.0%) | 8 (57.1%) |
| 25 to 34 Years | 2 (100.0%) | 15 (88.2%) |
| 35 to 44 Years | 27 (100.0%) | 28 (100.0%) |
| 45 to 54 Years | 38 (77.5%) | 27 (100.0%) |
| 55 to 64 Years | 32 (88.9%) | 31 (86.1%) |
| 65 to 74 Years | 31 (96.9%) | 28 (96.6%) |
| 75 Years and over | 21 (100.0%) | 22 (100.0%) |
| Total | 204 (92.3%) | 215 (93.9%) |
Income Below Poverty Among Married-Couple Families in Carter Springs
The poverty statistics for married-couple families in Carter Springs show that 2.0% or 2 of the total 99 families live below the poverty line. Families with no children have the highest poverty rate of 3.1%, comprising of 2 families. On the other hand, families with 1 or 2 children have the lowest poverty rate of 0.0%, which includes 0 families.
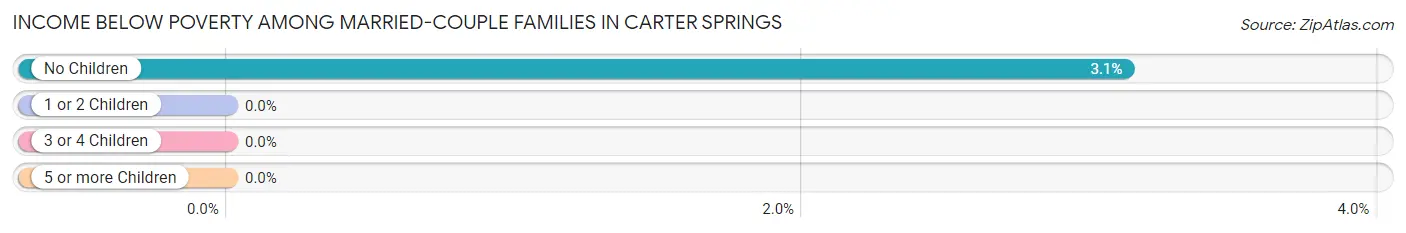
| Children | Above Poverty | Below Poverty |
| No Children | 62 (96.9%) | 2 (3.1%) |
| 1 or 2 Children | 27 (100.0%) | 0 (0.0%) |
| 3 or 4 Children | 8 (100.0%) | 0 (0.0%) |
| 5 or more Children | 0 (0.0%) | 0 (0.0%) |
| Total | 97 (98.0%) | 2 (2.0%) |
Income Below Poverty Among Single-Parent Households in Carter Springs
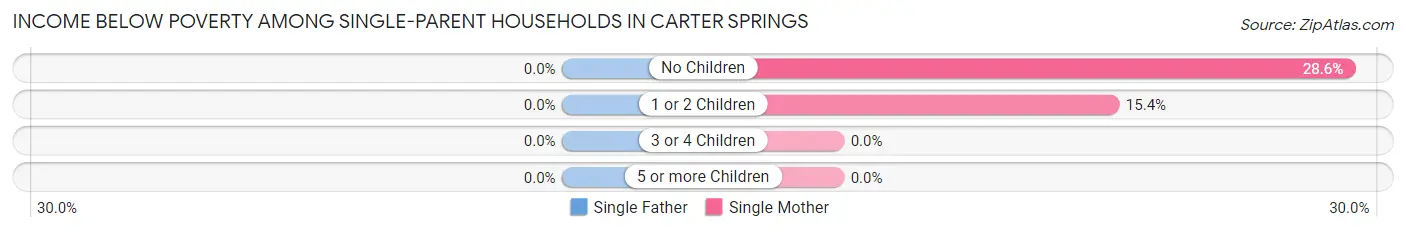
| Children | Single Father | Single Mother |
| No Children | 0 (0.0%) | 4 (28.6%) |
| 1 or 2 Children | 0 (0.0%) | 2 (15.4%) |
| 3 or 4 Children | 0 (0.0%) | 0 (0.0%) |
| 5 or more Children | 0 (0.0%) | 0 (0.0%) |
| Total | 0 (0.0%) | 6 (22.2%) |
Income Below Poverty Among Married-Couple vs Single-Parent Households in Carter Springs
The poverty data for Carter Springs shows that 2 of the married-couple family households (2.0%) and 6 of the single-parent households (16.7%) are living below the poverty level. Within the married-couple family households, those with no children have the highest poverty rate, with 2 households (3.1%) falling below the poverty line. Among the single-parent households, those with no children have the highest poverty rate, with 4 household (25.0%) living below poverty.
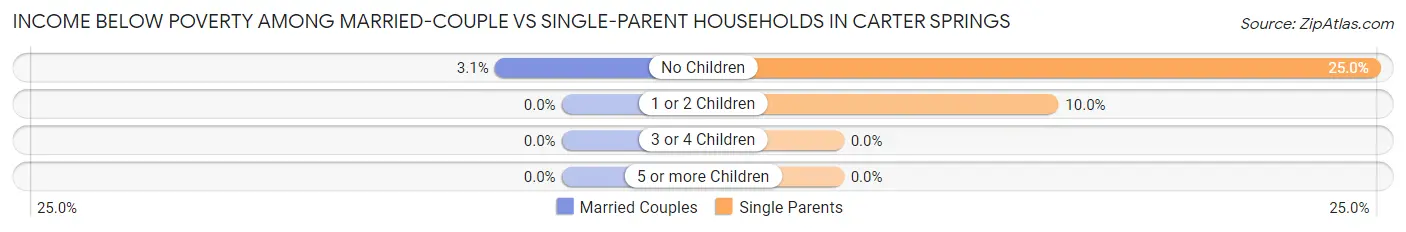
| Children | Married-Couple Families | Single-Parent Households |
| No Children | 2 (3.1%) | 4 (25.0%) |
| 1 or 2 Children | 0 (0.0%) | 2 (10.0%) |
| 3 or 4 Children | 0 (0.0%) | 0 (0.0%) |
| 5 or more Children | 0 (0.0%) | 0 (0.0%) |
| Total | 2 (2.0%) | 6 (16.7%) |
Race in Carter Springs
The most populous races in Carter Springs are White / Caucasian (348 | 77.3%), Hispanic or Latino (65 | 14.4%), and Two or more Races (43 | 9.6%).
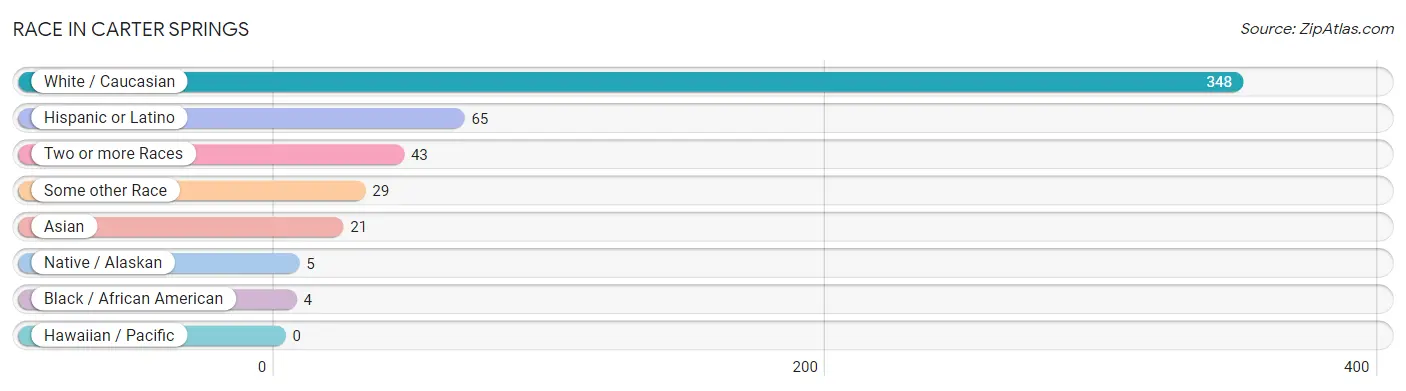
| Race | # Population | % Population |
| Asian | 21 | 4.7% |
| Black / African American | 4 | 0.9% |
| Hawaiian / Pacific | 0 | 0.0% |
| Hispanic or Latino | 65 | 14.4% |
| Native / Alaskan | 5 | 1.1% |
| White / Caucasian | 348 | 77.3% |
| Two or more Races | 43 | 9.6% |
| Some other Race | 29 | 6.4% |
| Total | 450 | 100.0% |
Ancestry in Carter Springs
The most populous ancestries reported in Carter Springs are German (82 | 18.2%), Irish (80 | 17.8%), English (78 | 17.3%), Mexican (45 | 10.0%), and Italian (33 | 7.3%), together accounting for 70.7% of all Carter Springs residents.
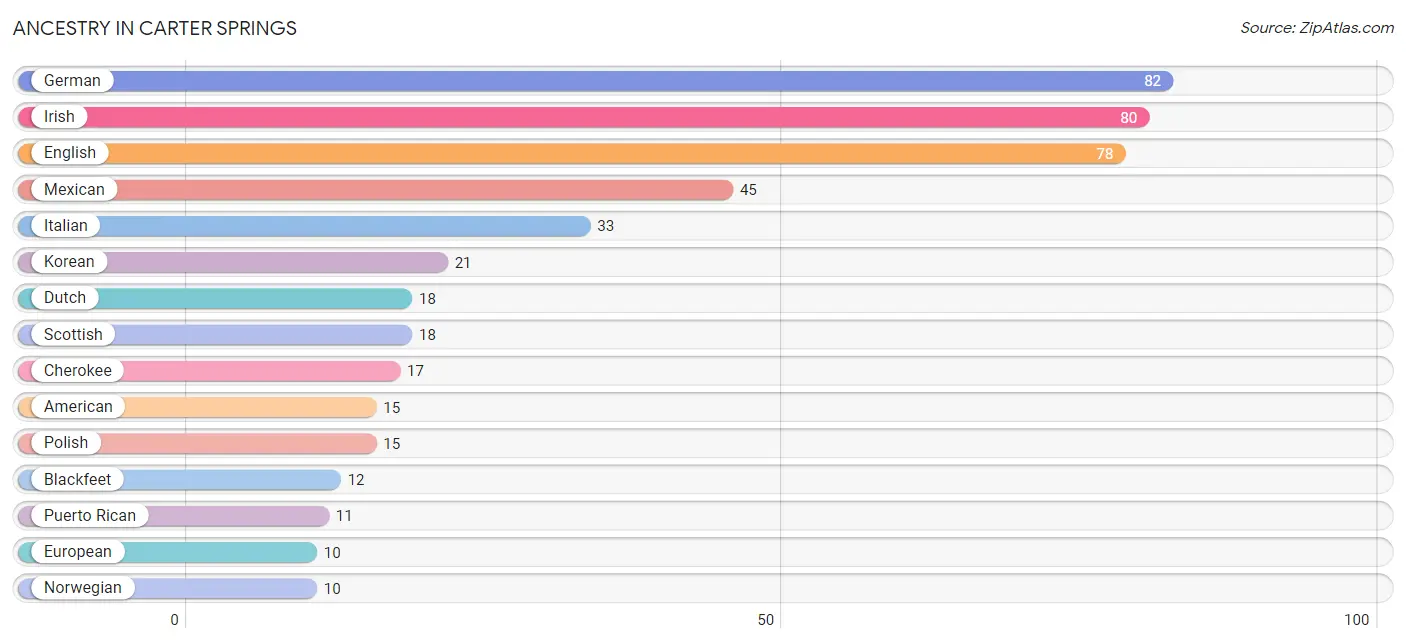
| Ancestry | # Population | % Population |
| American | 15 | 3.3% |
| Argentinean | 3 | 0.7% |
| Austrian | 3 | 0.7% |
| Blackfeet | 12 | 2.7% |
| Cherokee | 17 | 3.8% |
| Czech | 1 | 0.2% |
| Danish | 3 | 0.7% |
| Dutch | 18 | 4.0% |
| English | 78 | 17.3% |
| European | 10 | 2.2% |
| Finnish | 2 | 0.4% |
| French | 9 | 2.0% |
| German | 82 | 18.2% |
| Hungarian | 7 | 1.6% |
| Irish | 80 | 17.8% |
| Italian | 33 | 7.3% |
| Korean | 21 | 4.7% |
| Mexican | 45 | 10.0% |
| Native Hawaiian | 3 | 0.7% |
| Norwegian | 10 | 2.2% |
| Polish | 15 | 3.3% |
| Portuguese | 4 | 0.9% |
| Puerto Rican | 11 | 2.4% |
| Scotch-Irish | 8 | 1.8% |
| Scottish | 18 | 4.0% |
| Shoshone | 3 | 0.7% |
| South American | 3 | 0.7% |
| Spanish | 6 | 1.3% |
| Swedish | 10 | 2.2% |
| Turkish | 3 | 0.7% |
| Welsh | 7 | 1.6% | View All 31 Rows |
Immigrants in Carter Springs
The most numerous immigrant groups reported in Carter Springs came from Latin America (23 | 5.1%), Asia (21 | 4.7%), South Eastern Asia (21 | 4.7%), Central America (20 | 4.4%), and Mexico (20 | 4.4%), together accounting for 23.3% of all Carter Springs residents.
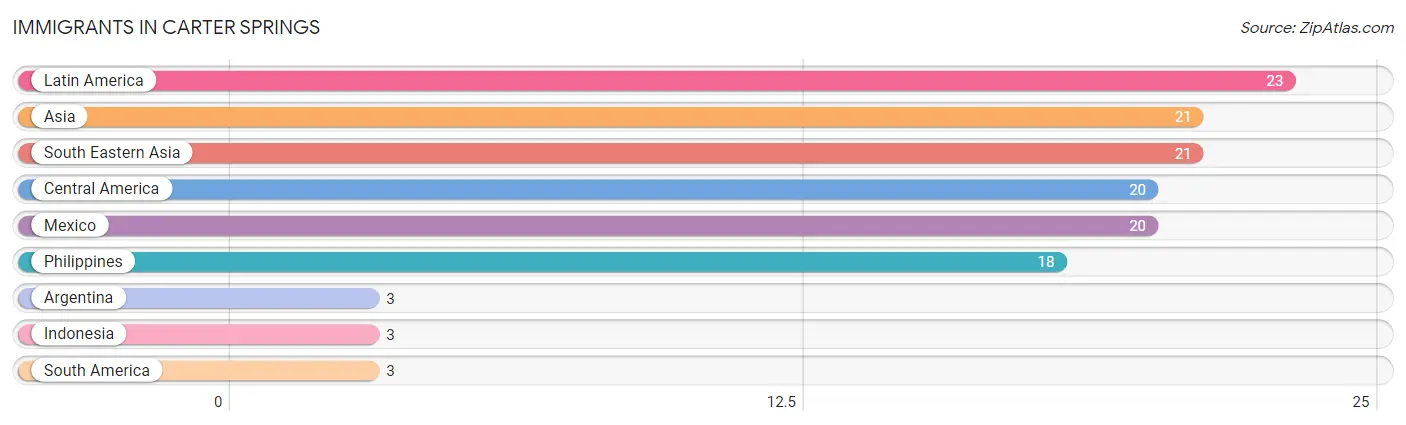
| Immigration Origin | # Population | % Population |
| Argentina | 3 | 0.7% |
| Asia | 21 | 4.7% |
| Central America | 20 | 4.4% |
| Indonesia | 3 | 0.7% |
| Latin America | 23 | 5.1% |
| Mexico | 20 | 4.4% |
| Philippines | 18 | 4.0% |
| South America | 3 | 0.7% |
| South Eastern Asia | 21 | 4.7% | View All 9 Rows |
Sex and Age in Carter Springs
Sex and Age in Carter Springs
The most populous age groups in Carter Springs are 45 to 49 Years (35 | 15.8%) for men and 15 to 19 Years (42 | 18.3%) for women.
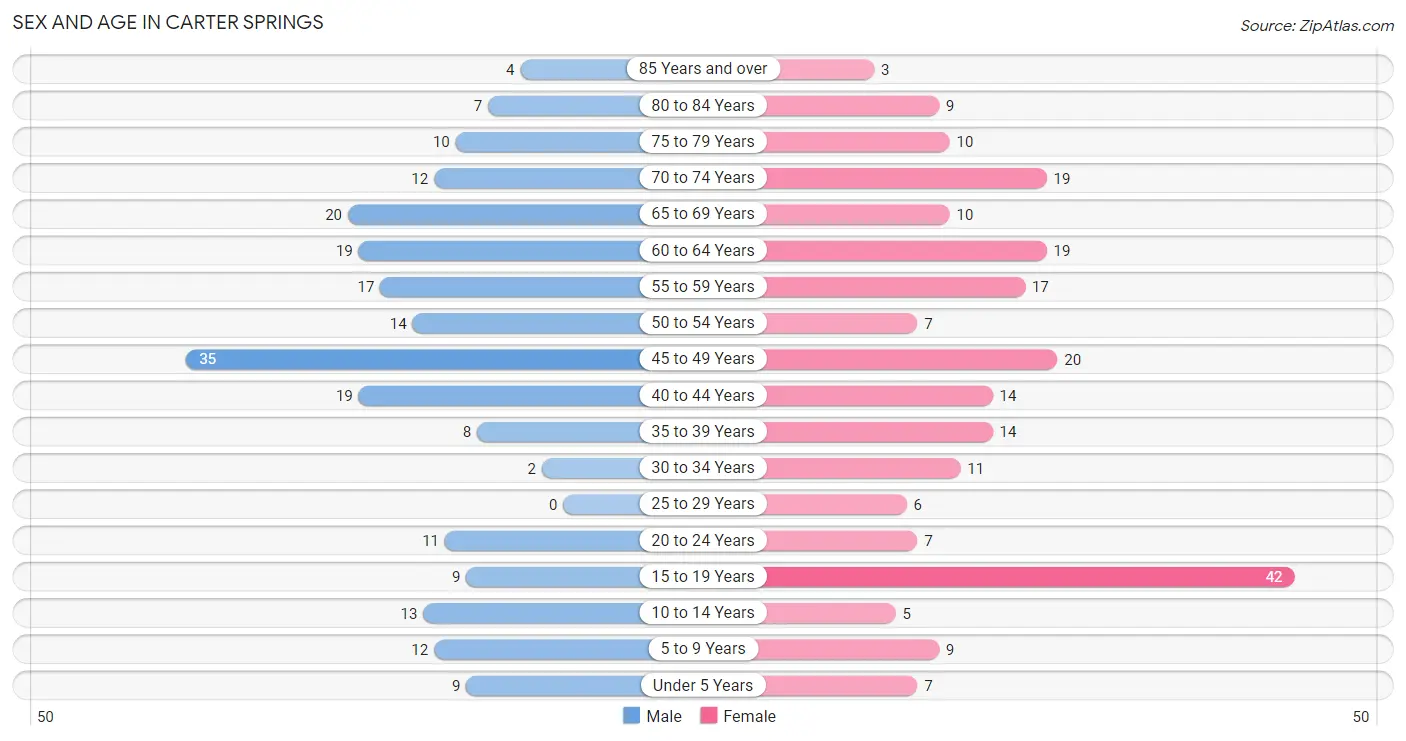
| Age Bracket | Male | Female |
| Under 5 Years | 9 (4.1%) | 7 (3.1%) |
| 5 to 9 Years | 12 (5.4%) | 9 (3.9%) |
| 10 to 14 Years | 13 (5.9%) | 5 (2.2%) |
| 15 to 19 Years | 9 (4.1%) | 42 (18.3%) |
| 20 to 24 Years | 11 (5.0%) | 7 (3.1%) |
| 25 to 29 Years | 0 (0.0%) | 6 (2.6%) |
| 30 to 34 Years | 2 (0.9%) | 11 (4.8%) |
| 35 to 39 Years | 8 (3.6%) | 14 (6.1%) |
| 40 to 44 Years | 19 (8.6%) | 14 (6.1%) |
| 45 to 49 Years | 35 (15.8%) | 20 (8.7%) |
| 50 to 54 Years | 14 (6.3%) | 7 (3.1%) |
| 55 to 59 Years | 17 (7.7%) | 17 (7.4%) |
| 60 to 64 Years | 19 (8.6%) | 19 (8.3%) |
| 65 to 69 Years | 20 (9.0%) | 10 (4.4%) |
| 70 to 74 Years | 12 (5.4%) | 19 (8.3%) |
| 75 to 79 Years | 10 (4.5%) | 10 (4.4%) |
| 80 to 84 Years | 7 (3.2%) | 9 (3.9%) |
| 85 Years and over | 4 (1.8%) | 3 (1.3%) |
| Total | 221 (100.0%) | 229 (100.0%) |
Families and Households in Carter Springs
Median Family Size in Carter Springs
The median family size in Carter Springs is 2.78 persons per family, with single male/father families (9 | 6.7%) accounting for the largest median family size of 3 persons per family. On the other hand, single female/mother families (27 | 20.0%) represent the smallest median family size with 2.56 persons per family.
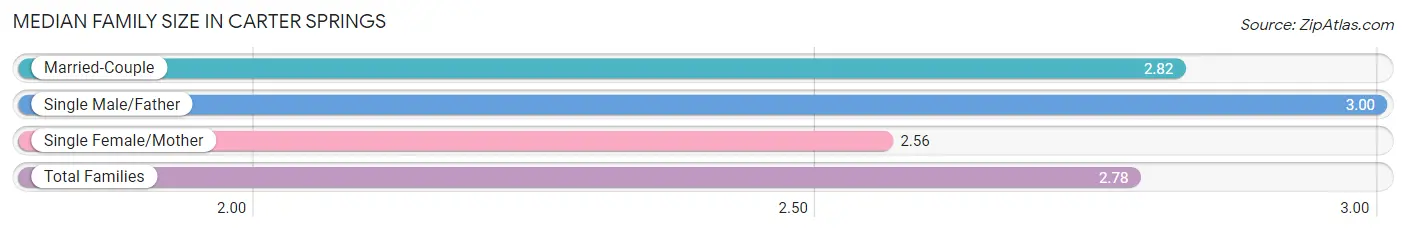
| Family Type | # Families | Family Size |
| Married-Couple | 99 (73.3%) | 2.82 |
| Single Male/Father | 9 (6.7%) | 3.00 |
| Single Female/Mother | 27 (20.0%) | 2.56 |
| Total Families | 135 (100.0%) | 2.78 |
Median Household Size in Carter Springs
The median household size in Carter Springs is 2.45 persons per household, with single female/mother households (27 | 14.7%) accounting for the largest median household size of 3.11 persons per household. non-family households (49 | 26.6%) represent the smallest median household size with 1.22 persons per household.
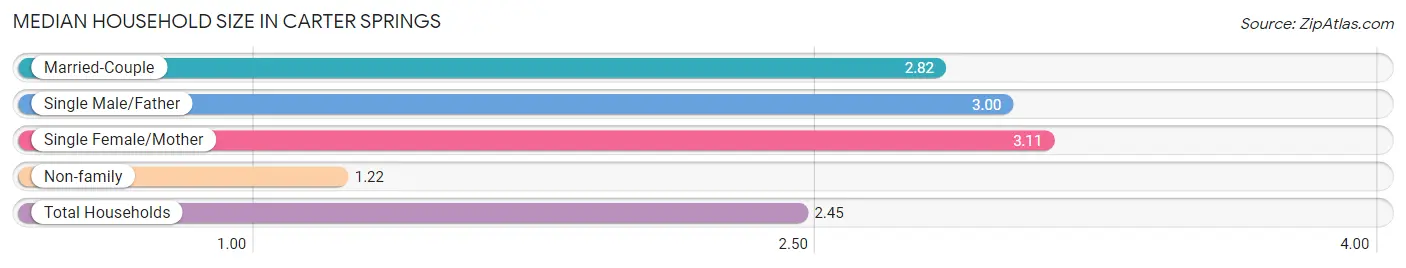
| Household Type | # Households | Household Size |
| Married-Couple | 99 (53.8%) | 2.82 |
| Single Male/Father | 9 (4.9%) | 3.00 |
| Single Female/Mother | 27 (14.7%) | 3.11 |
| Non-family | 49 (26.6%) | 1.22 |
| Total Households | 184 (100.0%) | 2.45 |
Household Size by Marriage Status in Carter Springs
Out of a total of 184 households in Carter Springs, 135 (73.4%) are family households, while 49 (26.6%) are nonfamily households. The most numerous type of family households are 2-person households, comprising 79, and the most common type of nonfamily households are 1-person households, comprising 40.
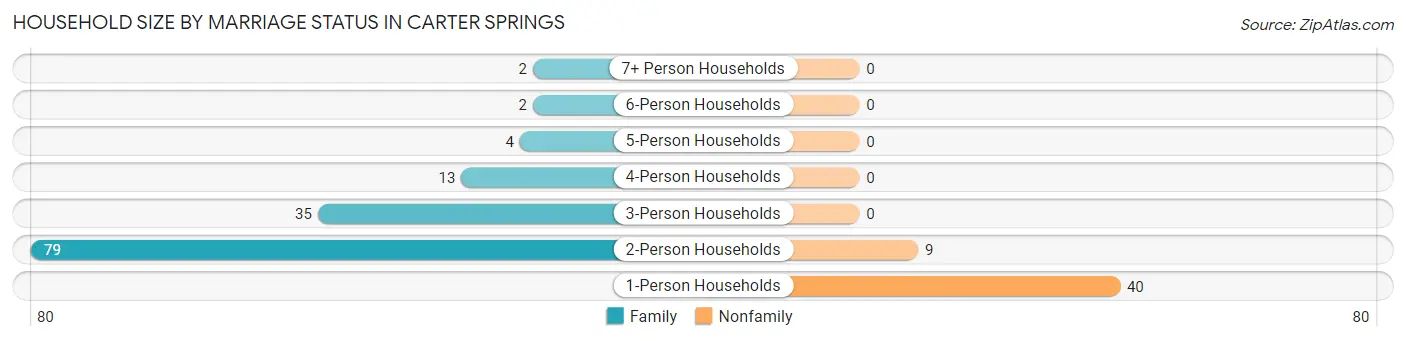
| Household Size | Family Households | Nonfamily Households |
| 1-Person Households | - | 40 (21.7%) |
| 2-Person Households | 79 (42.9%) | 9 (4.9%) |
| 3-Person Households | 35 (19.0%) | 0 (0.0%) |
| 4-Person Households | 13 (7.1%) | 0 (0.0%) |
| 5-Person Households | 4 (2.2%) | 0 (0.0%) |
| 6-Person Households | 2 (1.1%) | 0 (0.0%) |
| 7+ Person Households | 2 (1.1%) | 0 (0.0%) |
| Total | 135 (73.4%) | 49 (26.6%) |
Female Fertility in Carter Springs
Fertility by Age in Carter Springs
| Age Bracket | Women with Births | Births / 1,000 Women |
| 15 to 19 years | 0 (0.0%) | 0.0 |
| 20 to 34 years | 0 (0.0%) | 0.0 |
| 35 to 50 years | 0 (0.0%) | 0.0 |
| Total | 0 (0.0%) | 0.0 |
Fertility by Age by Marriage Status in Carter Springs
| Age Bracket | Married | Unmarried |
| 15 to 19 years | 0 (0.0%) | 0 (0.0%) |
| 20 to 34 years | 0 (0.0%) | 0 (0.0%) |
| 35 to 50 years | 0 (0.0%) | 0 (0.0%) |
| Total | 0 (0.0%) | 0 (0.0%) |
Fertility by Education in Carter Springs
| Educational Attainment | Women with Births | Births / 1,000 Women |
| Less than High School | 0 (0.0%) | 0.0 |
| High School Diploma | 0 (0.0%) | 0.0 |
| College or Associate's Degree | 0 (0.0%) | 0.0 |
| Bachelor's Degree | 0 (0.0%) | 0.0 |
| Graduate Degree | 0 (0.0%) | 0.0 |
| Total | 0 (0.0%) | 0.0 |
Fertility by Education by Marriage Status in Carter Springs
| Educational Attainment | Married | Unmarried |
| Less than High School | 0 (0.0%) | 0 (0.0%) |
| High School Diploma | 0 (0.0%) | 0 (0.0%) |
| College or Associate's Degree | 0 (0.0%) | 0 (0.0%) |
| Bachelor's Degree | 0 (0.0%) | 0 (0.0%) |
| Graduate Degree | 0 (0.0%) | 0 (0.0%) |
| Total | 0 (0.0%) | 0 (0.0%) |
Employment Characteristics in Carter Springs
Employment by Class of Employer in Carter Springs
Among the 218 employed individuals in Carter Springs, private company employees (143 | 65.6%), federal government employees (22 | 10.1%), and local government employees (20 | 9.2%) make up the most common classes of employment.
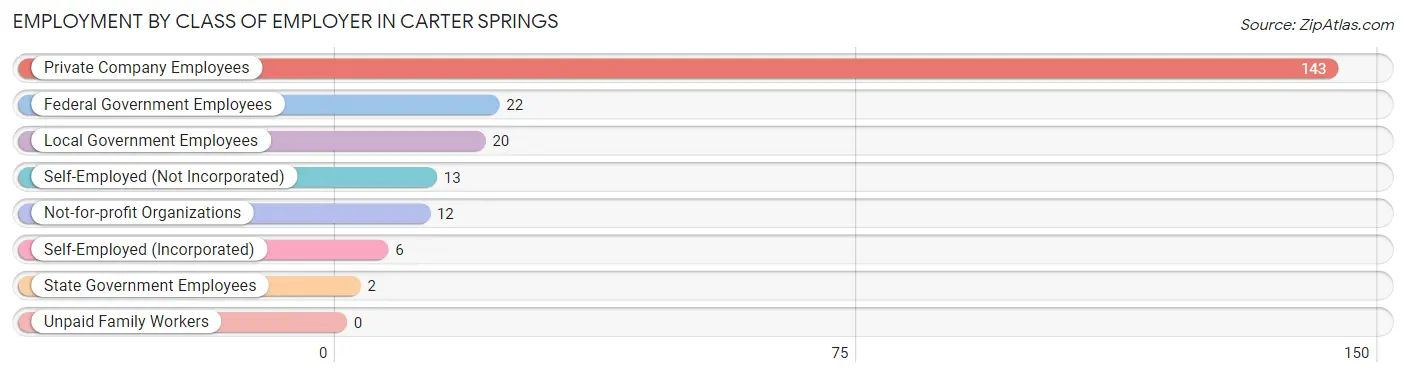
| Employer Class | # Employees | % Employees |
| Private Company Employees | 143 | 65.6% |
| Self-Employed (Incorporated) | 6 | 2.8% |
| Self-Employed (Not Incorporated) | 13 | 6.0% |
| Not-for-profit Organizations | 12 | 5.5% |
| Local Government Employees | 20 | 9.2% |
| State Government Employees | 2 | 0.9% |
| Federal Government Employees | 22 | 10.1% |
| Unpaid Family Workers | 0 | 0.0% |
| Total | 218 | 100.0% |
Employment Status by Age in Carter Springs
According to the labor force statistics for Carter Springs, out of the total population over 16 years of age (371), 61.5% or 228 individuals are in the labor force, with 3.6% or 8 of them unemployed. The age group with the highest labor force participation rate is 20 to 24 years, with 100.0% or 18 individuals in the labor force. Within the labor force, the 16 to 19 years age range has the highest percentage of unemployed individuals, with 35.7% or 5 of them being unemployed.
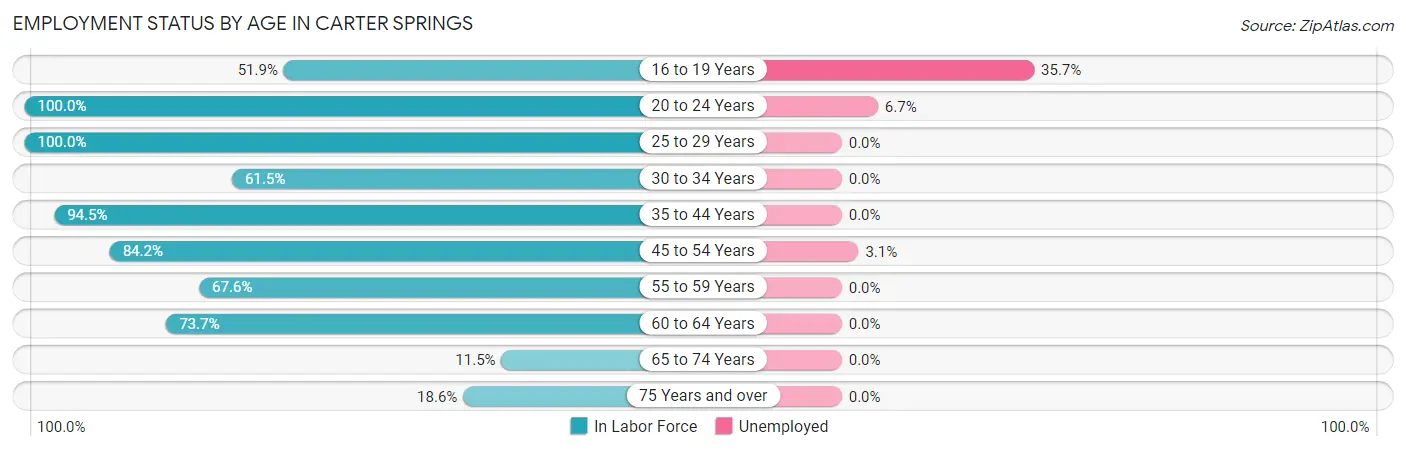
| Age Bracket | In Labor Force | Unemployed |
| 16 to 19 Years | 14 (51.9%) | 5 (35.7%) |
| 20 to 24 Years | 18 (100.0%) | 1 (6.7%) |
| 25 to 29 Years | 6 (100.0%) | 0 (0.0%) |
| 30 to 34 Years | 8 (61.5%) | 0 (0.0%) |
| 35 to 44 Years | 52 (94.5%) | 0 (0.0%) |
| 45 to 54 Years | 64 (84.2%) | 2 (3.1%) |
| 55 to 59 Years | 23 (67.6%) | 0 (0.0%) |
| 60 to 64 Years | 28 (73.7%) | 0 (0.0%) |
| 65 to 74 Years | 7 (11.5%) | 0 (0.0%) |
| 75 Years and over | 8 (18.6%) | 0 (0.0%) |
| Total | 228 (61.5%) | 8 (3.6%) |
Employment Status by Educational Attainment in Carter Springs
According to labor force statistics for Carter Springs, 81.5% of individuals (181) out of the total population between 25 and 64 years of age (222) are in the labor force, with 1.1% or 2 of them being unemployed. The group with the highest labor force participation rate are those with the educational attainment of less than high school, with 88.9% or 16 individuals in the labor force. Within the labor force, individuals with high school diploma education have the highest percentage of unemployment, with 3.6% or 2 of them being unemployed.
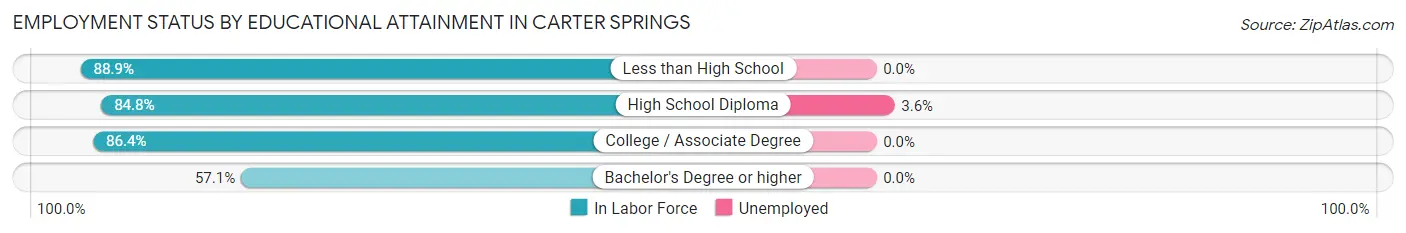
| Educational Attainment | In Labor Force | Unemployed |
| Less than High School | 16 (88.9%) | 0 (0.0%) |
| High School Diploma | 56 (84.8%) | 2 (3.6%) |
| College / Associate Degree | 89 (86.4%) | 0 (0.0%) |
| Bachelor's Degree or higher | 20 (57.1%) | 0 (0.0%) |
| Total | 181 (81.5%) | 2 (1.1%) |
Employment Occupations by Sex in Carter Springs
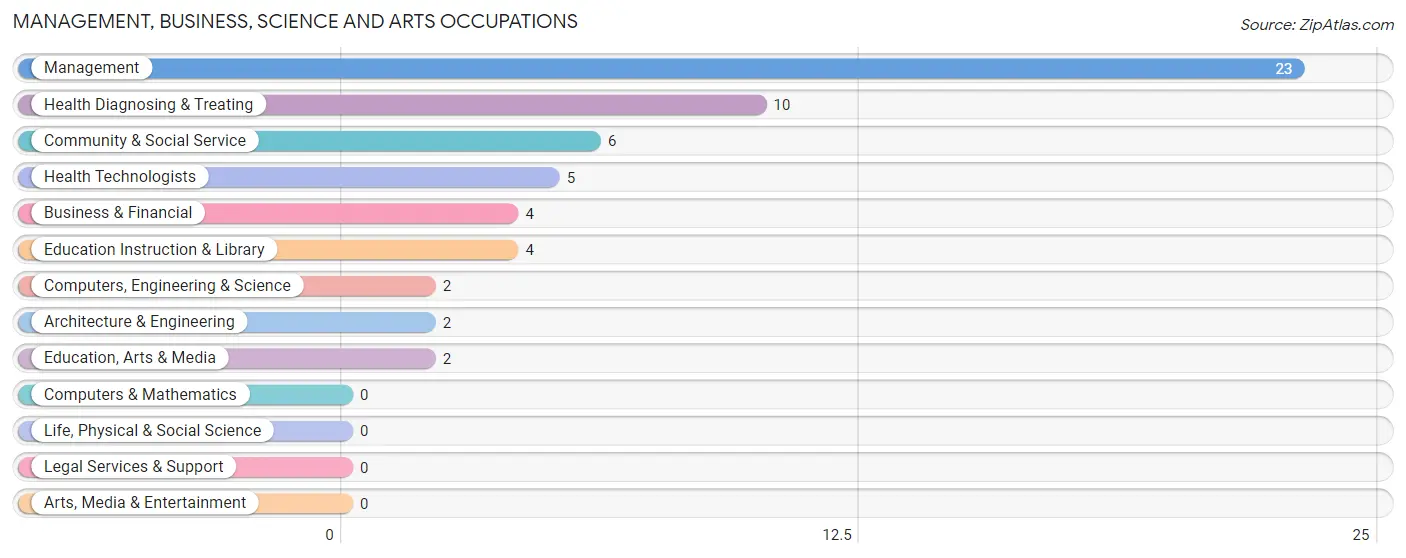
Management, Business, Science and Arts Occupations
The most common Management, Business, Science and Arts occupations in Carter Springs are Management (23 | 10.6%), Health Diagnosing & Treating (10 | 4.6%), Community & Social Service (6 | 2.8%), Health Technologists (5 | 2.3%), and Business & Financial (4 | 1.8%).
Management, Business, Science and Arts Occupations by Sex
Within the Management, Business, Science and Arts occupations in Carter Springs, the most male-oriented occupations are Computers, Engineering & Science (100.0%), Architecture & Engineering (100.0%), and Business & Financial (50.0%), while the most female-oriented occupations are Education, Arts & Media (100.0%), Health Diagnosing & Treating (100.0%), and Health Technologists (100.0%).
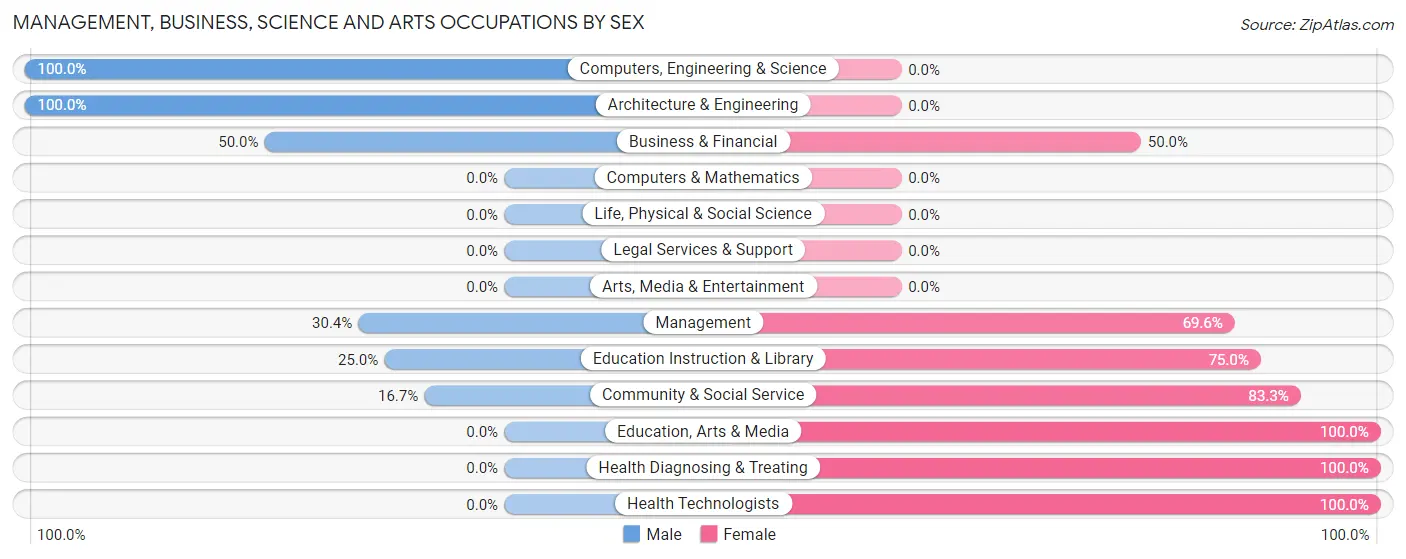
| Occupation | Male | Female |
| Management | 7 (30.4%) | 16 (69.6%) |
| Business & Financial | 2 (50.0%) | 2 (50.0%) |
| Computers, Engineering & Science | 2 (100.0%) | 0 (0.0%) |
| Computers & Mathematics | 0 (0.0%) | 0 (0.0%) |
| Architecture & Engineering | 2 (100.0%) | 0 (0.0%) |
| Life, Physical & Social Science | 0 (0.0%) | 0 (0.0%) |
| Community & Social Service | 1 (16.7%) | 5 (83.3%) |
| Education, Arts & Media | 0 (0.0%) | 2 (100.0%) |
| Legal Services & Support | 0 (0.0%) | 0 (0.0%) |
| Education Instruction & Library | 1 (25.0%) | 3 (75.0%) |
| Arts, Media & Entertainment | 0 (0.0%) | 0 (0.0%) |
| Health Diagnosing & Treating | 0 (0.0%) | 10 (100.0%) |
| Health Technologists | 0 (0.0%) | 5 (100.0%) |
| Total (Category) | 12 (26.7%) | 33 (73.3%) |
| Total (Overall) | 106 (48.8%) | 111 (51.1%) |
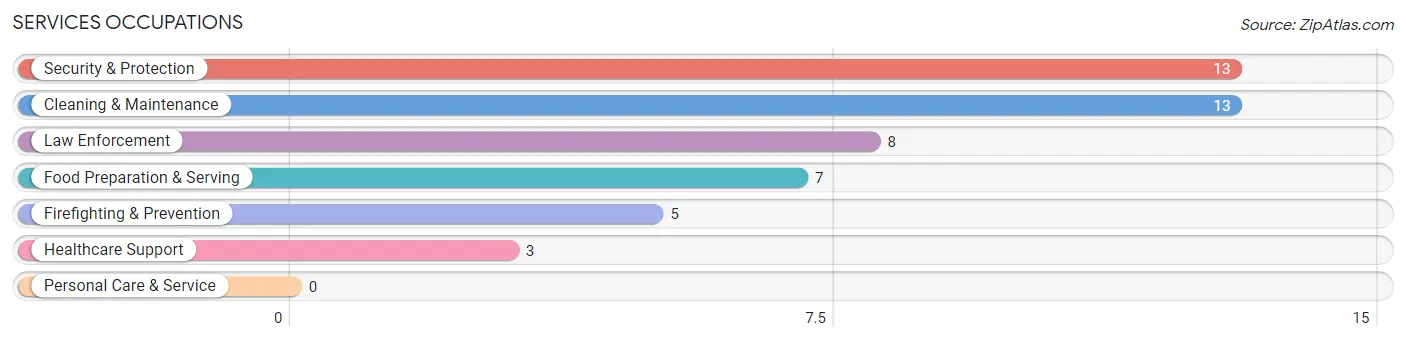
Services Occupations
The most common Services occupations in Carter Springs are Security & Protection (13 | 6.0%), Cleaning & Maintenance (13 | 6.0%), Law Enforcement (8 | 3.7%), Food Preparation & Serving (7 | 3.2%), and Firefighting & Prevention (5 | 2.3%).
Services Occupations by Sex
Within the Services occupations in Carter Springs, the most male-oriented occupations are Law Enforcement (100.0%), Security & Protection (76.9%), and Firefighting & Prevention (40.0%), while the most female-oriented occupations are Healthcare Support (100.0%), Food Preparation & Serving (100.0%), and Cleaning & Maintenance (84.6%).
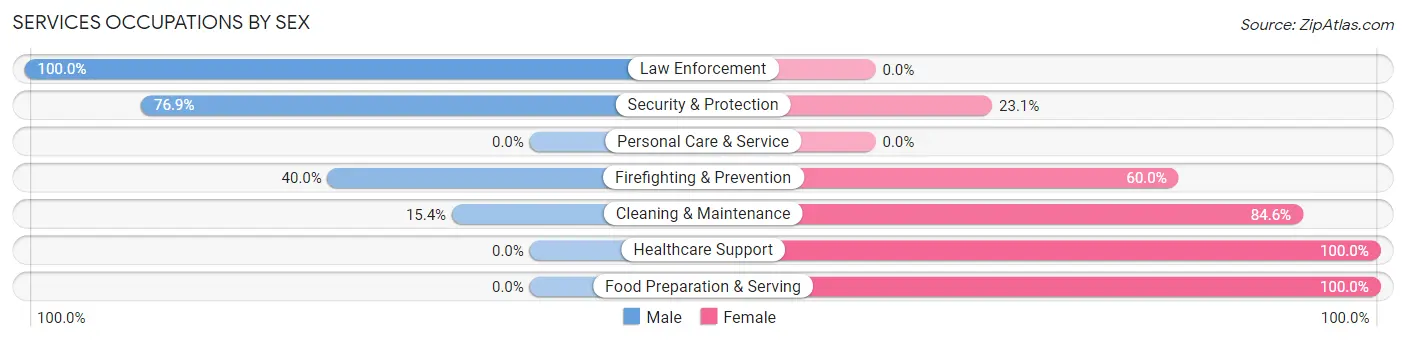
| Occupation | Male | Female |
| Healthcare Support | 0 (0.0%) | 3 (100.0%) |
| Security & Protection | 10 (76.9%) | 3 (23.1%) |
| Firefighting & Prevention | 2 (40.0%) | 3 (60.0%) |
| Law Enforcement | 8 (100.0%) | 0 (0.0%) |
| Food Preparation & Serving | 0 (0.0%) | 7 (100.0%) |
| Cleaning & Maintenance | 2 (15.4%) | 11 (84.6%) |
| Personal Care & Service | 0 (0.0%) | 0 (0.0%) |
| Total (Category) | 12 (33.3%) | 24 (66.7%) |
| Total (Overall) | 106 (48.8%) | 111 (51.1%) |
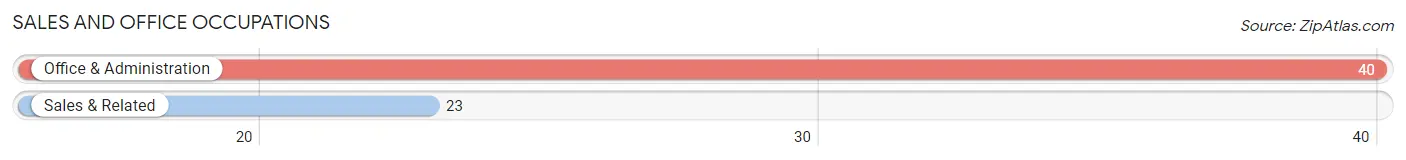
Sales and Office Occupations
The most common Sales and Office occupations in Carter Springs are Office & Administration (40 | 18.4%), and Sales & Related (23 | 10.6%).
Sales and Office Occupations by Sex
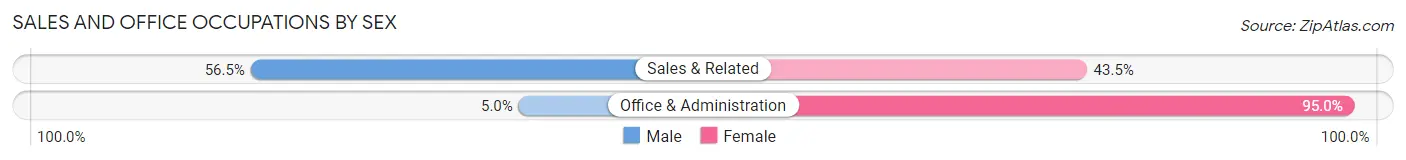
| Occupation | Male | Female |
| Sales & Related | 13 (56.5%) | 10 (43.5%) |
| Office & Administration | 2 (5.0%) | 38 (95.0%) |
| Total (Category) | 15 (23.8%) | 48 (76.2%) |
| Total (Overall) | 106 (48.8%) | 111 (51.1%) |
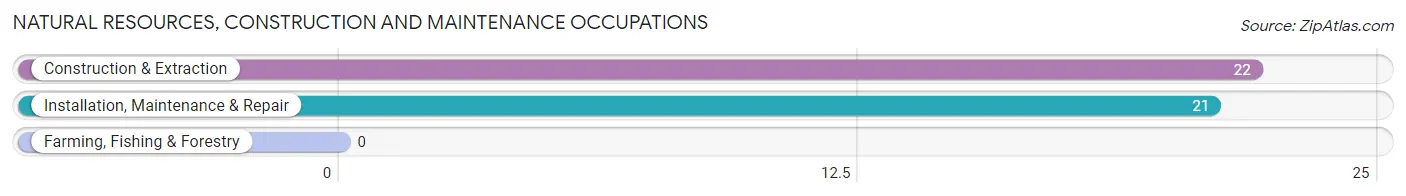
Natural Resources, Construction and Maintenance Occupations
The most common Natural Resources, Construction and Maintenance occupations in Carter Springs are Construction & Extraction (22 | 10.1%), and Installation, Maintenance & Repair (21 | 9.7%).
Natural Resources, Construction and Maintenance Occupations by Sex
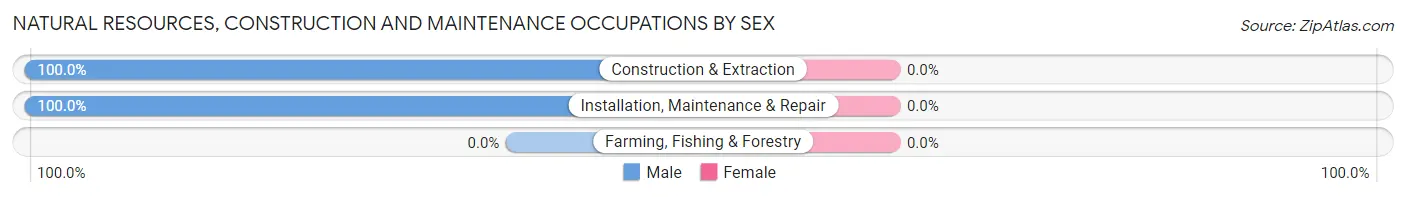
| Occupation | Male | Female |
| Farming, Fishing & Forestry | 0 (0.0%) | 0 (0.0%) |
| Construction & Extraction | 22 (100.0%) | 0 (0.0%) |
| Installation, Maintenance & Repair | 21 (100.0%) | 0 (0.0%) |
| Total (Category) | 43 (100.0%) | 0 (0.0%) |
| Total (Overall) | 106 (48.8%) | 111 (51.1%) |
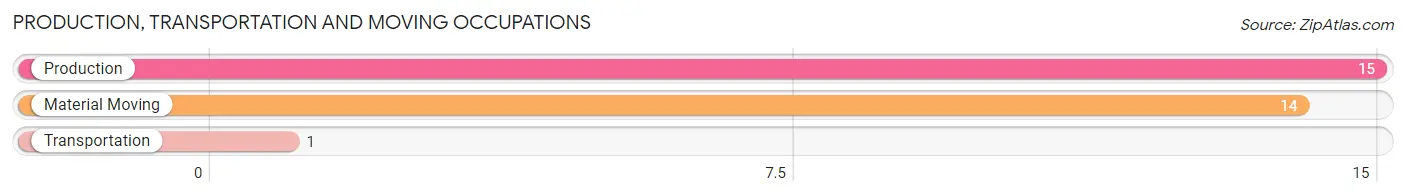
Production, Transportation and Moving Occupations
The most common Production, Transportation and Moving occupations in Carter Springs are Production (15 | 6.9%), Material Moving (14 | 6.5%), and Transportation (1 | 0.5%).
Production, Transportation and Moving Occupations by Sex
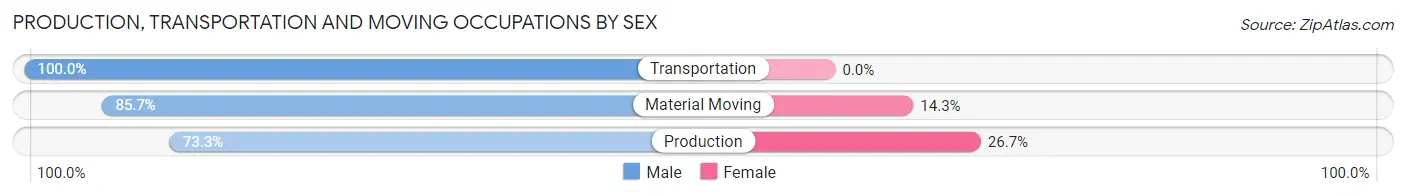
| Occupation | Male | Female |
| Production | 11 (73.3%) | 4 (26.7%) |
| Transportation | 1 (100.0%) | 0 (0.0%) |
| Material Moving | 12 (85.7%) | 2 (14.3%) |
| Total (Category) | 24 (80.0%) | 6 (20.0%) |
| Total (Overall) | 106 (48.8%) | 111 (51.1%) |
Employment Industries by Sex in Carter Springs
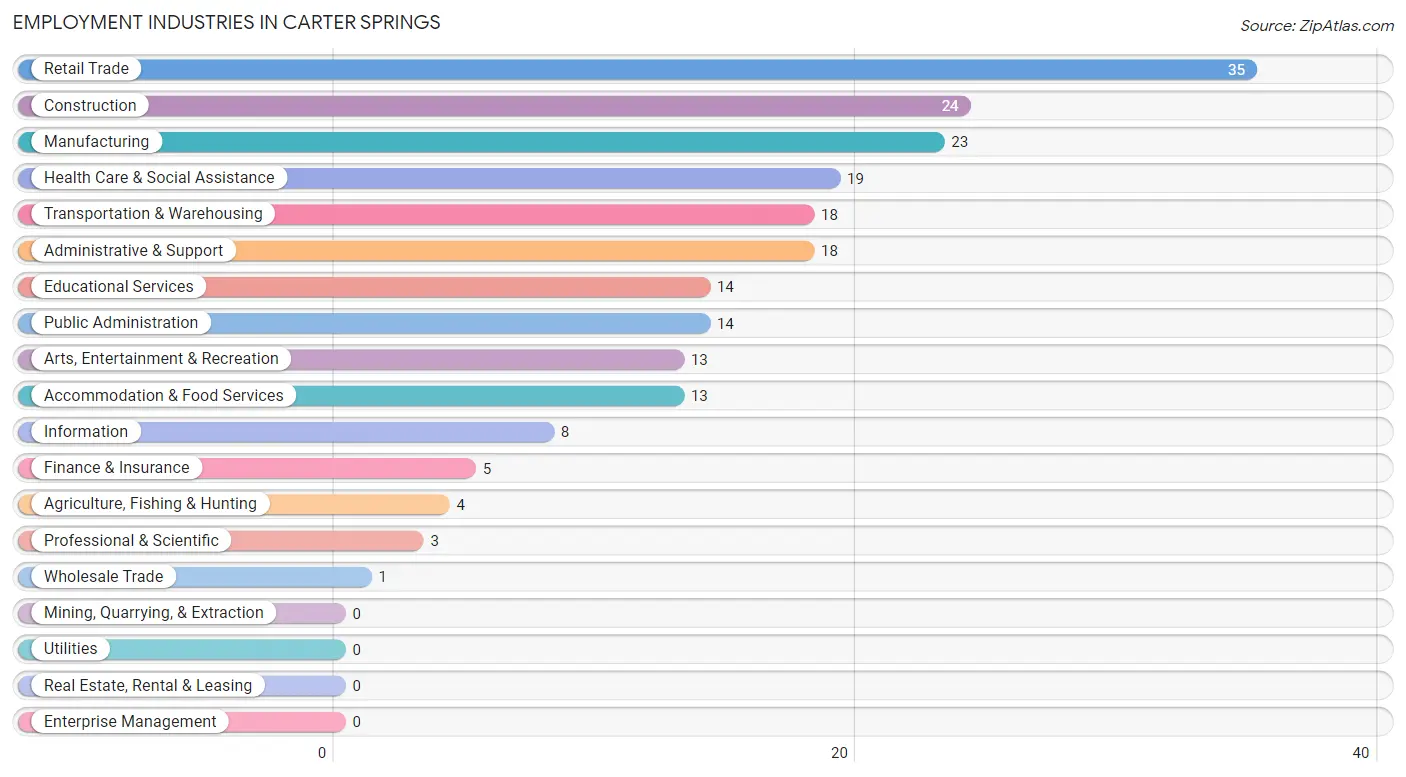
Employment Industries in Carter Springs
The major employment industries in Carter Springs include Retail Trade (35 | 16.1%), Construction (24 | 11.1%), Manufacturing (23 | 10.6%), Health Care & Social Assistance (19 | 8.8%), and Transportation & Warehousing (18 | 8.3%).
Employment Industries by Sex in Carter Springs
The Carter Springs industries that see more men than women are Construction (100.0%), Information (100.0%), and Public Administration (78.6%), whereas the industries that tend to have a higher number of women are Agriculture, Fishing & Hunting (100.0%), Wholesale Trade (100.0%), and Professional & Scientific (100.0%).
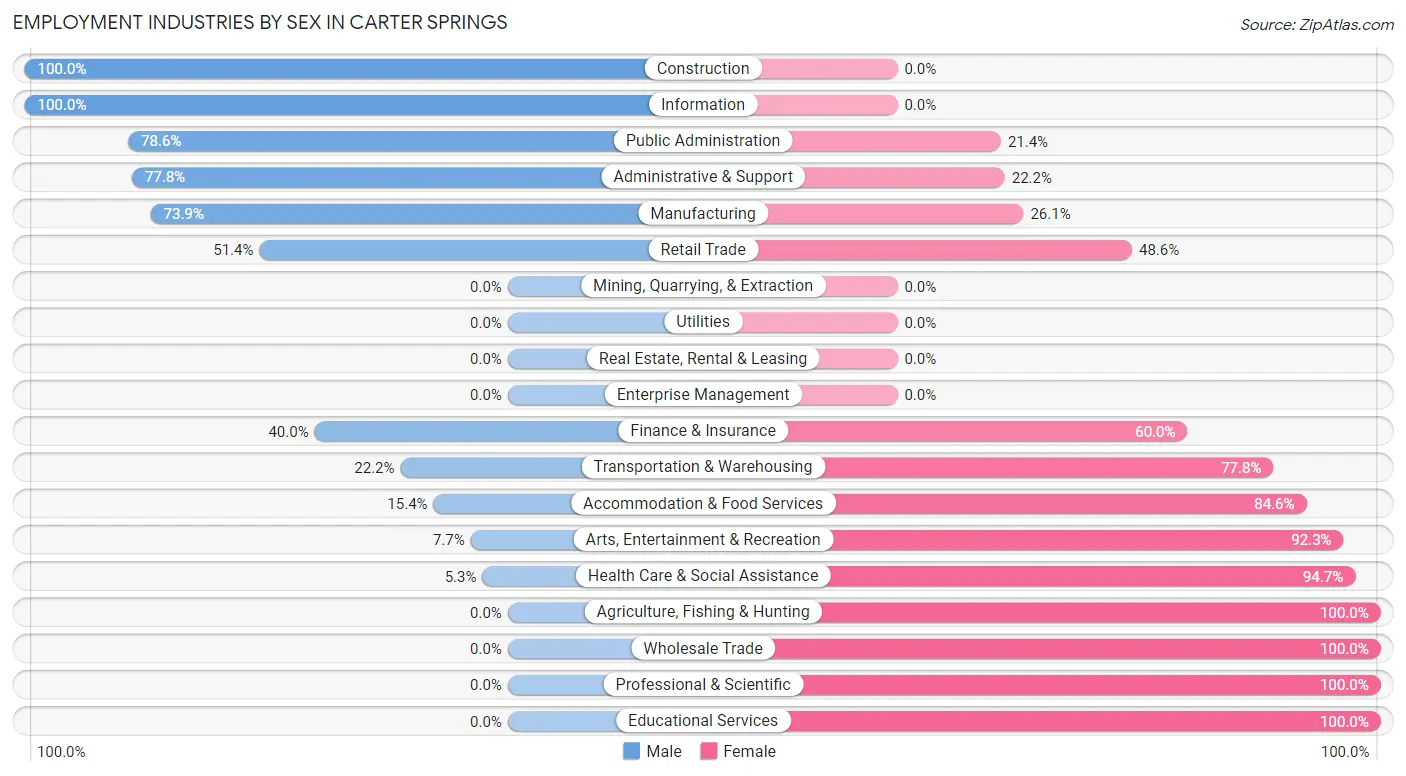
| Industry | Male | Female |
| Agriculture, Fishing & Hunting | 0 (0.0%) | 4 (100.0%) |
| Mining, Quarrying, & Extraction | 0 (0.0%) | 0 (0.0%) |
| Construction | 24 (100.0%) | 0 (0.0%) |
| Manufacturing | 17 (73.9%) | 6 (26.1%) |
| Wholesale Trade | 0 (0.0%) | 1 (100.0%) |
| Retail Trade | 18 (51.4%) | 17 (48.6%) |
| Transportation & Warehousing | 4 (22.2%) | 14 (77.8%) |
| Utilities | 0 (0.0%) | 0 (0.0%) |
| Information | 8 (100.0%) | 0 (0.0%) |
| Finance & Insurance | 2 (40.0%) | 3 (60.0%) |
| Real Estate, Rental & Leasing | 0 (0.0%) | 0 (0.0%) |
| Professional & Scientific | 0 (0.0%) | 3 (100.0%) |
| Enterprise Management | 0 (0.0%) | 0 (0.0%) |
| Administrative & Support | 14 (77.8%) | 4 (22.2%) |
| Educational Services | 0 (0.0%) | 14 (100.0%) |
| Health Care & Social Assistance | 1 (5.3%) | 18 (94.7%) |
| Arts, Entertainment & Recreation | 1 (7.7%) | 12 (92.3%) |
| Accommodation & Food Services | 2 (15.4%) | 11 (84.6%) |
| Public Administration | 11 (78.6%) | 3 (21.4%) |
| Total | 106 (48.8%) | 111 (51.1%) |
Education in Carter Springs
School Enrollment in Carter Springs
The most common levels of schooling among the 120 students in Carter Springs are high school (38 | 31.7%), college / undergraduate (37 | 30.8%), and elementary school (21 | 17.5%).
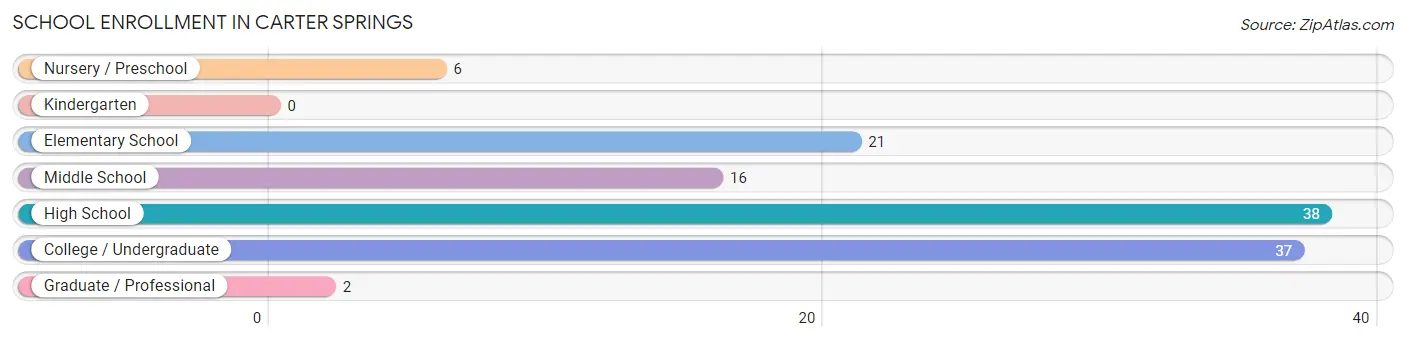
| School Level | # Students | % Students |
| Nursery / Preschool | 6 | 5.0% |
| Kindergarten | 0 | 0.0% |
| Elementary School | 21 | 17.5% |
| Middle School | 16 | 13.3% |
| High School | 38 | 31.7% |
| College / Undergraduate | 37 | 30.8% |
| Graduate / Professional | 2 | 1.7% |
| Total | 120 | 100.0% |
School Enrollment by Age by Funding Source in Carter Springs
Out of a total of 120 students who are enrolled in schools in Carter Springs, 34 (28.3%) attend a private institution, while the remaining 86 (71.7%) are enrolled in public schools. The age group of 3 to 4 year olds has the highest likelihood of being enrolled in private schools, with 6 (100.0% in the age bracket) enrolled. Conversely, the age group of 18 to 19 year olds has the lowest likelihood of being enrolled in a private school, with 9 (100.0% in the age bracket) attending a public institution.
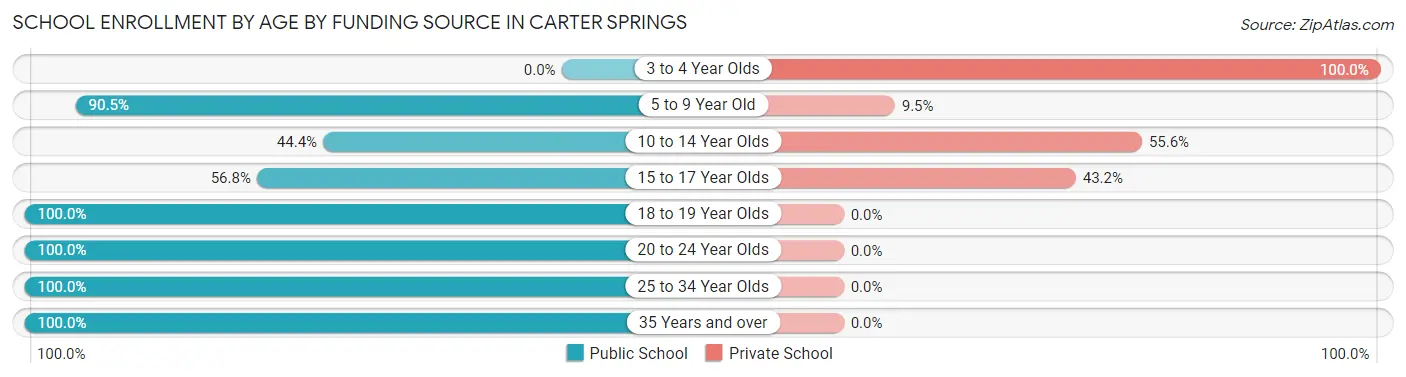
| Age Bracket | Public School | Private School |
| 3 to 4 Year Olds | 0 (0.0%) | 6 (100.0%) |
| 5 to 9 Year Old | 19 (90.5%) | 2 (9.5%) |
| 10 to 14 Year Olds | 8 (44.4%) | 10 (55.6%) |
| 15 to 17 Year Olds | 21 (56.8%) | 16 (43.2%) |
| 18 to 19 Year Olds | 9 (100.0%) | 0 (0.0%) |
| 20 to 24 Year Olds | 9 (100.0%) | 0 (0.0%) |
| 25 to 34 Year Olds | 3 (100.0%) | 0 (0.0%) |
| 35 Years and over | 17 (100.0%) | 0 (0.0%) |
| Total | 86 (71.7%) | 34 (28.3%) |
Educational Attainment by Field of Study in Carter Springs
Business (22 | 36.1%), physical & health sciences (13 | 21.3%), arts & humanities (11 | 18.0%), science & technology (4 | 6.6%), and engineering (2 | 3.3%) are the most common fields of study among 61 individuals in Carter Springs who have obtained a bachelor's degree or higher.
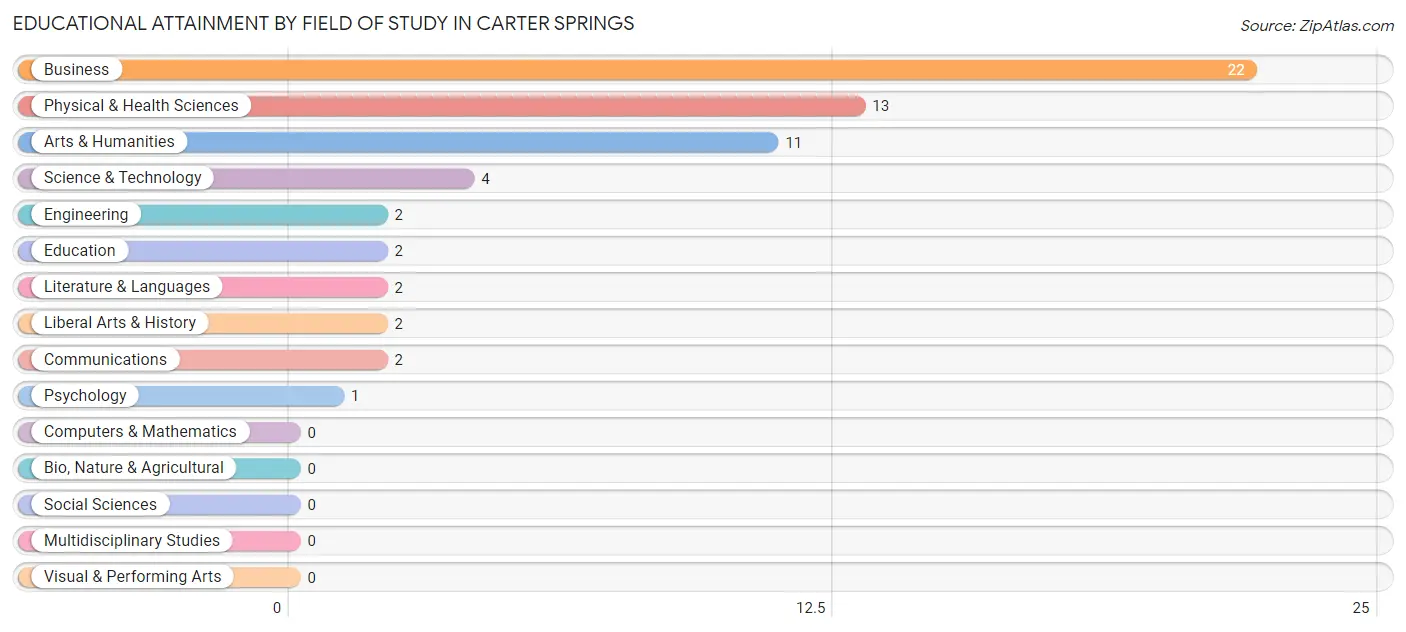
| Field of Study | # Graduates | % Graduates |
| Computers & Mathematics | 0 | 0.0% |
| Bio, Nature & Agricultural | 0 | 0.0% |
| Physical & Health Sciences | 13 | 21.3% |
| Psychology | 1 | 1.6% |
| Social Sciences | 0 | 0.0% |
| Engineering | 2 | 3.3% |
| Multidisciplinary Studies | 0 | 0.0% |
| Science & Technology | 4 | 6.6% |
| Business | 22 | 36.1% |
| Education | 2 | 3.3% |
| Literature & Languages | 2 | 3.3% |
| Liberal Arts & History | 2 | 3.3% |
| Visual & Performing Arts | 0 | 0.0% |
| Communications | 2 | 3.3% |
| Arts & Humanities | 11 | 18.0% |
| Total | 61 | 100.0% |
Transportation & Commute in Carter Springs
Vehicle Availability by Sex in Carter Springs
The most prevalent vehicle ownership categories in Carter Springs are males with 2 vehicles (46, accounting for 43.0%) and females with 2 vehicles (46, making up 41.4%).
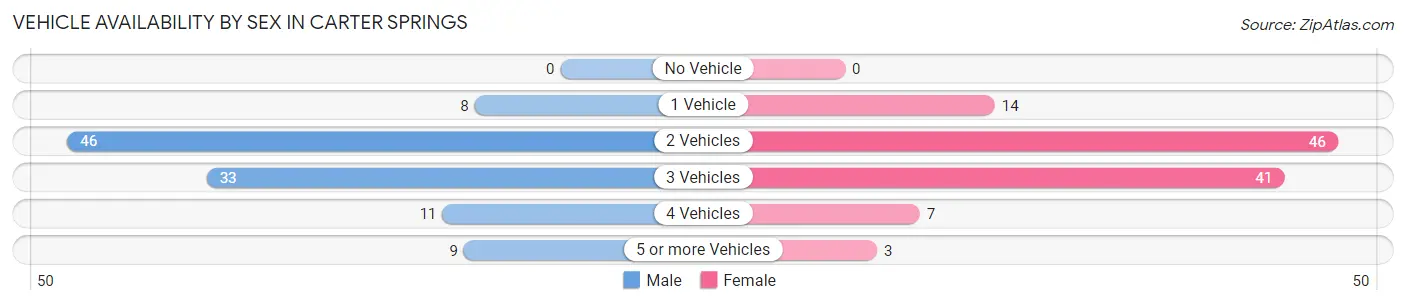
| Vehicles Available | Male | Female |
| No Vehicle | 0 (0.0%) | 0 (0.0%) |
| 1 Vehicle | 8 (7.5%) | 14 (12.6%) |
| 2 Vehicles | 46 (43.0%) | 46 (41.4%) |
| 3 Vehicles | 33 (30.8%) | 41 (36.9%) |
| 4 Vehicles | 11 (10.3%) | 7 (6.3%) |
| 5 or more Vehicles | 9 (8.4%) | 3 (2.7%) |
| Total | 107 (100.0%) | 111 (100.0%) |
Commute Time in Carter Springs
The most frequently occuring commute durations in Carter Springs are 45 to 59 minutes (39 commuters, 20.4%), 15 to 19 minutes (35 commuters, 18.3%), and 20 to 24 minutes (31 commuters, 16.2%).
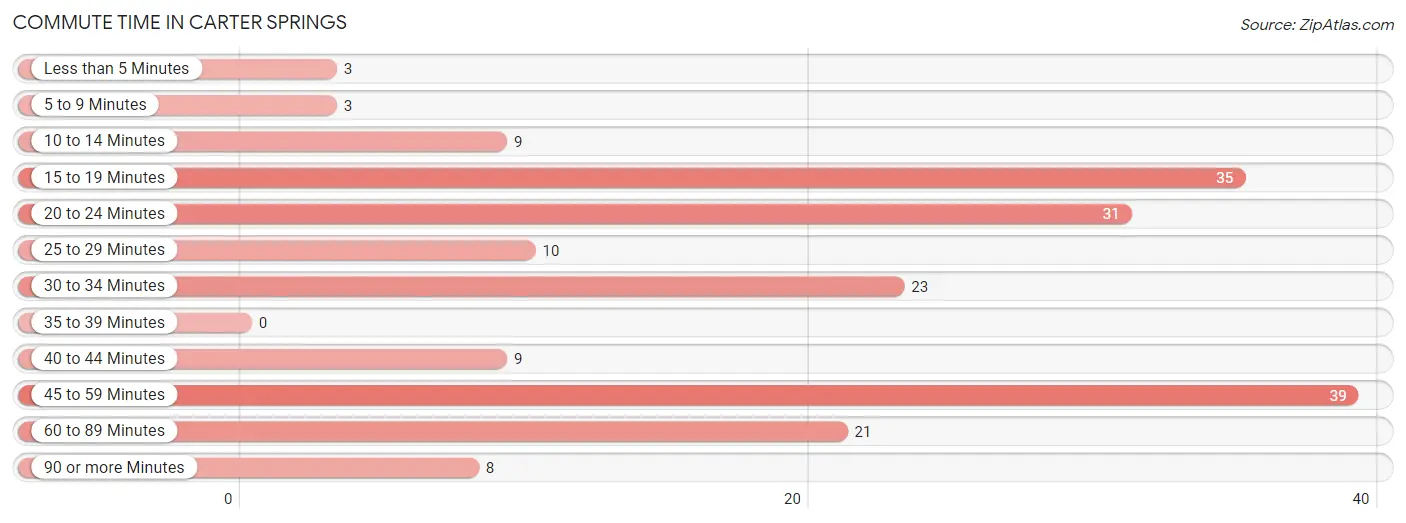
| Commute Time | # Commuters | % Commuters |
| Less than 5 Minutes | 3 | 1.6% |
| 5 to 9 Minutes | 3 | 1.6% |
| 10 to 14 Minutes | 9 | 4.7% |
| 15 to 19 Minutes | 35 | 18.3% |
| 20 to 24 Minutes | 31 | 16.2% |
| 25 to 29 Minutes | 10 | 5.2% |
| 30 to 34 Minutes | 23 | 12.0% |
| 35 to 39 Minutes | 0 | 0.0% |
| 40 to 44 Minutes | 9 | 4.7% |
| 45 to 59 Minutes | 39 | 20.4% |
| 60 to 89 Minutes | 21 | 11.0% |
| 90 or more Minutes | 8 | 4.2% |
Commute Time by Sex in Carter Springs
The most common commute times in Carter Springs are 15 to 19 minutes (24 commuters, 24.5%) for males and 20 to 24 minutes (24 commuters, 25.8%) for females.
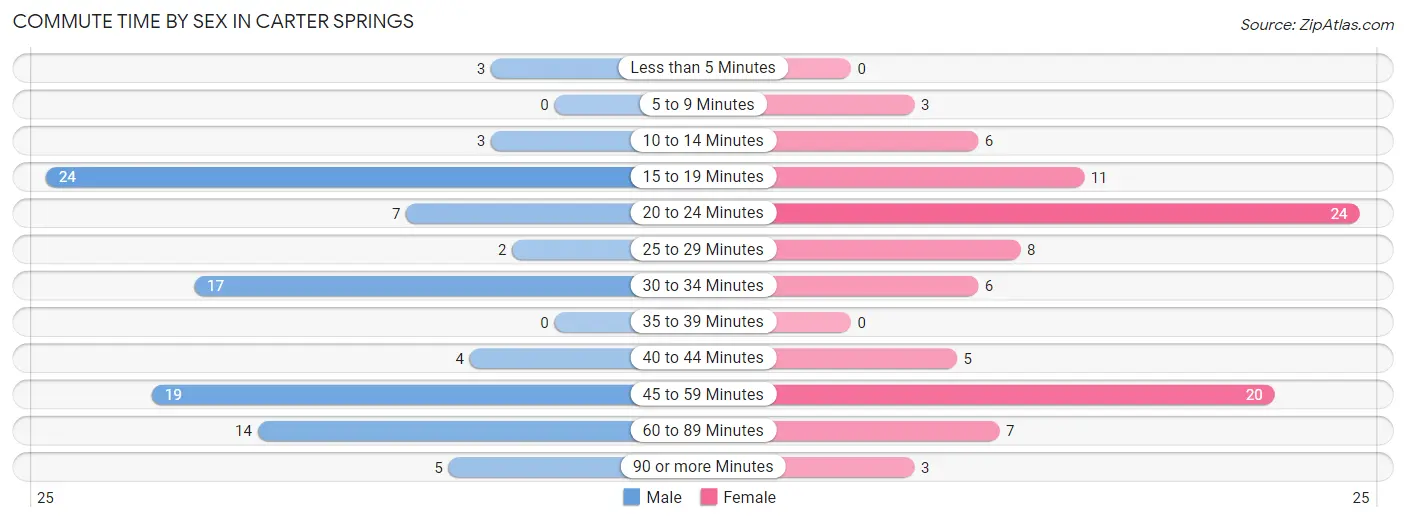
| Commute Time | Male | Female |
| Less than 5 Minutes | 3 (3.1%) | 0 (0.0%) |
| 5 to 9 Minutes | 0 (0.0%) | 3 (3.2%) |
| 10 to 14 Minutes | 3 (3.1%) | 6 (6.5%) |
| 15 to 19 Minutes | 24 (24.5%) | 11 (11.8%) |
| 20 to 24 Minutes | 7 (7.1%) | 24 (25.8%) |
| 25 to 29 Minutes | 2 (2.0%) | 8 (8.6%) |
| 30 to 34 Minutes | 17 (17.3%) | 6 (6.5%) |
| 35 to 39 Minutes | 0 (0.0%) | 0 (0.0%) |
| 40 to 44 Minutes | 4 (4.1%) | 5 (5.4%) |
| 45 to 59 Minutes | 19 (19.4%) | 20 (21.5%) |
| 60 to 89 Minutes | 14 (14.3%) | 7 (7.5%) |
| 90 or more Minutes | 5 (5.1%) | 3 (3.2%) |
Time of Departure to Work by Sex in Carter Springs
The most frequent times of departure to work in Carter Springs are 6:00 AM to 6:29 AM (22, 22.5%) for males and 8:00 AM to 8:29 AM (18, 19.4%) for females.
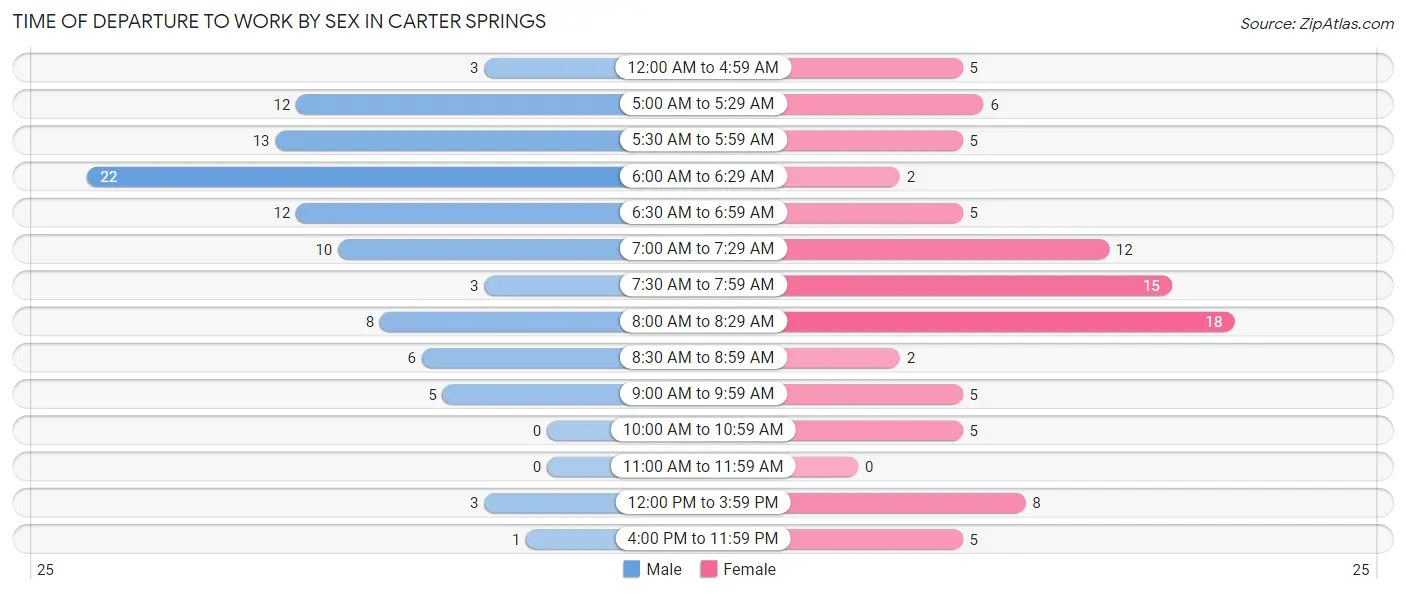
| Time of Departure | Male | Female |
| 12:00 AM to 4:59 AM | 3 (3.1%) | 5 (5.4%) |
| 5:00 AM to 5:29 AM | 12 (12.2%) | 6 (6.5%) |
| 5:30 AM to 5:59 AM | 13 (13.3%) | 5 (5.4%) |
| 6:00 AM to 6:29 AM | 22 (22.5%) | 2 (2.1%) |
| 6:30 AM to 6:59 AM | 12 (12.2%) | 5 (5.4%) |
| 7:00 AM to 7:29 AM | 10 (10.2%) | 12 (12.9%) |
| 7:30 AM to 7:59 AM | 3 (3.1%) | 15 (16.1%) |
| 8:00 AM to 8:29 AM | 8 (8.2%) | 18 (19.4%) |
| 8:30 AM to 8:59 AM | 6 (6.1%) | 2 (2.1%) |
| 9:00 AM to 9:59 AM | 5 (5.1%) | 5 (5.4%) |
| 10:00 AM to 10:59 AM | 0 (0.0%) | 5 (5.4%) |
| 11:00 AM to 11:59 AM | 0 (0.0%) | 0 (0.0%) |
| 12:00 PM to 3:59 PM | 3 (3.1%) | 8 (8.6%) |
| 4:00 PM to 11:59 PM | 1 (1.0%) | 5 (5.4%) |
| Total | 98 (100.0%) | 93 (100.0%) |
Housing Occupancy in Carter Springs
Occupancy by Ownership in Carter Springs
Of the total 184 dwellings in Carter Springs, owner-occupied units account for 134 (72.8%), while renter-occupied units make up 50 (27.2%).
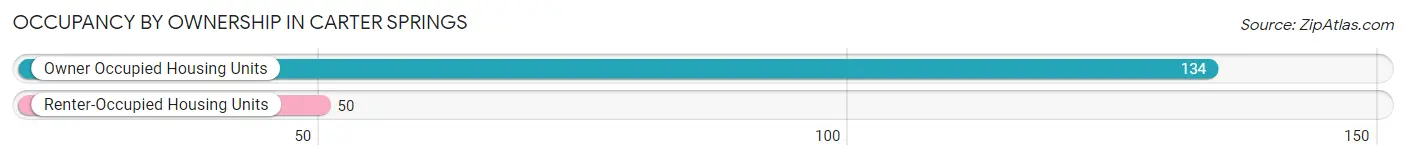
| Occupancy | # Housing Units | % Housing Units |
| Owner Occupied Housing Units | 134 | 72.8% |
| Renter-Occupied Housing Units | 50 | 27.2% |
| Total Occupied Housing Units | 184 | 100.0% |
Occupancy by Household Size in Carter Springs
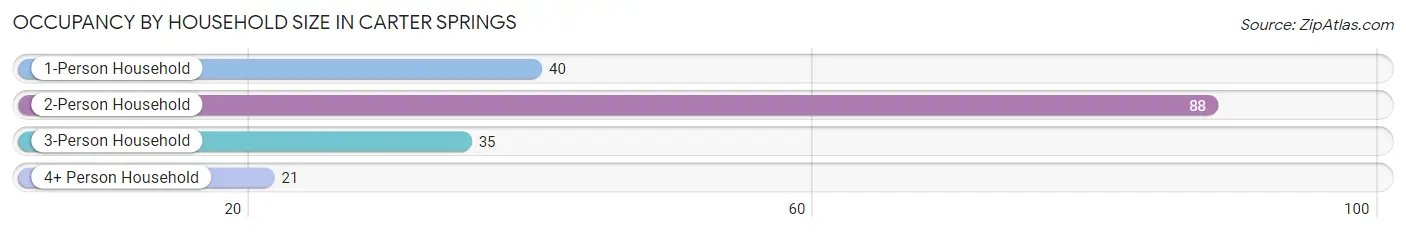
| Household Size | # Housing Units | % Housing Units |
| 1-Person Household | 40 | 21.7% |
| 2-Person Household | 88 | 47.8% |
| 3-Person Household | 35 | 19.0% |
| 4+ Person Household | 21 | 11.4% |
| Total Housing Units | 184 | 100.0% |
Occupancy by Ownership by Household Size in Carter Springs
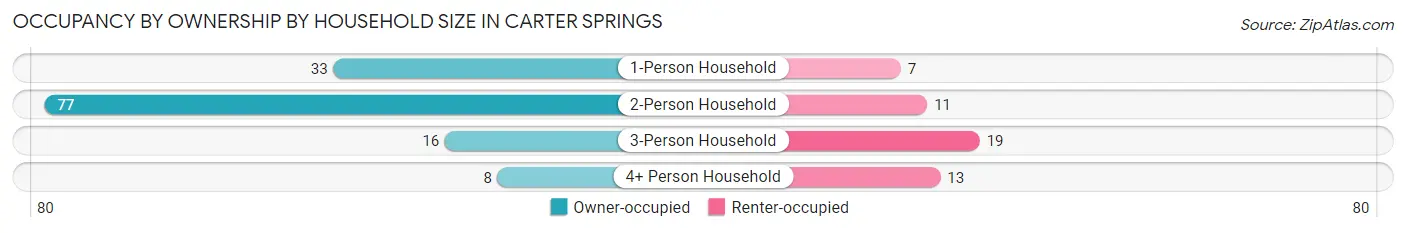
| Household Size | Owner-occupied | Renter-occupied |
| 1-Person Household | 33 (82.5%) | 7 (17.5%) |
| 2-Person Household | 77 (87.5%) | 11 (12.5%) |
| 3-Person Household | 16 (45.7%) | 19 (54.3%) |
| 4+ Person Household | 8 (38.1%) | 13 (61.9%) |
| Total Housing Units | 134 (72.8%) | 50 (27.2%) |
Occupancy by Educational Attainment in Carter Springs
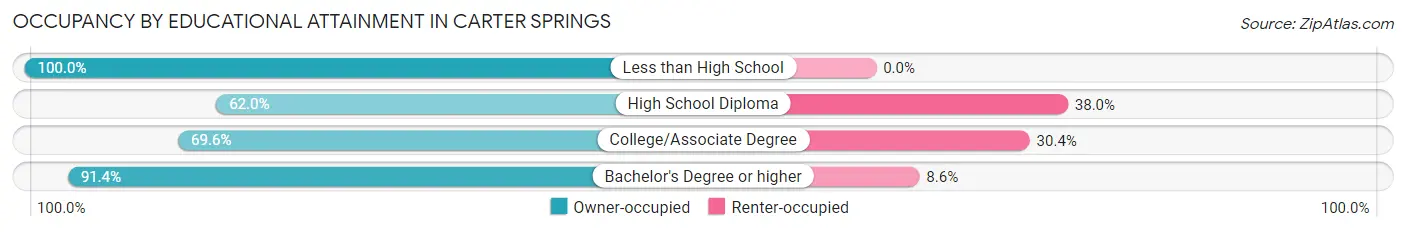
| Household Size | Owner-occupied | Renter-occupied |
| Less than High School | 7 (100.0%) | 0 (0.0%) |
| High School Diploma | 31 (62.0%) | 19 (38.0%) |
| College/Associate Degree | 64 (69.6%) | 28 (30.4%) |
| Bachelor's Degree or higher | 32 (91.4%) | 3 (8.6%) |
Occupancy by Age of Householder in Carter Springs
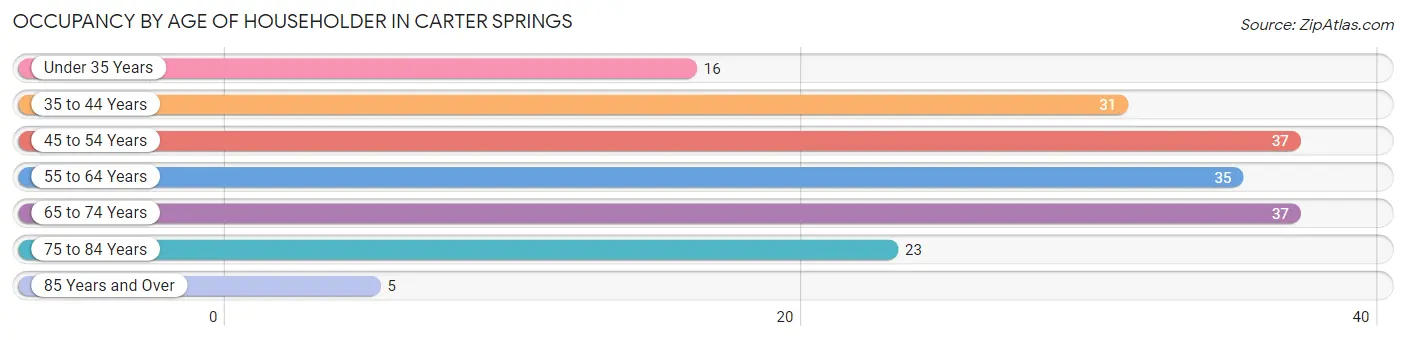
| Age Bracket | # Households | % Households |
| Under 35 Years | 16 | 8.7% |
| 35 to 44 Years | 31 | 16.9% |
| 45 to 54 Years | 37 | 20.1% |
| 55 to 64 Years | 35 | 19.0% |
| 65 to 74 Years | 37 | 20.1% |
| 75 to 84 Years | 23 | 12.5% |
| 85 Years and Over | 5 | 2.7% |
| Total | 184 | 100.0% |
Housing Finances in Carter Springs
Median Income by Occupancy in Carter Springs
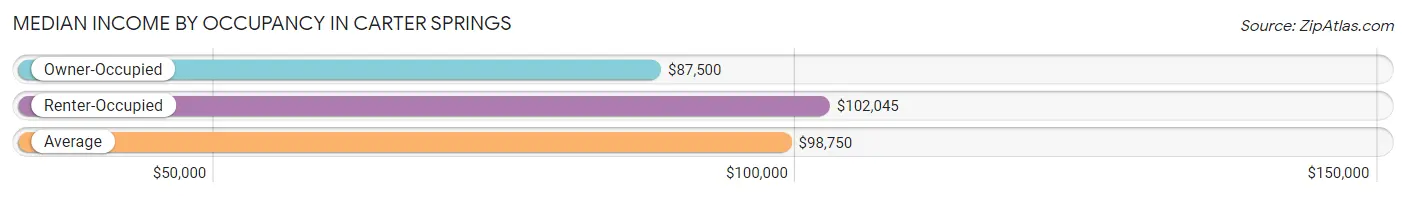
| Occupancy Type | # Households | Median Income |
| Owner-Occupied | 134 (72.8%) | $87,500 |
| Renter-Occupied | 50 (27.2%) | $102,045 |
| Average | 184 (100.0%) | $98,750 |
Occupancy by Householder Income Bracket in Carter Springs
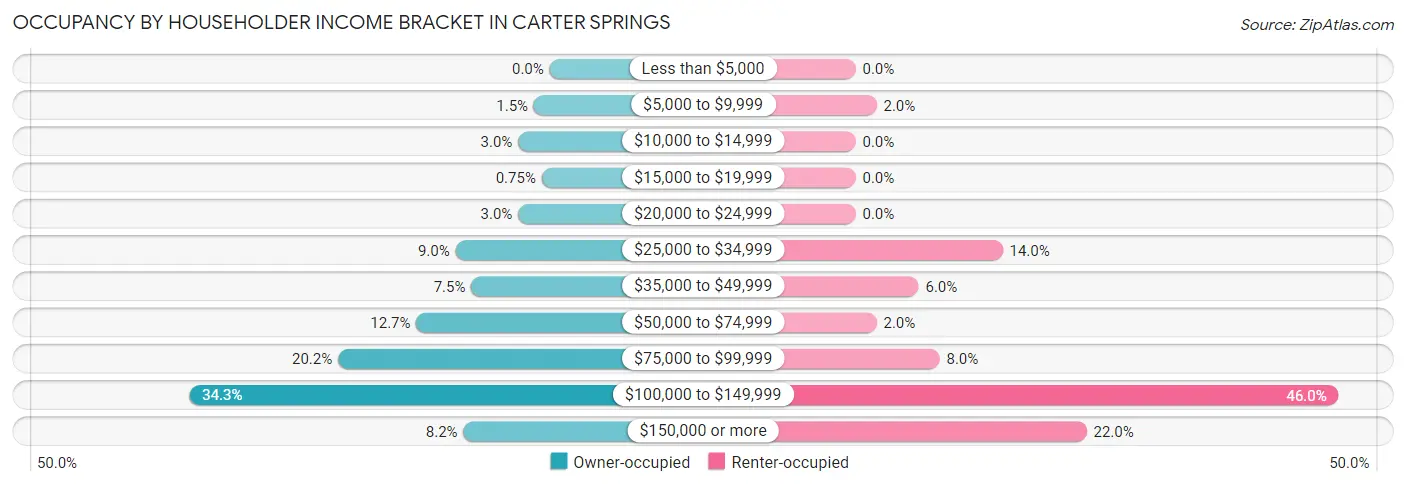
| Income Bracket | Owner-occupied | Renter-occupied |
| Less than $5,000 | 0 (0.0%) | 0 (0.0%) |
| $5,000 to $9,999 | 2 (1.5%) | 1 (2.0%) |
| $10,000 to $14,999 | 4 (3.0%) | 0 (0.0%) |
| $15,000 to $19,999 | 1 (0.7%) | 0 (0.0%) |
| $20,000 to $24,999 | 4 (3.0%) | 0 (0.0%) |
| $25,000 to $34,999 | 12 (9.0%) | 7 (14.0%) |
| $35,000 to $49,999 | 10 (7.5%) | 3 (6.0%) |
| $50,000 to $74,999 | 17 (12.7%) | 1 (2.0%) |
| $75,000 to $99,999 | 27 (20.2%) | 4 (8.0%) |
| $100,000 to $149,999 | 46 (34.3%) | 23 (46.0%) |
| $150,000 or more | 11 (8.2%) | 11 (22.0%) |
| Total | 134 (100.0%) | 50 (100.0%) |
Monthly Housing Cost Tiers in Carter Springs
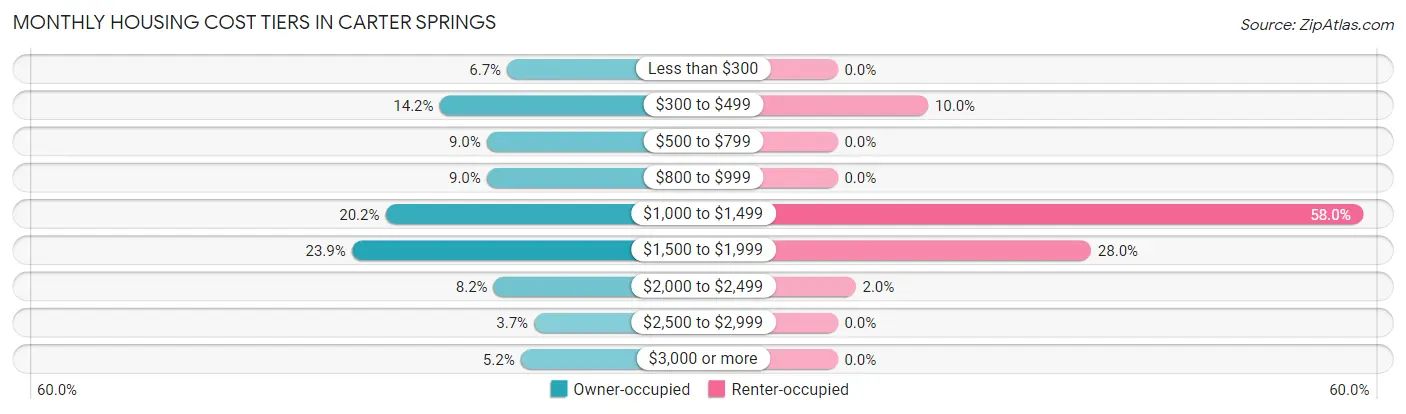
| Monthly Cost | Owner-occupied | Renter-occupied |
| Less than $300 | 9 (6.7%) | 0 (0.0%) |
| $300 to $499 | 19 (14.2%) | 5 (10.0%) |
| $500 to $799 | 12 (9.0%) | 0 (0.0%) |
| $800 to $999 | 12 (9.0%) | 0 (0.0%) |
| $1,000 to $1,499 | 27 (20.2%) | 29 (58.0%) |
| $1,500 to $1,999 | 32 (23.9%) | 14 (28.0%) |
| $2,000 to $2,499 | 11 (8.2%) | 1 (2.0%) |
| $2,500 to $2,999 | 5 (3.7%) | 0 (0.0%) |
| $3,000 or more | 7 (5.2%) | 0 (0.0%) |
| Total | 134 (100.0%) | 50 (100.0%) |
Physical Housing Characteristics in Carter Springs
Housing Structures in Carter Springs
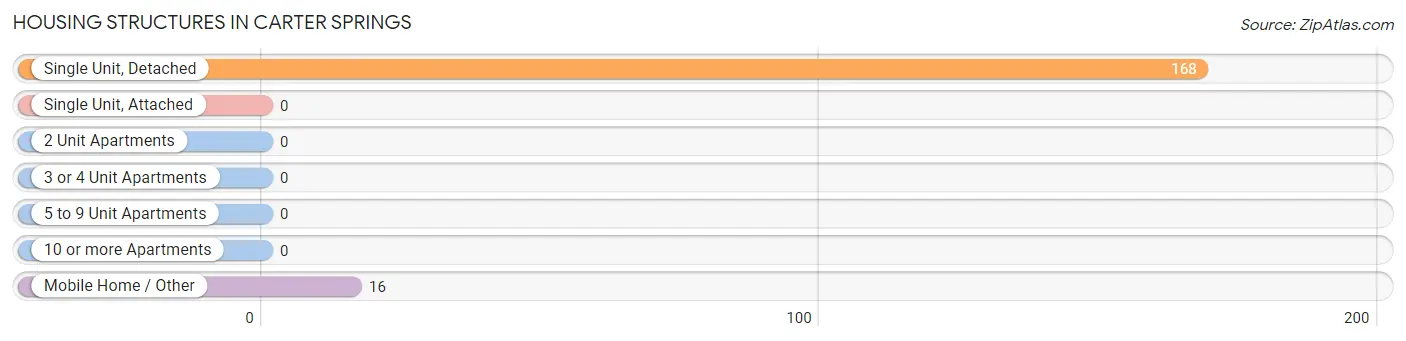
| Structure Type | # Housing Units | % Housing Units |
| Single Unit, Detached | 168 | 91.3% |
| Single Unit, Attached | 0 | 0.0% |
| 2 Unit Apartments | 0 | 0.0% |
| 3 or 4 Unit Apartments | 0 | 0.0% |
| 5 to 9 Unit Apartments | 0 | 0.0% |
| 10 or more Apartments | 0 | 0.0% |
| Mobile Home / Other | 16 | 8.7% |
| Total | 184 | 100.0% |
Housing Structures by Occupancy in Carter Springs
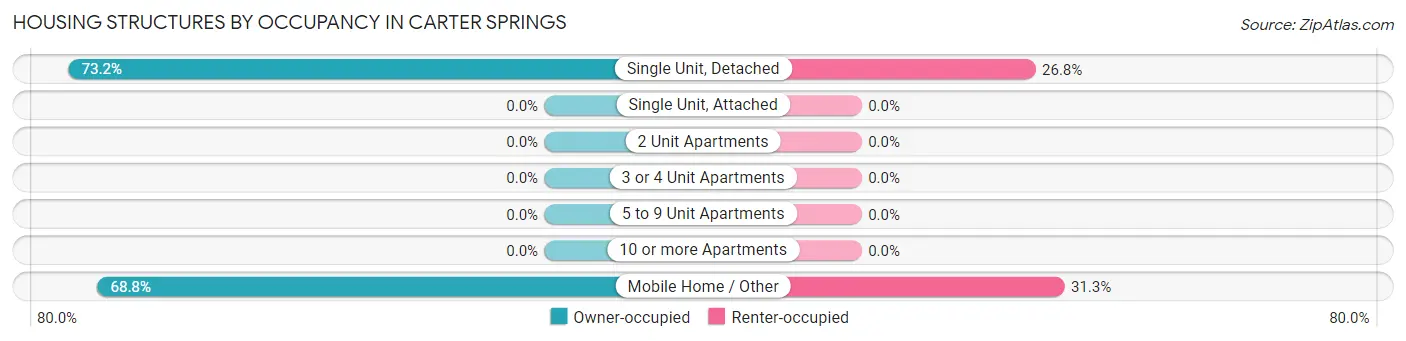
| Structure Type | Owner-occupied | Renter-occupied |
| Single Unit, Detached | 123 (73.2%) | 45 (26.8%) |
| Single Unit, Attached | 0 (0.0%) | 0 (0.0%) |
| 2 Unit Apartments | 0 (0.0%) | 0 (0.0%) |
| 3 or 4 Unit Apartments | 0 (0.0%) | 0 (0.0%) |
| 5 to 9 Unit Apartments | 0 (0.0%) | 0 (0.0%) |
| 10 or more Apartments | 0 (0.0%) | 0 (0.0%) |
| Mobile Home / Other | 11 (68.8%) | 5 (31.2%) |
| Total | 134 (72.8%) | 50 (27.2%) |
Housing Structures by Number of Rooms in Carter Springs
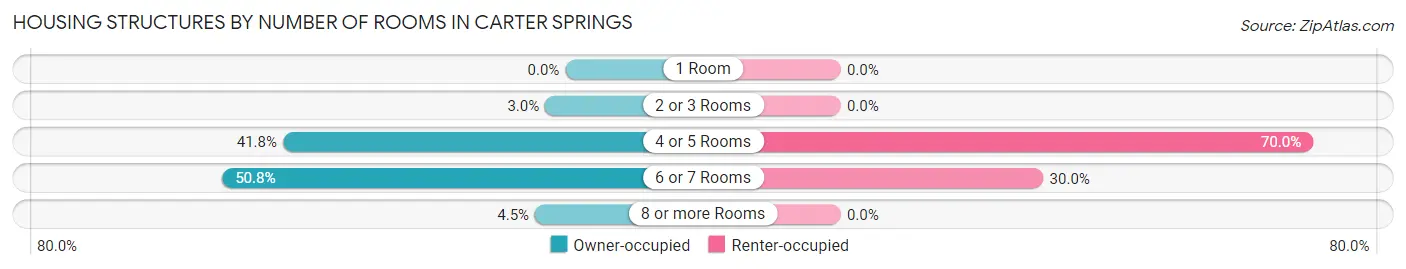
| Number of Rooms | Owner-occupied | Renter-occupied |
| 1 Room | 0 (0.0%) | 0 (0.0%) |
| 2 or 3 Rooms | 4 (3.0%) | 0 (0.0%) |
| 4 or 5 Rooms | 56 (41.8%) | 35 (70.0%) |
| 6 or 7 Rooms | 68 (50.7%) | 15 (30.0%) |
| 8 or more Rooms | 6 (4.5%) | 0 (0.0%) |
| Total | 134 (100.0%) | 50 (100.0%) |
Housing Structure by Heating Type in Carter Springs
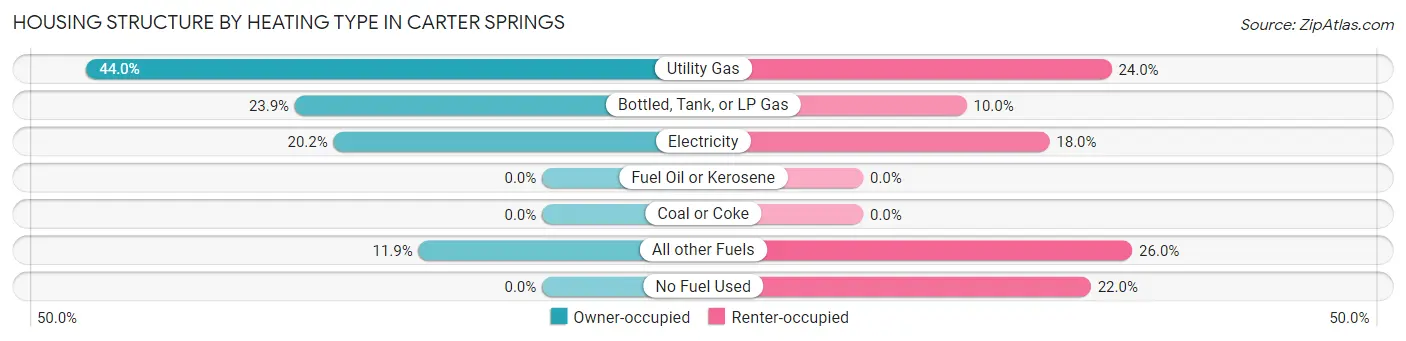
| Heating Type | Owner-occupied | Renter-occupied |
| Utility Gas | 59 (44.0%) | 12 (24.0%) |
| Bottled, Tank, or LP Gas | 32 (23.9%) | 5 (10.0%) |
| Electricity | 27 (20.2%) | 9 (18.0%) |
| Fuel Oil or Kerosene | 0 (0.0%) | 0 (0.0%) |
| Coal or Coke | 0 (0.0%) | 0 (0.0%) |
| All other Fuels | 16 (11.9%) | 13 (26.0%) |
| No Fuel Used | 0 (0.0%) | 11 (22.0%) |
| Total | 134 (100.0%) | 50 (100.0%) |
Household Vehicle Usage in Carter Springs
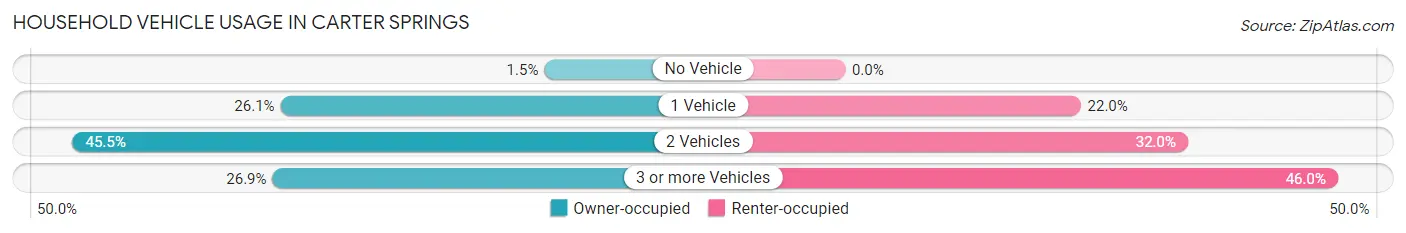
| Vehicles per Household | Owner-occupied | Renter-occupied |
| No Vehicle | 2 (1.5%) | 0 (0.0%) |
| 1 Vehicle | 35 (26.1%) | 11 (22.0%) |
| 2 Vehicles | 61 (45.5%) | 16 (32.0%) |
| 3 or more Vehicles | 36 (26.9%) | 23 (46.0%) |
| Total | 134 (100.0%) | 50 (100.0%) |
Real Estate & Mortgages in Carter Springs
Real Estate and Mortgage Overview in Carter Springs
| Characteristic | Without Mortgage | With Mortgage |
| Housing Units | 39 | 95 |
| Median Property Value | $326,500 | $296,900 |
| Median Household Income | $86,875 | $8 |
| Monthly Housing Costs | $348 | $5 |
| Real Estate Taxes | $947 | $14 |
Property Value by Mortgage Status in Carter Springs
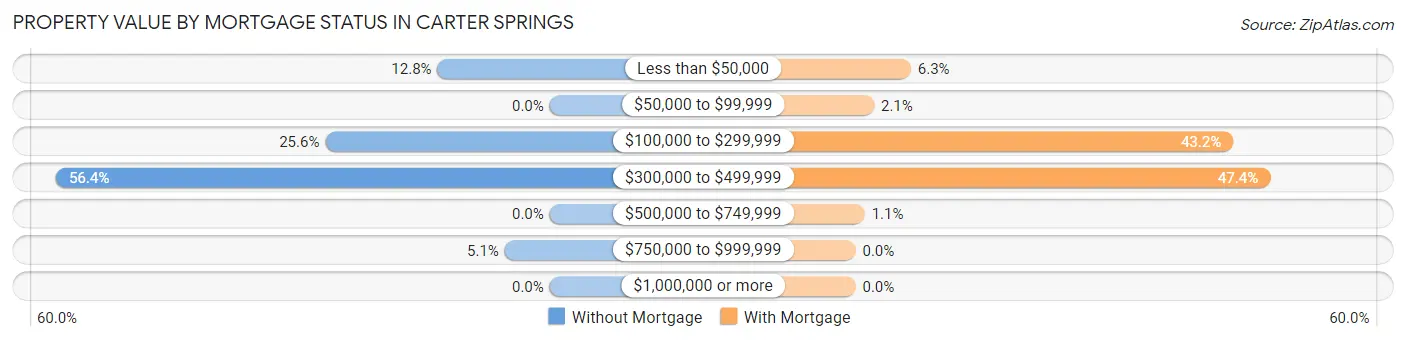
| Property Value | Without Mortgage | With Mortgage |
| Less than $50,000 | 5 (12.8%) | 6 (6.3%) |
| $50,000 to $99,999 | 0 (0.0%) | 2 (2.1%) |
| $100,000 to $299,999 | 10 (25.6%) | 41 (43.2%) |
| $300,000 to $499,999 | 22 (56.4%) | 45 (47.4%) |
| $500,000 to $749,999 | 0 (0.0%) | 1 (1.1%) |
| $750,000 to $999,999 | 2 (5.1%) | 0 (0.0%) |
| $1,000,000 or more | 0 (0.0%) | 0 (0.0%) |
| Total | 39 (100.0%) | 95 (100.0%) |
Household Income by Mortgage Status in Carter Springs
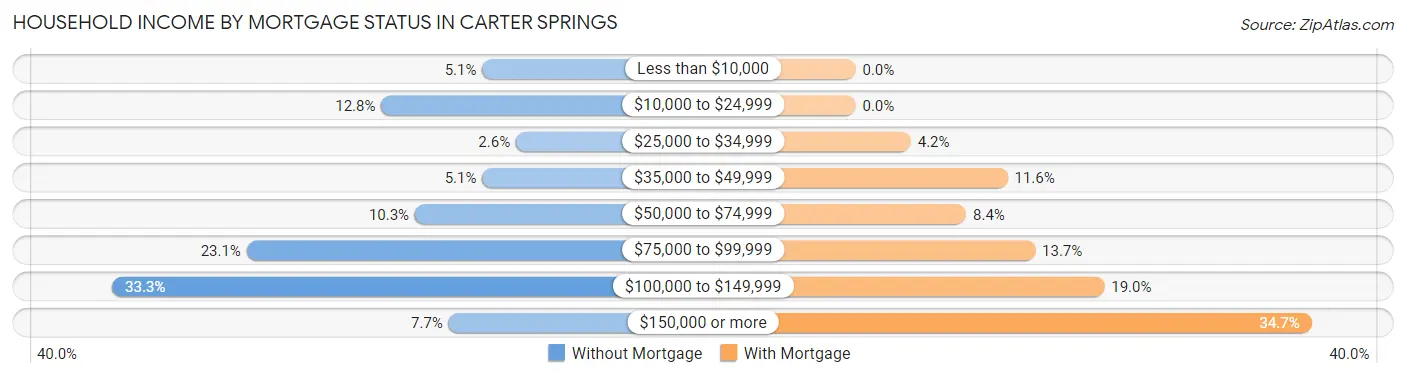
| Household Income | Without Mortgage | With Mortgage |
| Less than $10,000 | 2 (5.1%) | 0 (0.0%) |
| $10,000 to $24,999 | 5 (12.8%) | 0 (0.0%) |
| $25,000 to $34,999 | 1 (2.6%) | 4 (4.2%) |
| $35,000 to $49,999 | 2 (5.1%) | 11 (11.6%) |
| $50,000 to $74,999 | 4 (10.3%) | 8 (8.4%) |
| $75,000 to $99,999 | 9 (23.1%) | 13 (13.7%) |
| $100,000 to $149,999 | 13 (33.3%) | 18 (19.0%) |
| $150,000 or more | 3 (7.7%) | 33 (34.7%) |
| Total | 39 (100.0%) | 95 (100.0%) |
Property Value to Household Income Ratio in Carter Springs
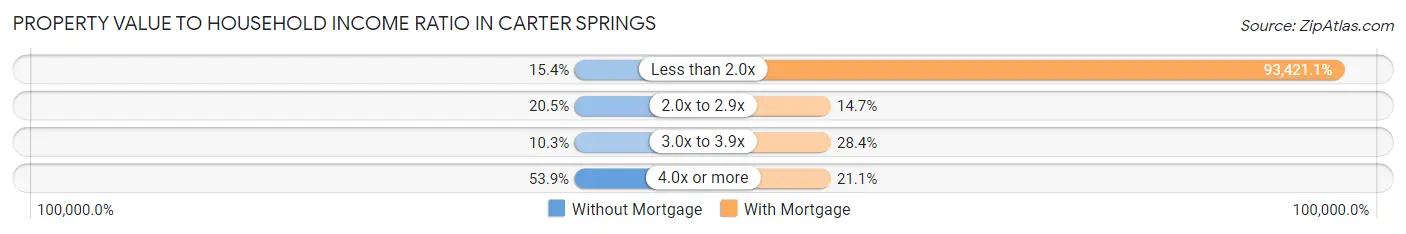
| Value-to-Income Ratio | Without Mortgage | With Mortgage |
| Less than 2.0x | 6 (15.4%) | 88,750 (93,421.1%) |
| 2.0x to 2.9x | 8 (20.5%) | 14 (14.7%) |
| 3.0x to 3.9x | 4 (10.3%) | 27 (28.4%) |
| 4.0x or more | 21 (53.8%) | 20 (21.0%) |
| Total | 39 (100.0%) | 95 (100.0%) |
Real Estate Taxes by Mortgage Status in Carter Springs

| Property Taxes | Without Mortgage | With Mortgage |
| Less than $800 | 3 (7.7%) | 0 (0.0%) |
| $800 to $1,499 | 25 (64.1%) | 12 (12.6%) |
| $800 to $1,499 | 3 (7.7%) | 50 (52.6%) |
| Total | 39 (100.0%) | 95 (100.0%) |
Health & Disability in Carter Springs
Health Insurance Coverage by Age in Carter Springs
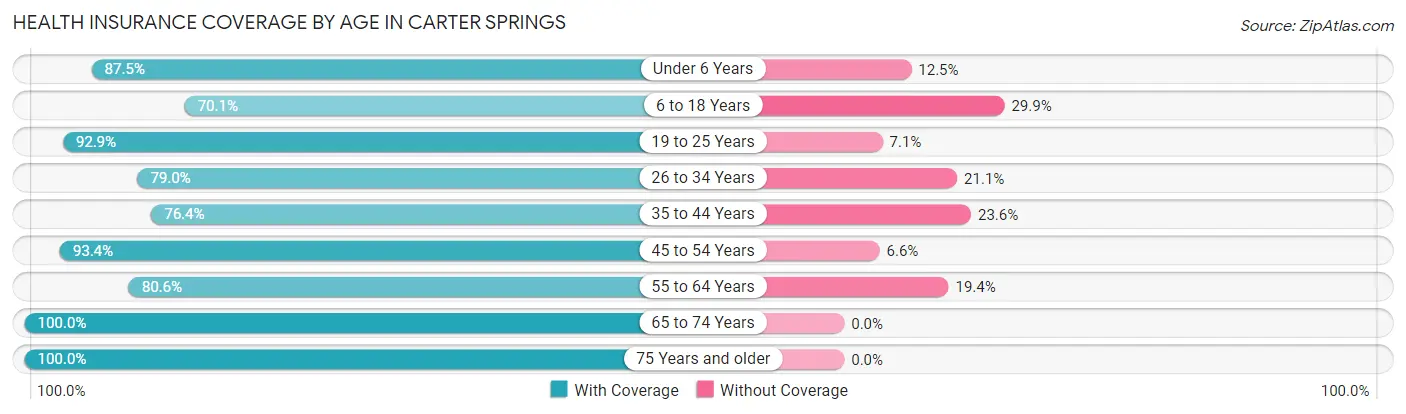
| Age Bracket | With Coverage | Without Coverage |
| Under 6 Years | 14 (87.5%) | 2 (12.5%) |
| 6 to 18 Years | 54 (70.1%) | 23 (29.9%) |
| 19 to 25 Years | 26 (92.9%) | 2 (7.1%) |
| 26 to 34 Years | 15 (78.9%) | 4 (21.0%) |
| 35 to 44 Years | 42 (76.4%) | 13 (23.6%) |
| 45 to 54 Years | 71 (93.4%) | 5 (6.6%) |
| 55 to 64 Years | 58 (80.6%) | 14 (19.4%) |
| 65 to 74 Years | 61 (100.0%) | 0 (0.0%) |
| 75 Years and older | 43 (100.0%) | 0 (0.0%) |
| Total | 384 (85.9%) | 63 (14.1%) |
Health Insurance Coverage by Citizenship Status in Carter Springs
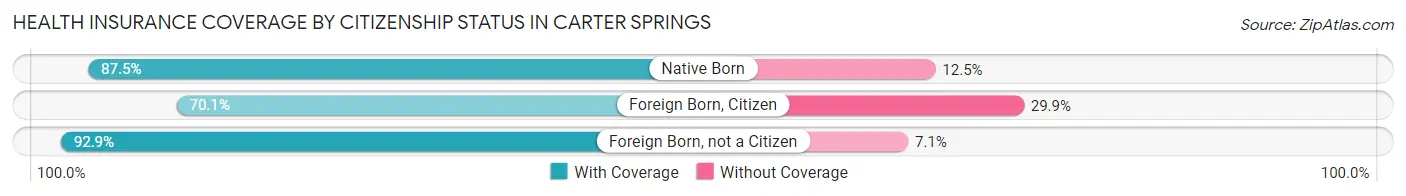
| Citizenship Status | With Coverage | Without Coverage |
| Native Born | 14 (87.5%) | 2 (12.5%) |
| Foreign Born, Citizen | 54 (70.1%) | 23 (29.9%) |
| Foreign Born, not a Citizen | 26 (92.9%) | 2 (7.1%) |
Health Insurance Coverage by Household Income in Carter Springs
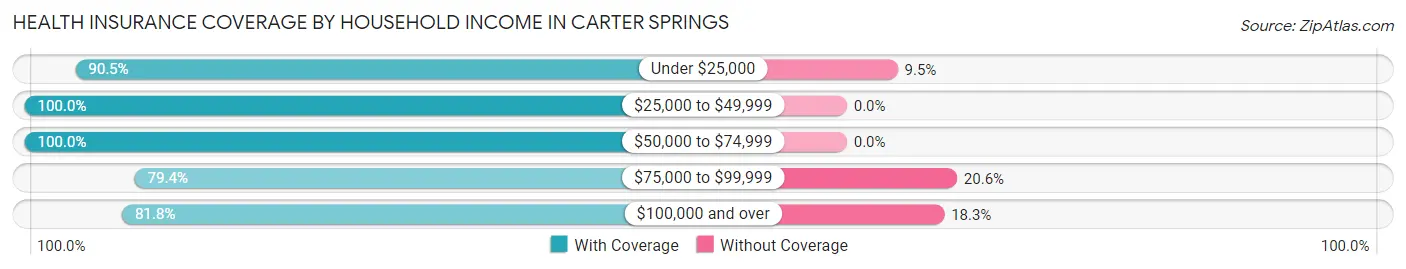
| Household Income | With Coverage | Without Coverage |
| Under $25,000 | 19 (90.5%) | 2 (9.5%) |
| $25,000 to $49,999 | 68 (100.0%) | 0 (0.0%) |
| $50,000 to $74,999 | 32 (100.0%) | 0 (0.0%) |
| $75,000 to $99,999 | 50 (79.4%) | 13 (20.6%) |
| $100,000 and over | 215 (81.8%) | 48 (18.2%) |
Public vs Private Health Insurance Coverage by Age in Carter Springs
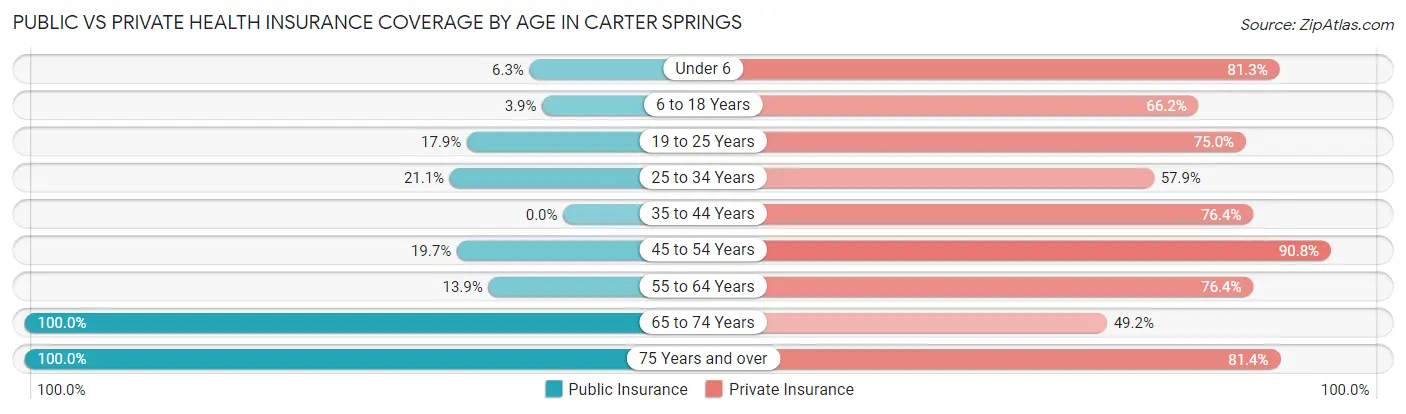
| Age Bracket | Public Insurance | Private Insurance |
| Under 6 | 1 (6.2%) | 13 (81.2%) |
| 6 to 18 Years | 3 (3.9%) | 51 (66.2%) |
| 19 to 25 Years | 5 (17.9%) | 21 (75.0%) |
| 25 to 34 Years | 4 (21.0%) | 11 (57.9%) |
| 35 to 44 Years | 0 (0.0%) | 42 (76.4%) |
| 45 to 54 Years | 15 (19.7%) | 69 (90.8%) |
| 55 to 64 Years | 10 (13.9%) | 55 (76.4%) |
| 65 to 74 Years | 61 (100.0%) | 30 (49.2%) |
| 75 Years and over | 43 (100.0%) | 35 (81.4%) |
| Total | 142 (31.8%) | 327 (73.2%) |
Disability Status by Sex by Age in Carter Springs

| Age Bracket | Male | Female |
| Under 5 Years | 0 (0.0%) | 0 (0.0%) |
| 5 to 17 Years | 0 (0.0%) | 2 (4.1%) |
| 18 to 34 Years | 0 (0.0%) | 9 (29.0%) |
| 35 to 64 Years | 31 (27.7%) | 4 (4.4%) |
| 65 to 74 Years | 13 (40.6%) | 7 (24.1%) |
| 75 Years and over | 12 (57.1%) | 5 (22.7%) |
Disability Class by Sex by Age in Carter Springs
Disability Class: Hearing Difficulty
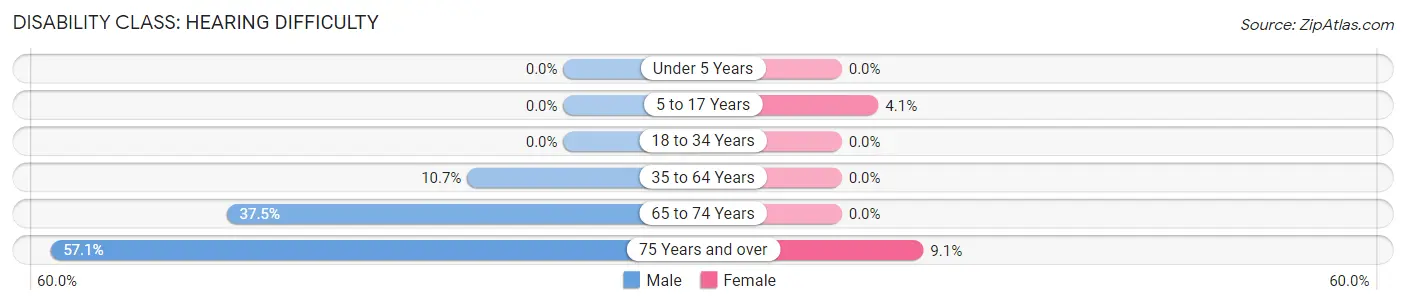
| Age Bracket | Male | Female |
| Under 5 Years | 0 (0.0%) | 0 (0.0%) |
| 5 to 17 Years | 0 (0.0%) | 2 (4.1%) |
| 18 to 34 Years | 0 (0.0%) | 0 (0.0%) |
| 35 to 64 Years | 12 (10.7%) | 0 (0.0%) |
| 65 to 74 Years | 12 (37.5%) | 0 (0.0%) |
| 75 Years and over | 12 (57.1%) | 2 (9.1%) |
Disability Class: Vision Difficulty
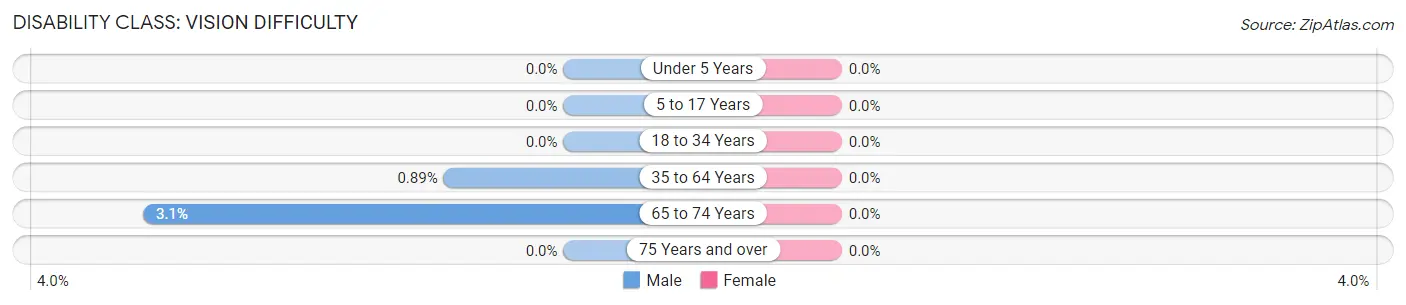
| Age Bracket | Male | Female |
| Under 5 Years | 0 (0.0%) | 0 (0.0%) |
| 5 to 17 Years | 0 (0.0%) | 0 (0.0%) |
| 18 to 34 Years | 0 (0.0%) | 0 (0.0%) |
| 35 to 64 Years | 1 (0.9%) | 0 (0.0%) |
| 65 to 74 Years | 1 (3.1%) | 0 (0.0%) |
| 75 Years and over | 0 (0.0%) | 0 (0.0%) |
Disability Class: Cognitive Difficulty
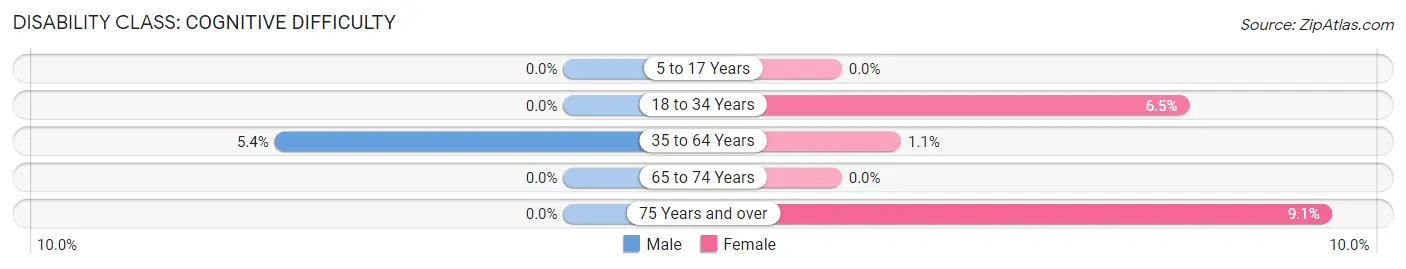
| Age Bracket | Male | Female |
| 5 to 17 Years | 0 (0.0%) | 0 (0.0%) |
| 18 to 34 Years | 0 (0.0%) | 2 (6.5%) |
| 35 to 64 Years | 6 (5.4%) | 1 (1.1%) |
| 65 to 74 Years | 0 (0.0%) | 0 (0.0%) |
| 75 Years and over | 0 (0.0%) | 2 (9.1%) |
Disability Class: Ambulatory Difficulty
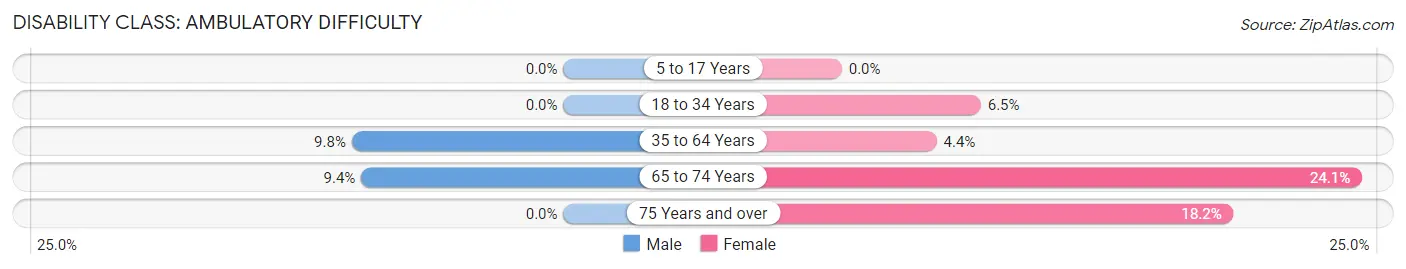
| Age Bracket | Male | Female |
| 5 to 17 Years | 0 (0.0%) | 0 (0.0%) |
| 18 to 34 Years | 0 (0.0%) | 2 (6.5%) |
| 35 to 64 Years | 11 (9.8%) | 4 (4.4%) |
| 65 to 74 Years | 3 (9.4%) | 7 (24.1%) |
| 75 Years and over | 0 (0.0%) | 4 (18.2%) |
Disability Class: Self-Care Difficulty
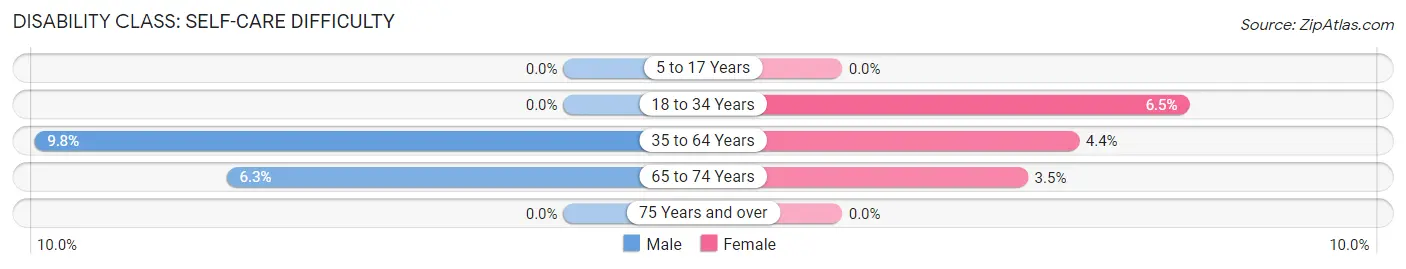
| Age Bracket | Male | Female |
| 5 to 17 Years | 0 (0.0%) | 0 (0.0%) |
| 18 to 34 Years | 0 (0.0%) | 2 (6.5%) |
| 35 to 64 Years | 11 (9.8%) | 4 (4.4%) |
| 65 to 74 Years | 2 (6.2%) | 1 (3.5%) |
| 75 Years and over | 0 (0.0%) | 0 (0.0%) |
Technology Access in Carter Springs
Computing Device Access in Carter Springs
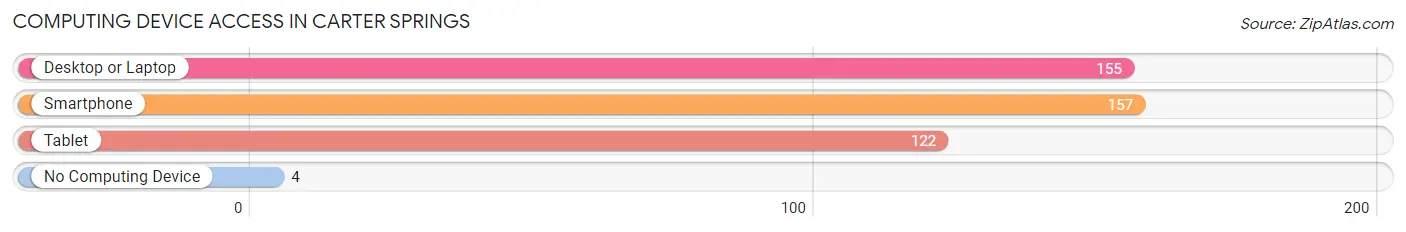
| Device Type | # Households | % Households |
| Desktop or Laptop | 155 | 84.2% |
| Smartphone | 157 | 85.3% |
| Tablet | 122 | 66.3% |
| No Computing Device | 4 | 2.2% |
| Total | 184 | 100.0% |
Internet Access in Carter Springs
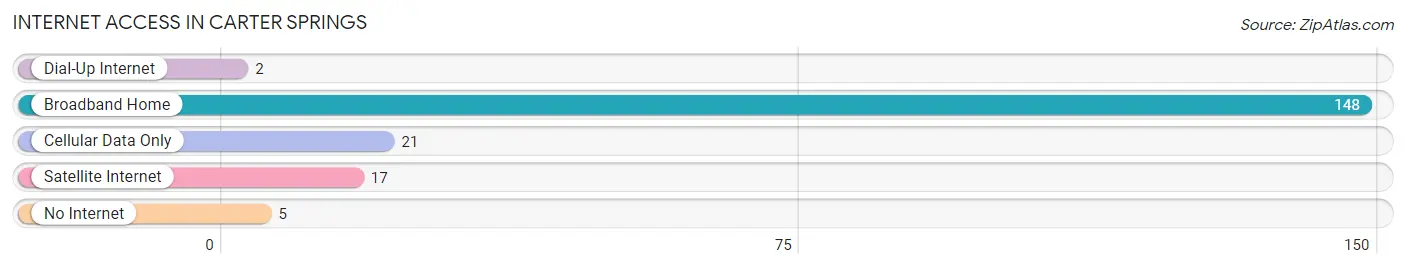
| Internet Type | # Households | % Households |
| Dial-Up Internet | 2 | 1.1% |
| Broadband Home | 148 | 80.4% |
| Cellular Data Only | 21 | 11.4% |
| Satellite Internet | 17 | 9.2% |
| No Internet | 5 | 2.7% |
| Total | 184 | 100.0% |
Carter Springs Summary
Introduction
Carter Springs is a small unincorporated community located in the state of Nevada, in the United States. It is situated in the northern part of the state, in Elko County, and is located about 25 miles south of the city of Elko. The community is situated in a rural area, and is surrounded by open land and desert. The population of Carter Springs is estimated to be around 200 people, and the community is home to a variety of businesses, including a gas station, a restaurant, and a post office.
History
Carter Springs was first established in the late 1800s, when a group of settlers from the nearby town of Elko decided to move to the area. The settlers were attracted to the area due to its proximity to the Humboldt River, which provided a reliable source of water for the settlers. The settlers named the area after a local rancher, William Carter, who had been living in the area since the early 1870s.
The town of Carter Springs grew slowly over the years, and by the early 1900s, it had become a small but thriving community. The town was home to a variety of businesses, including a general store, a blacksmith, and a post office. The town also had a school, which was attended by the children of the local ranchers and farmers.
In the late 1940s, the town of Carter Springs began to decline, as many of the local businesses began to close. The decline of the town was due in part to the increasing popularity of nearby towns, such as Elko and Wells. By the late 1950s, the population of Carter Springs had dropped to around 200 people.
Geography
Carter Springs is located in the northern part of Nevada, in Elko County. The town is situated in a rural area, and is surrounded by open land and desert. The town is located about 25 miles south of the city of Elko, and is situated at an elevation of 4,890 feet above sea level.
The climate in Carter Springs is semi-arid, with hot summers and cold winters. The average temperature in the summer months is around 90 degrees Fahrenheit, while the average temperature in the winter months is around 30 degrees Fahrenheit. The town receives an average of 8 inches of precipitation per year, with most of the precipitation occurring in the winter months.
Economy
The economy of Carter Springs is largely based on agriculture and ranching. The town is home to a variety of farms and ranches, which produce a variety of crops, including alfalfa, hay, and wheat. The town is also home to a number of businesses, including a gas station, a restaurant, and a post office.
Demographics
The population of Carter Springs is estimated to be around 200 people. The town is predominantly white, with a small Hispanic population. The median household income in the town is around $35,000, and the median home value is around $150,000. The town has a high rate of poverty, with around 25% of the population living below the poverty line.
Common Questions
What is Per Capita Income in Carter Springs?
Per Capita income in Carter Springs is $41,725.
What is the Median Family Income in Carter Springs?
Median Family Income in Carter Springs is $101,181.
What is the Median Household income in Carter Springs?
Median Household Income in Carter Springs is $98,750.
What is Income or Wage Gap in Carter Springs?
Income or Wage Gap in Carter Springs is 11.9%.
Women in Carter Springs earn 88.1 cents for every dollar earned by a man.
What is Inequality or Gini Index in Carter Springs?
Inequality or Gini Index in Carter Springs is 0.32.
What is the Total Population of Carter Springs?
Total Population of Carter Springs is 450.
What is the Total Male Population of Carter Springs?
Total Male Population of Carter Springs is 221.
What is the Total Female Population of Carter Springs?
Total Female Population of Carter Springs is 229.
What is the Ratio of Males per 100 Females in Carter Springs?
There are 96.51 Males per 100 Females in Carter Springs.
What is the Ratio of Females per 100 Males in Carter Springs?
There are 103.62 Females per 100 Males in Carter Springs.
What is the Median Population Age in Carter Springs?
Median Population Age in Carter Springs is 47.4 Years.
What is the Average Family Size in Carter Springs
Average Family Size in Carter Springs is 2.8 People.
What is the Average Household Size in Carter Springs
Average Household Size in Carter Springs is 2.5 People.
How Large is the Labor Force in Carter Springs?
There are 228 People in the Labor Forcein in Carter Springs.
What is the Percentage of People in the Labor Force in Carter Springs?
61.5% of People are in the Labor Force in Carter Springs.
What is the Unemployment Rate in Carter Springs?
Unemployment Rate in Carter Springs is 3.6%.