Whitney, NV Map & Demographics
Whitney Map
Whitney Overview
$26,741
PER CAPITA INCOME
$67,121
AVG FAMILY INCOME
$58,624
AVG HOUSEHOLD INCOME
11.1%
WAGE / INCOME GAP [ % ]
88.9¢/ $1
WAGE / INCOME GAP [ $ ]
$9,888
FAMILY INCOME DEFICIT
0.42
INEQUALITY / GINI INDEX
44,720
TOTAL POPULATION
22,254
MALE POPULATION
22,466
FEMALE POPULATION
99.06
MALES / 100 FEMALES
100.95
FEMALES / 100 MALES
35.3
MEDIAN AGE
3.5
AVG FAMILY SIZE
2.8
AVG HOUSEHOLD SIZE
22,989
LABOR FORCE [ PEOPLE ]
65.4%
PERCENT IN LABOR FORCE
7.8%
UNEMPLOYMENT RATE
Income in Whitney
Income Overview in Whitney
Per Capita Income in Whitney is $26,741, while median incomes of families and households are $67,121 and $58,624 respectively.
| Characteristic | Number | Measure |
| Per Capita Income | 44,720 | $26,741 |
| Median Family Income | 10,272 | $67,121 |
| Mean Family Income | 10,272 | $80,676 |
| Median Household Income | 15,996 | $58,624 |
| Mean Household Income | 15,996 | $71,143 |
| Income Deficit | 10,272 | $9,888 |
| Wage / Income Gap (%) | 44,720 | 11.09% |
| Wage / Income Gap ($) | 44,720 | 88.91¢ per $1 |
| Gini / Inequality Index | 44,720 | 0.42 |
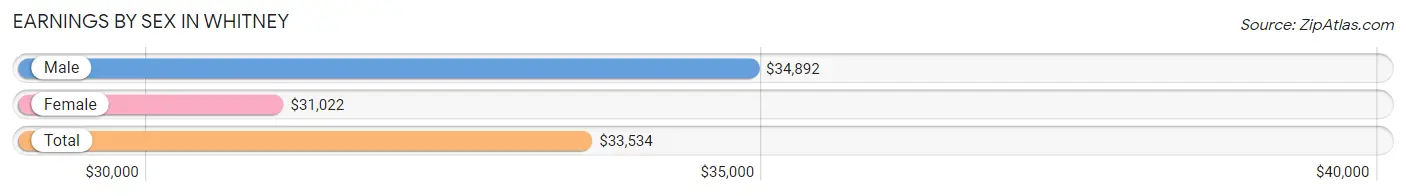
Earnings by Sex in Whitney
Average Earnings in Whitney are $33,534, $34,892 for men and $31,022 for women, a difference of 11.1%.
| Sex | Number | Average Earnings |
| Male | 11,966 (51.8%) | $34,892 |
| Female | 11,136 (48.2%) | $31,022 |
| Total | 23,102 (100.0%) | $33,534 |
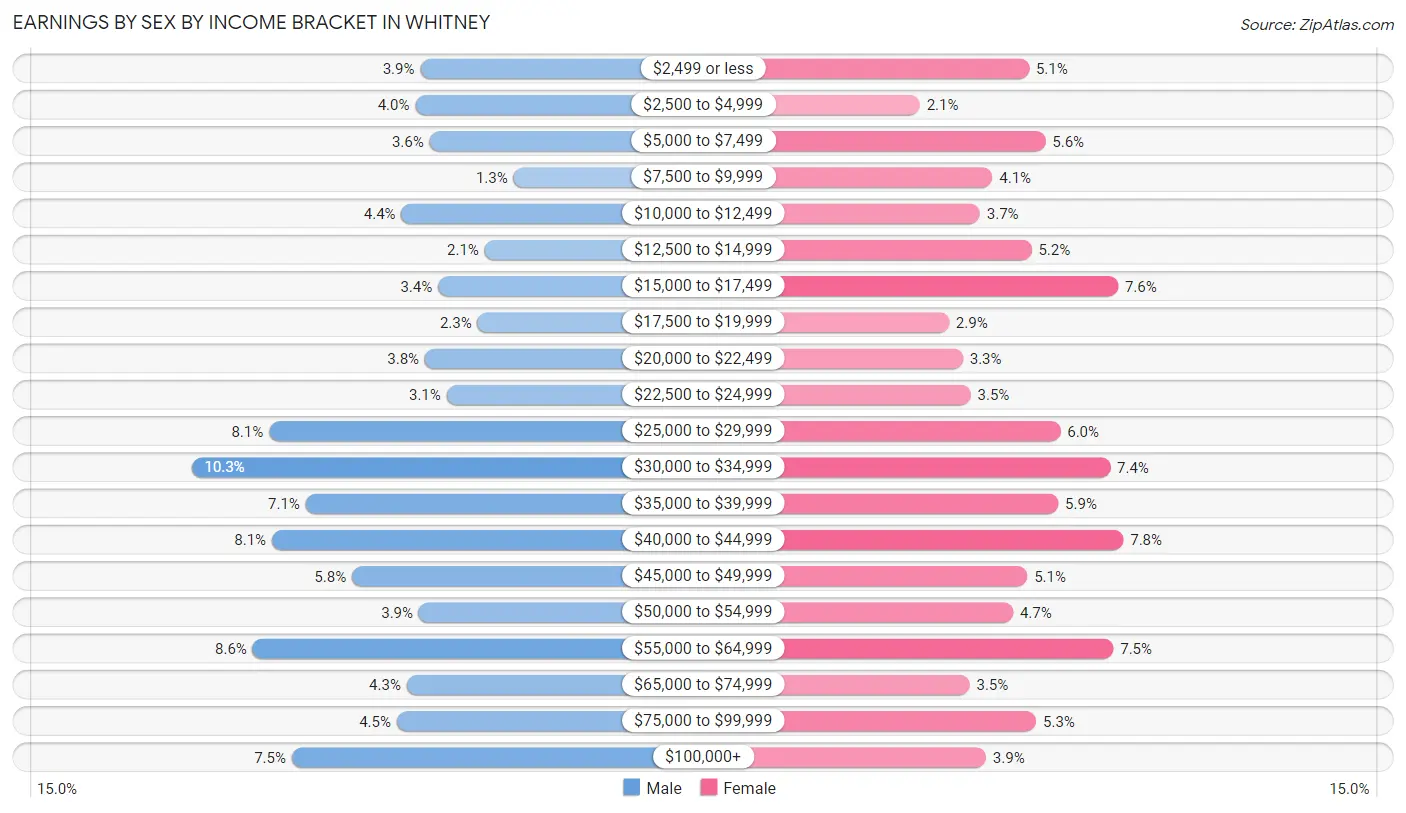
Earnings by Sex by Income Bracket in Whitney
The most common earnings brackets in Whitney are $30,000 to $34,999 for men (1,234 | 10.3%) and $40,000 to $44,999 for women (865 | 7.8%).
| Income | Male | Female |
| $2,499 or less | 464 (3.9%) | 570 (5.1%) |
| $2,500 to $4,999 | 481 (4.0%) | 228 (2.1%) |
| $5,000 to $7,499 | 433 (3.6%) | 621 (5.6%) |
| $7,500 to $9,999 | 151 (1.3%) | 455 (4.1%) |
| $10,000 to $12,499 | 528 (4.4%) | 417 (3.7%) |
| $12,500 to $14,999 | 248 (2.1%) | 578 (5.2%) |
| $15,000 to $17,499 | 405 (3.4%) | 849 (7.6%) |
| $17,500 to $19,999 | 272 (2.3%) | 320 (2.9%) |
| $20,000 to $22,499 | 449 (3.7%) | 363 (3.3%) |
| $22,500 to $24,999 | 376 (3.1%) | 387 (3.5%) |
| $25,000 to $29,999 | 973 (8.1%) | 668 (6.0%) |
| $30,000 to $34,999 | 1,234 (10.3%) | 824 (7.4%) |
| $35,000 to $39,999 | 849 (7.1%) | 661 (5.9%) |
| $40,000 to $44,999 | 963 (8.1%) | 865 (7.8%) |
| $45,000 to $49,999 | 694 (5.8%) | 565 (5.1%) |
| $50,000 to $54,999 | 469 (3.9%) | 520 (4.7%) |
| $55,000 to $64,999 | 1,028 (8.6%) | 834 (7.5%) |
| $65,000 to $74,999 | 510 (4.3%) | 384 (3.5%) |
| $75,000 to $99,999 | 543 (4.5%) | 592 (5.3%) |
| $100,000+ | 896 (7.5%) | 435 (3.9%) |
| Total | 11,966 (100.0%) | 11,136 (100.0%) |
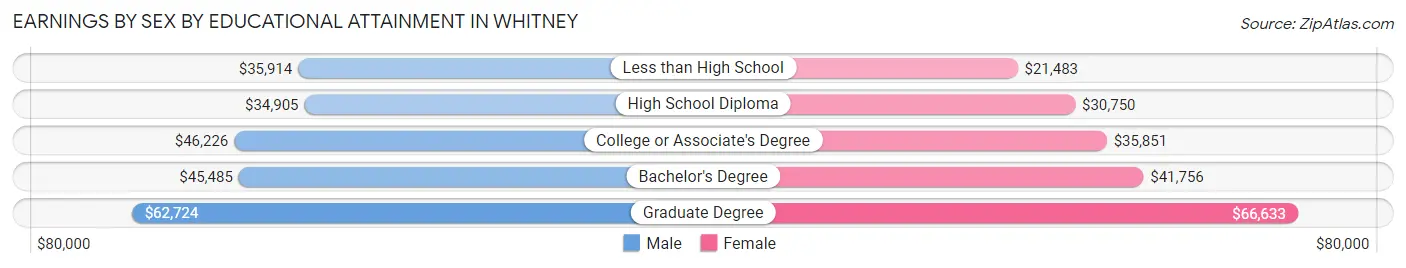
Earnings by Sex by Educational Attainment in Whitney
Average earnings in Whitney are $39,579 for men and $34,986 for women, a difference of 11.6%. Men with an educational attainment of graduate degree enjoy the highest average annual earnings of $62,724, while those with high school diploma education earn the least with $34,905. Women with an educational attainment of graduate degree earn the most with the average annual earnings of $66,633, while those with less than high school education have the smallest earnings of $21,483.
| Educational Attainment | Male Income | Female Income |
| Less than High School | $35,914 | $21,483 |
| High School Diploma | $34,905 | $30,750 |
| College or Associate's Degree | $46,226 | $35,851 |
| Bachelor's Degree | $45,485 | $41,756 |
| Graduate Degree | $62,724 | $66,633 |
| Total | $39,579 | $34,986 |
Family Income in Whitney
Family Income Brackets in Whitney
According to the Whitney family income data, there are 2,147 families falling into the $50,000 to $74,999 income range, which is the most common income bracket and makes up 20.9% of all families. Conversely, the less than $10,000 income bracket is the least frequent group with only 308 families (3.0%) belonging to this category.
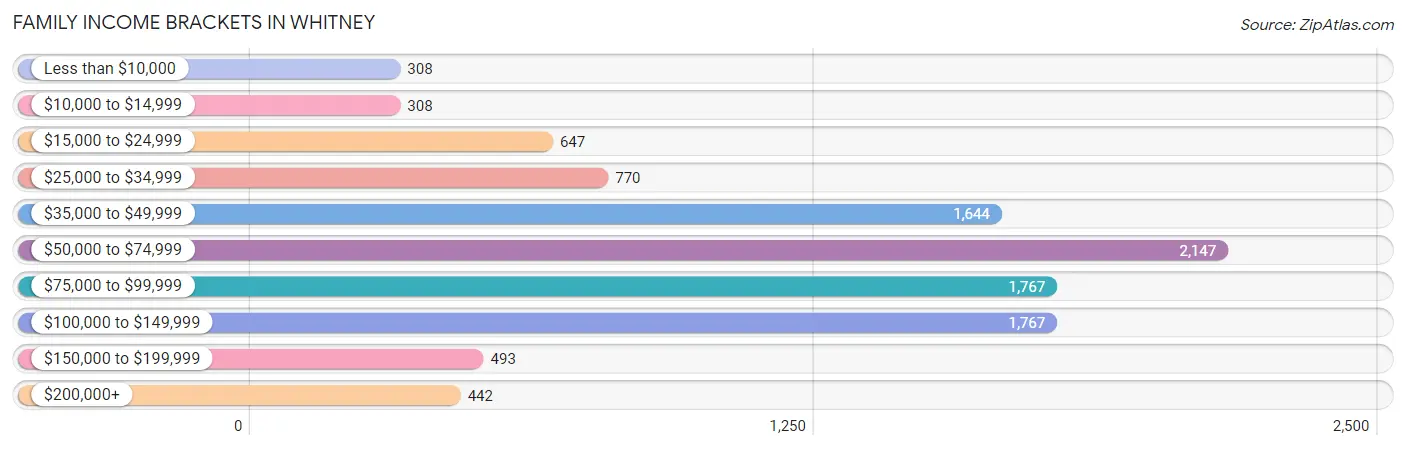
| Income Bracket | # Families | % Families |
| Less than $10,000 | 308 | 3.0% |
| $10,000 to $14,999 | 308 | 3.0% |
| $15,000 to $24,999 | 647 | 6.3% |
| $25,000 to $34,999 | 770 | 7.5% |
| $35,000 to $49,999 | 1,644 | 16.0% |
| $50,000 to $74,999 | 2,147 | 20.9% |
| $75,000 to $99,999 | 1,767 | 17.2% |
| $100,000 to $149,999 | 1,767 | 17.2% |
| $150,000 to $199,999 | 493 | 4.8% |
| $200,000+ | 442 | 4.3% |
Family Income by Famaliy Size in Whitney
3-person families (2,348 | 22.9%) account for the highest median family income in Whitney with $83,770 per family, while 3-person families (2,348 | 22.9%) have the highest median income of $27,923 per family member.
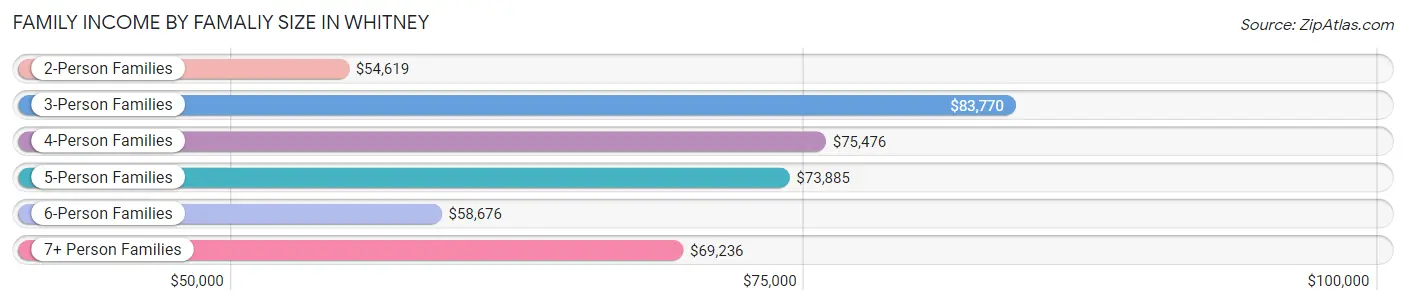
| Income Bracket | # Families | Median Income |
| 2-Person Families | 4,302 (41.9%) | $54,619 |
| 3-Person Families | 2,348 (22.9%) | $83,770 |
| 4-Person Families | 1,654 (16.1%) | $75,476 |
| 5-Person Families | 1,286 (12.5%) | $73,885 |
| 6-Person Families | 360 (3.5%) | $58,676 |
| 7+ Person Families | 322 (3.1%) | $69,236 |
| Total | 10,272 (100.0%) | $67,121 |
Family Income by Number of Earners in Whitney
The median family income in Whitney is $67,121, with families comprising 3+ earners (1,373) having the highest median family income of $104,659, while families with no earners (1,544) have the lowest median family income of $37,500, accounting for 13.4% and 15.0% of families, respectively.
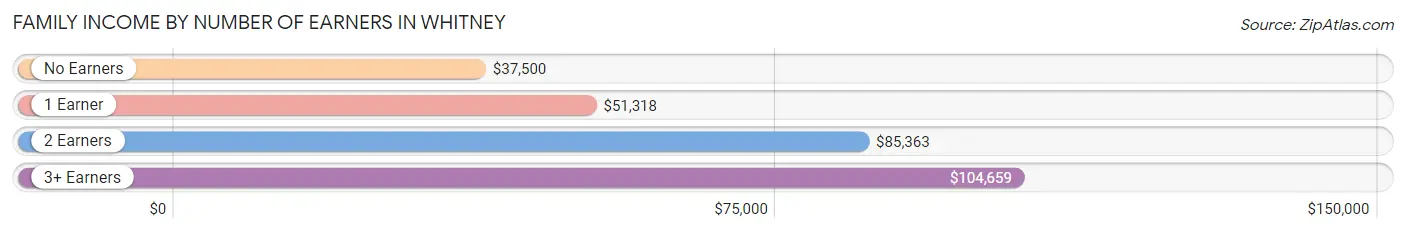
| Number of Earners | # Families | Median Income |
| No Earners | 1,544 (15.0%) | $37,500 |
| 1 Earner | 3,412 (33.2%) | $51,318 |
| 2 Earners | 3,943 (38.4%) | $85,363 |
| 3+ Earners | 1,373 (13.4%) | $104,659 |
| Total | 10,272 (100.0%) | $67,121 |
Household Income in Whitney
Household Income Brackets in Whitney
With 3,503 households falling in the category, the $50,000 to $74,999 income range is the most frequent in Whitney, accounting for 21.9% of all households. In contrast, only 528 households (3.3%) fall into the $200,000+ income bracket, making it the least populous group.
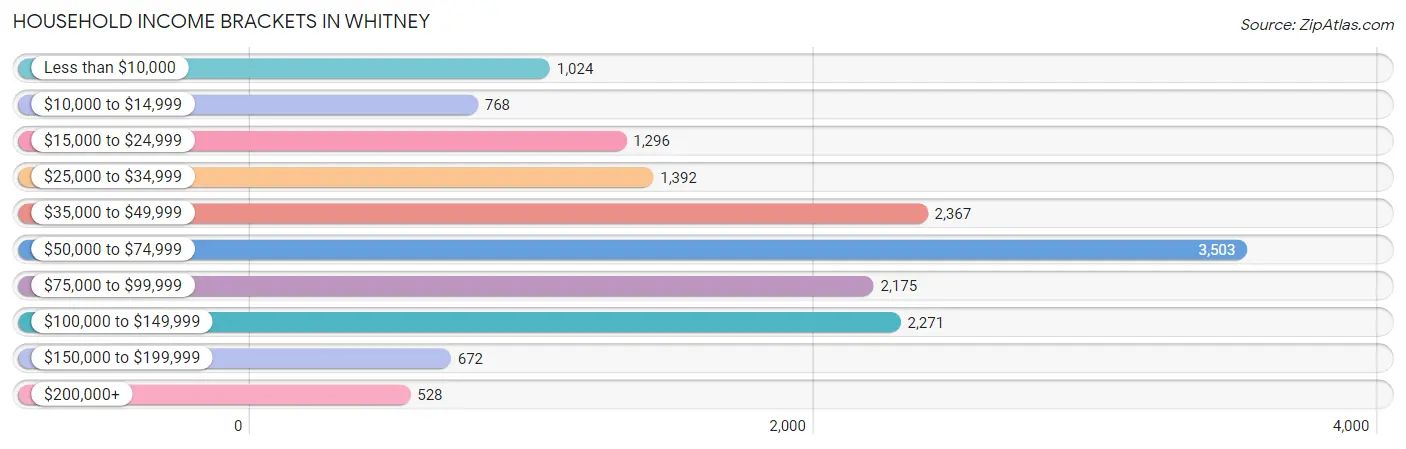
| Income Bracket | # Households | % Households |
| Less than $10,000 | 1,024 | 6.4% |
| $10,000 to $14,999 | 768 | 4.8% |
| $15,000 to $24,999 | 1,296 | 8.1% |
| $25,000 to $34,999 | 1,392 | 8.7% |
| $35,000 to $49,999 | 2,367 | 14.8% |
| $50,000 to $74,999 | 3,503 | 21.9% |
| $75,000 to $99,999 | 2,175 | 13.6% |
| $100,000 to $149,999 | 2,271 | 14.2% |
| $150,000 to $199,999 | 672 | 4.2% |
| $200,000+ | 528 | 3.3% |
Household Income by Householder Age in Whitney
The median household income in Whitney is $58,624, with the highest median household income of $66,879 found in the 25 to 44 years age bracket for the primary householder. A total of 6,068 households (37.9%) fall into this category. Meanwhile, the 15 to 24 years age bracket for the primary householder has the lowest median household income of $37,639, with 426 households (2.7%) in this group.
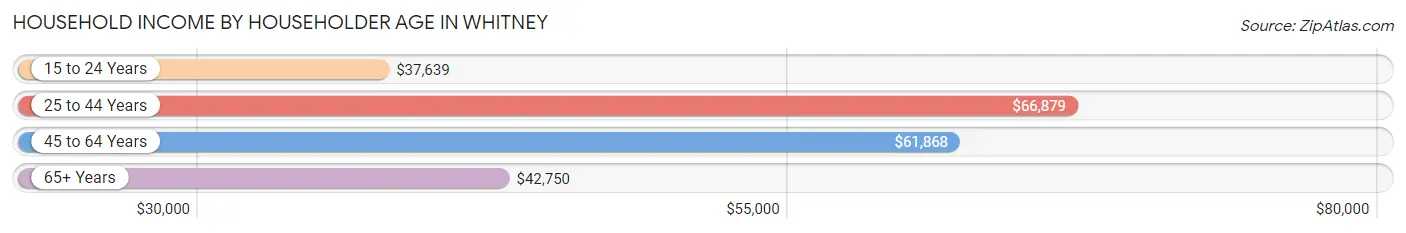
| Income Bracket | # Households | Median Income |
| 15 to 24 Years | 426 (2.7%) | $37,639 |
| 25 to 44 Years | 6,068 (37.9%) | $66,879 |
| 45 to 64 Years | 5,470 (34.2%) | $61,868 |
| 65+ Years | 4,032 (25.2%) | $42,750 |
| Total | 15,996 (100.0%) | $58,624 |
Poverty in Whitney
Income Below Poverty by Sex and Age in Whitney
With 14.8% poverty level for males and 17.9% for females among the residents of Whitney, 5 year old males and 15 year old females are the most vulnerable to poverty, with 200 males (58.1%) and 107 females (36.5%) in their respective age groups living below the poverty level.
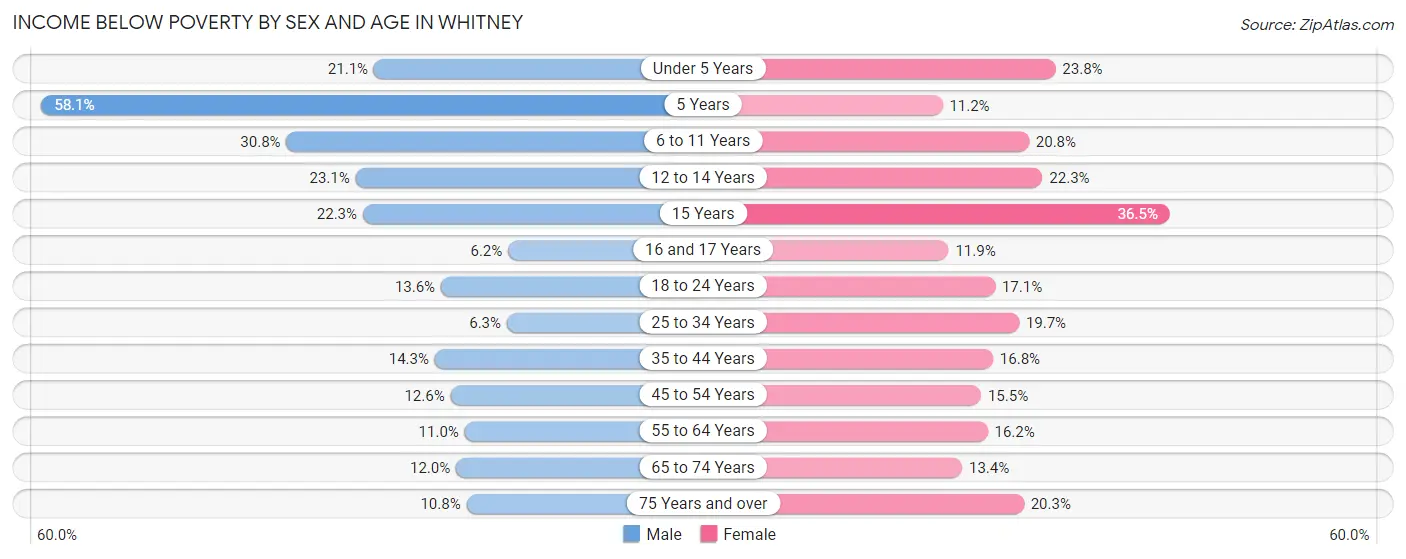
| Age Bracket | Male | Female |
| Under 5 Years | 238 (21.1%) | 349 (23.8%) |
| 5 Years | 200 (58.1%) | 24 (11.2%) |
| 6 to 11 Years | 680 (30.8%) | 337 (20.8%) |
| 12 to 14 Years | 187 (23.1%) | 218 (22.3%) |
| 15 Years | 69 (22.3%) | 107 (36.5%) |
| 16 and 17 Years | 31 (6.1%) | 62 (11.9%) |
| 18 to 24 Years | 319 (13.6%) | 340 (17.1%) |
| 25 to 34 Years | 245 (6.3%) | 660 (19.7%) |
| 35 to 44 Years | 421 (14.3%) | 541 (16.8%) |
| 45 to 54 Years | 331 (12.6%) | 405 (15.5%) |
| 55 to 64 Years | 230 (11.0%) | 399 (16.2%) |
| 65 to 74 Years | 235 (11.9%) | 323 (13.4%) |
| 75 Years and over | 115 (10.8%) | 235 (20.3%) |
| Total | 3,301 (14.8%) | 4,000 (17.9%) |
Income Above Poverty by Sex and Age in Whitney
According to the poverty statistics in Whitney, males aged 16 and 17 years and females aged 5 years are the age groups that are most secure financially, with 93.9% of males and 88.8% of females in these age groups living above the poverty line.
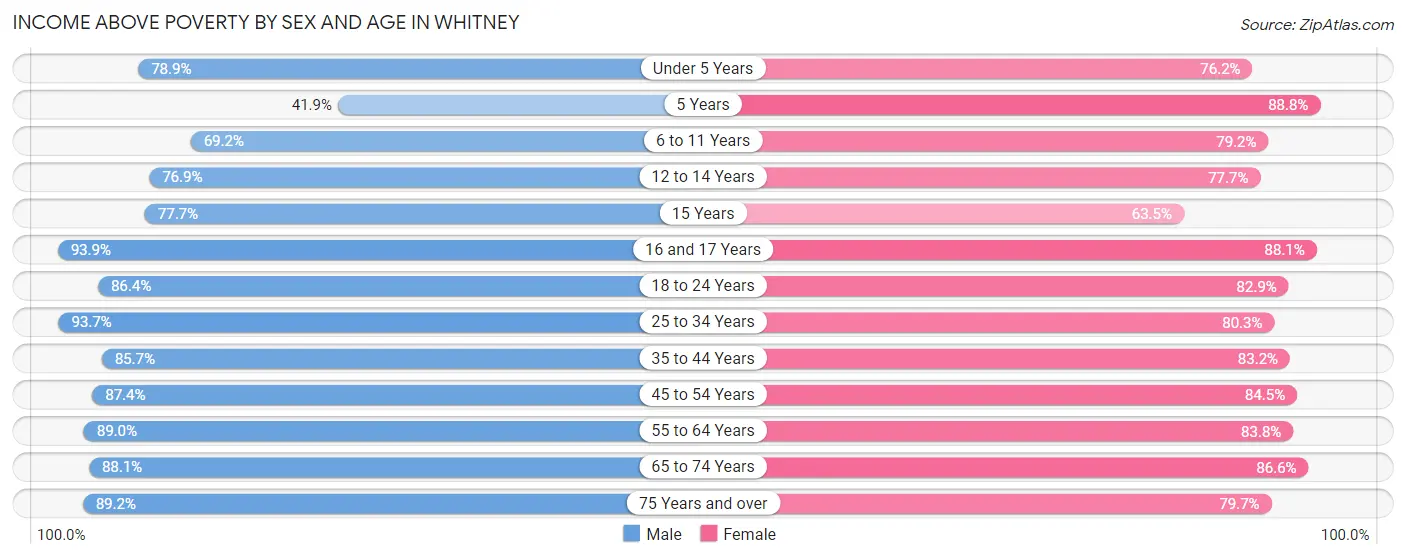
| Age Bracket | Male | Female |
| Under 5 Years | 890 (78.9%) | 1,118 (76.2%) |
| 5 Years | 144 (41.9%) | 190 (88.8%) |
| 6 to 11 Years | 1,525 (69.2%) | 1,281 (79.2%) |
| 12 to 14 Years | 621 (76.9%) | 758 (77.7%) |
| 15 Years | 240 (77.7%) | 186 (63.5%) |
| 16 and 17 Years | 473 (93.9%) | 460 (88.1%) |
| 18 to 24 Years | 2,021 (86.4%) | 1,653 (82.9%) |
| 25 to 34 Years | 3,647 (93.7%) | 2,686 (80.3%) |
| 35 to 44 Years | 2,518 (85.7%) | 2,674 (83.2%) |
| 45 to 54 Years | 2,302 (87.4%) | 2,208 (84.5%) |
| 55 to 64 Years | 1,862 (89.0%) | 2,059 (83.8%) |
| 65 to 74 Years | 1,731 (88.0%) | 2,090 (86.6%) |
| 75 Years and over | 951 (89.2%) | 925 (79.7%) |
| Total | 18,925 (85.2%) | 18,288 (82.1%) |
Income Below Poverty Among Married-Couple Families in Whitney
The poverty statistics for married-couple families in Whitney show that 9.0% or 582 of the total 6,440 families live below the poverty line. Families with 5 or more children have the highest poverty rate of 80.9%, comprising of 17 families. On the other hand, families with no children have the lowest poverty rate of 4.4%, which includes 149 families.
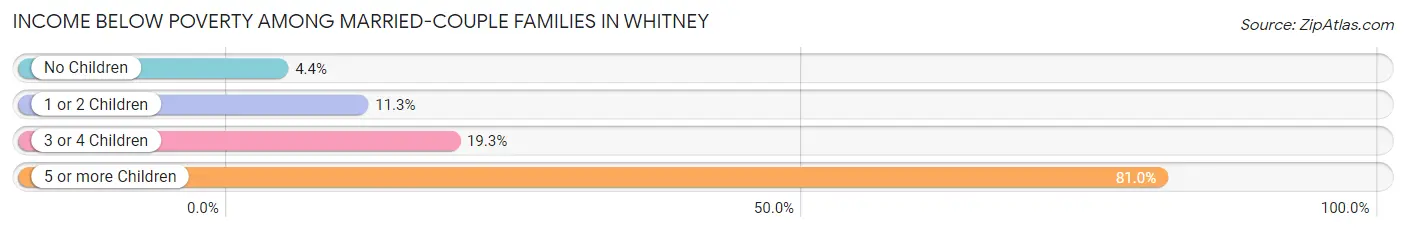
| Children | Above Poverty | Below Poverty |
| No Children | 3,260 (95.6%) | 149 (4.4%) |
| 1 or 2 Children | 1,838 (88.7%) | 235 (11.3%) |
| 3 or 4 Children | 756 (80.7%) | 181 (19.3%) |
| 5 or more Children | 4 (19.1%) | 17 (80.9%) |
| Total | 5,858 (91.0%) | 582 (9.0%) |
Income Below Poverty Among Single-Parent Households in Whitney
According to the poverty data in Whitney, 13.2% or 144 single-father households and 22.2% or 608 single-mother households are living below the poverty line. Among single-father households, those with 1 or 2 children have the highest poverty rate, with 116 households (29.7%) experiencing poverty. Likewise, among single-mother households, those with 5 or more children have the highest poverty rate, with 71 households (79.8%) falling below the poverty line.
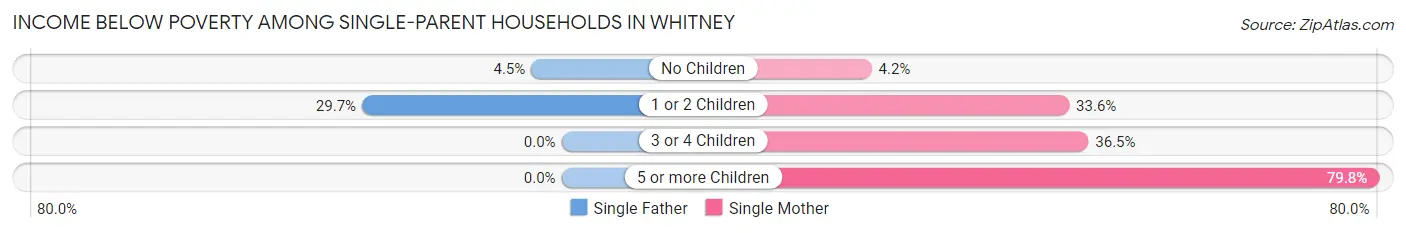
| Children | Single Father | Single Mother |
| No Children | 28 (4.5%) | 51 (4.2%) |
| 1 or 2 Children | 116 (29.7%) | 385 (33.6%) |
| 3 or 4 Children | 0 (0.0%) | 101 (36.5%) |
| 5 or more Children | 0 (0.0%) | 71 (79.8%) |
| Total | 144 (13.2%) | 608 (22.2%) |
Income Below Poverty Among Married-Couple vs Single-Parent Households in Whitney
The poverty data for Whitney shows that 582 of the married-couple family households (9.0%) and 752 of the single-parent households (19.6%) are living below the poverty level. Within the married-couple family households, those with 5 or more children have the highest poverty rate, with 17 households (80.9%) falling below the poverty line. Among the single-parent households, those with 5 or more children have the highest poverty rate, with 71 household (65.7%) living below poverty.
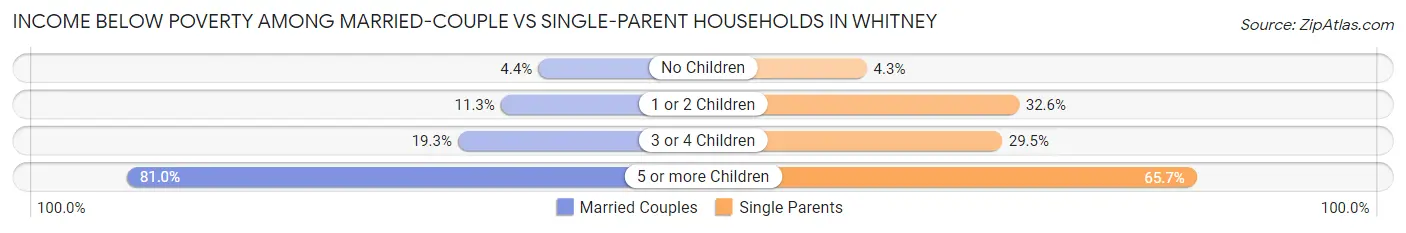
| Children | Married-Couple Families | Single-Parent Households |
| No Children | 149 (4.4%) | 79 (4.3%) |
| 1 or 2 Children | 235 (11.3%) | 501 (32.6%) |
| 3 or 4 Children | 181 (19.3%) | 101 (29.4%) |
| 5 or more Children | 17 (80.9%) | 71 (65.7%) |
| Total | 582 (9.0%) | 752 (19.6%) |
Race in Whitney
The most populous races in Whitney are Hispanic or Latino (18,316 | 41.0%), White / Caucasian (17,508 | 39.2%), and Some other Race (8,580 | 19.2%).
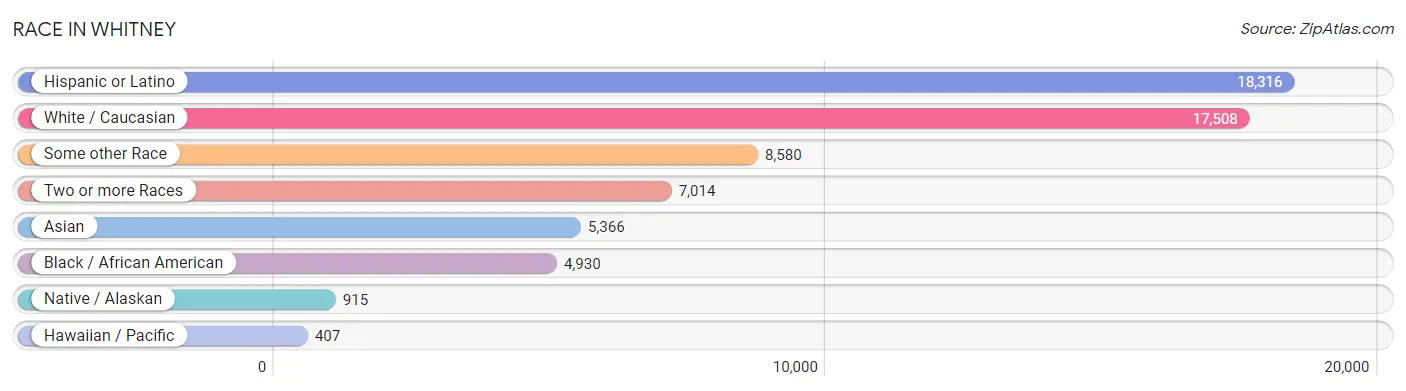
| Race | # Population | % Population |
| Asian | 5,366 | 12.0% |
| Black / African American | 4,930 | 11.0% |
| Hawaiian / Pacific | 407 | 0.9% |
| Hispanic or Latino | 18,316 | 41.0% |
| Native / Alaskan | 915 | 2.1% |
| White / Caucasian | 17,508 | 39.2% |
| Two or more Races | 7,014 | 15.7% |
| Some other Race | 8,580 | 19.2% |
| Total | 44,720 | 100.0% |
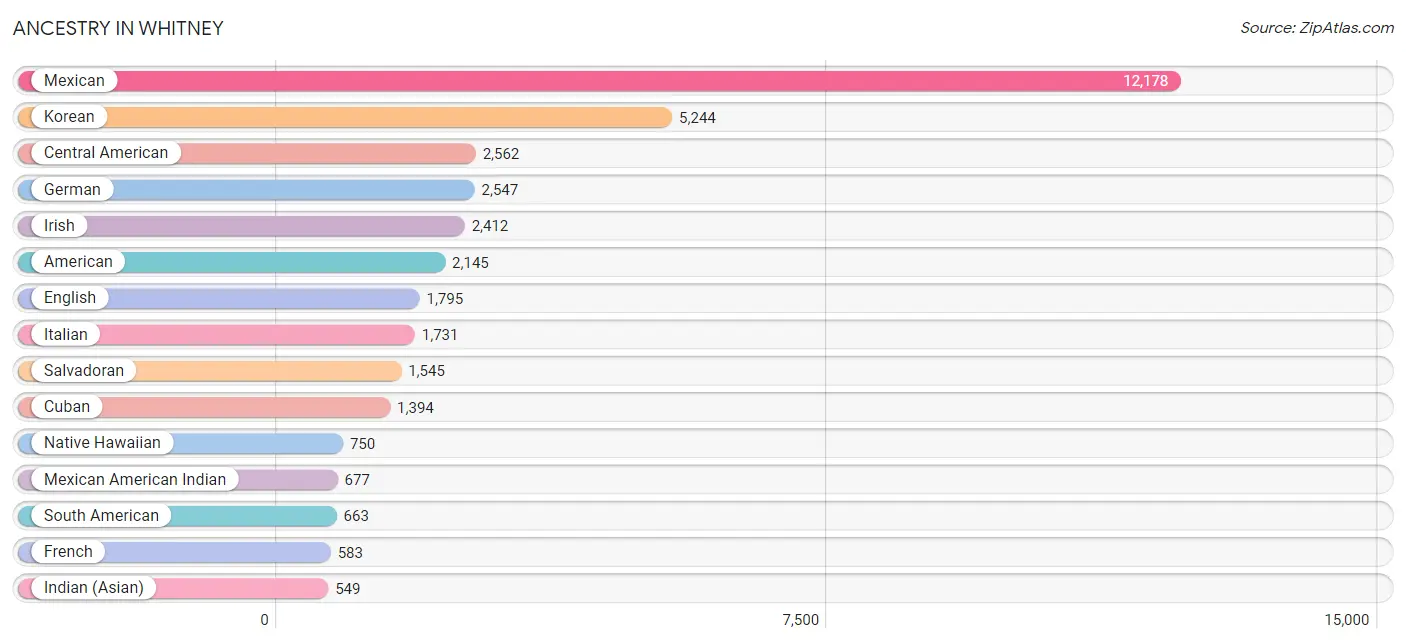
Ancestry in Whitney
The most populous ancestries reported in Whitney are Mexican (12,178 | 27.2%), Korean (5,244 | 11.7%), Central American (2,562 | 5.7%), German (2,547 | 5.7%), and Irish (2,412 | 5.4%), together accounting for 55.8% of all Whitney residents.
| Ancestry | # Population | % Population |
| African | 274 | 0.6% |
| Aleut | 9 | 0.0% |
| American | 2,145 | 4.8% |
| Apache | 214 | 0.5% |
| Arab | 192 | 0.4% |
| Argentinean | 44 | 0.1% |
| Armenian | 55 | 0.1% |
| Australian | 46 | 0.1% |
| Austrian | 50 | 0.1% |
| Bangladeshi | 3 | 0.0% |
| Bhutanese | 467 | 1.0% |
| Blackfeet | 24 | 0.1% |
| Brazilian | 11 | 0.0% |
| British | 59 | 0.1% |
| Burmese | 473 | 1.1% |
| Canadian | 135 | 0.3% |
| Celtic | 61 | 0.1% |
| Central American | 2,562 | 5.7% |
| Central American Indian | 38 | 0.1% |
| Cherokee | 164 | 0.4% |
| Choctaw | 210 | 0.5% |
| Colombian | 142 | 0.3% |
| Costa Rican | 16 | 0.0% |
| Croatian | 18 | 0.0% |
| Cuban | 1,394 | 3.1% |
| Czech | 28 | 0.1% |
| Czechoslovakian | 15 | 0.0% |
| Danish | 96 | 0.2% |
| Dominican | 300 | 0.7% |
| Dutch | 217 | 0.5% |
| Eastern European | 47 | 0.1% |
| Ecuadorian | 214 | 0.5% |
| Egyptian | 60 | 0.1% |
| English | 1,795 | 4.0% |
| Ethiopian | 85 | 0.2% |
| European | 330 | 0.7% |
| Filipino | 39 | 0.1% |
| Finnish | 48 | 0.1% |
| French | 583 | 1.3% |
| French American Indian | 7 | 0.0% |
| French Canadian | 100 | 0.2% |
| German | 2,547 | 5.7% |
| Greek | 47 | 0.1% |
| Guamanian / Chamorro | 42 | 0.1% |
| Guatemalan | 447 | 1.0% |
| Haitian | 23 | 0.1% |
| Honduran | 251 | 0.6% |
| Hungarian | 105 | 0.2% |
| Indian (Asian) | 549 | 1.2% |
| Iranian | 55 | 0.1% |
| Iraqi | 55 | 0.1% |
| Irish | 2,412 | 5.4% |
| Iroquois | 20 | 0.0% |
| Italian | 1,731 | 3.9% |
| Jamaican | 59 | 0.1% |
| Japanese | 16 | 0.0% |
| Jordanian | 48 | 0.1% |
| Korean | 5,244 | 11.7% |
| Laotian | 252 | 0.6% |
| Lebanese | 10 | 0.0% |
| Liberian | 26 | 0.1% |
| Lithuanian | 41 | 0.1% |
| Luxembourger | 8 | 0.0% |
| Malaysian | 122 | 0.3% |
| Mexican | 12,178 | 27.2% |
| Mexican American Indian | 677 | 1.5% |
| Native Hawaiian | 750 | 1.7% |
| Navajo | 72 | 0.2% |
| New Zealander | 26 | 0.1% |
| Nicaraguan | 232 | 0.5% |
| Nigerian | 35 | 0.1% |
| Norwegian | 373 | 0.8% |
| Paiute | 13 | 0.0% |
| Pakistani | 64 | 0.1% |
| Panamanian | 59 | 0.1% |
| Paraguayan | 32 | 0.1% |
| Pennsylvania German | 9 | 0.0% |
| Peruvian | 122 | 0.3% |
| Polish | 515 | 1.1% |
| Portuguese | 94 | 0.2% |
| Pueblo | 7 | 0.0% |
| Puerto Rican | 350 | 0.8% |
| Romanian | 202 | 0.4% |
| Russian | 233 | 0.5% |
| Salvadoran | 1,545 | 3.5% |
| Samoan | 171 | 0.4% |
| Scandinavian | 154 | 0.3% |
| Scotch-Irish | 54 | 0.1% |
| Scottish | 251 | 0.6% |
| Senegalese | 23 | 0.1% |
| Serbian | 175 | 0.4% |
| Shoshone | 45 | 0.1% |
| Sioux | 6 | 0.0% |
| Slovak | 65 | 0.2% |
| South American | 663 | 1.5% |
| Spaniard | 142 | 0.3% |
| Spanish | 276 | 0.6% |
| Sri Lankan | 276 | 0.6% |
| Subsaharan African | 533 | 1.2% |
| Swedish | 185 | 0.4% |
| Swiss | 8 | 0.0% |
| Syrian | 10 | 0.0% |
| Thai | 34 | 0.1% |
| Trinidadian and Tobagonian | 2 | 0.0% |
| Ukrainian | 33 | 0.1% |
| Uruguayan | 109 | 0.2% |
| Vietnamese | 98 | 0.2% |
| Welsh | 150 | 0.3% |
| Yugoslavian | 140 | 0.3% |
| Yup'ik | 13 | 0.0% | View All 110 Rows |
Immigrants in Whitney
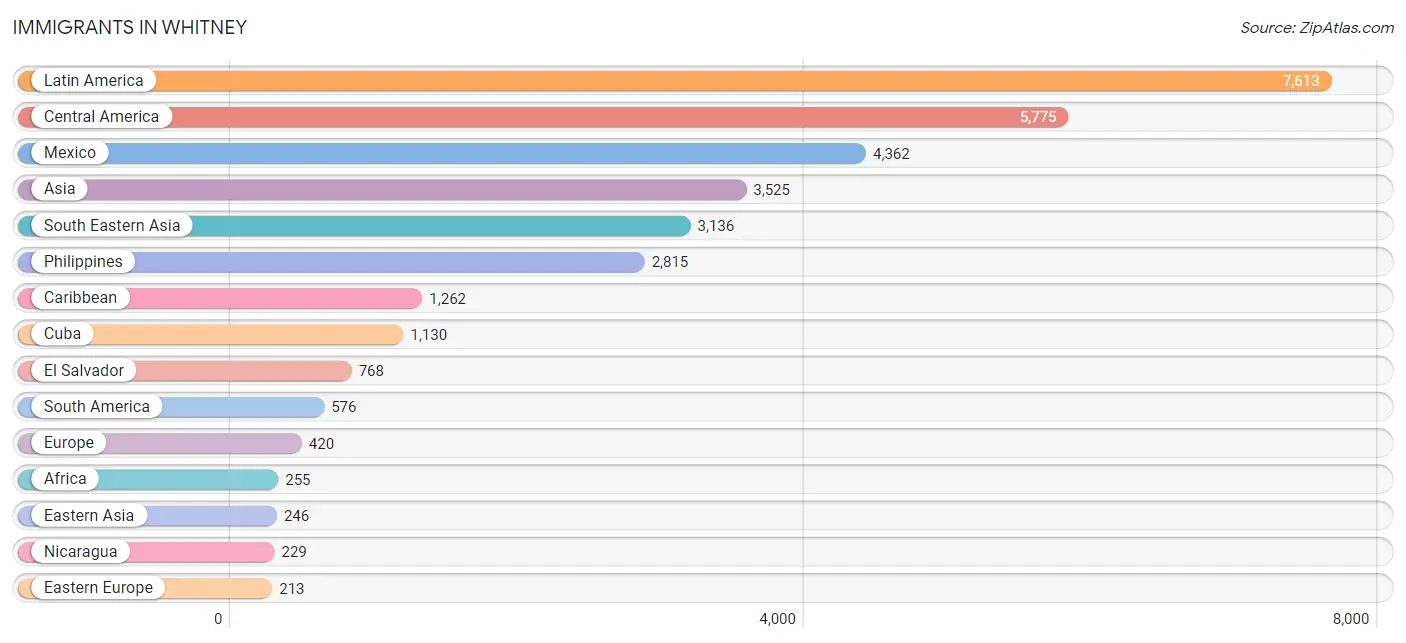
The most numerous immigrant groups reported in Whitney came from Latin America (7,613 | 17.0%), Central America (5,775 | 12.9%), Mexico (4,362 | 9.8%), Asia (3,525 | 7.9%), and South Eastern Asia (3,136 | 7.0%), together accounting for 54.6% of all Whitney residents.
| Immigration Origin | # Population | % Population |
| Africa | 255 | 0.6% |
| Argentina | 124 | 0.3% |
| Asia | 3,525 | 7.9% |
| Australia | 46 | 0.1% |
| Austria | 33 | 0.1% |
| Bangladesh | 63 | 0.1% |
| Bosnia and Herzegovina | 20 | 0.0% |
| Brazil | 20 | 0.0% |
| Canada | 101 | 0.2% |
| Caribbean | 1,262 | 2.8% |
| Central America | 5,775 | 12.9% |
| China | 20 | 0.0% |
| Colombia | 104 | 0.2% |
| Costa Rica | 9 | 0.0% |
| Cuba | 1,130 | 2.5% |
| Denmark | 21 | 0.1% |
| Dominican Republic | 87 | 0.2% |
| Eastern Africa | 96 | 0.2% |
| Eastern Asia | 246 | 0.5% |
| Eastern Europe | 213 | 0.5% |
| Ecuador | 96 | 0.2% |
| Egypt | 59 | 0.1% |
| El Salvador | 768 | 1.7% |
| England | 29 | 0.1% |
| Eritrea | 34 | 0.1% |
| Ethiopia | 62 | 0.1% |
| Europe | 420 | 0.9% |
| Germany | 18 | 0.0% |
| Ghana | 17 | 0.0% |
| Guatemala | 196 | 0.4% |
| Haiti | 23 | 0.1% |
| Honduras | 211 | 0.5% |
| India | 14 | 0.0% |
| Indonesia | 85 | 0.2% |
| Ireland | 21 | 0.1% |
| Italy | 28 | 0.1% |
| Jamaica | 20 | 0.0% |
| Japan | 51 | 0.1% |
| Jordan | 48 | 0.1% |
| Korea | 175 | 0.4% |
| Laos | 38 | 0.1% |
| Latin America | 7,613 | 17.0% |
| Latvia | 9 | 0.0% |
| Liberia | 25 | 0.1% |
| Mexico | 4,362 | 9.8% |
| Micronesia | 36 | 0.1% |
| Netherlands | 22 | 0.1% |
| Nicaragua | 229 | 0.5% |
| Nigeria | 35 | 0.1% |
| Northern Africa | 59 | 0.1% |
| Northern Europe | 71 | 0.2% |
| Oceania | 106 | 0.2% |
| Pakistan | 18 | 0.0% |
| Peru | 169 | 0.4% |
| Philippines | 2,815 | 6.3% |
| Romania | 136 | 0.3% |
| Russia | 48 | 0.1% |
| South America | 576 | 1.3% |
| South Central Asia | 95 | 0.2% |
| South Eastern Asia | 3,136 | 7.0% |
| Southern Europe | 55 | 0.1% |
| Spain | 27 | 0.1% |
| Switzerland | 8 | 0.0% |
| Thailand | 21 | 0.1% |
| Trinidad and Tobago | 2 | 0.0% |
| Venezuela | 31 | 0.1% |
| Vietnam | 177 | 0.4% |
| Western Africa | 77 | 0.2% |
| Western Asia | 48 | 0.1% |
| Western Europe | 81 | 0.2% | View All 70 Rows |
Sex and Age in Whitney
Sex and Age in Whitney
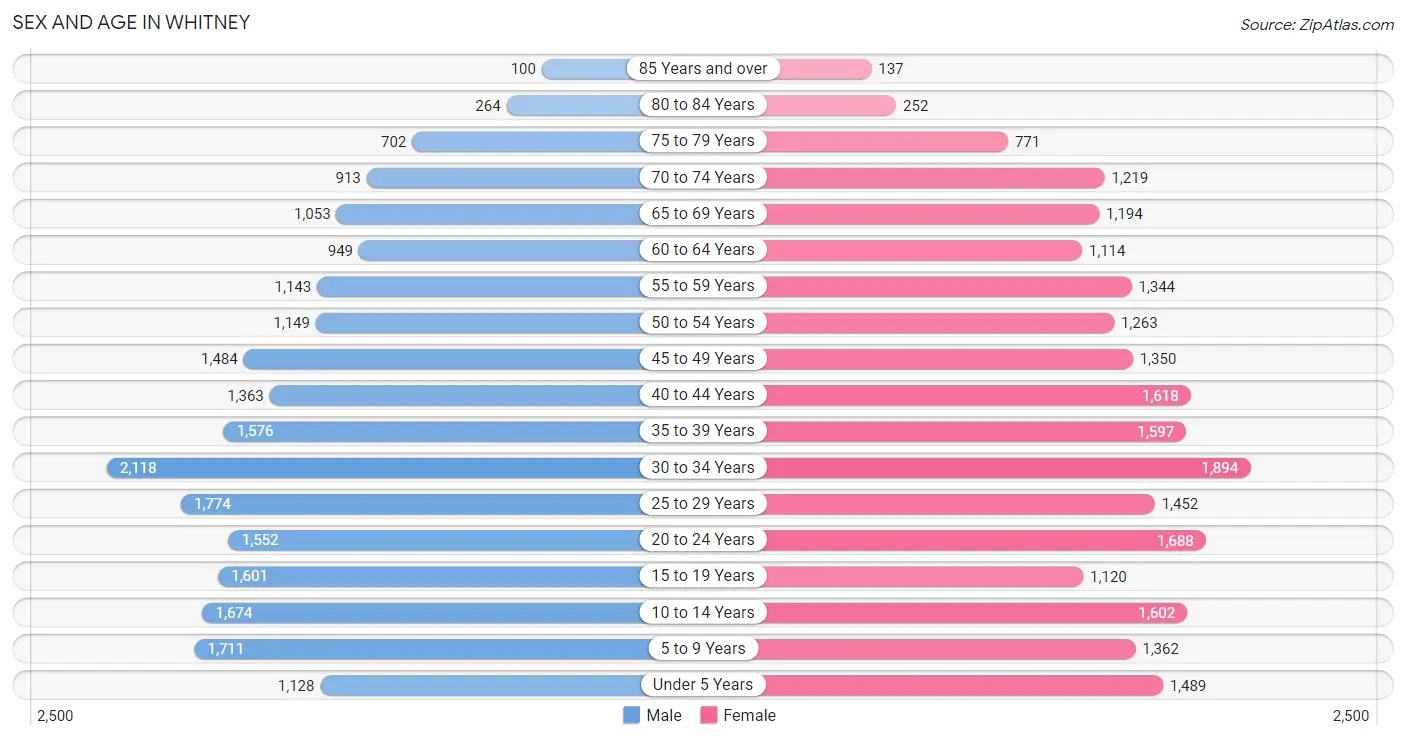
The most populous age groups in Whitney are 30 to 34 Years (2,118 | 9.5%) for men and 30 to 34 Years (1,894 | 8.4%) for women.
| Age Bracket | Male | Female |
| Under 5 Years | 1,128 (5.1%) | 1,489 (6.6%) |
| 5 to 9 Years | 1,711 (7.7%) | 1,362 (6.1%) |
| 10 to 14 Years | 1,674 (7.5%) | 1,602 (7.1%) |
| 15 to 19 Years | 1,601 (7.2%) | 1,120 (5.0%) |
| 20 to 24 Years | 1,552 (7.0%) | 1,688 (7.5%) |
| 25 to 29 Years | 1,774 (8.0%) | 1,452 (6.5%) |
| 30 to 34 Years | 2,118 (9.5%) | 1,894 (8.4%) |
| 35 to 39 Years | 1,576 (7.1%) | 1,597 (7.1%) |
| 40 to 44 Years | 1,363 (6.1%) | 1,618 (7.2%) |
| 45 to 49 Years | 1,484 (6.7%) | 1,350 (6.0%) |
| 50 to 54 Years | 1,149 (5.2%) | 1,263 (5.6%) |
| 55 to 59 Years | 1,143 (5.1%) | 1,344 (6.0%) |
| 60 to 64 Years | 949 (4.3%) | 1,114 (5.0%) |
| 65 to 69 Years | 1,053 (4.7%) | 1,194 (5.3%) |
| 70 to 74 Years | 913 (4.1%) | 1,219 (5.4%) |
| 75 to 79 Years | 702 (3.2%) | 771 (3.4%) |
| 80 to 84 Years | 264 (1.2%) | 252 (1.1%) |
| 85 Years and over | 100 (0.4%) | 137 (0.6%) |
| Total | 22,254 (100.0%) | 22,466 (100.0%) |
Families and Households in Whitney
Median Family Size in Whitney
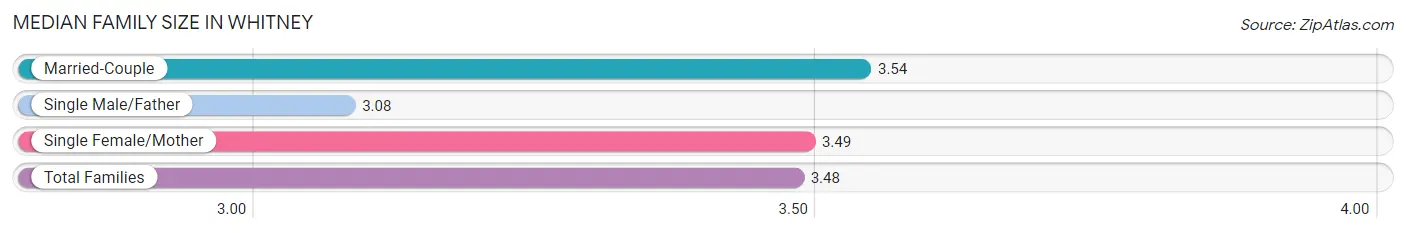
The median family size in Whitney is 3.48 persons per family, with married-couple families (6,440 | 62.7%) accounting for the largest median family size of 3.54 persons per family. On the other hand, single male/father families (1,095 | 10.7%) represent the smallest median family size with 3.08 persons per family.
| Family Type | # Families | Family Size |
| Married-Couple | 6,440 (62.7%) | 3.54 |
| Single Male/Father | 1,095 (10.7%) | 3.08 |
| Single Female/Mother | 2,737 (26.7%) | 3.49 |
| Total Families | 10,272 (100.0%) | 3.48 |
Median Household Size in Whitney
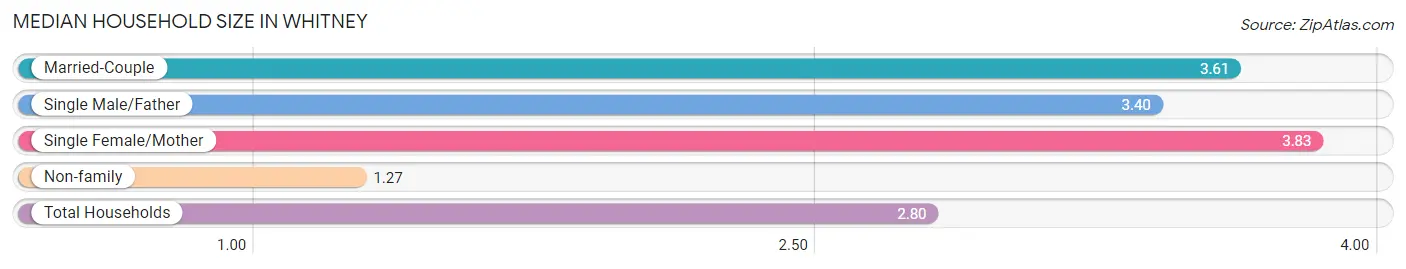
The median household size in Whitney is 2.80 persons per household, with single female/mother households (2,737 | 17.1%) accounting for the largest median household size of 3.83 persons per household. non-family households (5,724 | 35.8%) represent the smallest median household size with 1.27 persons per household.
| Household Type | # Households | Household Size |
| Married-Couple | 6,440 (40.3%) | 3.61 |
| Single Male/Father | 1,095 (6.9%) | 3.40 |
| Single Female/Mother | 2,737 (17.1%) | 3.83 |
| Non-family | 5,724 (35.8%) | 1.27 |
| Total Households | 15,996 (100.0%) | 2.80 |
Household Size by Marriage Status in Whitney
Out of a total of 15,996 households in Whitney, 10,272 (64.2%) are family households, while 5,724 (35.8%) are nonfamily households. The most numerous type of family households are 2-person households, comprising 3,913, and the most common type of nonfamily households are 1-person households, comprising 4,671.
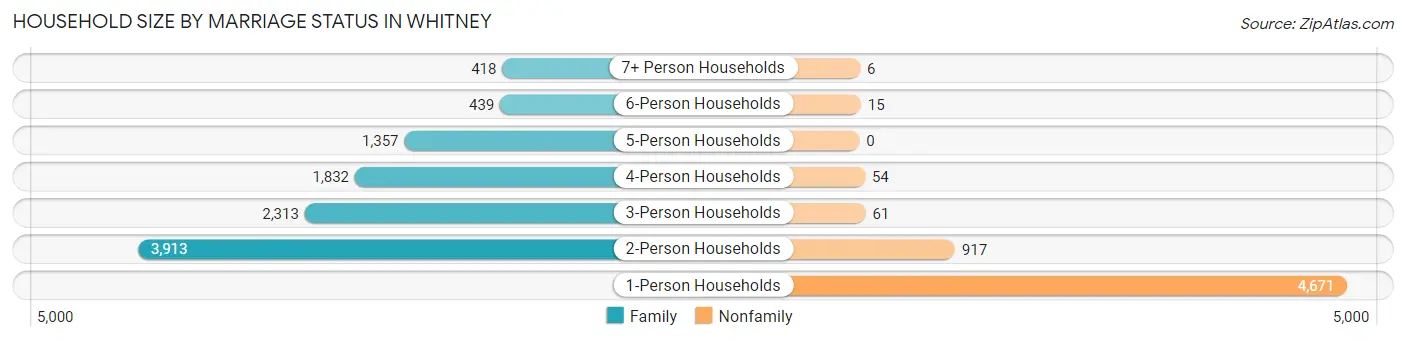
| Household Size | Family Households | Nonfamily Households |
| 1-Person Households | - | 4,671 (29.2%) |
| 2-Person Households | 3,913 (24.5%) | 917 (5.7%) |
| 3-Person Households | 2,313 (14.5%) | 61 (0.4%) |
| 4-Person Households | 1,832 (11.5%) | 54 (0.3%) |
| 5-Person Households | 1,357 (8.5%) | 0 (0.0%) |
| 6-Person Households | 439 (2.7%) | 15 (0.1%) |
| 7+ Person Households | 418 (2.6%) | 6 (0.0%) |
| Total | 10,272 (64.2%) | 5,724 (35.8%) |
Female Fertility in Whitney
Fertility by Age in Whitney
Average fertility rate in Whitney is 29.0 births per 1,000 women. Women in the age bracket of 20 to 34 years have the highest fertility rate with 43.0 births per 1,000 women. Women in the age bracket of 20 to 34 years acount for 67.3% of all women with births.
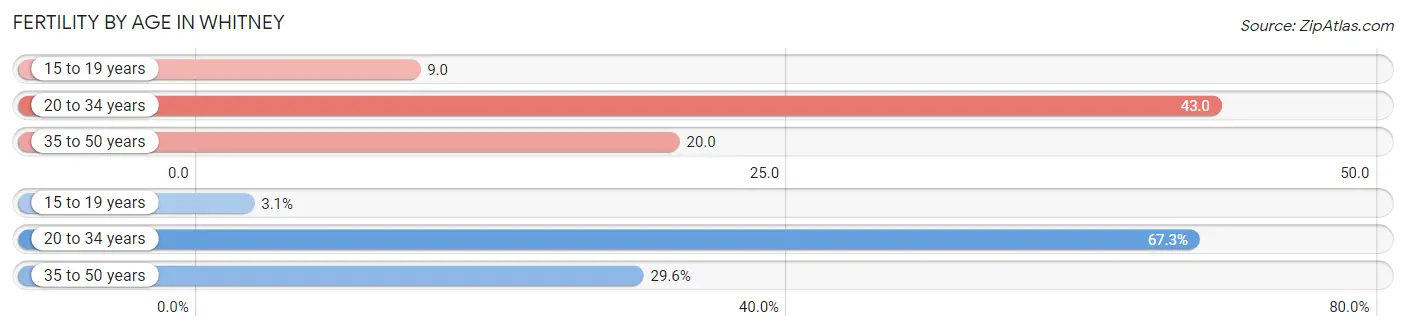
| Age Bracket | Women with Births | Births / 1,000 Women |
| 15 to 19 years | 10 (3.1%) | 9.0 |
| 20 to 34 years | 214 (67.3%) | 43.0 |
| 35 to 50 years | 94 (29.6%) | 20.0 |
| Total | 318 (100.0%) | 29.0 |
Fertility by Age by Marriage Status in Whitney
57.2% of women with births (318) in Whitney are married. The highest percentage of unmarried women with births falls into 15 to 19 years age bracket with 100.0% of them unmarried at the time of birth, while the lowest percentage of unmarried women with births belong to 35 to 50 years age bracket with 8.5% of them unmarried.
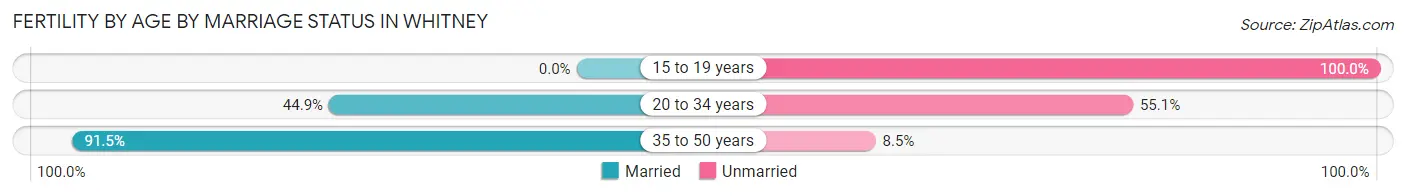
| Age Bracket | Married | Unmarried |
| 15 to 19 years | 0 (0.0%) | 10 (100.0%) |
| 20 to 34 years | 96 (44.9%) | 118 (55.1%) |
| 35 to 50 years | 86 (91.5%) | 8 (8.5%) |
| Total | 182 (57.2%) | 136 (42.8%) |
Fertility by Education in Whitney
Average fertility rate in Whitney is 29.0 births per 1,000 women. Women with the education attainment of college or associate's degree have the highest fertility rate of 42.0 births per 1,000 women, while women with the education attainment of bachelor's degree have the lowest fertility at 15.0 births per 1,000 women. Women with the education attainment of college or associate's degree represent 43.1% of all women with births.
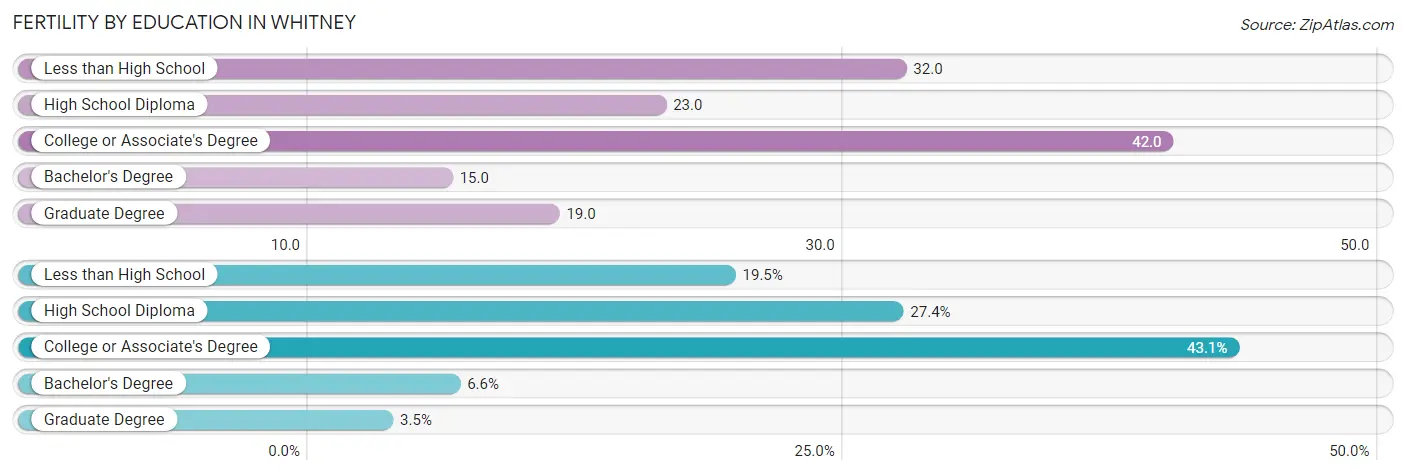
| Educational Attainment | Women with Births | Births / 1,000 Women |
| Less than High School | 62 (19.5%) | 32.0 |
| High School Diploma | 87 (27.4%) | 23.0 |
| College or Associate's Degree | 137 (43.1%) | 42.0 |
| Bachelor's Degree | 21 (6.6%) | 15.0 |
| Graduate Degree | 11 (3.5%) | 19.0 |
| Total | 318 (100.0%) | 29.0 |
Fertility by Education by Marriage Status in Whitney
42.8% of women with births in Whitney are unmarried. Women with the educational attainment of graduate degree are most likely to be married with 100.0% of them married at childbirth, while women with the educational attainment of less than high school are least likely to be married with 100.0% of them unmarried at childbirth.
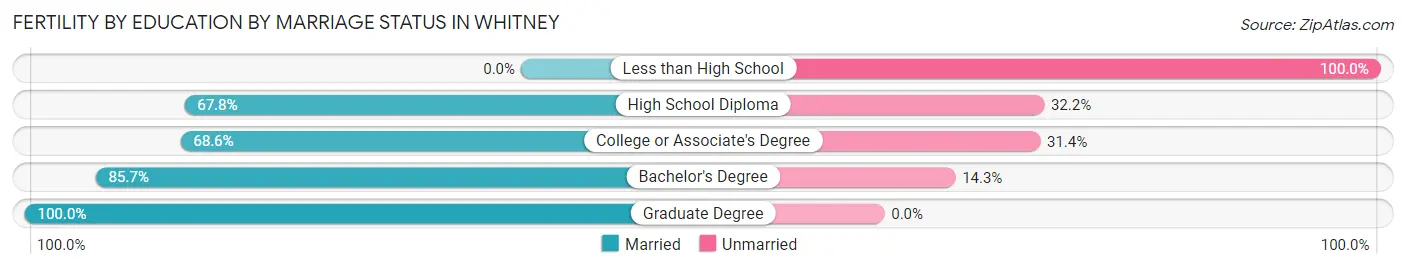
| Educational Attainment | Married | Unmarried |
| Less than High School | 0 (0.0%) | 62 (100.0%) |
| High School Diploma | 59 (67.8%) | 28 (32.2%) |
| College or Associate's Degree | 94 (68.6%) | 43 (31.4%) |
| Bachelor's Degree | 18 (85.7%) | 3 (14.3%) |
| Graduate Degree | 11 (100.0%) | 0 (0.0%) |
| Total | 182 (57.2%) | 136 (42.8%) |
Employment Characteristics in Whitney
Employment by Class of Employer in Whitney
Among the 20,213 employed individuals in Whitney, private company employees (14,937 | 73.9%), local government employees (1,373 | 6.8%), and self-employed (not incorporated) (998 | 4.9%) make up the most common classes of employment.
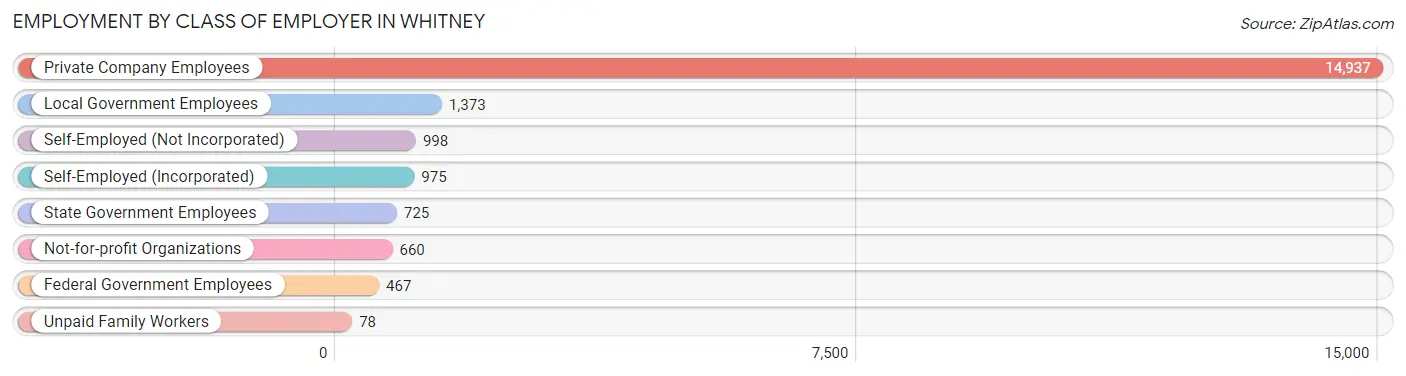
| Employer Class | # Employees | % Employees |
| Private Company Employees | 14,937 | 73.9% |
| Self-Employed (Incorporated) | 975 | 4.8% |
| Self-Employed (Not Incorporated) | 998 | 4.9% |
| Not-for-profit Organizations | 660 | 3.3% |
| Local Government Employees | 1,373 | 6.8% |
| State Government Employees | 725 | 3.6% |
| Federal Government Employees | 467 | 2.3% |
| Unpaid Family Workers | 78 | 0.4% |
| Total | 20,213 | 100.0% |
Employment Status by Age in Whitney
According to the labor force statistics for Whitney, out of the total population over 16 years of age (35,152), 65.4% or 22,989 individuals are in the labor force, with 7.8% or 1,793 of them unemployed. The age group with the highest labor force participation rate is 30 to 34 years, with 87.1% or 3,494 individuals in the labor force. Within the labor force, the 16 to 19 years age range has the highest percentage of unemployed individuals, with 18.5% or 167 of them being unemployed.
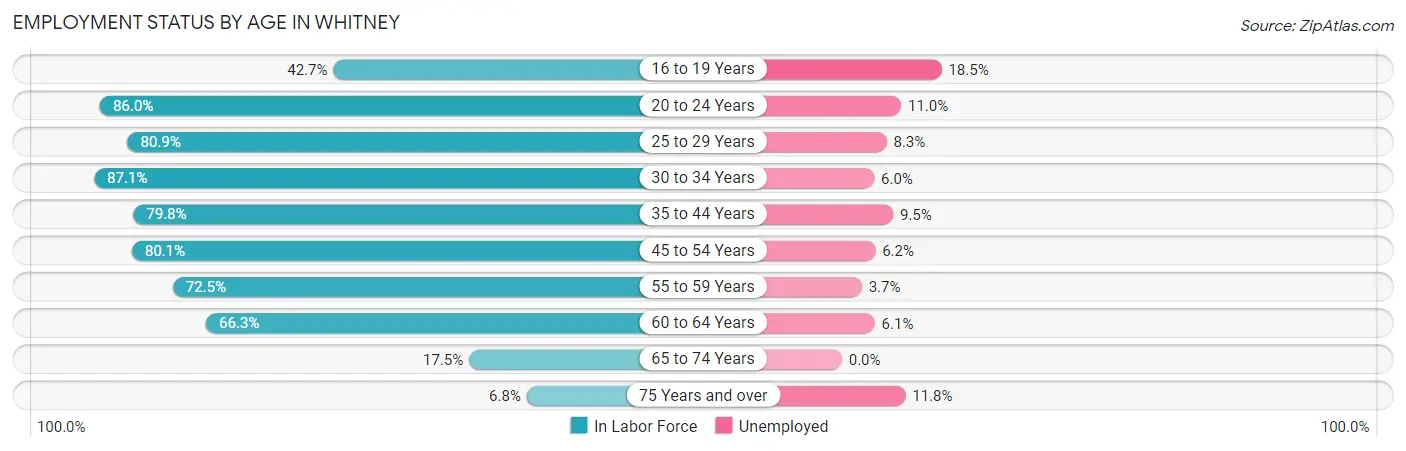
| Age Bracket | In Labor Force | Unemployed |
| 16 to 19 Years | 905 (42.7%) | 167 (18.5%) |
| 20 to 24 Years | 2,786 (86.0%) | 306 (11.0%) |
| 25 to 29 Years | 2,610 (80.9%) | 217 (8.3%) |
| 30 to 34 Years | 3,494 (87.1%) | 210 (6.0%) |
| 35 to 44 Years | 4,911 (79.8%) | 467 (9.5%) |
| 45 to 54 Years | 4,202 (80.1%) | 261 (6.2%) |
| 55 to 59 Years | 1,803 (72.5%) | 67 (3.7%) |
| 60 to 64 Years | 1,368 (66.3%) | 83 (6.1%) |
| 65 to 74 Years | 766 (17.5%) | 0 (0.0%) |
| 75 Years and over | 151 (6.8%) | 18 (11.8%) |
| Total | 22,989 (65.4%) | 1,793 (7.8%) |
Employment Status by Educational Attainment in Whitney
According to labor force statistics for Whitney, 79.3% of individuals (18,388) out of the total population between 25 and 64 years of age (23,188) are in the labor force, with 7.1% or 1,306 of them being unemployed. The group with the highest labor force participation rate are those with the educational attainment of bachelor's degree or higher, with 87.8% or 3,570 individuals in the labor force. Within the labor force, individuals with high school diploma education have the highest percentage of unemployment, with 13.3% or 790 of them being unemployed.
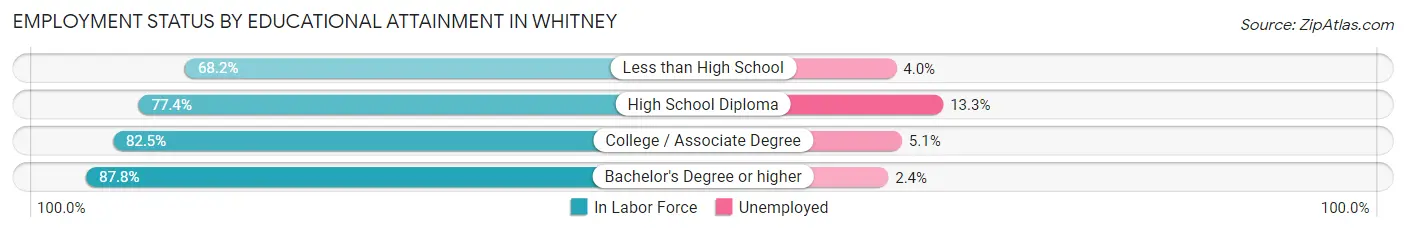
| Educational Attainment | In Labor Force | Unemployed |
| Less than High School | 2,724 (68.2%) | 160 (4.0%) |
| High School Diploma | 5,939 (77.4%) | 1,021 (13.3%) |
| College / Associate Degree | 6,150 (82.5%) | 380 (5.1%) |
| Bachelor's Degree or higher | 3,570 (87.8%) | 98 (2.4%) |
| Total | 18,388 (79.3%) | 1,646 (7.1%) |
Employment Occupations by Sex in Whitney
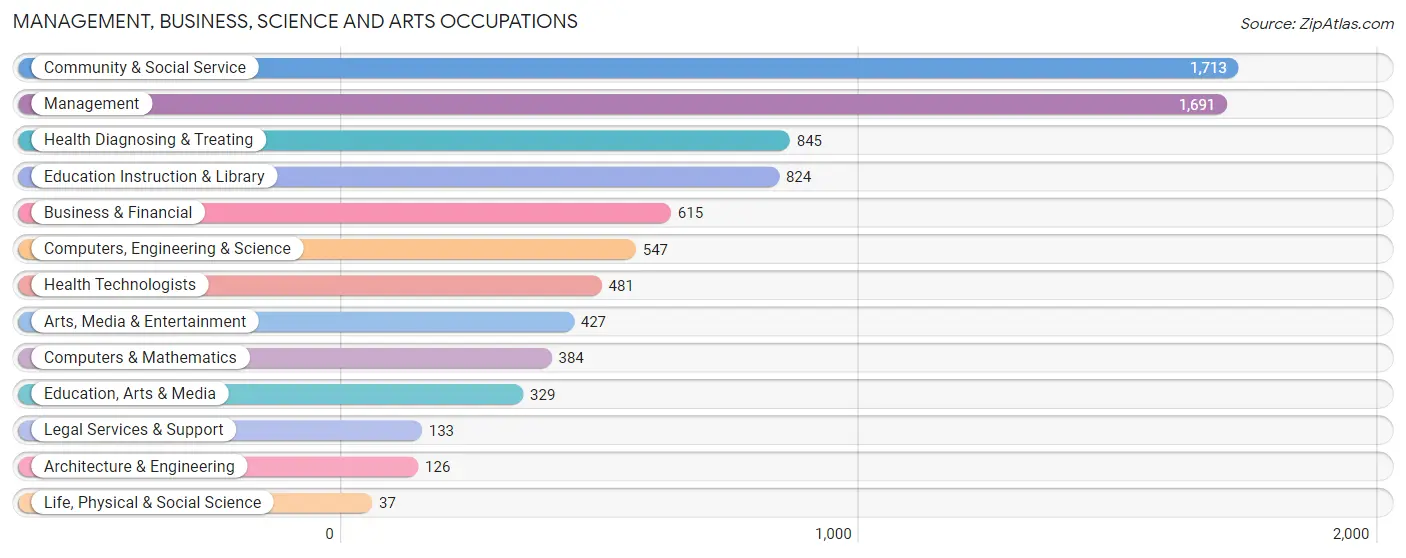
Management, Business, Science and Arts Occupations
The most common Management, Business, Science and Arts occupations in Whitney are Community & Social Service (1,713 | 8.1%), Management (1,691 | 8.0%), Health Diagnosing & Treating (845 | 4.0%), Education Instruction & Library (824 | 3.9%), and Business & Financial (615 | 2.9%).
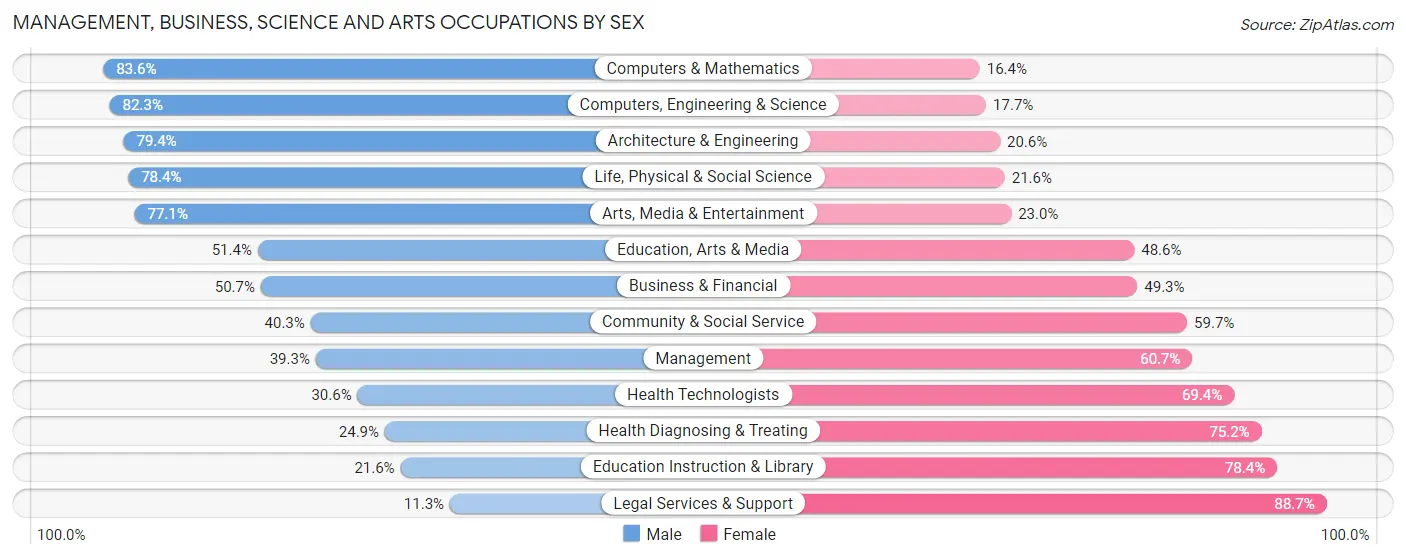
Management, Business, Science and Arts Occupations by Sex
Within the Management, Business, Science and Arts occupations in Whitney, the most male-oriented occupations are Computers & Mathematics (83.6%), Computers, Engineering & Science (82.3%), and Architecture & Engineering (79.4%), while the most female-oriented occupations are Legal Services & Support (88.7%), Education Instruction & Library (78.4%), and Health Diagnosing & Treating (75.1%).
| Occupation | Male | Female |
| Management | 664 (39.3%) | 1,027 (60.7%) |
| Business & Financial | 312 (50.7%) | 303 (49.3%) |
| Computers, Engineering & Science | 450 (82.3%) | 97 (17.7%) |
| Computers & Mathematics | 321 (83.6%) | 63 (16.4%) |
| Architecture & Engineering | 100 (79.4%) | 26 (20.6%) |
| Life, Physical & Social Science | 29 (78.4%) | 8 (21.6%) |
| Community & Social Service | 691 (40.3%) | 1,022 (59.7%) |
| Education, Arts & Media | 169 (51.4%) | 160 (48.6%) |
| Legal Services & Support | 15 (11.3%) | 118 (88.7%) |
| Education Instruction & Library | 178 (21.6%) | 646 (78.4%) |
| Arts, Media & Entertainment | 329 (77.0%) | 98 (23.0%) |
| Health Diagnosing & Treating | 210 (24.8%) | 635 (75.1%) |
| Health Technologists | 147 (30.6%) | 334 (69.4%) |
| Total (Category) | 2,327 (43.0%) | 3,084 (57.0%) |
| Total (Overall) | 10,996 (52.1%) | 10,121 (47.9%) |
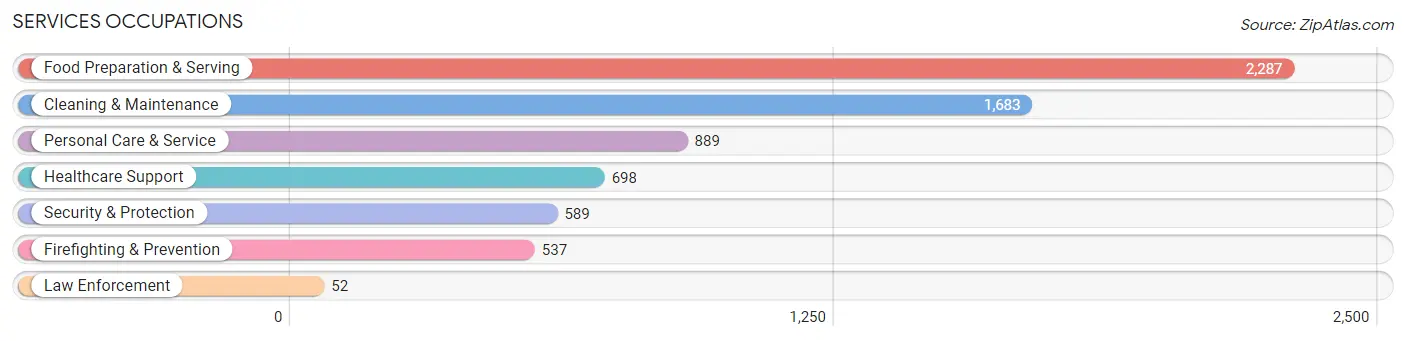
Services Occupations
The most common Services occupations in Whitney are Food Preparation & Serving (2,287 | 10.8%), Cleaning & Maintenance (1,683 | 8.0%), Personal Care & Service (889 | 4.2%), Healthcare Support (698 | 3.3%), and Security & Protection (589 | 2.8%).
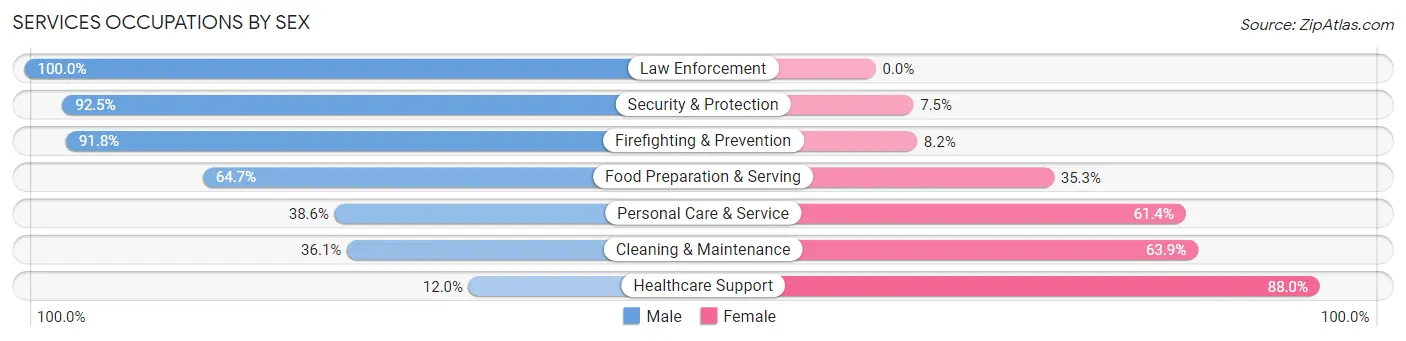
Services Occupations by Sex
Within the Services occupations in Whitney, the most male-oriented occupations are Law Enforcement (100.0%), Security & Protection (92.5%), and Firefighting & Prevention (91.8%), while the most female-oriented occupations are Healthcare Support (88.0%), Cleaning & Maintenance (63.9%), and Personal Care & Service (61.4%).
| Occupation | Male | Female |
| Healthcare Support | 84 (12.0%) | 614 (88.0%) |
| Security & Protection | 545 (92.5%) | 44 (7.5%) |
| Firefighting & Prevention | 493 (91.8%) | 44 (8.2%) |
| Law Enforcement | 52 (100.0%) | 0 (0.0%) |
| Food Preparation & Serving | 1,480 (64.7%) | 807 (35.3%) |
| Cleaning & Maintenance | 608 (36.1%) | 1,075 (63.9%) |
| Personal Care & Service | 343 (38.6%) | 546 (61.4%) |
| Total (Category) | 3,060 (49.8%) | 3,086 (50.2%) |
| Total (Overall) | 10,996 (52.1%) | 10,121 (47.9%) |
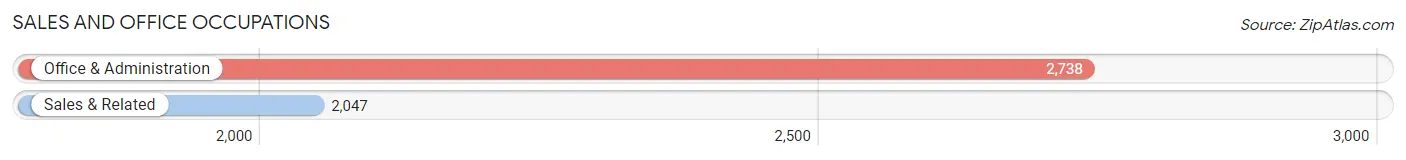
Sales and Office Occupations
The most common Sales and Office occupations in Whitney are Office & Administration (2,738 | 13.0%), and Sales & Related (2,047 | 9.7%).
Sales and Office Occupations by Sex
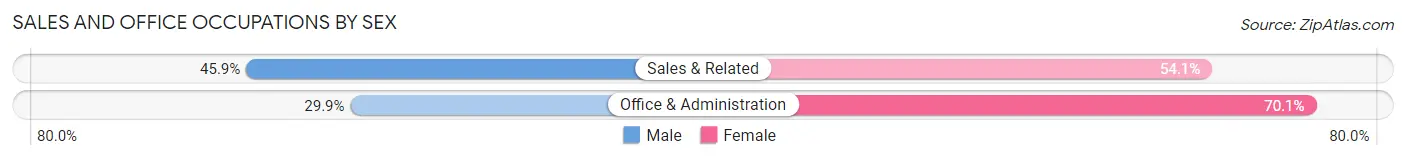
| Occupation | Male | Female |
| Sales & Related | 940 (45.9%) | 1,107 (54.1%) |
| Office & Administration | 818 (29.9%) | 1,920 (70.1%) |
| Total (Category) | 1,758 (36.7%) | 3,027 (63.3%) |
| Total (Overall) | 10,996 (52.1%) | 10,121 (47.9%) |
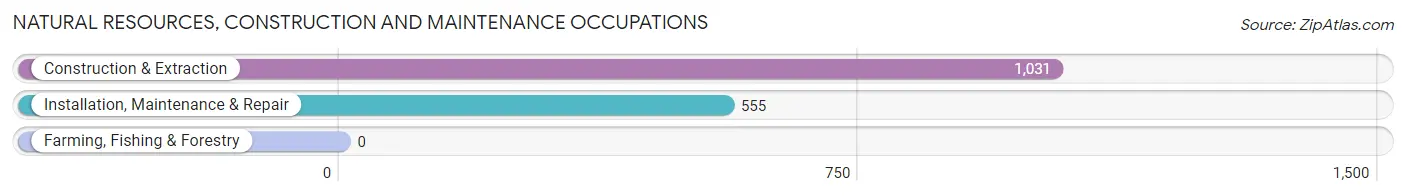
Natural Resources, Construction and Maintenance Occupations
The most common Natural Resources, Construction and Maintenance occupations in Whitney are Construction & Extraction (1,031 | 4.9%), and Installation, Maintenance & Repair (555 | 2.6%).
Natural Resources, Construction and Maintenance Occupations by Sex
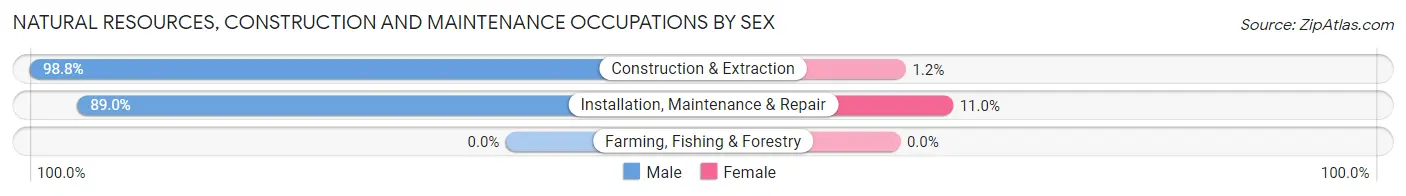
| Occupation | Male | Female |
| Farming, Fishing & Forestry | 0 (0.0%) | 0 (0.0%) |
| Construction & Extraction | 1,019 (98.8%) | 12 (1.2%) |
| Installation, Maintenance & Repair | 494 (89.0%) | 61 (11.0%) |
| Total (Category) | 1,513 (95.4%) | 73 (4.6%) |
| Total (Overall) | 10,996 (52.1%) | 10,121 (47.9%) |
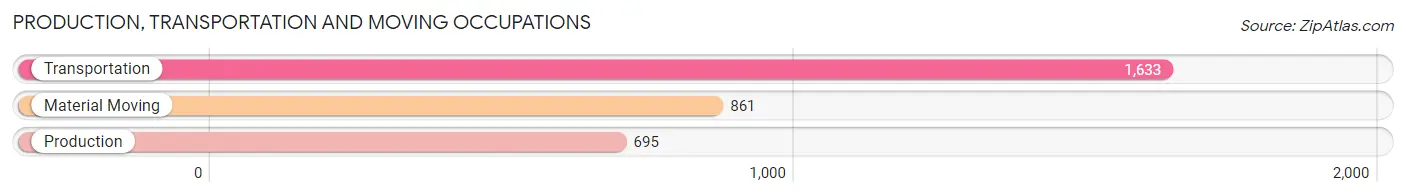
Production, Transportation and Moving Occupations
The most common Production, Transportation and Moving occupations in Whitney are Transportation (1,633 | 7.7%), Material Moving (861 | 4.1%), and Production (695 | 3.3%).
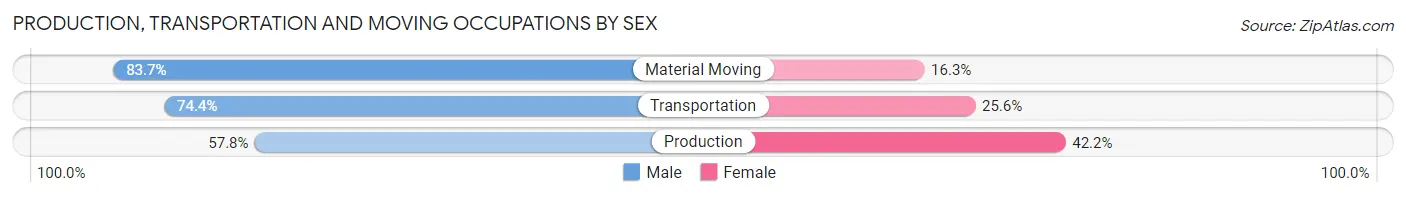
Production, Transportation and Moving Occupations by Sex
| Occupation | Male | Female |
| Production | 402 (57.8%) | 293 (42.2%) |
| Transportation | 1,215 (74.4%) | 418 (25.6%) |
| Material Moving | 721 (83.7%) | 140 (16.3%) |
| Total (Category) | 2,338 (73.3%) | 851 (26.7%) |
| Total (Overall) | 10,996 (52.1%) | 10,121 (47.9%) |
Employment Industries by Sex in Whitney
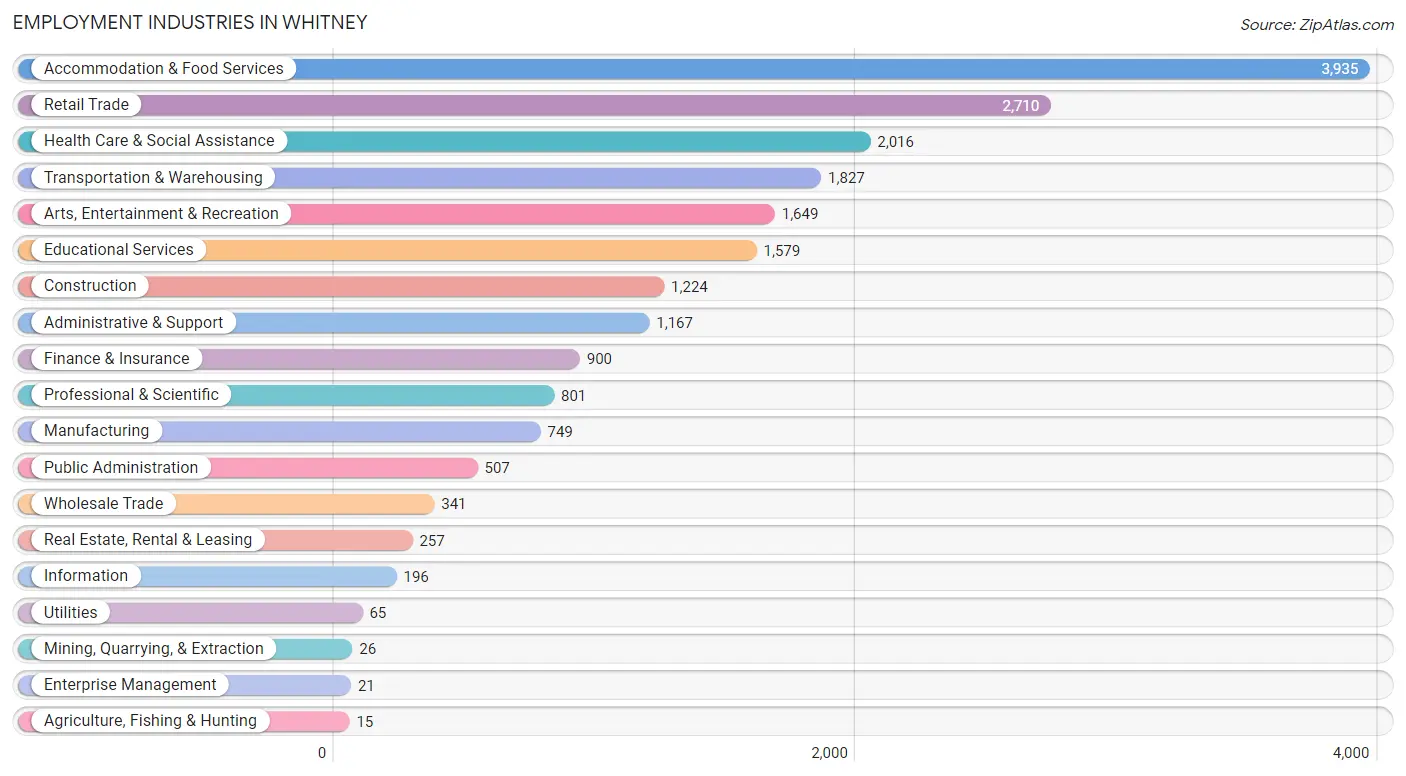
Employment Industries in Whitney
The major employment industries in Whitney include Accommodation & Food Services (3,935 | 18.6%), Retail Trade (2,710 | 12.8%), Health Care & Social Assistance (2,016 | 9.6%), Transportation & Warehousing (1,827 | 8.6%), and Arts, Entertainment & Recreation (1,649 | 7.8%).
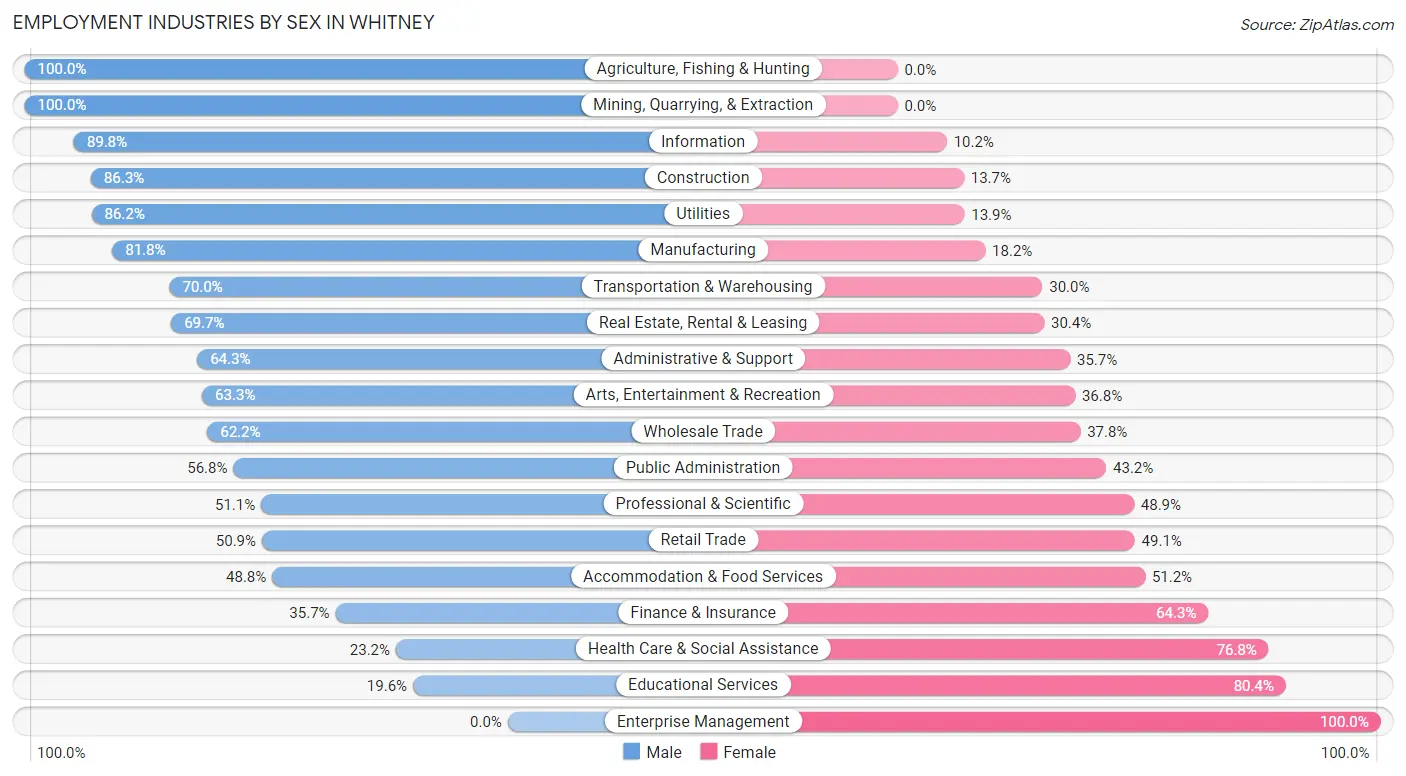
Employment Industries by Sex in Whitney
The Whitney industries that see more men than women are Agriculture, Fishing & Hunting (100.0%), Mining, Quarrying, & Extraction (100.0%), and Information (89.8%), whereas the industries that tend to have a higher number of women are Enterprise Management (100.0%), Educational Services (80.4%), and Health Care & Social Assistance (76.8%).
| Industry | Male | Female |
| Agriculture, Fishing & Hunting | 15 (100.0%) | 0 (0.0%) |
| Mining, Quarrying, & Extraction | 26 (100.0%) | 0 (0.0%) |
| Construction | 1,056 (86.3%) | 168 (13.7%) |
| Manufacturing | 613 (81.8%) | 136 (18.2%) |
| Wholesale Trade | 212 (62.2%) | 129 (37.8%) |
| Retail Trade | 1,379 (50.9%) | 1,331 (49.1%) |
| Transportation & Warehousing | 1,279 (70.0%) | 548 (30.0%) |
| Utilities | 56 (86.2%) | 9 (13.9%) |
| Information | 176 (89.8%) | 20 (10.2%) |
| Finance & Insurance | 321 (35.7%) | 579 (64.3%) |
| Real Estate, Rental & Leasing | 179 (69.7%) | 78 (30.3%) |
| Professional & Scientific | 409 (51.1%) | 392 (48.9%) |
| Enterprise Management | 0 (0.0%) | 21 (100.0%) |
| Administrative & Support | 750 (64.3%) | 417 (35.7%) |
| Educational Services | 310 (19.6%) | 1,269 (80.4%) |
| Health Care & Social Assistance | 467 (23.2%) | 1,549 (76.8%) |
| Arts, Entertainment & Recreation | 1,043 (63.2%) | 606 (36.7%) |
| Accommodation & Food Services | 1,919 (48.8%) | 2,016 (51.2%) |
| Public Administration | 288 (56.8%) | 219 (43.2%) |
| Total | 10,996 (52.1%) | 10,121 (47.9%) |
Education in Whitney
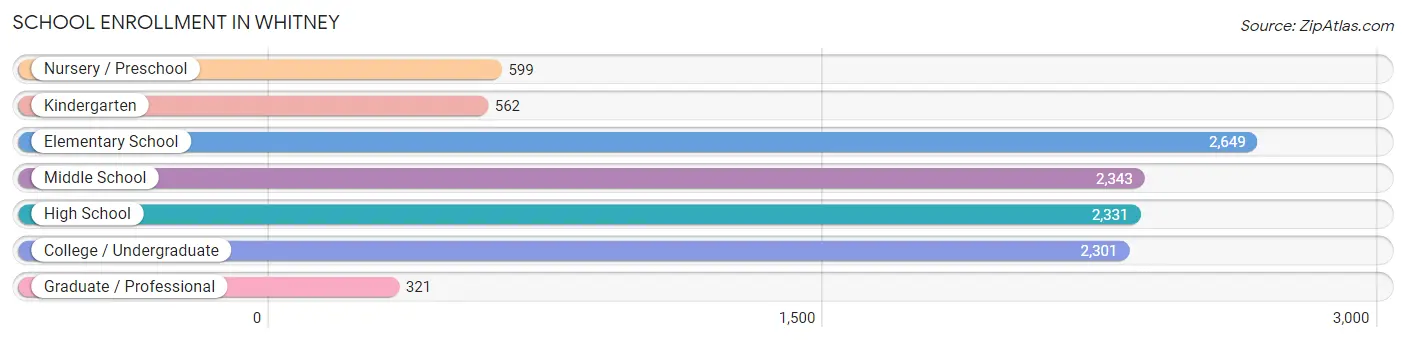
School Enrollment in Whitney
The most common levels of schooling among the 11,106 students in Whitney are elementary school (2,649 | 23.8%), middle school (2,343 | 21.1%), and high school (2,331 | 21.0%).
| School Level | # Students | % Students |
| Nursery / Preschool | 599 | 5.4% |
| Kindergarten | 562 | 5.1% |
| Elementary School | 2,649 | 23.8% |
| Middle School | 2,343 | 21.1% |
| High School | 2,331 | 21.0% |
| College / Undergraduate | 2,301 | 20.7% |
| Graduate / Professional | 321 | 2.9% |
| Total | 11,106 | 100.0% |
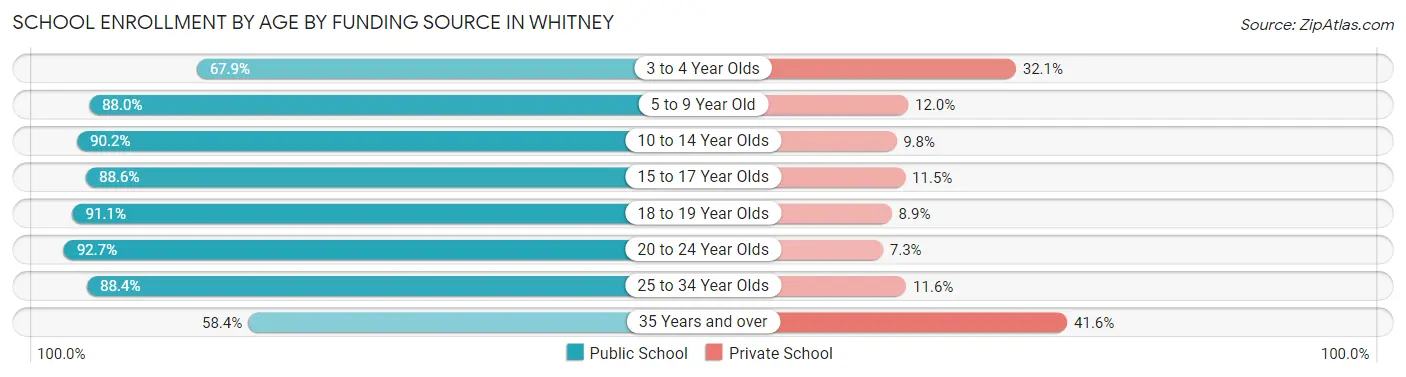
School Enrollment by Age by Funding Source in Whitney
Out of a total of 11,106 students who are enrolled in schools in Whitney, 1,544 (13.9%) attend a private institution, while the remaining 9,562 (86.1%) are enrolled in public schools. The age group of 35 years and over has the highest likelihood of being enrolled in private schools, with 350 (41.6% in the age bracket) enrolled. Conversely, the age group of 20 to 24 year olds has the lowest likelihood of being enrolled in a private school, with 622 (92.7% in the age bracket) attending a public institution.
| Age Bracket | Public School | Private School |
| 3 to 4 Year Olds | 337 (67.9%) | 159 (32.1%) |
| 5 to 9 Year Old | 2,509 (88.0%) | 342 (12.0%) |
| 10 to 14 Year Olds | 2,876 (90.2%) | 312 (9.8%) |
| 15 to 17 Year Olds | 1,346 (88.5%) | 174 (11.5%) |
| 18 to 19 Year Olds | 611 (91.1%) | 60 (8.9%) |
| 20 to 24 Year Olds | 622 (92.7%) | 49 (7.3%) |
| 25 to 34 Year Olds | 767 (88.4%) | 101 (11.6%) |
| 35 Years and over | 491 (58.4%) | 350 (41.6%) |
| Total | 9,562 (86.1%) | 1,544 (13.9%) |
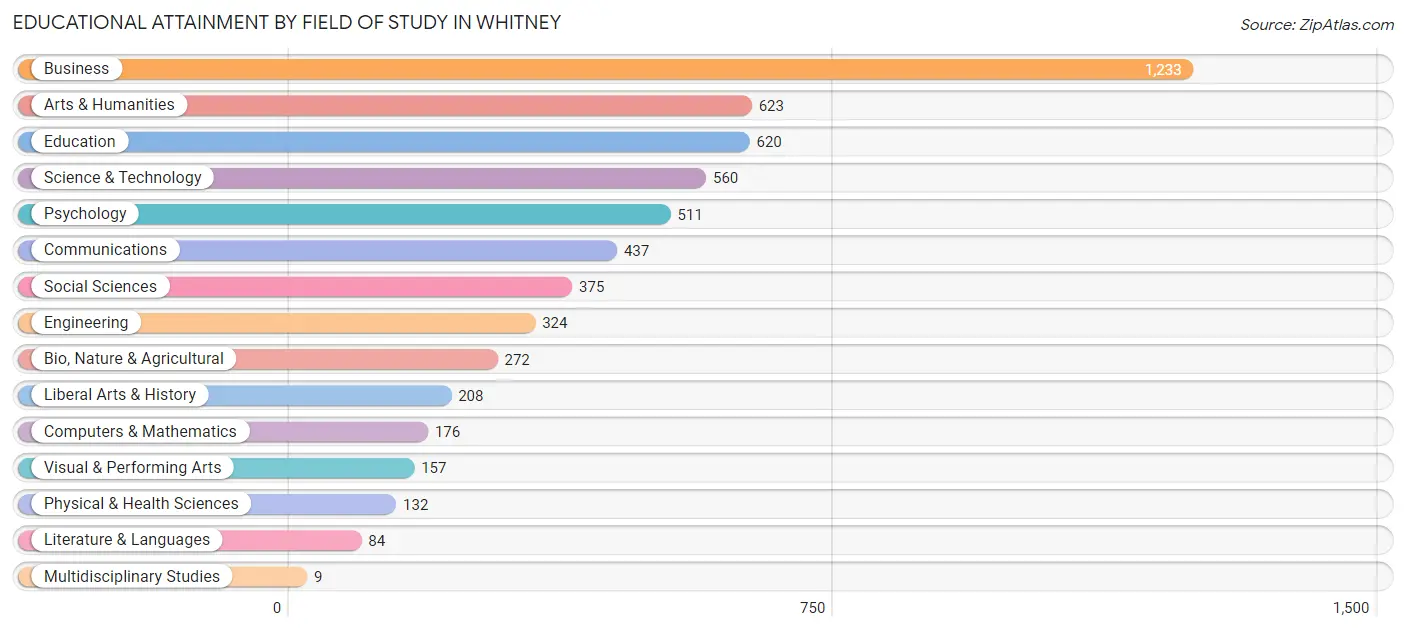
Educational Attainment by Field of Study in Whitney
Business (1,233 | 21.5%), arts & humanities (623 | 10.9%), education (620 | 10.8%), science & technology (560 | 9.8%), and psychology (511 | 8.9%) are the most common fields of study among 5,721 individuals in Whitney who have obtained a bachelor's degree or higher.
| Field of Study | # Graduates | % Graduates |
| Computers & Mathematics | 176 | 3.1% |
| Bio, Nature & Agricultural | 272 | 4.8% |
| Physical & Health Sciences | 132 | 2.3% |
| Psychology | 511 | 8.9% |
| Social Sciences | 375 | 6.6% |
| Engineering | 324 | 5.7% |
| Multidisciplinary Studies | 9 | 0.2% |
| Science & Technology | 560 | 9.8% |
| Business | 1,233 | 21.5% |
| Education | 620 | 10.8% |
| Literature & Languages | 84 | 1.5% |
| Liberal Arts & History | 208 | 3.6% |
| Visual & Performing Arts | 157 | 2.7% |
| Communications | 437 | 7.6% |
| Arts & Humanities | 623 | 10.9% |
| Total | 5,721 | 100.0% |
Transportation & Commute in Whitney
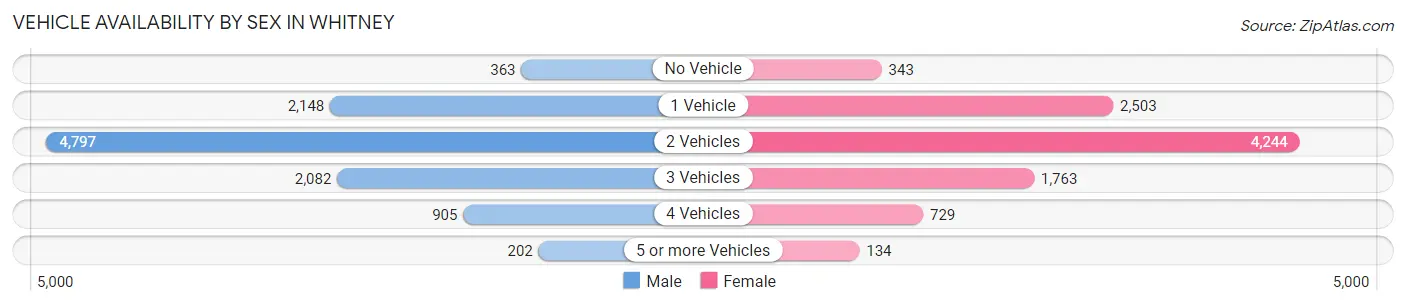
Vehicle Availability by Sex in Whitney
The most prevalent vehicle ownership categories in Whitney are males with 2 vehicles (4,797, accounting for 45.7%) and females with 2 vehicles (4,244, making up 49.4%).
| Vehicles Available | Male | Female |
| No Vehicle | 363 (3.5%) | 343 (3.5%) |
| 1 Vehicle | 2,148 (20.5%) | 2,503 (25.8%) |
| 2 Vehicles | 4,797 (45.7%) | 4,244 (43.7%) |
| 3 Vehicles | 2,082 (19.8%) | 1,763 (18.1%) |
| 4 Vehicles | 905 (8.6%) | 729 (7.5%) |
| 5 or more Vehicles | 202 (1.9%) | 134 (1.4%) |
| Total | 10,497 (100.0%) | 9,716 (100.0%) |
Commute Time in Whitney
The most frequently occuring commute durations in Whitney are 30 to 34 minutes (4,479 commuters, 23.3%), 20 to 24 minutes (4,208 commuters, 21.9%), and 25 to 29 minutes (2,571 commuters, 13.4%).
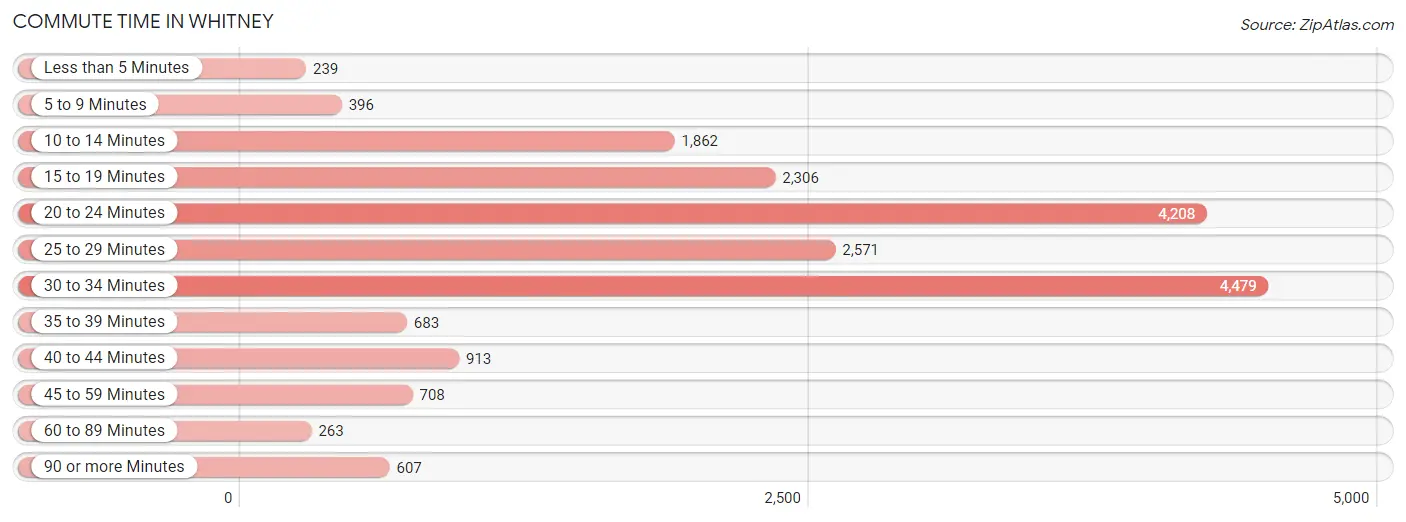
| Commute Time | # Commuters | % Commuters |
| Less than 5 Minutes | 239 | 1.2% |
| 5 to 9 Minutes | 396 | 2.1% |
| 10 to 14 Minutes | 1,862 | 9.7% |
| 15 to 19 Minutes | 2,306 | 12.0% |
| 20 to 24 Minutes | 4,208 | 21.9% |
| 25 to 29 Minutes | 2,571 | 13.4% |
| 30 to 34 Minutes | 4,479 | 23.3% |
| 35 to 39 Minutes | 683 | 3.5% |
| 40 to 44 Minutes | 913 | 4.8% |
| 45 to 59 Minutes | 708 | 3.7% |
| 60 to 89 Minutes | 263 | 1.4% |
| 90 or more Minutes | 607 | 3.2% |
Commute Time by Sex in Whitney
The most common commute times in Whitney are 30 to 34 minutes (2,518 commuters, 25.2%) for males and 20 to 24 minutes (2,082 commuters, 22.5%) for females.
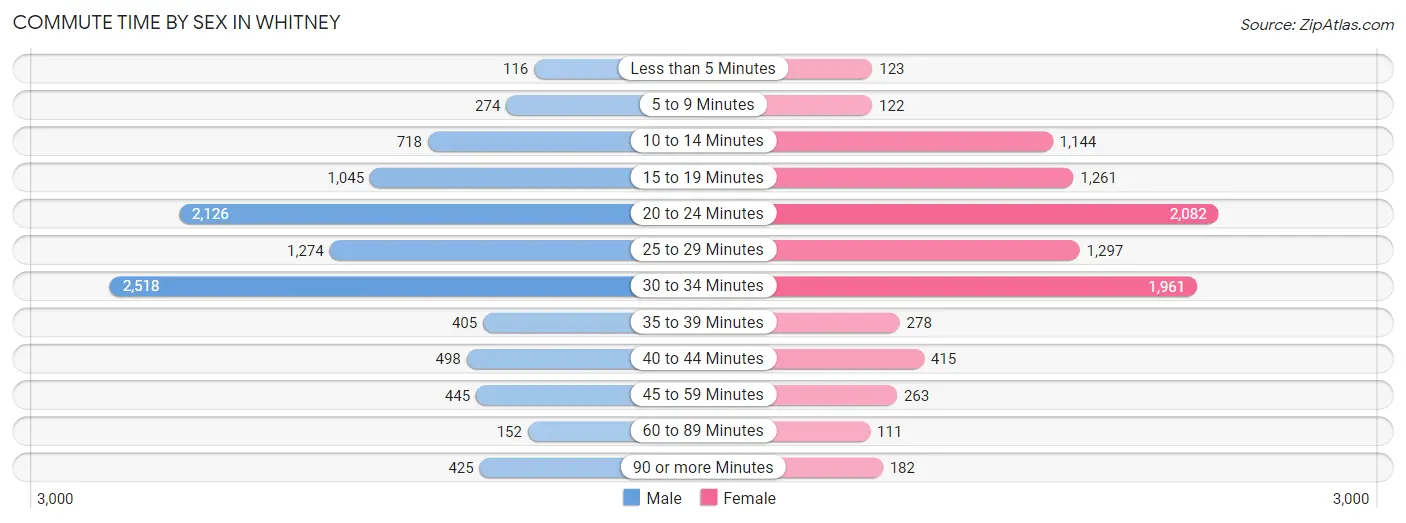
| Commute Time | Male | Female |
| Less than 5 Minutes | 116 (1.2%) | 123 (1.3%) |
| 5 to 9 Minutes | 274 (2.7%) | 122 (1.3%) |
| 10 to 14 Minutes | 718 (7.2%) | 1,144 (12.4%) |
| 15 to 19 Minutes | 1,045 (10.4%) | 1,261 (13.7%) |
| 20 to 24 Minutes | 2,126 (21.3%) | 2,082 (22.5%) |
| 25 to 29 Minutes | 1,274 (12.8%) | 1,297 (14.0%) |
| 30 to 34 Minutes | 2,518 (25.2%) | 1,961 (21.2%) |
| 35 to 39 Minutes | 405 (4.1%) | 278 (3.0%) |
| 40 to 44 Minutes | 498 (5.0%) | 415 (4.5%) |
| 45 to 59 Minutes | 445 (4.4%) | 263 (2.9%) |
| 60 to 89 Minutes | 152 (1.5%) | 111 (1.2%) |
| 90 or more Minutes | 425 (4.3%) | 182 (2.0%) |
Time of Departure to Work by Sex in Whitney
The most frequent times of departure to work in Whitney are 12:00 AM to 4:59 AM (1,197, 12.0%) for males and 7:00 AM to 7:29 AM (1,214, 13.1%) for females.
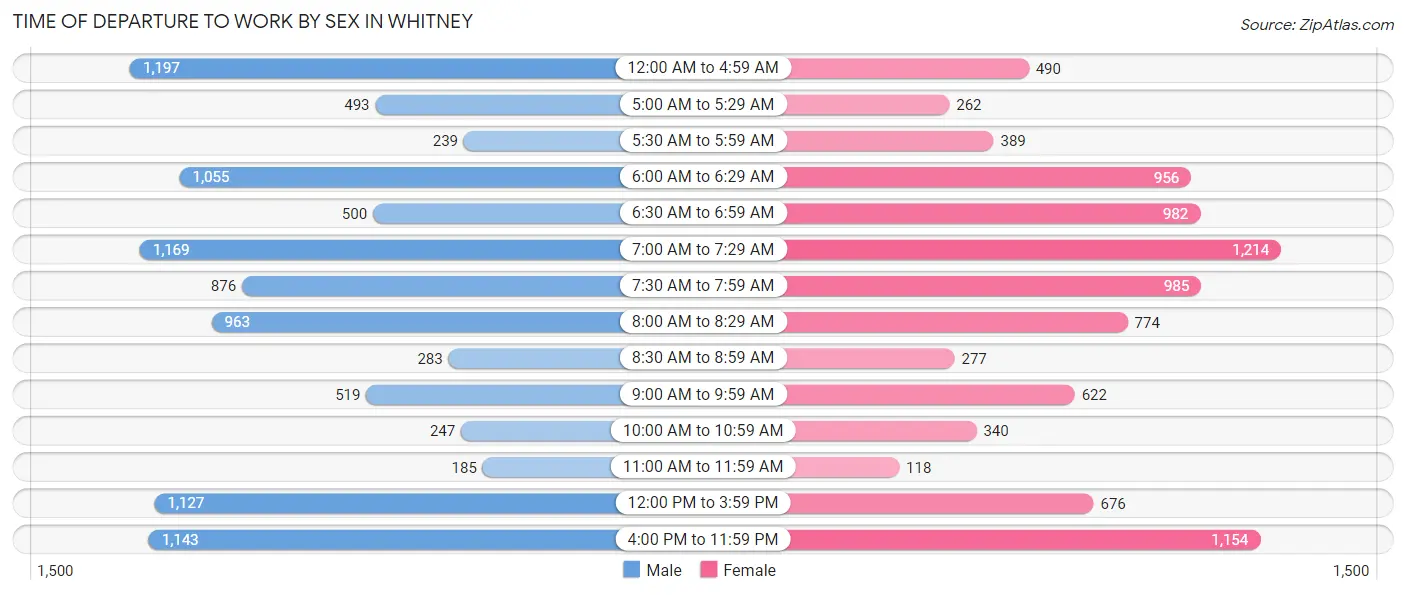
| Time of Departure | Male | Female |
| 12:00 AM to 4:59 AM | 1,197 (12.0%) | 490 (5.3%) |
| 5:00 AM to 5:29 AM | 493 (4.9%) | 262 (2.8%) |
| 5:30 AM to 5:59 AM | 239 (2.4%) | 389 (4.2%) |
| 6:00 AM to 6:29 AM | 1,055 (10.5%) | 956 (10.3%) |
| 6:30 AM to 6:59 AM | 500 (5.0%) | 982 (10.6%) |
| 7:00 AM to 7:29 AM | 1,169 (11.7%) | 1,214 (13.1%) |
| 7:30 AM to 7:59 AM | 876 (8.8%) | 985 (10.7%) |
| 8:00 AM to 8:29 AM | 963 (9.6%) | 774 (8.4%) |
| 8:30 AM to 8:59 AM | 283 (2.8%) | 277 (3.0%) |
| 9:00 AM to 9:59 AM | 519 (5.2%) | 622 (6.7%) |
| 10:00 AM to 10:59 AM | 247 (2.5%) | 340 (3.7%) |
| 11:00 AM to 11:59 AM | 185 (1.8%) | 118 (1.3%) |
| 12:00 PM to 3:59 PM | 1,127 (11.3%) | 676 (7.3%) |
| 4:00 PM to 11:59 PM | 1,143 (11.4%) | 1,154 (12.5%) |
| Total | 9,996 (100.0%) | 9,239 (100.0%) |
Housing Occupancy in Whitney
Occupancy by Ownership in Whitney
Of the total 15,996 dwellings in Whitney, owner-occupied units account for 8,956 (56.0%), while renter-occupied units make up 7,040 (44.0%).
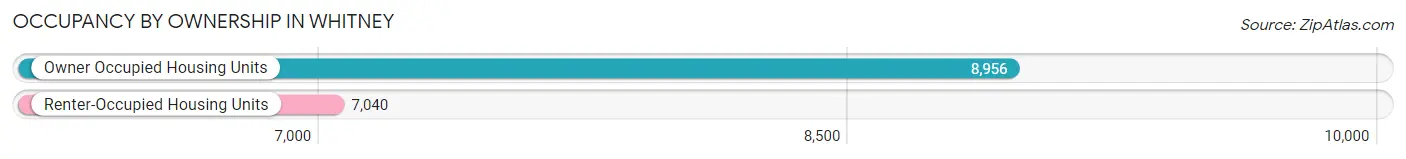
| Occupancy | # Housing Units | % Housing Units |
| Owner Occupied Housing Units | 8,956 | 56.0% |
| Renter-Occupied Housing Units | 7,040 | 44.0% |
| Total Occupied Housing Units | 15,996 | 100.0% |
Occupancy by Household Size in Whitney
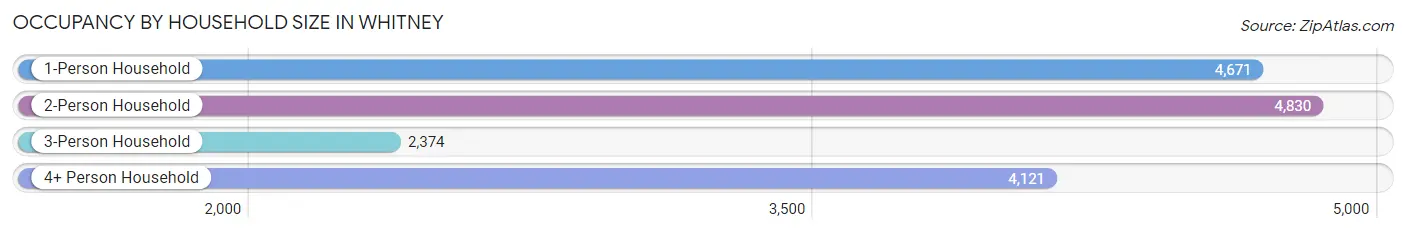
| Household Size | # Housing Units | % Housing Units |
| 1-Person Household | 4,671 | 29.2% |
| 2-Person Household | 4,830 | 30.2% |
| 3-Person Household | 2,374 | 14.8% |
| 4+ Person Household | 4,121 | 25.8% |
| Total Housing Units | 15,996 | 100.0% |
Occupancy by Ownership by Household Size in Whitney
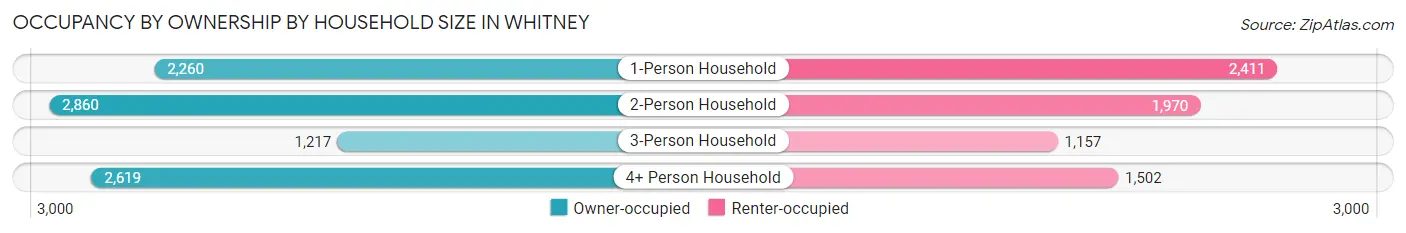
| Household Size | Owner-occupied | Renter-occupied |
| 1-Person Household | 2,260 (48.4%) | 2,411 (51.6%) |
| 2-Person Household | 2,860 (59.2%) | 1,970 (40.8%) |
| 3-Person Household | 1,217 (51.3%) | 1,157 (48.7%) |
| 4+ Person Household | 2,619 (63.5%) | 1,502 (36.4%) |
| Total Housing Units | 8,956 (56.0%) | 7,040 (44.0%) |
Occupancy by Educational Attainment in Whitney
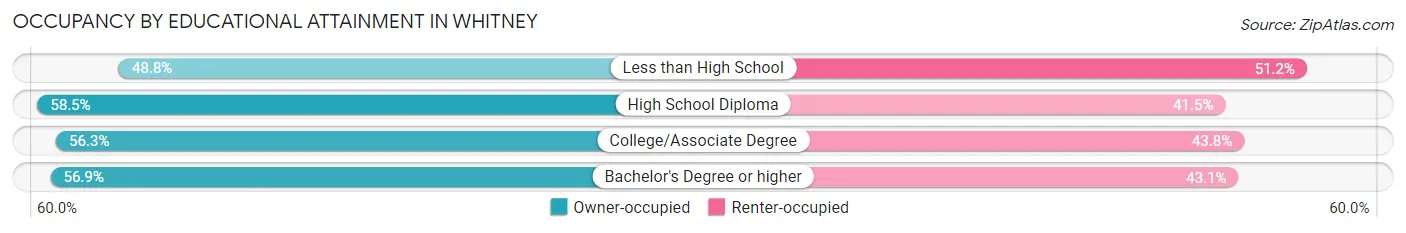
| Household Size | Owner-occupied | Renter-occupied |
| Less than High School | 1,104 (48.8%) | 1,159 (51.2%) |
| High School Diploma | 2,708 (58.5%) | 1,923 (41.5%) |
| College/Associate Degree | 3,086 (56.2%) | 2,400 (43.8%) |
| Bachelor's Degree or higher | 2,058 (56.9%) | 1,558 (43.1%) |
Occupancy by Age of Householder in Whitney
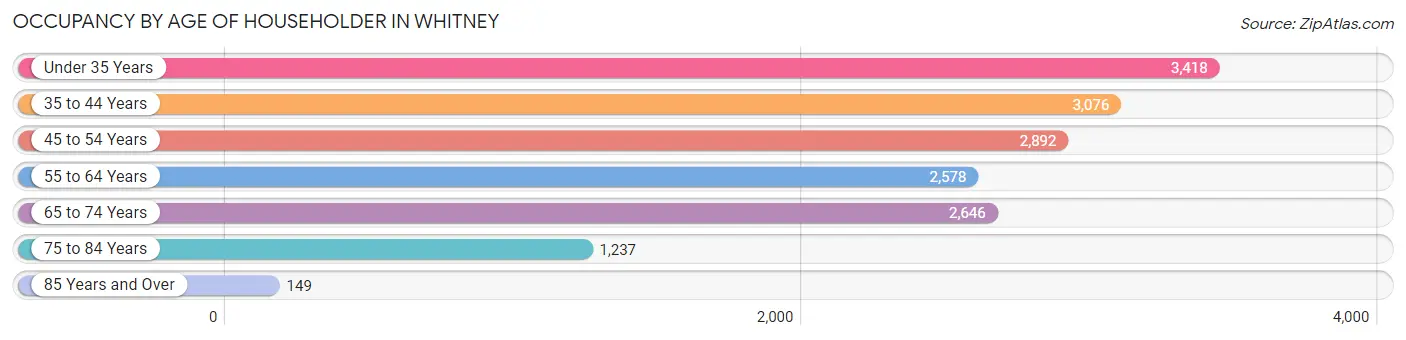
| Age Bracket | # Households | % Households |
| Under 35 Years | 3,418 | 21.4% |
| 35 to 44 Years | 3,076 | 19.2% |
| 45 to 54 Years | 2,892 | 18.1% |
| 55 to 64 Years | 2,578 | 16.1% |
| 65 to 74 Years | 2,646 | 16.5% |
| 75 to 84 Years | 1,237 | 7.7% |
| 85 Years and Over | 149 | 0.9% |
| Total | 15,996 | 100.0% |
Housing Finances in Whitney
Median Income by Occupancy in Whitney
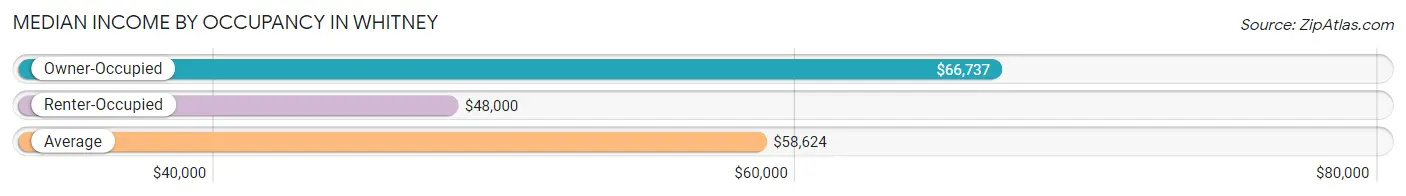
| Occupancy Type | # Households | Median Income |
| Owner-Occupied | 8,956 (56.0%) | $66,737 |
| Renter-Occupied | 7,040 (44.0%) | $48,000 |
| Average | 15,996 (100.0%) | $58,624 |
Occupancy by Householder Income Bracket in Whitney
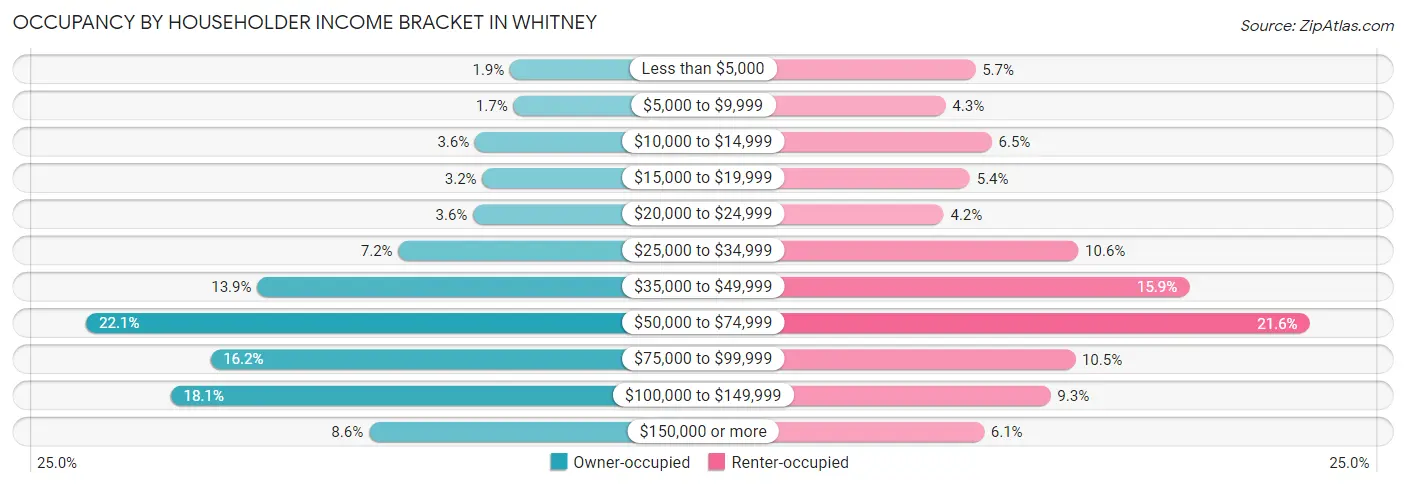
| Income Bracket | Owner-occupied | Renter-occupied |
| Less than $5,000 | 168 (1.9%) | 401 (5.7%) |
| $5,000 to $9,999 | 154 (1.7%) | 301 (4.3%) |
| $10,000 to $14,999 | 318 (3.5%) | 456 (6.5%) |
| $15,000 to $19,999 | 287 (3.2%) | 383 (5.4%) |
| $20,000 to $24,999 | 326 (3.6%) | 295 (4.2%) |
| $25,000 to $34,999 | 645 (7.2%) | 746 (10.6%) |
| $35,000 to $49,999 | 1,247 (13.9%) | 1,118 (15.9%) |
| $50,000 to $74,999 | 1,977 (22.1%) | 1,521 (21.6%) |
| $75,000 to $99,999 | 1,447 (16.2%) | 736 (10.4%) |
| $100,000 to $149,999 | 1,617 (18.0%) | 653 (9.3%) |
| $150,000 or more | 770 (8.6%) | 430 (6.1%) |
| Total | 8,956 (100.0%) | 7,040 (100.0%) |
Monthly Housing Cost Tiers in Whitney
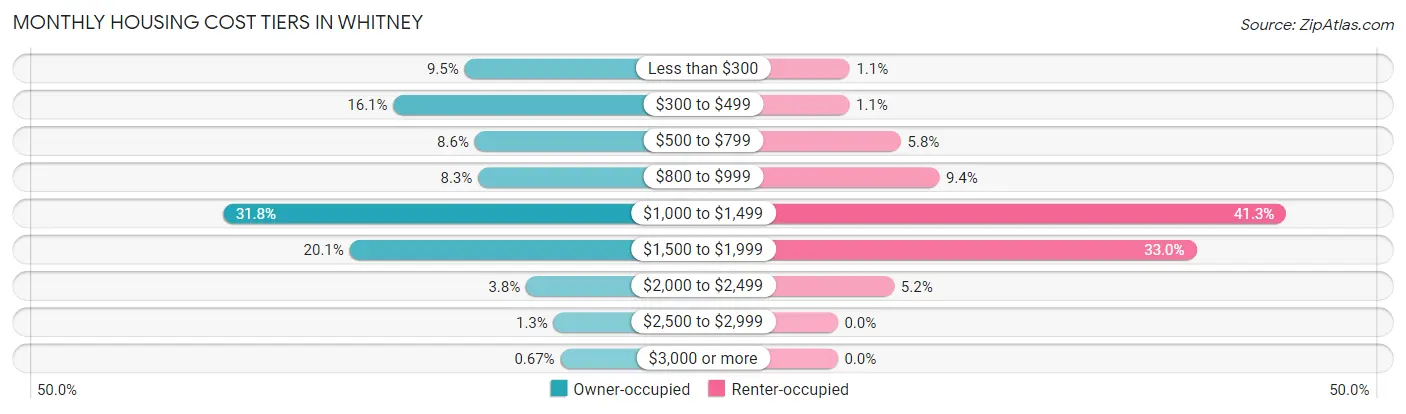
| Monthly Cost | Owner-occupied | Renter-occupied |
| Less than $300 | 851 (9.5%) | 78 (1.1%) |
| $300 to $499 | 1,437 (16.1%) | 75 (1.1%) |
| $500 to $799 | 767 (8.6%) | 410 (5.8%) |
| $800 to $999 | 739 (8.3%) | 658 (9.3%) |
| $1,000 to $1,499 | 2,844 (31.8%) | 2,908 (41.3%) |
| $1,500 to $1,999 | 1,798 (20.1%) | 2,326 (33.0%) |
| $2,000 to $2,499 | 344 (3.8%) | 366 (5.2%) |
| $2,500 to $2,999 | 116 (1.3%) | 0 (0.0%) |
| $3,000 or more | 60 (0.7%) | 0 (0.0%) |
| Total | 8,956 (100.0%) | 7,040 (100.0%) |
Physical Housing Characteristics in Whitney
Housing Structures in Whitney
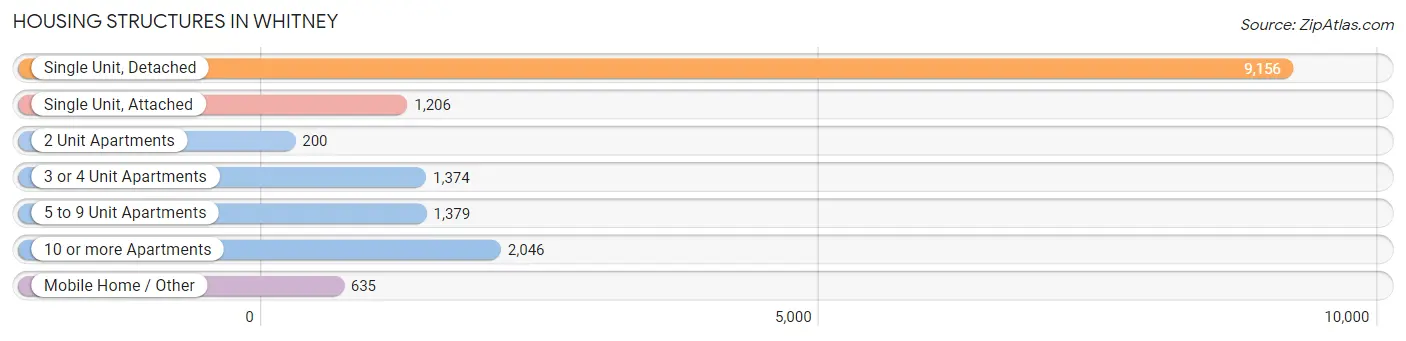
| Structure Type | # Housing Units | % Housing Units |
| Single Unit, Detached | 9,156 | 57.2% |
| Single Unit, Attached | 1,206 | 7.5% |
| 2 Unit Apartments | 200 | 1.3% |
| 3 or 4 Unit Apartments | 1,374 | 8.6% |
| 5 to 9 Unit Apartments | 1,379 | 8.6% |
| 10 or more Apartments | 2,046 | 12.8% |
| Mobile Home / Other | 635 | 4.0% |
| Total | 15,996 | 100.0% |
Housing Structures by Occupancy in Whitney
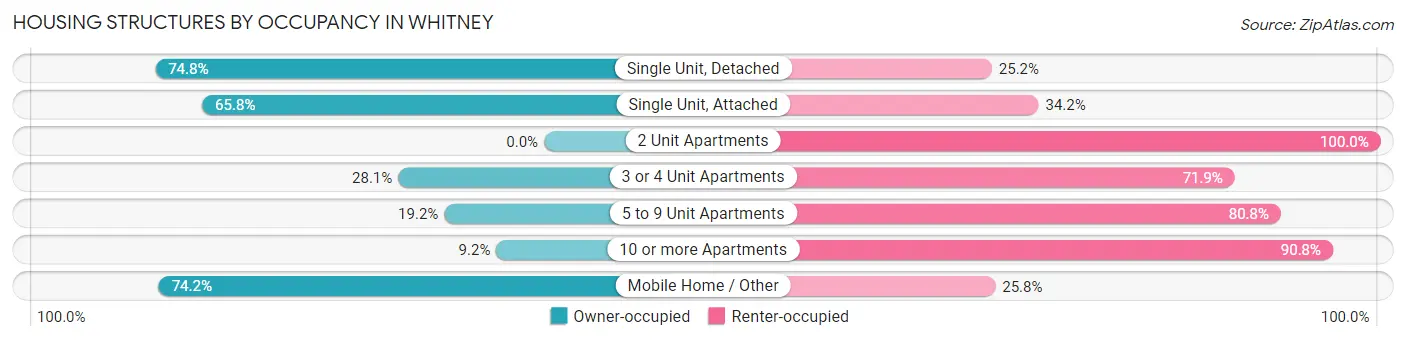
| Structure Type | Owner-occupied | Renter-occupied |
| Single Unit, Detached | 6,852 (74.8%) | 2,304 (25.2%) |
| Single Unit, Attached | 794 (65.8%) | 412 (34.2%) |
| 2 Unit Apartments | 0 (0.0%) | 200 (100.0%) |
| 3 or 4 Unit Apartments | 386 (28.1%) | 988 (71.9%) |
| 5 to 9 Unit Apartments | 265 (19.2%) | 1,114 (80.8%) |
| 10 or more Apartments | 188 (9.2%) | 1,858 (90.8%) |
| Mobile Home / Other | 471 (74.2%) | 164 (25.8%) |
| Total | 8,956 (56.0%) | 7,040 (44.0%) |
Housing Structures by Number of Rooms in Whitney
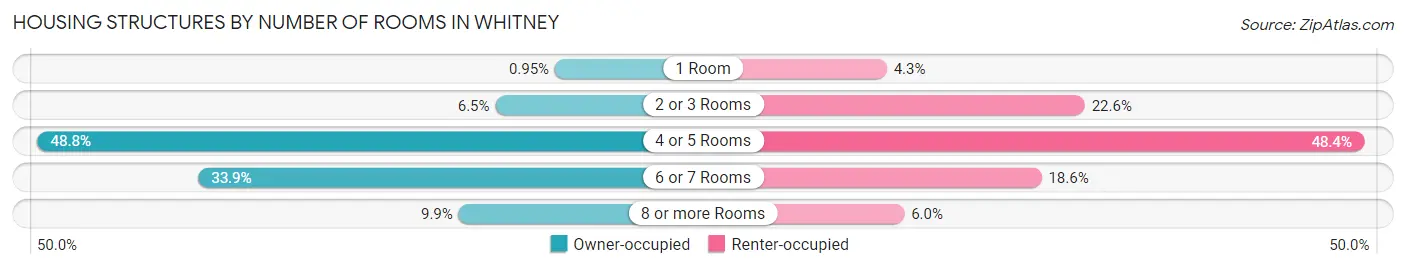
| Number of Rooms | Owner-occupied | Renter-occupied |
| 1 Room | 85 (0.9%) | 305 (4.3%) |
| 2 or 3 Rooms | 579 (6.5%) | 1,594 (22.6%) |
| 4 or 5 Rooms | 4,370 (48.8%) | 3,410 (48.4%) |
| 6 or 7 Rooms | 3,039 (33.9%) | 1,312 (18.6%) |
| 8 or more Rooms | 883 (9.9%) | 419 (5.9%) |
| Total | 8,956 (100.0%) | 7,040 (100.0%) |
Housing Structure by Heating Type in Whitney
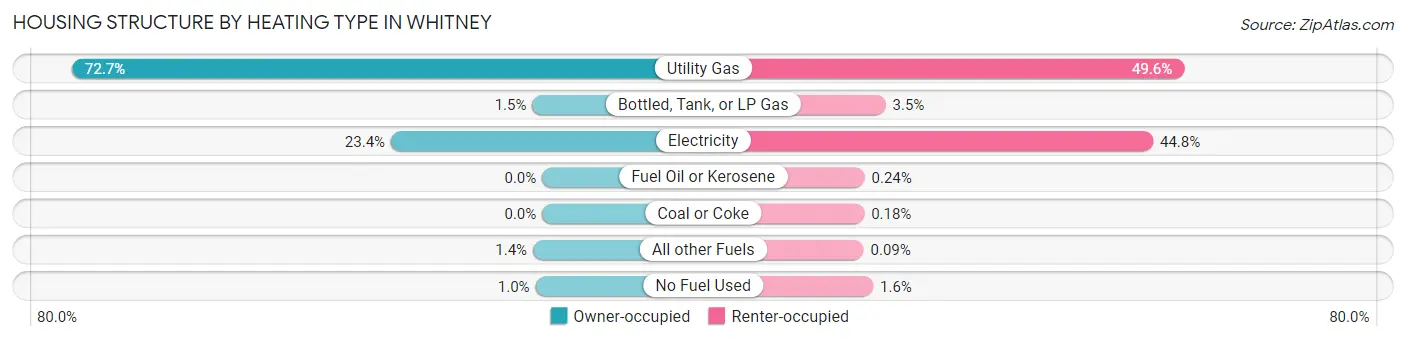
| Heating Type | Owner-occupied | Renter-occupied |
| Utility Gas | 6,509 (72.7%) | 3,493 (49.6%) |
| Bottled, Tank, or LP Gas | 135 (1.5%) | 246 (3.5%) |
| Electricity | 2,093 (23.4%) | 3,156 (44.8%) |
| Fuel Oil or Kerosene | 0 (0.0%) | 17 (0.2%) |
| Coal or Coke | 0 (0.0%) | 13 (0.2%) |
| All other Fuels | 127 (1.4%) | 6 (0.1%) |
| No Fuel Used | 92 (1.0%) | 109 (1.5%) |
| Total | 8,956 (100.0%) | 7,040 (100.0%) |
Household Vehicle Usage in Whitney
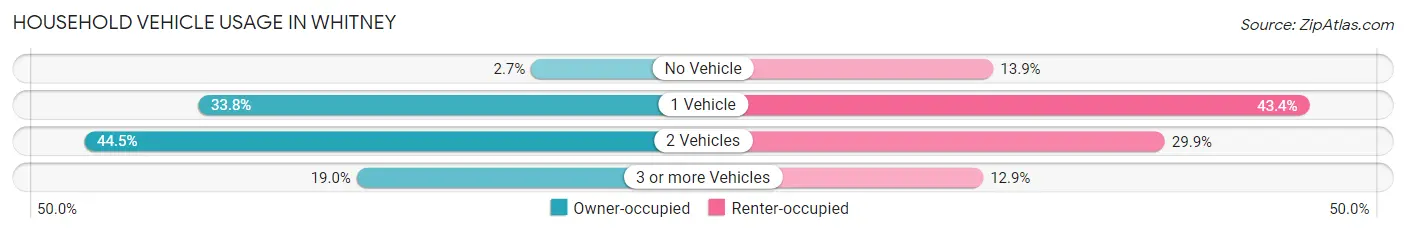
| Vehicles per Household | Owner-occupied | Renter-occupied |
| No Vehicle | 244 (2.7%) | 976 (13.9%) |
| 1 Vehicle | 3,029 (33.8%) | 3,052 (43.3%) |
| 2 Vehicles | 3,981 (44.5%) | 2,103 (29.9%) |
| 3 or more Vehicles | 1,702 (19.0%) | 909 (12.9%) |
| Total | 8,956 (100.0%) | 7,040 (100.0%) |
Real Estate & Mortgages in Whitney
Real Estate and Mortgage Overview in Whitney
| Characteristic | Without Mortgage | With Mortgage |
| Housing Units | 2,922 | 6,034 |
| Median Property Value | $257,500 | $276,400 |
| Median Household Income | $55,605 | $622 |
| Monthly Housing Costs | $362 | $46 |
| Real Estate Taxes | $911 | $549 |
Property Value by Mortgage Status in Whitney
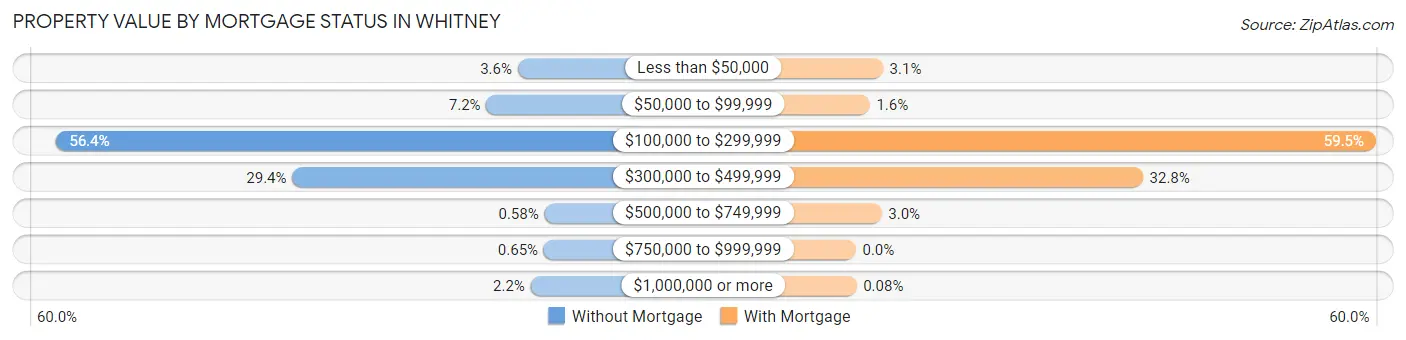
| Property Value | Without Mortgage | With Mortgage |
| Less than $50,000 | 106 (3.6%) | 187 (3.1%) |
| $50,000 to $99,999 | 211 (7.2%) | 96 (1.6%) |
| $100,000 to $299,999 | 1,647 (56.4%) | 3,588 (59.5%) |
| $300,000 to $499,999 | 859 (29.4%) | 1,980 (32.8%) |
| $500,000 to $749,999 | 17 (0.6%) | 178 (2.9%) |
| $750,000 to $999,999 | 19 (0.6%) | 0 (0.0%) |
| $1,000,000 or more | 63 (2.2%) | 5 (0.1%) |
| Total | 2,922 (100.0%) | 6,034 (100.0%) |
Household Income by Mortgage Status in Whitney
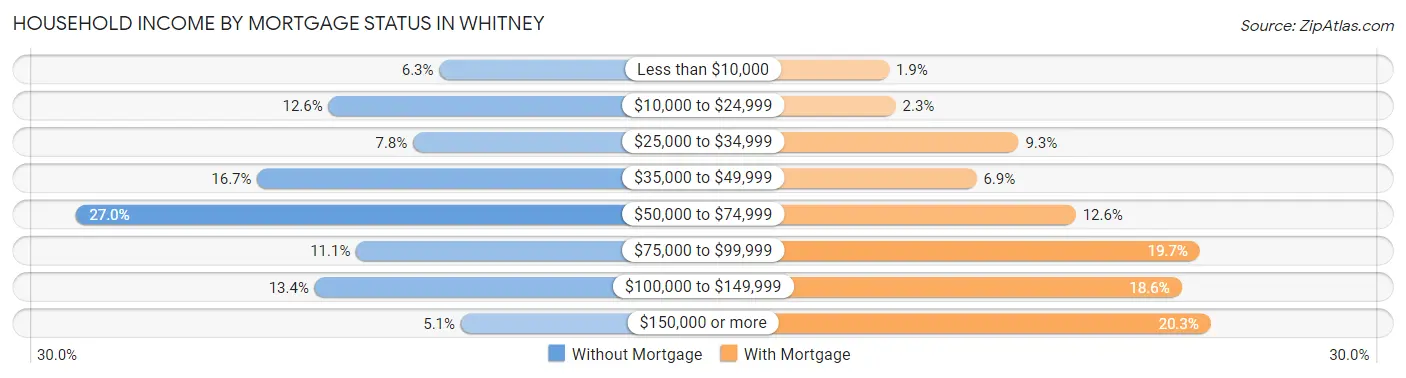
| Household Income | Without Mortgage | With Mortgage |
| Less than $10,000 | 184 (6.3%) | 115 (1.9%) |
| $10,000 to $24,999 | 369 (12.6%) | 138 (2.3%) |
| $25,000 to $34,999 | 228 (7.8%) | 562 (9.3%) |
| $35,000 to $49,999 | 488 (16.7%) | 417 (6.9%) |
| $50,000 to $74,999 | 790 (27.0%) | 759 (12.6%) |
| $75,000 to $99,999 | 323 (11.1%) | 1,187 (19.7%) |
| $100,000 to $149,999 | 392 (13.4%) | 1,124 (18.6%) |
| $150,000 or more | 148 (5.1%) | 1,225 (20.3%) |
| Total | 2,922 (100.0%) | 6,034 (100.0%) |
Property Value to Household Income Ratio in Whitney
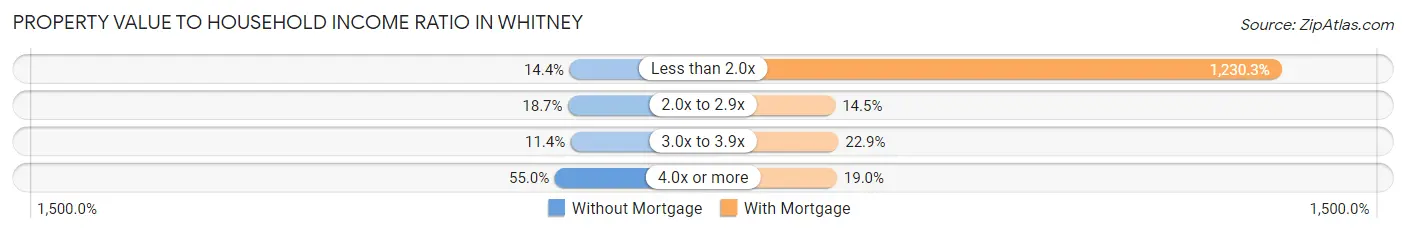
| Value-to-Income Ratio | Without Mortgage | With Mortgage |
| Less than 2.0x | 421 (14.4%) | 74,238 (1,230.3%) |
| 2.0x to 2.9x | 546 (18.7%) | 875 (14.5%) |
| 3.0x to 3.9x | 333 (11.4%) | 1,381 (22.9%) |
| 4.0x or more | 1,607 (55.0%) | 1,144 (19.0%) |
| Total | 2,922 (100.0%) | 6,034 (100.0%) |
Real Estate Taxes by Mortgage Status in Whitney
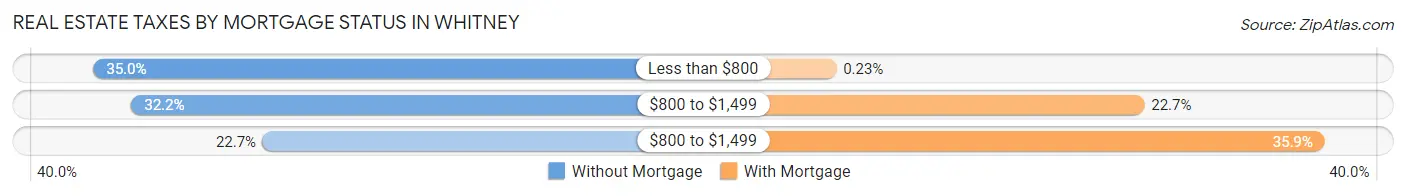
| Property Taxes | Without Mortgage | With Mortgage |
| Less than $800 | 1,022 (35.0%) | 14 (0.2%) |
| $800 to $1,499 | 941 (32.2%) | 1,372 (22.7%) |
| $800 to $1,499 | 662 (22.7%) | 2,168 (35.9%) |
| Total | 2,922 (100.0%) | 6,034 (100.0%) |
Health & Disability in Whitney
Health Insurance Coverage by Age in Whitney
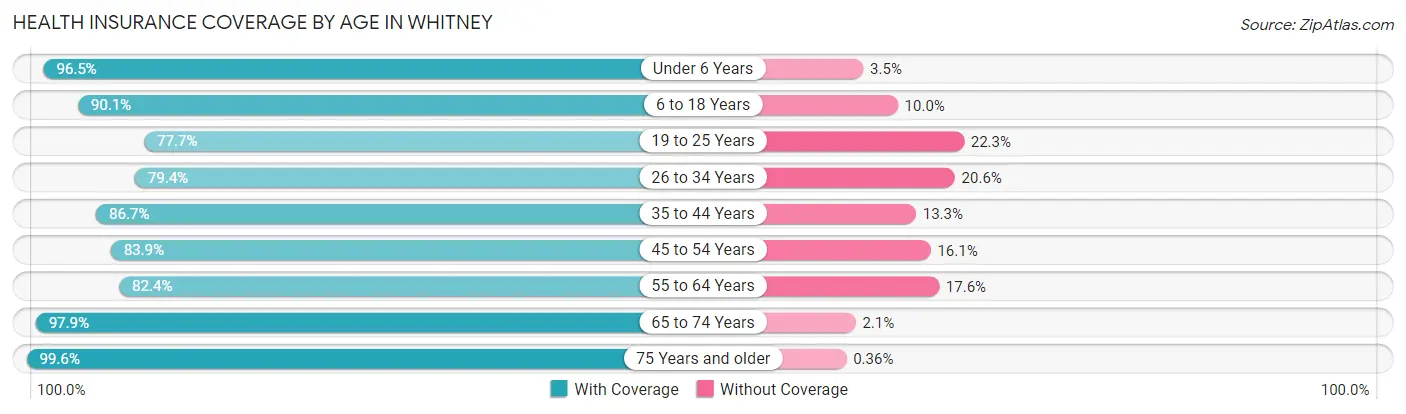
| Age Bracket | With Coverage | Without Coverage |
| Under 6 Years | 3,074 (96.5%) | 112 (3.5%) |
| 6 to 18 Years | 7,112 (90.0%) | 786 (10.0%) |
| 19 to 25 Years | 3,336 (77.7%) | 957 (22.3%) |
| 26 to 34 Years | 5,328 (79.4%) | 1,381 (20.6%) |
| 35 to 44 Years | 5,333 (86.7%) | 821 (13.3%) |
| 45 to 54 Years | 4,403 (83.9%) | 843 (16.1%) |
| 55 to 64 Years | 3,740 (82.4%) | 801 (17.6%) |
| 65 to 74 Years | 4,288 (97.9%) | 91 (2.1%) |
| 75 Years and older | 2,218 (99.6%) | 8 (0.4%) |
| Total | 38,832 (87.0%) | 5,800 (13.0%) |
Health Insurance Coverage by Citizenship Status in Whitney
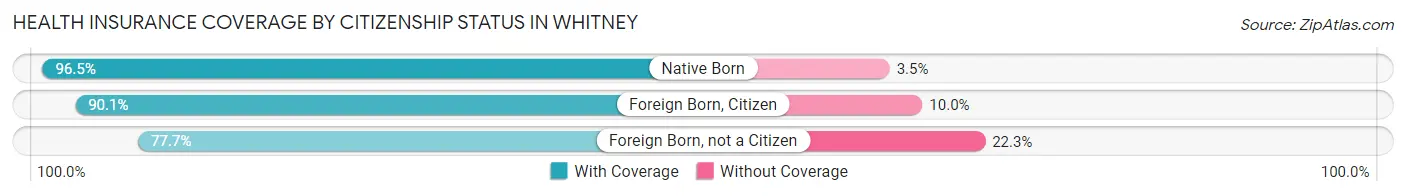
| Citizenship Status | With Coverage | Without Coverage |
| Native Born | 3,074 (96.5%) | 112 (3.5%) |
| Foreign Born, Citizen | 7,112 (90.0%) | 786 (10.0%) |
| Foreign Born, not a Citizen | 3,336 (77.7%) | 957 (22.3%) |
Health Insurance Coverage by Household Income in Whitney
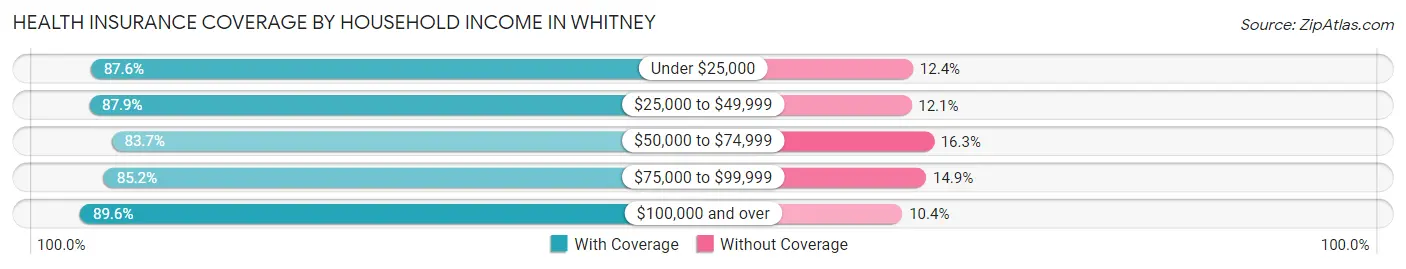
| Household Income | With Coverage | Without Coverage |
| Under $25,000 | 4,888 (87.6%) | 691 (12.4%) |
| $25,000 to $49,999 | 7,890 (87.9%) | 1,085 (12.1%) |
| $50,000 to $74,999 | 8,381 (83.7%) | 1,631 (16.3%) |
| $75,000 to $99,999 | 5,895 (85.2%) | 1,028 (14.8%) |
| $100,000 and over | 11,778 (89.6%) | 1,365 (10.4%) |
Public vs Private Health Insurance Coverage by Age in Whitney
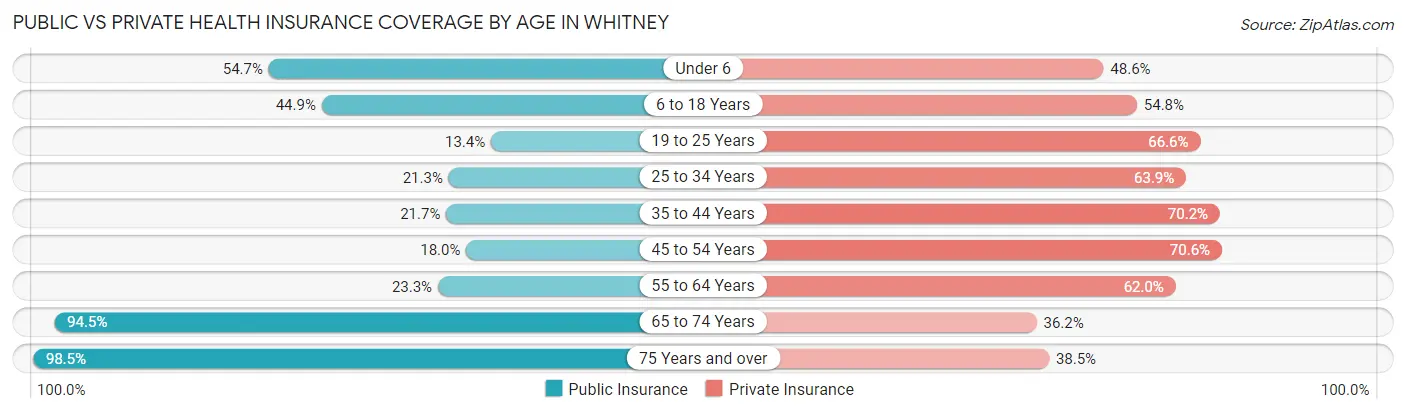
| Age Bracket | Public Insurance | Private Insurance |
| Under 6 | 1,742 (54.7%) | 1,547 (48.6%) |
| 6 to 18 Years | 3,542 (44.9%) | 4,326 (54.8%) |
| 19 to 25 Years | 576 (13.4%) | 2,857 (66.5%) |
| 25 to 34 Years | 1,427 (21.3%) | 4,287 (63.9%) |
| 35 to 44 Years | 1,338 (21.7%) | 4,319 (70.2%) |
| 45 to 54 Years | 945 (18.0%) | 3,701 (70.6%) |
| 55 to 64 Years | 1,057 (23.3%) | 2,814 (62.0%) |
| 65 to 74 Years | 4,139 (94.5%) | 1,583 (36.1%) |
| 75 Years and over | 2,192 (98.5%) | 856 (38.5%) |
| Total | 16,958 (38.0%) | 26,290 (58.9%) |
Disability Status by Sex by Age in Whitney
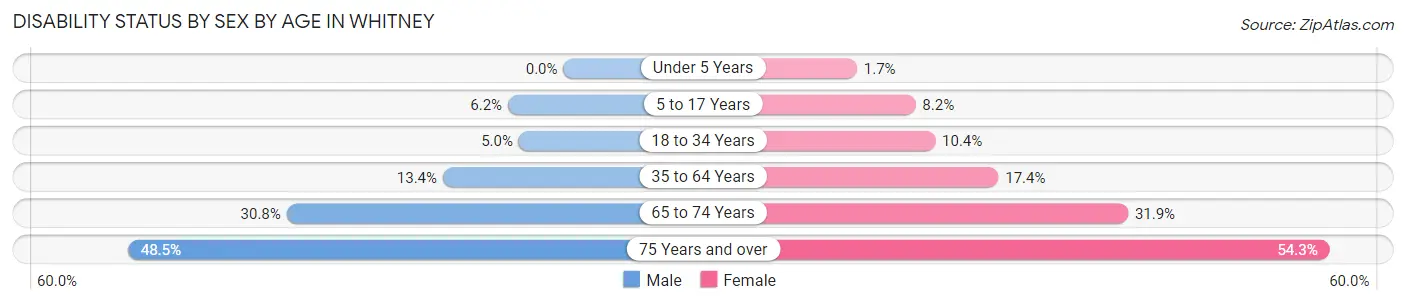
| Age Bracket | Male | Female |
| Under 5 Years | 0 (0.0%) | 25 (1.7%) |
| 5 to 17 Years | 259 (6.2%) | 310 (8.2%) |
| 18 to 34 Years | 306 (5.0%) | 553 (10.4%) |
| 35 to 64 Years | 1,027 (13.4%) | 1,444 (17.4%) |
| 65 to 74 Years | 606 (30.8%) | 769 (31.9%) |
| 75 Years and over | 517 (48.5%) | 630 (54.3%) |
Disability Class by Sex by Age in Whitney
Disability Class: Hearing Difficulty
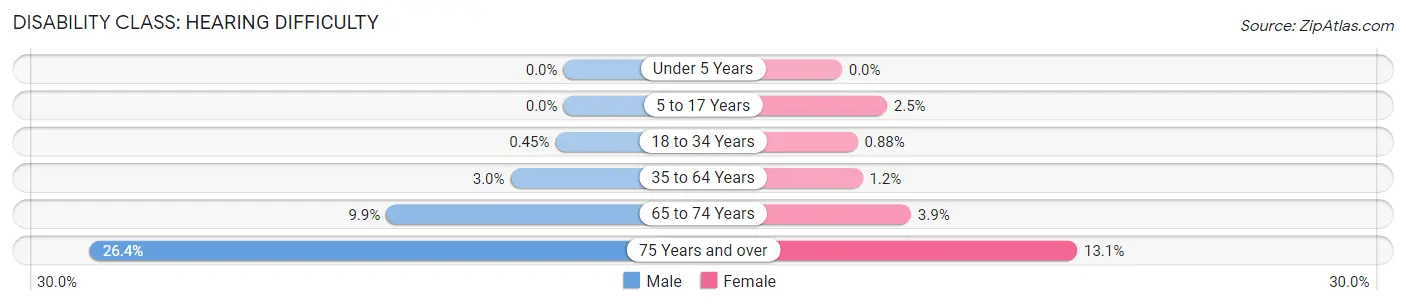
| Age Bracket | Male | Female |
| Under 5 Years | 0 (0.0%) | 0 (0.0%) |
| 5 to 17 Years | 0 (0.0%) | 95 (2.5%) |
| 18 to 34 Years | 28 (0.4%) | 47 (0.9%) |
| 35 to 64 Years | 226 (2.9%) | 95 (1.1%) |
| 65 to 74 Years | 194 (9.9%) | 93 (3.8%) |
| 75 Years and over | 281 (26.4%) | 152 (13.1%) |
Disability Class: Vision Difficulty
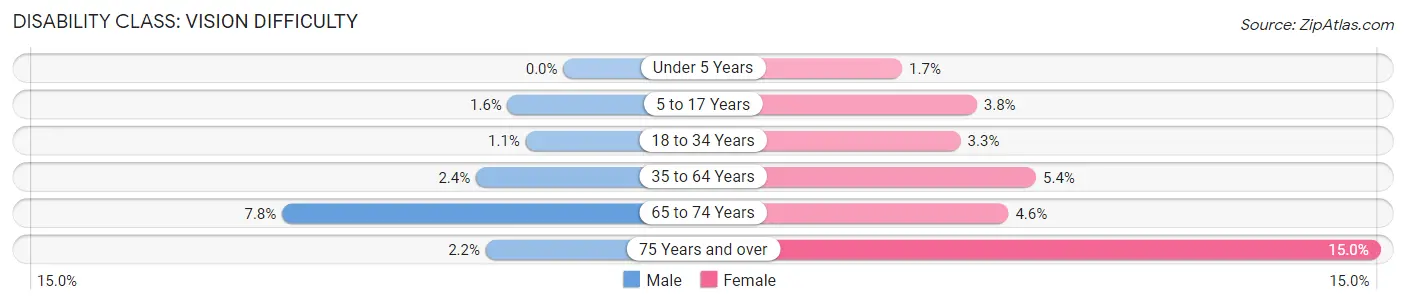
| Age Bracket | Male | Female |
| Under 5 Years | 0 (0.0%) | 25 (1.7%) |
| 5 to 17 Years | 65 (1.5%) | 142 (3.8%) |
| 18 to 34 Years | 65 (1.1%) | 176 (3.3%) |
| 35 to 64 Years | 186 (2.4%) | 448 (5.4%) |
| 65 to 74 Years | 154 (7.8%) | 112 (4.6%) |
| 75 Years and over | 23 (2.2%) | 174 (15.0%) |
Disability Class: Cognitive Difficulty
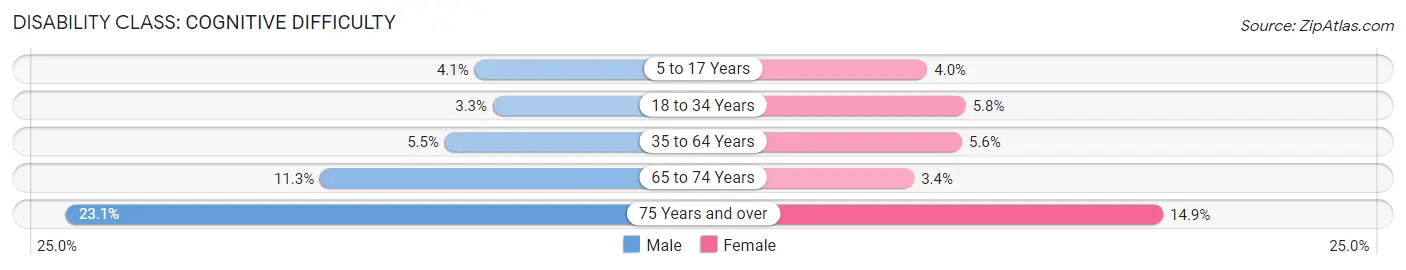
| Age Bracket | Male | Female |
| 5 to 17 Years | 173 (4.1%) | 150 (4.0%) |
| 18 to 34 Years | 202 (3.3%) | 306 (5.8%) |
| 35 to 64 Years | 421 (5.5%) | 462 (5.6%) |
| 65 to 74 Years | 222 (11.3%) | 81 (3.4%) |
| 75 Years and over | 246 (23.1%) | 173 (14.9%) |
Disability Class: Ambulatory Difficulty
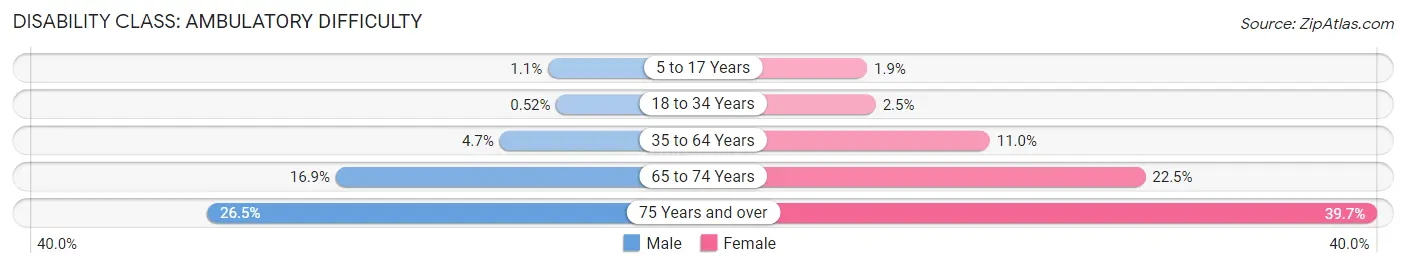
| Age Bracket | Male | Female |
| 5 to 17 Years | 48 (1.1%) | 71 (1.9%) |
| 18 to 34 Years | 32 (0.5%) | 134 (2.5%) |
| 35 to 64 Years | 363 (4.7%) | 911 (11.0%) |
| 65 to 74 Years | 332 (16.9%) | 544 (22.5%) |
| 75 Years and over | 282 (26.5%) | 461 (39.7%) |
Disability Class: Self-Care Difficulty
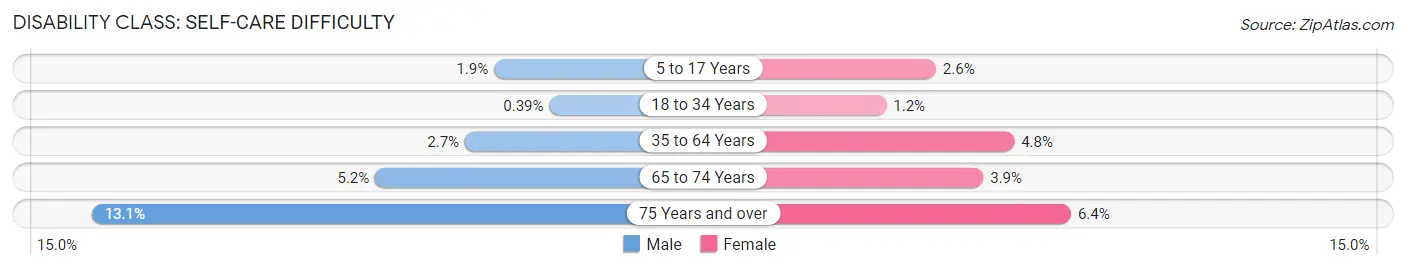
| Age Bracket | Male | Female |
| 5 to 17 Years | 81 (1.9%) | 99 (2.6%) |
| 18 to 34 Years | 24 (0.4%) | 66 (1.2%) |
| 35 to 64 Years | 210 (2.7%) | 398 (4.8%) |
| 65 to 74 Years | 103 (5.2%) | 95 (3.9%) |
| 75 Years and over | 140 (13.1%) | 74 (6.4%) |
Technology Access in Whitney
Computing Device Access in Whitney
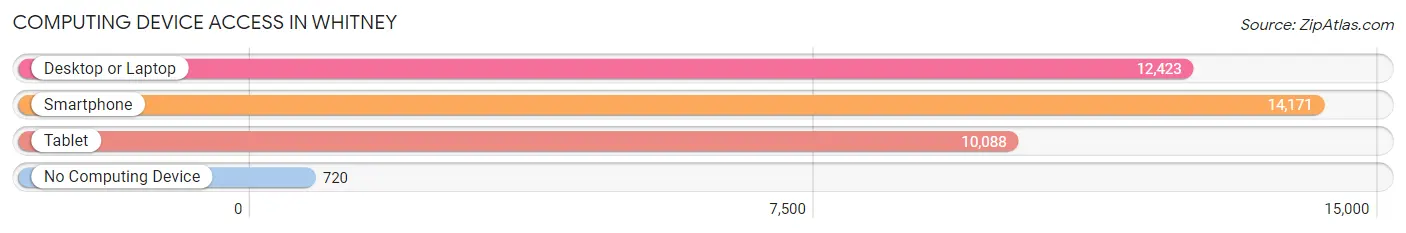
| Device Type | # Households | % Households |
| Desktop or Laptop | 12,423 | 77.7% |
| Smartphone | 14,171 | 88.6% |
| Tablet | 10,088 | 63.1% |
| No Computing Device | 720 | 4.5% |
| Total | 15,996 | 100.0% |
Internet Access in Whitney
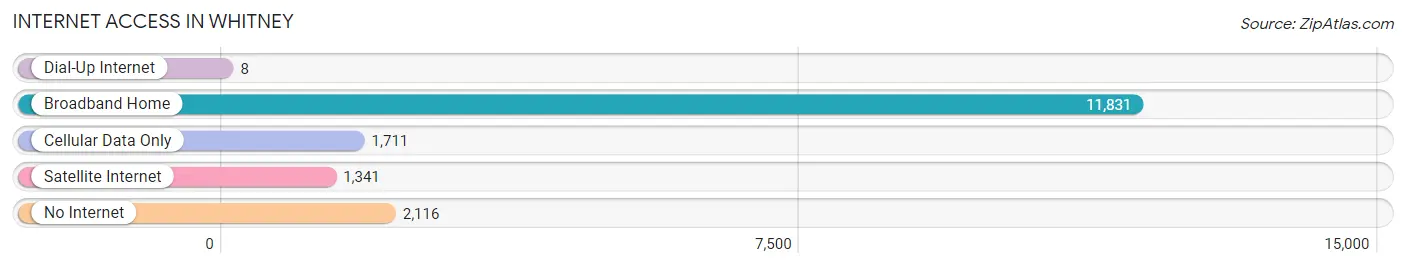
| Internet Type | # Households | % Households |
| Dial-Up Internet | 8 | 0.1% |
| Broadband Home | 11,831 | 74.0% |
| Cellular Data Only | 1,711 | 10.7% |
| Satellite Internet | 1,341 | 8.4% |
| No Internet | 2,116 | 13.2% |
| Total | 15,996 | 100.0% |
Whitney Summary
Whitney is a small unincorporated town located in Clark County, Nevada. It is situated in the southeastern corner of the state, approximately 25 miles south of Las Vegas. The town is home to a population of approximately 1,000 people, and is known for its rural atmosphere and small-town charm.
History
Whitney was founded in the late 19th century by a group of Mormon settlers. The town was named after a local rancher, William Whitney, who owned a large ranch in the area. The town was originally a farming community, and the local economy was largely based on agriculture. In the early 20th century, the town began to grow as more people moved to the area. The town was incorporated in 1951, and the population continued to grow throughout the 1950s and 1960s.
Geography
Whitney is located in the southeastern corner of Nevada, approximately 25 miles south of Las Vegas. The town is situated in a desert valley, surrounded by mountains on all sides. The town is located at an elevation of approximately 3,000 feet, and the climate is generally dry and hot. The town is located in the Mojave Desert, and the surrounding area is mostly barren and sparsely populated.
Economy
The economy of Whitney is largely based on tourism and agriculture. The town is home to several small businesses, including restaurants, shops, and other services. The town is also home to a number of small farms, which produce a variety of crops, including alfalfa, hay, and vegetables. The town is also home to a number of casinos, which attract visitors from all over the state.
Demographics
As of the 2010 census, the population of Whitney was 1,000. The town is predominantly white, with approximately 75% of the population identifying as Caucasian. The remaining 25% of the population is made up of African Americans, Hispanics, and other ethnicities. The median household income in Whitney is approximately $45,000, and the median age is 37.
Whitney is a small town with a unique history and culture. The town is home to a diverse population, and the local economy is largely based on tourism and agriculture. The town is a great place to visit, and offers a unique experience for visitors.
Common Questions
What is Per Capita Income in Whitney?
Per Capita income in Whitney is $26,741.
What is the Median Family Income in Whitney?
Median Family Income in Whitney is $67,121.
What is the Median Household income in Whitney?
Median Household Income in Whitney is $58,624.
What is Income or Wage Gap in Whitney?
Income or Wage Gap in Whitney is 11.1%.
Women in Whitney earn 88.9 cents for every dollar earned by a man.
What is Family Income Deficit in Whitney?
Family Income Deficit in Whitney is $9,888.
Families that are below poverty line in Whitney earn $9,888 less on average than the poverty threshold level.
What is Inequality or Gini Index in Whitney?
Inequality or Gini Index in Whitney is 0.42.
What is the Total Population of Whitney?
Total Population of Whitney is 44,720.
What is the Total Male Population of Whitney?
Total Male Population of Whitney is 22,254.
What is the Total Female Population of Whitney?
Total Female Population of Whitney is 22,466.
What is the Ratio of Males per 100 Females in Whitney?
There are 99.06 Males per 100 Females in Whitney.
What is the Ratio of Females per 100 Males in Whitney?
There are 100.95 Females per 100 Males in Whitney.
What is the Median Population Age in Whitney?
Median Population Age in Whitney is 35.3 Years.
What is the Average Family Size in Whitney
Average Family Size in Whitney is 3.5 People.
What is the Average Household Size in Whitney
Average Household Size in Whitney is 2.8 People.
How Large is the Labor Force in Whitney?
There are 22,989 People in the Labor Forcein in Whitney.
What is the Percentage of People in the Labor Force in Whitney?
65.4% of People are in the Labor Force in Whitney.
What is the Unemployment Rate in Whitney?
Unemployment Rate in Whitney is 7.8%.