Johnson Lane, NV Map & Demographics
Johnson Lane Map
Johnson Lane Overview
$50,850
PER CAPITA INCOME
$118,084
AVG FAMILY INCOME
$102,477
AVG HOUSEHOLD INCOME
30.1%
WAGE / INCOME GAP [ % ]
69.9¢/ $1
WAGE / INCOME GAP [ $ ]
0.40
INEQUALITY / GINI INDEX
6,499
TOTAL POPULATION
3,179
MALE POPULATION
3,320
FEMALE POPULATION
95.75
MALES / 100 FEMALES
104.44
FEMALES / 100 MALES
57.9
MEDIAN AGE
2.7
AVG FAMILY SIZE
2.5
AVG HOUSEHOLD SIZE
2,599
LABOR FORCE [ PEOPLE ]
44.2%
PERCENT IN LABOR FORCE
Income in Johnson Lane
Income Overview in Johnson Lane
Per Capita Income in Johnson Lane is $50,850, while median incomes of families and households are $118,084 and $102,477 respectively.
| Characteristic | Number | Measure |
| Per Capita Income | 6,499 | $50,850 |
| Median Family Income | 2,141 | $118,084 |
| Mean Family Income | 2,141 | $135,544 |
| Median Household Income | 2,652 | $102,477 |
| Mean Household Income | 2,652 | $123,741 |
| Income Deficit | 2,141 | $0 |
| Wage / Income Gap (%) | 6,499 | 30.06% |
| Wage / Income Gap ($) | 6,499 | 69.94¢ per $1 |
| Gini / Inequality Index | 6,499 | 0.40 |
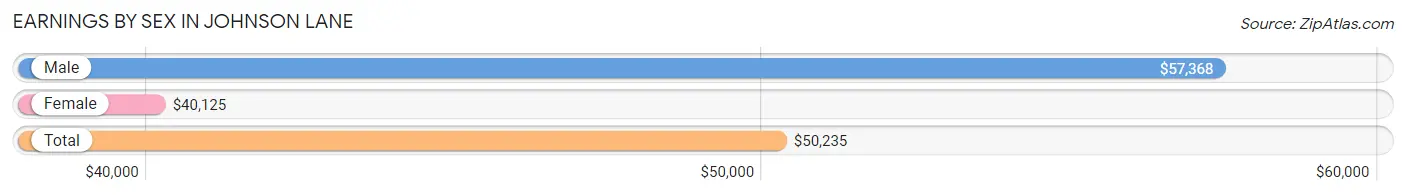
Earnings by Sex in Johnson Lane
Average Earnings in Johnson Lane are $50,235, $57,368 for men and $40,125 for women, a difference of 30.1%.
| Sex | Number | Average Earnings |
| Male | 1,595 (54.6%) | $57,368 |
| Female | 1,324 (45.4%) | $40,125 |
| Total | 2,919 (100.0%) | $50,235 |
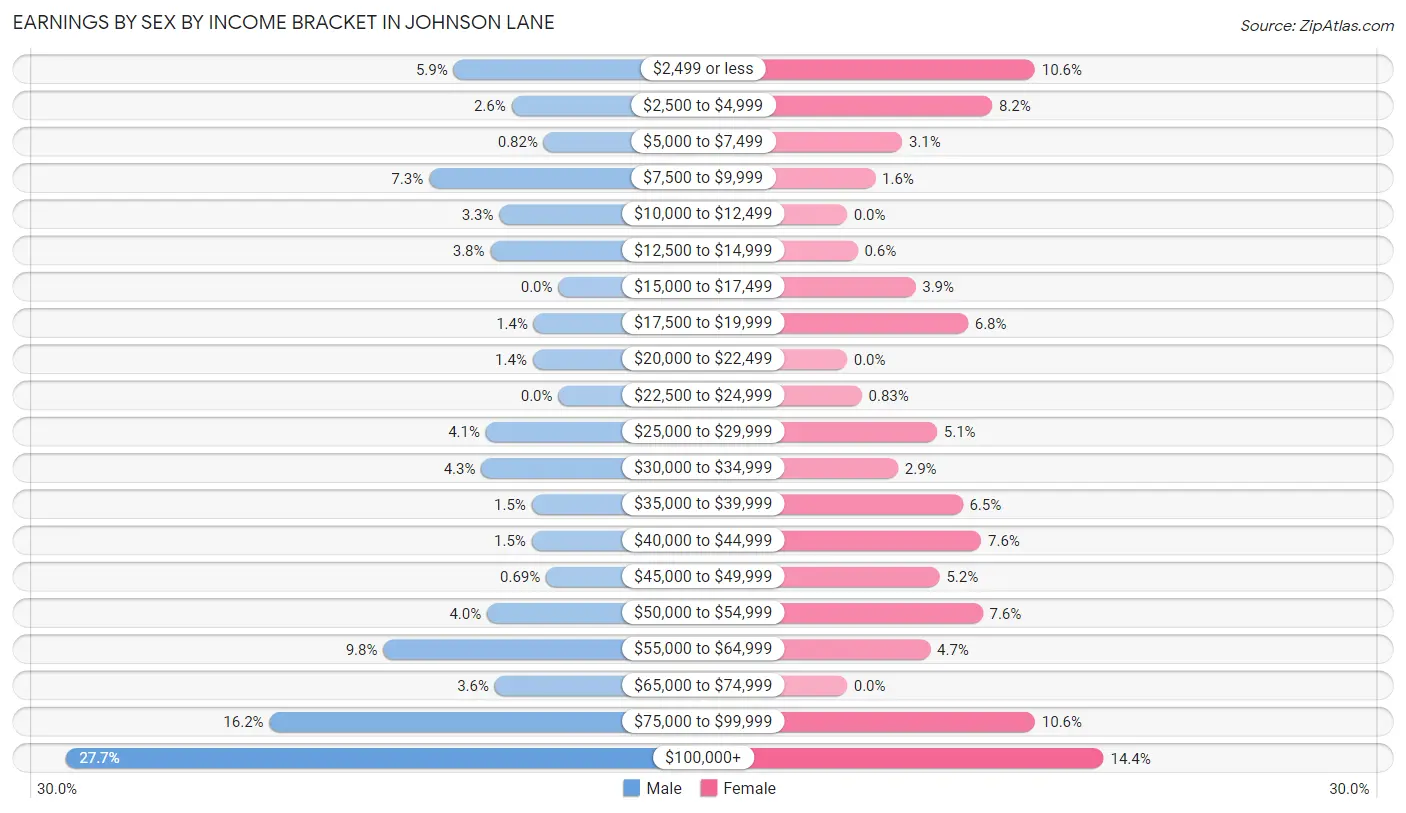
Earnings by Sex by Income Bracket in Johnson Lane
The most common earnings brackets in Johnson Lane are $100,000+ for men (441 | 27.7%) and $100,000+ for women (191 | 14.4%).
| Income | Male | Female |
| $2,499 or less | 94 (5.9%) | 140 (10.6%) |
| $2,500 to $4,999 | 42 (2.6%) | 108 (8.2%) |
| $5,000 to $7,499 | 13 (0.8%) | 41 (3.1%) |
| $7,500 to $9,999 | 116 (7.3%) | 21 (1.6%) |
| $10,000 to $12,499 | 53 (3.3%) | 0 (0.0%) |
| $12,500 to $14,999 | 61 (3.8%) | 8 (0.6%) |
| $15,000 to $17,499 | 0 (0.0%) | 51 (3.8%) |
| $17,500 to $19,999 | 22 (1.4%) | 90 (6.8%) |
| $20,000 to $22,499 | 23 (1.4%) | 0 (0.0%) |
| $22,500 to $24,999 | 0 (0.0%) | 11 (0.8%) |
| $25,000 to $29,999 | 65 (4.1%) | 67 (5.1%) |
| $30,000 to $34,999 | 69 (4.3%) | 38 (2.9%) |
| $35,000 to $39,999 | 24 (1.5%) | 86 (6.5%) |
| $40,000 to $44,999 | 24 (1.5%) | 100 (7.5%) |
| $45,000 to $49,999 | 11 (0.7%) | 69 (5.2%) |
| $50,000 to $54,999 | 64 (4.0%) | 101 (7.6%) |
| $55,000 to $64,999 | 157 (9.8%) | 62 (4.7%) |
| $65,000 to $74,999 | 57 (3.6%) | 0 (0.0%) |
| $75,000 to $99,999 | 259 (16.2%) | 140 (10.6%) |
| $100,000+ | 441 (27.7%) | 191 (14.4%) |
| Total | 1,595 (100.0%) | 1,324 (100.0%) |
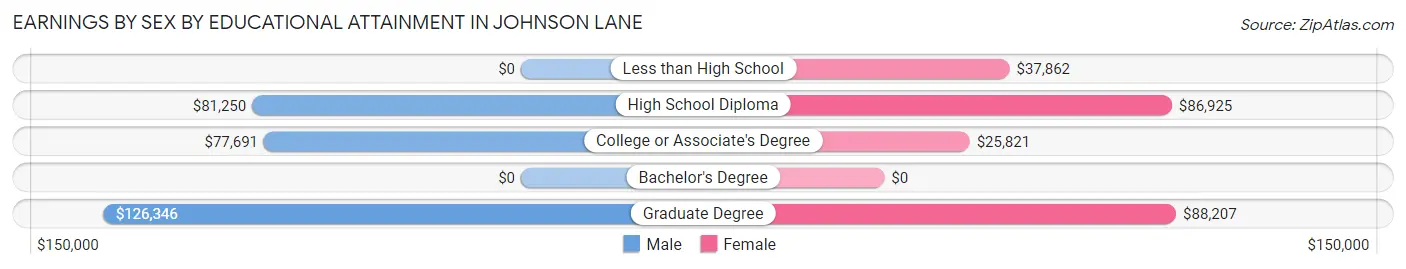
Earnings by Sex by Educational Attainment in Johnson Lane
Average earnings in Johnson Lane are $80,568 for men and $43,703 for women, a difference of 45.8%. Men with an educational attainment of graduate degree enjoy the highest average annual earnings of $126,346, while those with college or associate's degree education earn the least with $77,691. Women with an educational attainment of graduate degree earn the most with the average annual earnings of $88,207, while those with college or associate's degree education have the smallest earnings of $25,821.
| Educational Attainment | Male Income | Female Income |
| Less than High School | - | - |
| High School Diploma | $81,250 | $86,925 |
| College or Associate's Degree | $77,691 | $25,821 |
| Bachelor's Degree | - | - |
| Graduate Degree | $126,346 | $88,207 |
| Total | $80,568 | $43,703 |
Family Income in Johnson Lane
Family Income Brackets in Johnson Lane
According to the Johnson Lane family income data, there are 647 families falling into the $100,000 to $149,999 income range, which is the most common income bracket and makes up 30.2% of all families. Conversely, the less than $10,000 income bracket is the least frequent group with only 26 families (1.2%) belonging to this category.
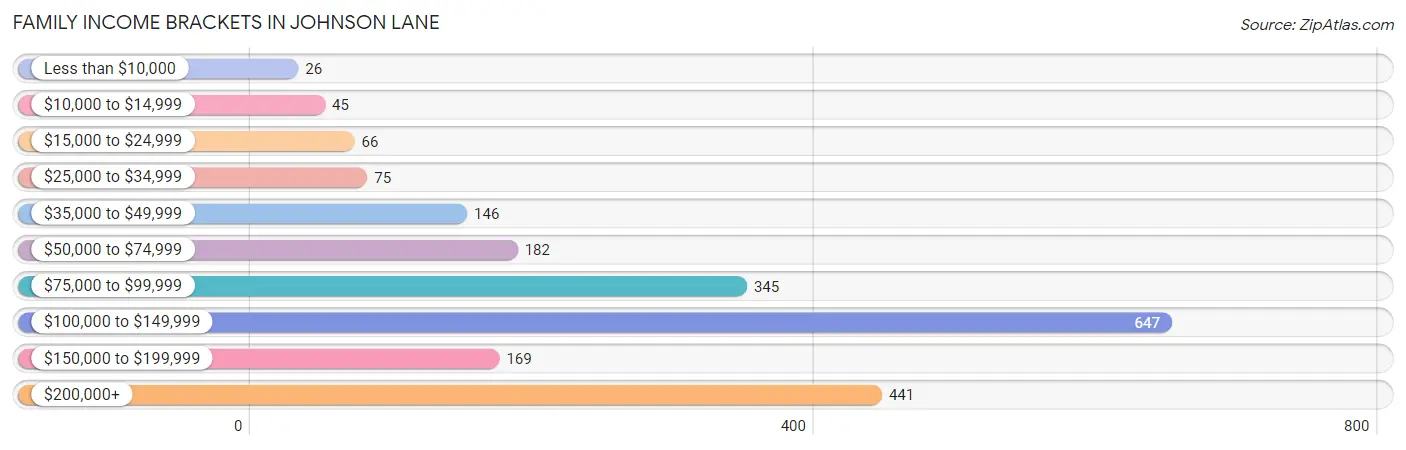
| Income Bracket | # Families | % Families |
| Less than $10,000 | 26 | 1.2% |
| $10,000 to $14,999 | 45 | 2.1% |
| $15,000 to $24,999 | 66 | 3.1% |
| $25,000 to $34,999 | 75 | 3.5% |
| $35,000 to $49,999 | 146 | 6.8% |
| $50,000 to $74,999 | 182 | 8.5% |
| $75,000 to $99,999 | 345 | 16.1% |
| $100,000 to $149,999 | 647 | 30.2% |
| $150,000 to $199,999 | 169 | 7.9% |
| $200,000+ | 441 | 20.6% |
Family Income by Famaliy Size in Johnson Lane
3-person families (271 | 12.7%) account for the highest median family income in Johnson Lane with $210,777 per family, while 3-person families (271 | 12.7%) have the highest median income of $70,259 per family member.
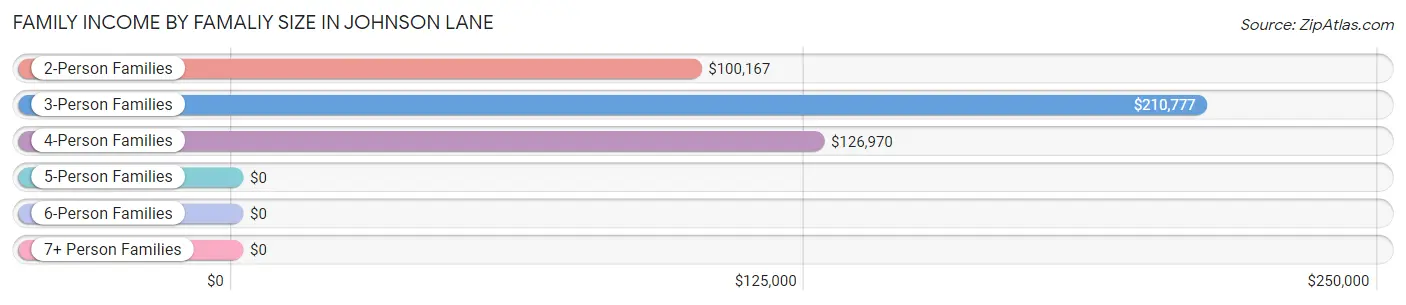
| Income Bracket | # Families | Median Income |
| 2-Person Families | 1,588 (74.2%) | $100,167 |
| 3-Person Families | 271 (12.7%) | $210,777 |
| 4-Person Families | 150 (7.0%) | $126,970 |
| 5-Person Families | 55 (2.6%) | $0 |
| 6-Person Families | 26 (1.2%) | $0 |
| 7+ Person Families | 51 (2.4%) | $0 |
| Total | 2,141 (100.0%) | $118,084 |
Family Income by Number of Earners in Johnson Lane
The median family income in Johnson Lane is $118,084, with families comprising 3+ earners (168) having the highest median family income of $217,955, while families with 1 earner (643) have the lowest median family income of $90,795, accounting for 7.9% and 30.0% of families, respectively.
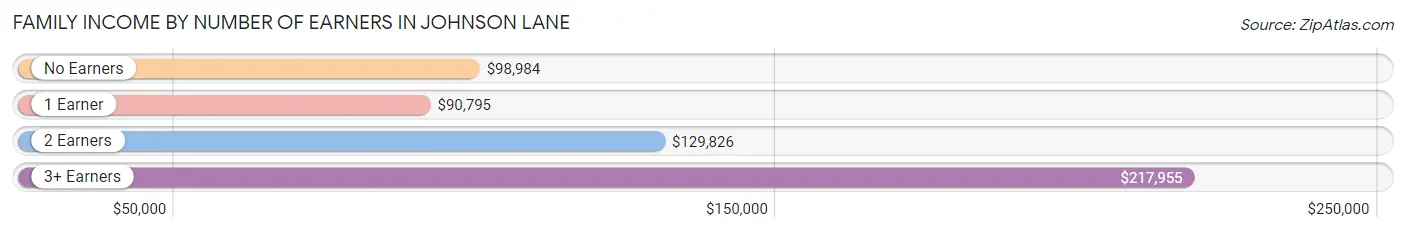
| Number of Earners | # Families | Median Income |
| No Earners | 762 (35.6%) | $98,984 |
| 1 Earner | 643 (30.0%) | $90,795 |
| 2 Earners | 568 (26.5%) | $129,826 |
| 3+ Earners | 168 (7.9%) | $217,955 |
| Total | 2,141 (100.0%) | $118,084 |
Household Income in Johnson Lane
Household Income Brackets in Johnson Lane
With 769 households falling in the category, the $100,000 to $149,999 income range is the most frequent in Johnson Lane, accounting for 29.0% of all households. In contrast, only 40 households (1.5%) fall into the less than $10,000 income bracket, making it the least populous group.
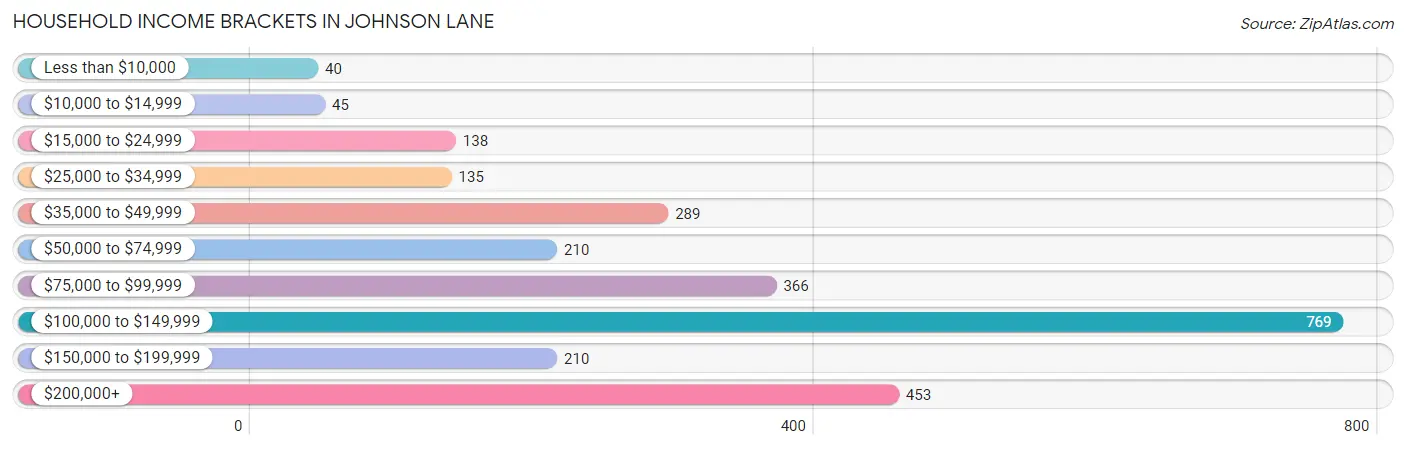
| Income Bracket | # Households | % Households |
| Less than $10,000 | 40 | 1.5% |
| $10,000 to $14,999 | 45 | 1.7% |
| $15,000 to $24,999 | 138 | 5.2% |
| $25,000 to $34,999 | 135 | 5.1% |
| $35,000 to $49,999 | 289 | 10.9% |
| $50,000 to $74,999 | 210 | 7.9% |
| $75,000 to $99,999 | 366 | 13.8% |
| $100,000 to $149,999 | 769 | 29.0% |
| $150,000 to $199,999 | 210 | 7.9% |
| $200,000+ | 453 | 17.1% |
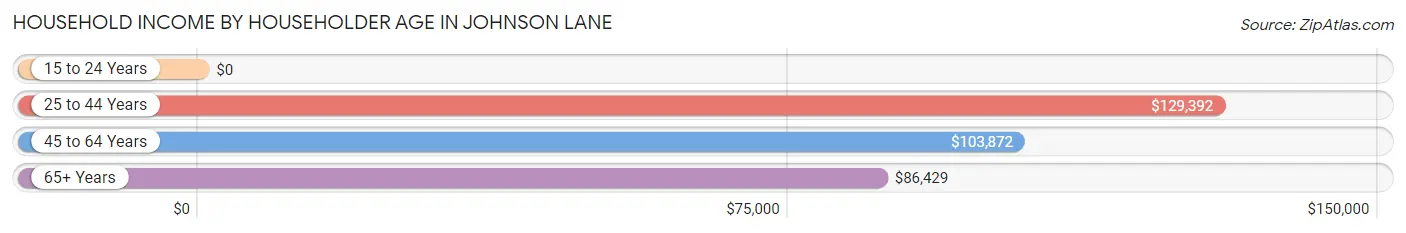
Household Income by Householder Age in Johnson Lane
The median household income in Johnson Lane is $102,477, with the highest median household income of $129,392 found in the 25 to 44 years age bracket for the primary householder. A total of 443 households (16.7%) fall into this category.
| Income Bracket | # Households | Median Income |
| 15 to 24 Years | 0 (0.0%) | $0 |
| 25 to 44 Years | 443 (16.7%) | $129,392 |
| 45 to 64 Years | 941 (35.5%) | $103,872 |
| 65+ Years | 1,268 (47.8%) | $86,429 |
| Total | 2,652 (100.0%) | $102,477 |
Poverty in Johnson Lane
Income Below Poverty by Sex and Age in Johnson Lane
With 3.9% poverty level for males and 3.5% for females among the residents of Johnson Lane, 55 to 64 year old males and 25 to 34 year old females are the most vulnerable to poverty, with 59 males (11.3%) and 20 females (10.9%) in their respective age groups living below the poverty level.
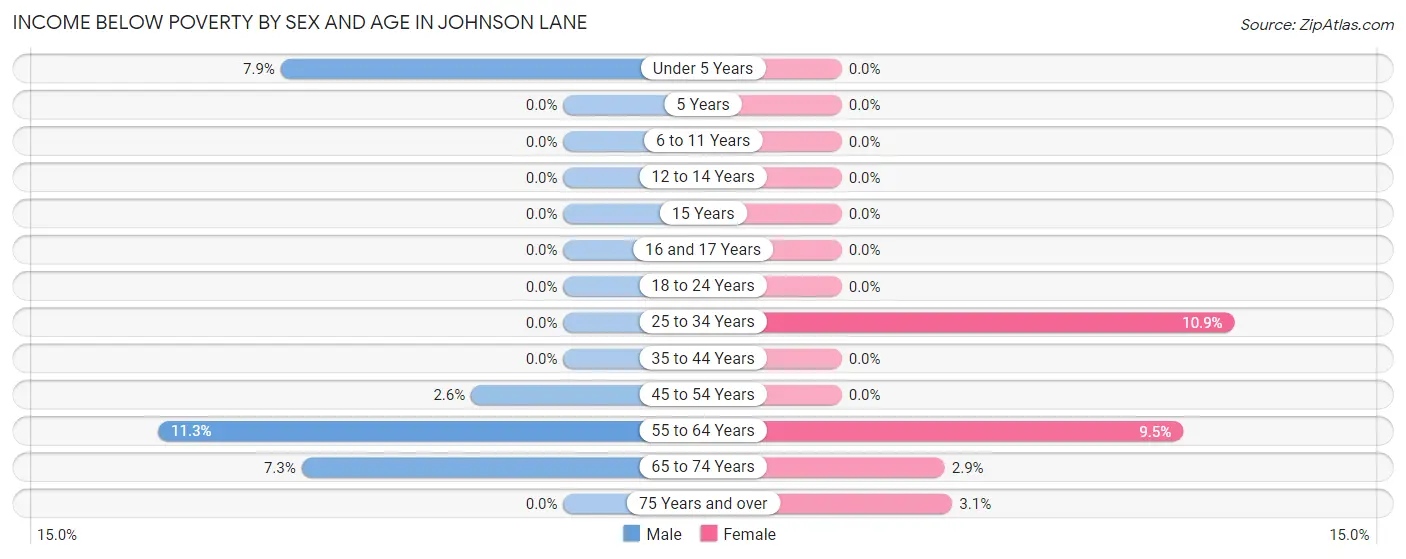
| Age Bracket | Male | Female |
| Under 5 Years | 10 (7.9%) | 0 (0.0%) |
| 5 Years | 0 (0.0%) | 0 (0.0%) |
| 6 to 11 Years | 0 (0.0%) | 0 (0.0%) |
| 12 to 14 Years | 0 (0.0%) | 0 (0.0%) |
| 15 Years | 0 (0.0%) | 0 (0.0%) |
| 16 and 17 Years | 0 (0.0%) | 0 (0.0%) |
| 18 to 24 Years | 0 (0.0%) | 0 (0.0%) |
| 25 to 34 Years | 0 (0.0%) | 20 (10.9%) |
| 35 to 44 Years | 0 (0.0%) | 0 (0.0%) |
| 45 to 54 Years | 7 (2.6%) | 0 (0.0%) |
| 55 to 64 Years | 59 (11.3%) | 63 (9.5%) |
| 65 to 74 Years | 48 (7.3%) | 22 (2.9%) |
| 75 Years and over | 0 (0.0%) | 12 (3.1%) |
| Total | 124 (3.9%) | 117 (3.5%) |
Income Above Poverty by Sex and Age in Johnson Lane
According to the poverty statistics in Johnson Lane, males aged 6 to 11 years and females aged under 5 years are the age groups that are most secure financially, with 100.0% of males and 100.0% of females in these age groups living above the poverty line.
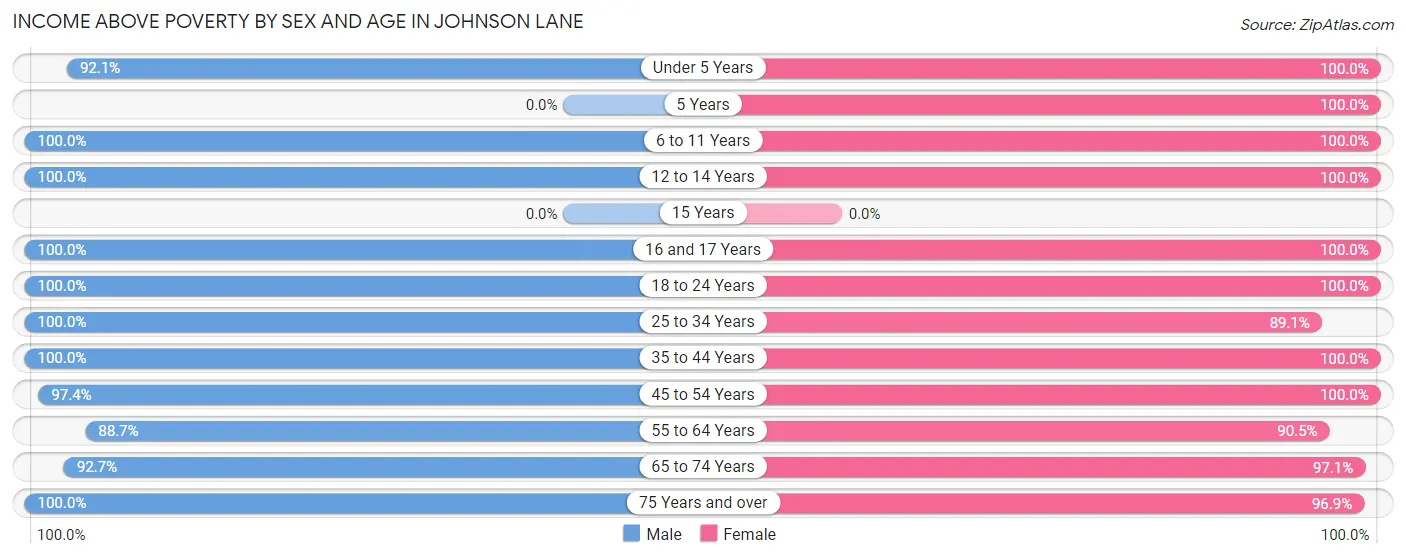
| Age Bracket | Male | Female |
| Under 5 Years | 117 (92.1%) | 51 (100.0%) |
| 5 Years | 0 (0.0%) | 105 (100.0%) |
| 6 to 11 Years | 11 (100.0%) | 109 (100.0%) |
| 12 to 14 Years | 86 (100.0%) | 131 (100.0%) |
| 15 Years | 0 (0.0%) | 0 (0.0%) |
| 16 and 17 Years | 100 (100.0%) | 115 (100.0%) |
| 18 to 24 Years | 416 (100.0%) | 104 (100.0%) |
| 25 to 34 Years | 180 (100.0%) | 163 (89.1%) |
| 35 to 44 Years | 335 (100.0%) | 365 (100.0%) |
| 45 to 54 Years | 265 (97.4%) | 337 (100.0%) |
| 55 to 64 Years | 464 (88.7%) | 600 (90.5%) |
| 65 to 74 Years | 610 (92.7%) | 745 (97.1%) |
| 75 Years and over | 471 (100.0%) | 378 (96.9%) |
| Total | 3,055 (96.1%) | 3,203 (96.5%) |
Income Below Poverty Among Married-Couple Families in Johnson Lane
The poverty statistics for married-couple families in Johnson Lane show that 3.9% or 73 of the total 1,873 families live below the poverty line. Families with no children have the highest poverty rate of 4.7%, comprising of 73 families. On the other hand, families with 1 or 2 children have the lowest poverty rate of 0.0%, which includes 0 families.
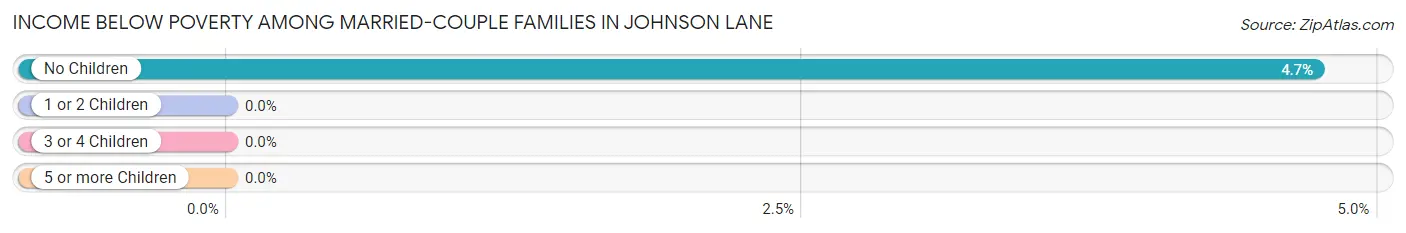
| Children | Above Poverty | Below Poverty |
| No Children | 1,471 (95.3%) | 73 (4.7%) |
| 1 or 2 Children | 260 (100.0%) | 0 (0.0%) |
| 3 or 4 Children | 18 (100.0%) | 0 (0.0%) |
| 5 or more Children | 51 (100.0%) | 0 (0.0%) |
| Total | 1,800 (96.1%) | 73 (3.9%) |
Income Below Poverty Among Single-Parent Households in Johnson Lane
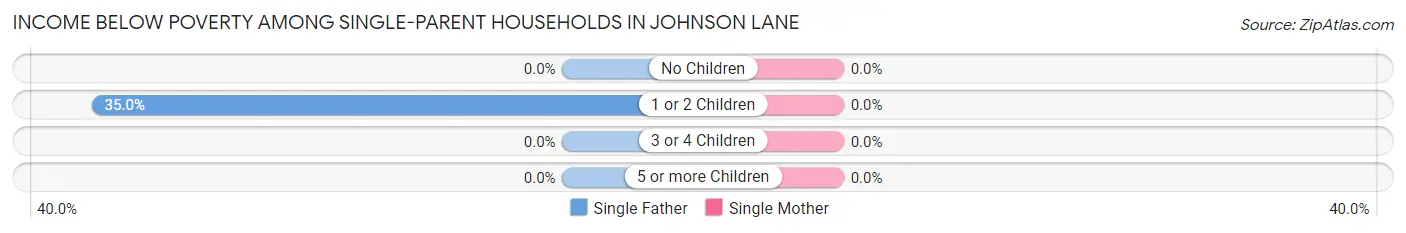
| Children | Single Father | Single Mother |
| No Children | 0 (0.0%) | 0 (0.0%) |
| 1 or 2 Children | 7 (35.0%) | 0 (0.0%) |
| 3 or 4 Children | 0 (0.0%) | 0 (0.0%) |
| 5 or more Children | 0 (0.0%) | 0 (0.0%) |
| Total | 7 (5.1%) | 0 (0.0%) |
Income Below Poverty Among Married-Couple vs Single-Parent Households in Johnson Lane
The poverty data for Johnson Lane shows that 73 of the married-couple family households (3.9%) and 7 of the single-parent households (2.6%) are living below the poverty level. Within the married-couple family households, those with no children have the highest poverty rate, with 73 households (4.7%) falling below the poverty line. Among the single-parent households, those with 1 or 2 children have the highest poverty rate, with 7 household (13.7%) living below poverty.
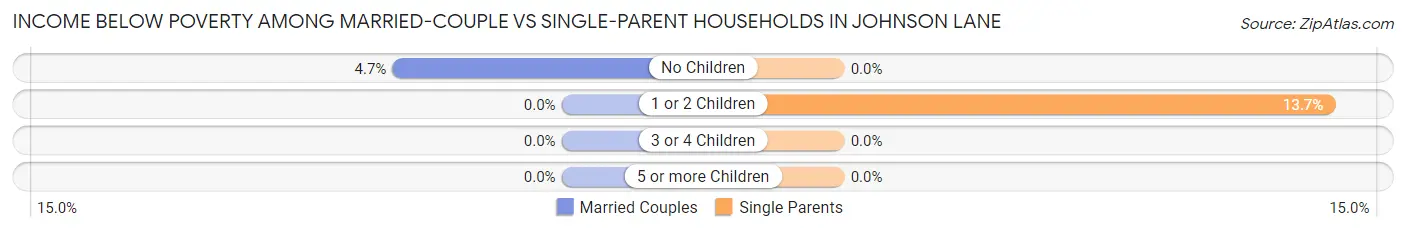
| Children | Married-Couple Families | Single-Parent Households |
| No Children | 73 (4.7%) | 0 (0.0%) |
| 1 or 2 Children | 0 (0.0%) | 7 (13.7%) |
| 3 or 4 Children | 0 (0.0%) | 0 (0.0%) |
| 5 or more Children | 0 (0.0%) | 0 (0.0%) |
| Total | 73 (3.9%) | 7 (2.6%) |
Race in Johnson Lane
The most populous races in Johnson Lane are White / Caucasian (6,032 | 92.8%), Hispanic or Latino (461 | 7.1%), and Two or more Races (264 | 4.1%).
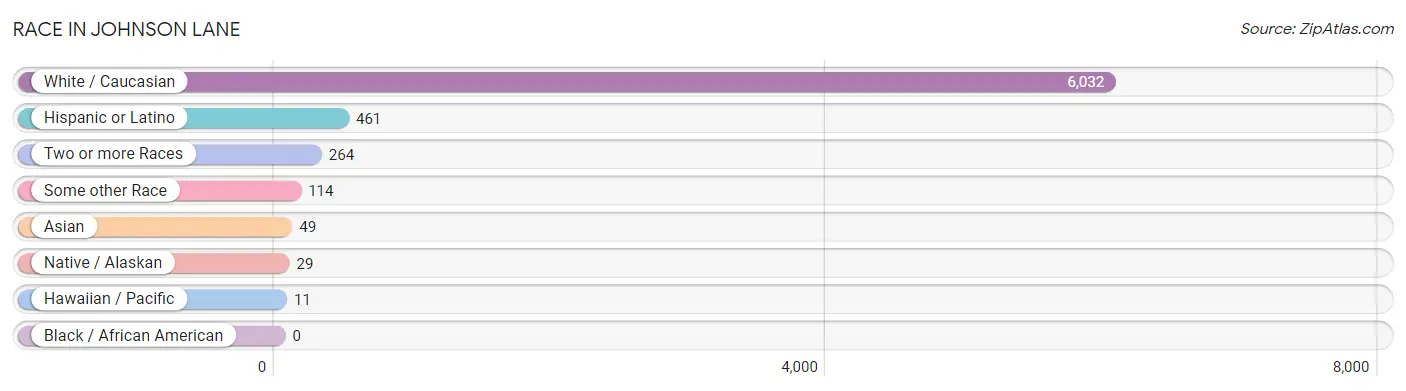
| Race | # Population | % Population |
| Asian | 49 | 0.7% |
| Black / African American | 0 | 0.0% |
| Hawaiian / Pacific | 11 | 0.2% |
| Hispanic or Latino | 461 | 7.1% |
| Native / Alaskan | 29 | 0.4% |
| White / Caucasian | 6,032 | 92.8% |
| Two or more Races | 264 | 4.1% |
| Some other Race | 114 | 1.8% |
| Total | 6,499 | 100.0% |
Ancestry in Johnson Lane
The most populous ancestries reported in Johnson Lane are German (1,240 | 19.1%), English (1,158 | 17.8%), Irish (674 | 10.4%), European (597 | 9.2%), and Mexican (344 | 5.3%), together accounting for 61.7% of all Johnson Lane residents.
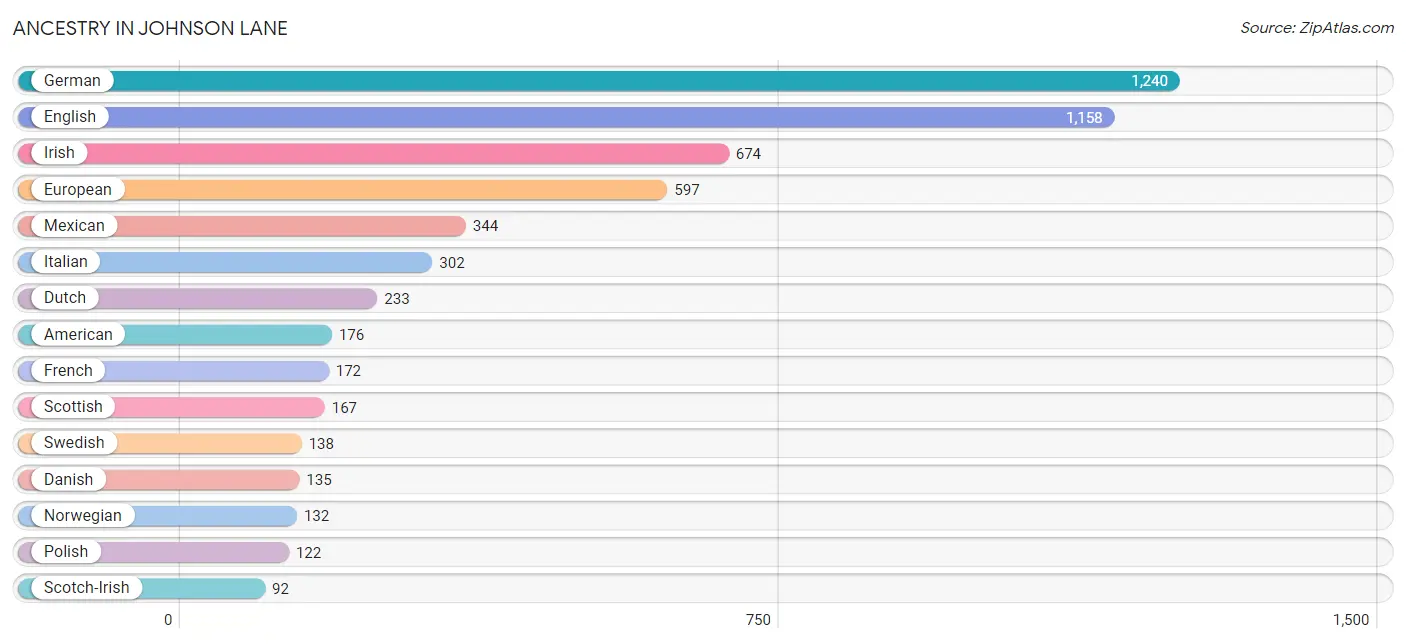
| Ancestry | # Population | % Population |
| African | 53 | 0.8% |
| American | 176 | 2.7% |
| Arab | 10 | 0.2% |
| Basque | 26 | 0.4% |
| British | 87 | 1.3% |
| Celtic | 42 | 0.6% |
| Cherokee | 40 | 0.6% |
| Chickasaw | 11 | 0.2% |
| Choctaw | 17 | 0.3% |
| Czech | 34 | 0.5% |
| Danish | 135 | 2.1% |
| Dutch | 233 | 3.6% |
| Eastern European | 23 | 0.4% |
| English | 1,158 | 17.8% |
| European | 597 | 9.2% |
| Finnish | 26 | 0.4% |
| French | 172 | 2.6% |
| French Canadian | 38 | 0.6% |
| German | 1,240 | 19.1% |
| Guamanian / Chamorro | 19 | 0.3% |
| Hungarian | 16 | 0.3% |
| Irish | 674 | 10.4% |
| Italian | 302 | 4.6% |
| Korean | 49 | 0.7% |
| Mexican | 344 | 5.3% |
| Northern European | 90 | 1.4% |
| Norwegian | 132 | 2.0% |
| Polish | 122 | 1.9% |
| Portuguese | 71 | 1.1% |
| Puerto Rican | 56 | 0.9% |
| Scandinavian | 37 | 0.6% |
| Scotch-Irish | 92 | 1.4% |
| Scottish | 167 | 2.6% |
| Slovak | 43 | 0.7% |
| South American | 18 | 0.3% |
| Spanish | 13 | 0.2% |
| Subsaharan African | 53 | 0.8% |
| Swedish | 138 | 2.1% |
| Swiss | 39 | 0.6% |
| Welsh | 26 | 0.4% | View All 40 Rows |
Immigrants in Johnson Lane
The most numerous immigrant groups reported in Johnson Lane came from Latin America (166 | 2.5%), Central America (148 | 2.3%), Mexico (148 | 2.3%), Europe (47 | 0.7%), and Czechoslovakia (34 | 0.5%), together accounting for 8.3% of all Johnson Lane residents.
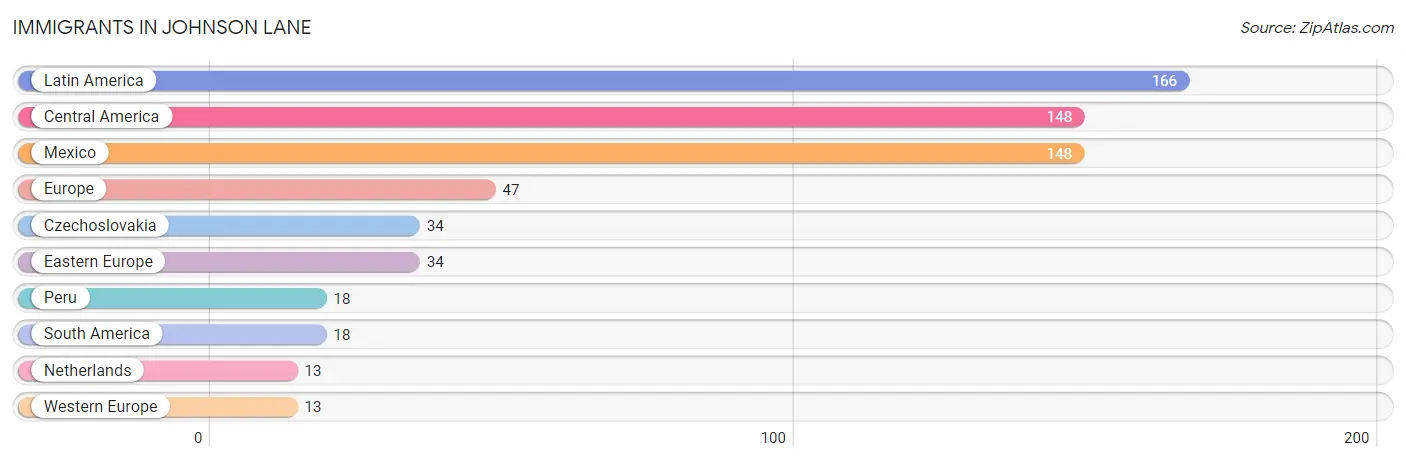
| Immigration Origin | # Population | % Population |
| Central America | 148 | 2.3% |
| Czechoslovakia | 34 | 0.5% |
| Eastern Europe | 34 | 0.5% |
| Europe | 47 | 0.7% |
| Latin America | 166 | 2.5% |
| Mexico | 148 | 2.3% |
| Netherlands | 13 | 0.2% |
| Peru | 18 | 0.3% |
| South America | 18 | 0.3% |
| Western Europe | 13 | 0.2% | View All 10 Rows |
Sex and Age in Johnson Lane
Sex and Age in Johnson Lane
The most populous age groups in Johnson Lane are 60 to 64 Years (364 | 11.5%) for men and 65 to 69 Years (391 | 11.8%) for women.
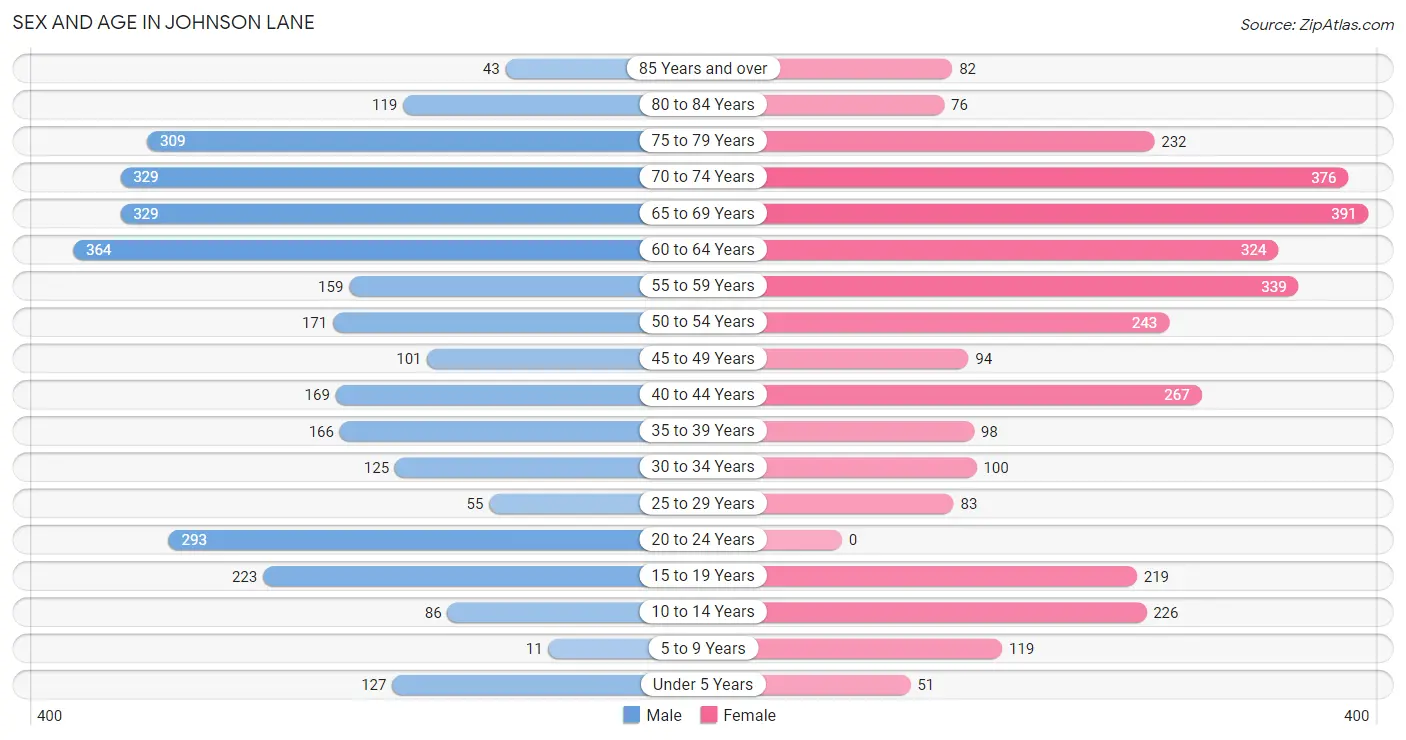
| Age Bracket | Male | Female |
| Under 5 Years | 127 (4.0%) | 51 (1.5%) |
| 5 to 9 Years | 11 (0.4%) | 119 (3.6%) |
| 10 to 14 Years | 86 (2.7%) | 226 (6.8%) |
| 15 to 19 Years | 223 (7.0%) | 219 (6.6%) |
| 20 to 24 Years | 293 (9.2%) | 0 (0.0%) |
| 25 to 29 Years | 55 (1.7%) | 83 (2.5%) |
| 30 to 34 Years | 125 (3.9%) | 100 (3.0%) |
| 35 to 39 Years | 166 (5.2%) | 98 (2.9%) |
| 40 to 44 Years | 169 (5.3%) | 267 (8.0%) |
| 45 to 49 Years | 101 (3.2%) | 94 (2.8%) |
| 50 to 54 Years | 171 (5.4%) | 243 (7.3%) |
| 55 to 59 Years | 159 (5.0%) | 339 (10.2%) |
| 60 to 64 Years | 364 (11.5%) | 324 (9.8%) |
| 65 to 69 Years | 329 (10.3%) | 391 (11.8%) |
| 70 to 74 Years | 329 (10.3%) | 376 (11.3%) |
| 75 to 79 Years | 309 (9.7%) | 232 (7.0%) |
| 80 to 84 Years | 119 (3.7%) | 76 (2.3%) |
| 85 Years and over | 43 (1.3%) | 82 (2.5%) |
| Total | 3,179 (100.0%) | 3,320 (100.0%) |
Families and Households in Johnson Lane
Median Family Size in Johnson Lane
The median family size in Johnson Lane is 2.67 persons per family, with single female/mother families (131 | 6.1%) accounting for the largest median family size of 3.07 persons per family. On the other hand, single male/father families (137 | 6.4%) represent the smallest median family size with 2.08 persons per family.
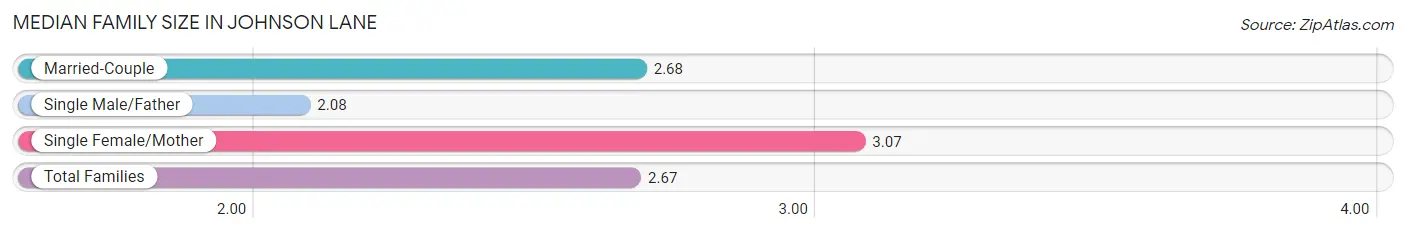
| Family Type | # Families | Family Size |
| Married-Couple | 1,873 (87.5%) | 2.68 |
| Single Male/Father | 137 (6.4%) | 2.08 |
| Single Female/Mother | 131 (6.1%) | 3.07 |
| Total Families | 2,141 (100.0%) | 2.67 |
Median Household Size in Johnson Lane
The median household size in Johnson Lane is 2.45 persons per household, with single female/mother households (131 | 4.9%) accounting for the largest median household size of 3.17 persons per household. non-family households (511 | 19.3%) represent the smallest median household size with 1.15 persons per household.
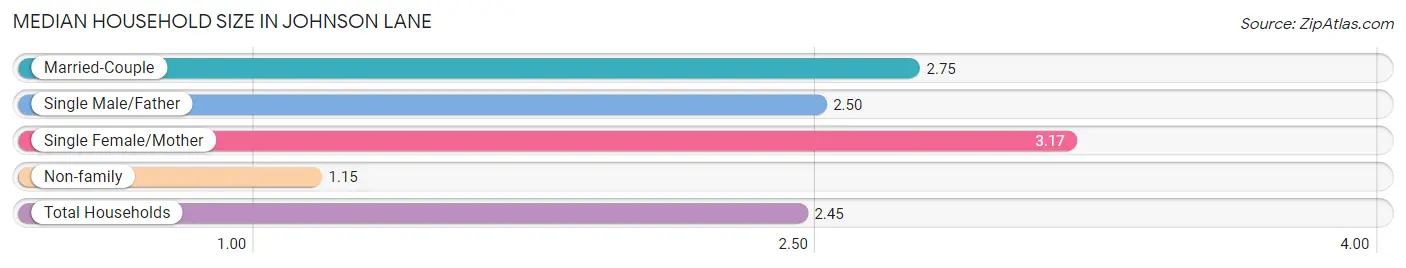
| Household Type | # Households | Household Size |
| Married-Couple | 1,873 (70.6%) | 2.75 |
| Single Male/Father | 137 (5.2%) | 2.50 |
| Single Female/Mother | 131 (4.9%) | 3.17 |
| Non-family | 511 (19.3%) | 1.15 |
| Total Households | 2,652 (100.0%) | 2.45 |
Household Size by Marriage Status in Johnson Lane
Out of a total of 2,652 households in Johnson Lane, 2,141 (80.7%) are family households, while 511 (19.3%) are nonfamily households. The most numerous type of family households are 2-person households, comprising 1,488, and the most common type of nonfamily households are 1-person households, comprising 438.
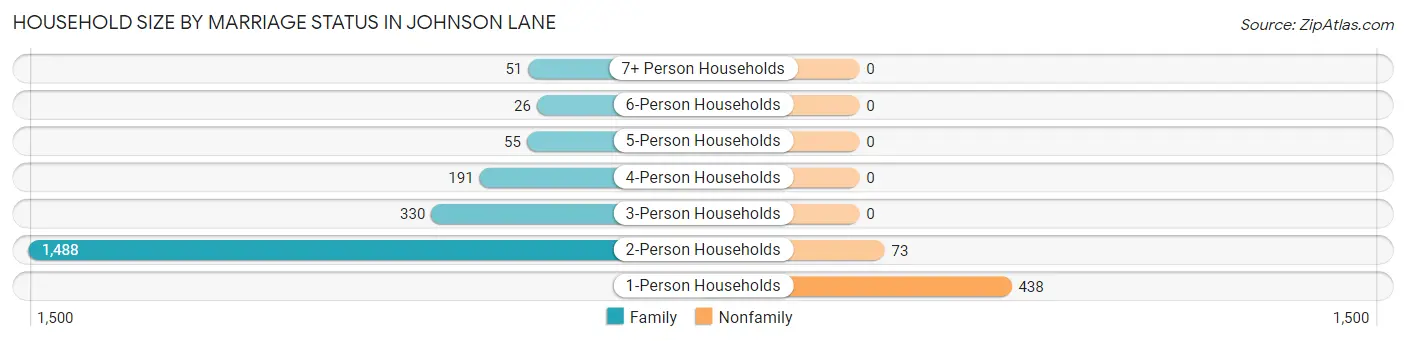
| Household Size | Family Households | Nonfamily Households |
| 1-Person Households | - | 438 (16.5%) |
| 2-Person Households | 1,488 (56.1%) | 73 (2.8%) |
| 3-Person Households | 330 (12.4%) | 0 (0.0%) |
| 4-Person Households | 191 (7.2%) | 0 (0.0%) |
| 5-Person Households | 55 (2.1%) | 0 (0.0%) |
| 6-Person Households | 26 (1.0%) | 0 (0.0%) |
| 7+ Person Households | 51 (1.9%) | 0 (0.0%) |
| Total | 2,141 (80.7%) | 511 (19.3%) |
Female Fertility in Johnson Lane
Fertility by Age in Johnson Lane
Average fertility rate in Johnson Lane is 15.0 births per 1,000 women. Women in the age bracket of 35 to 50 years have the highest fertility rate with 26.0 births per 1,000 women. Women in the age bracket of 35 to 50 years acount for 100.0% of all women with births.
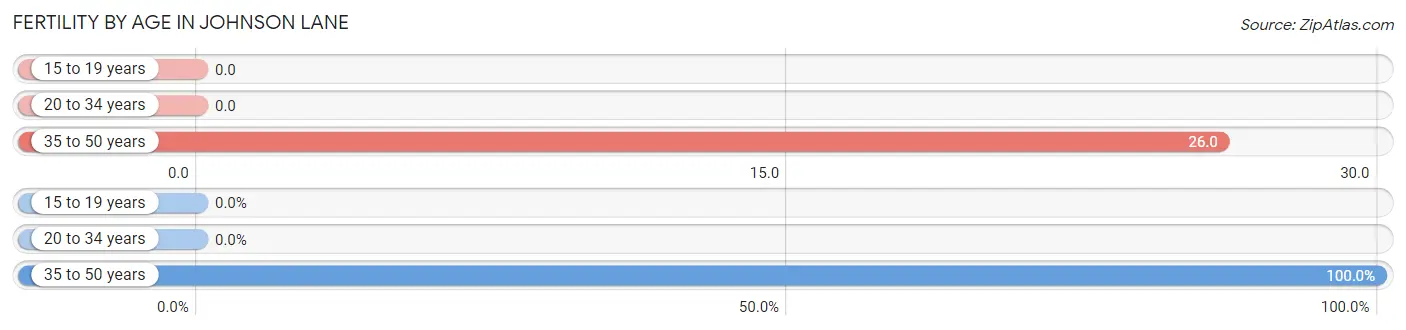
| Age Bracket | Women with Births | Births / 1,000 Women |
| 15 to 19 years | 0 (0.0%) | 0.0 |
| 20 to 34 years | 0 (0.0%) | 0.0 |
| 35 to 50 years | 13 (100.0%) | 26.0 |
| Total | 13 (100.0%) | 15.0 |
Fertility by Age by Marriage Status in Johnson Lane
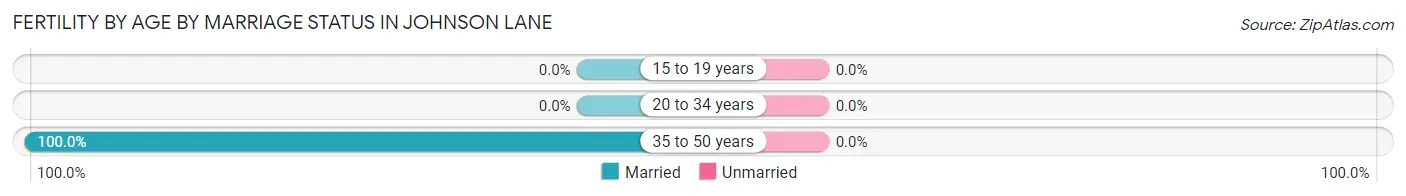
| Age Bracket | Married | Unmarried |
| 15 to 19 years | 0 (0.0%) | 0 (0.0%) |
| 20 to 34 years | 0 (0.0%) | 0 (0.0%) |
| 35 to 50 years | 13 (100.0%) | 0 (0.0%) |
| Total | 13 (100.0%) | 0 (0.0%) |
Fertility by Education in Johnson Lane
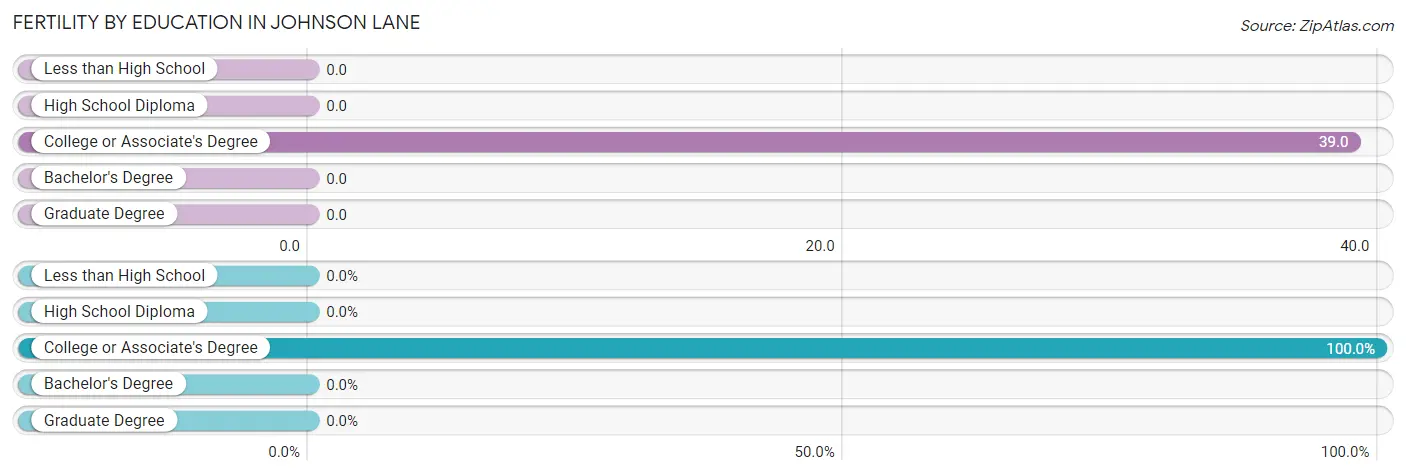
| Educational Attainment | Women with Births | Births / 1,000 Women |
| Less than High School | 0 (0.0%) | 0.0 |
| High School Diploma | 0 (0.0%) | 0.0 |
| College or Associate's Degree | 13 (100.0%) | 39.0 |
| Bachelor's Degree | 0 (0.0%) | 0.0 |
| Graduate Degree | 0 (0.0%) | 0.0 |
| Total | 13 (100.0%) | 15.0 |
Fertility by Education by Marriage Status in Johnson Lane
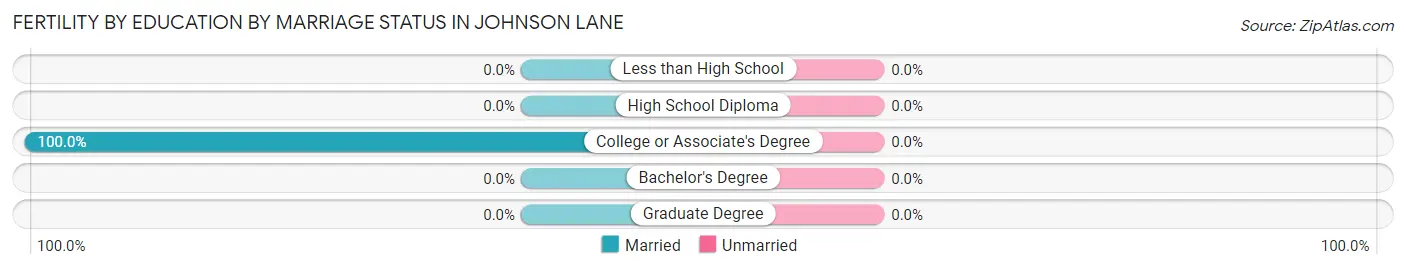
| Educational Attainment | Married | Unmarried |
| Less than High School | 0 (0.0%) | 0 (0.0%) |
| High School Diploma | 0 (0.0%) | 0 (0.0%) |
| College or Associate's Degree | 13 (100.0%) | 0 (0.0%) |
| Bachelor's Degree | 0 (0.0%) | 0 (0.0%) |
| Graduate Degree | 0 (0.0%) | 0 (0.0%) |
| Total | 13 (100.0%) | 0 (0.0%) |
Employment Characteristics in Johnson Lane
Employment by Class of Employer in Johnson Lane
Among the 2,487 employed individuals in Johnson Lane, private company employees (1,195 | 48.0%), local government employees (478 | 19.2%), and state government employees (221 | 8.9%) make up the most common classes of employment.
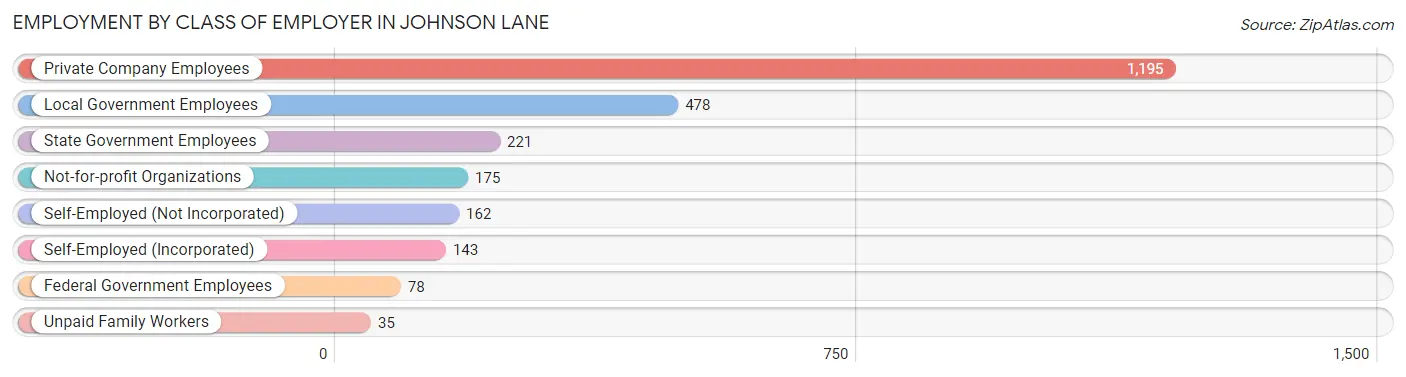
| Employer Class | # Employees | % Employees |
| Private Company Employees | 1,195 | 48.0% |
| Self-Employed (Incorporated) | 143 | 5.8% |
| Self-Employed (Not Incorporated) | 162 | 6.5% |
| Not-for-profit Organizations | 175 | 7.0% |
| Local Government Employees | 478 | 19.2% |
| State Government Employees | 221 | 8.9% |
| Federal Government Employees | 78 | 3.1% |
| Unpaid Family Workers | 35 | 1.4% |
| Total | 2,487 | 100.0% |
Employment Status by Age in Johnson Lane
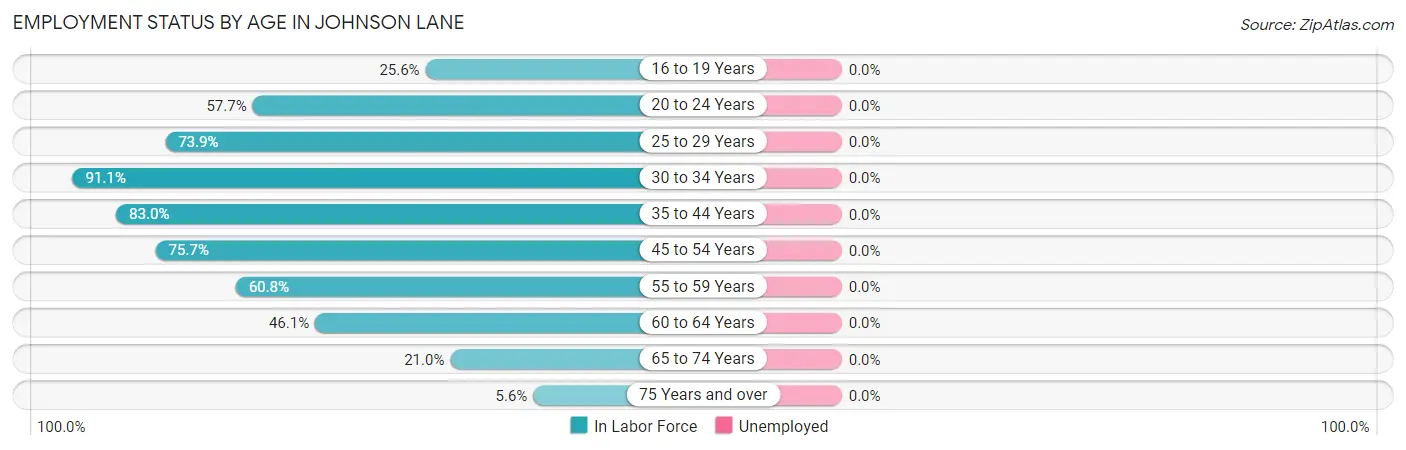
| Age Bracket | In Labor Force | Unemployed |
| 16 to 19 Years | 113 (25.6%) | 0 (0.0%) |
| 20 to 24 Years | 169 (57.7%) | 0 (0.0%) |
| 25 to 29 Years | 102 (73.9%) | 0 (0.0%) |
| 30 to 34 Years | 205 (91.1%) | 0 (0.0%) |
| 35 to 44 Years | 581 (83.0%) | 0 (0.0%) |
| 45 to 54 Years | 461 (75.7%) | 0 (0.0%) |
| 55 to 59 Years | 303 (60.8%) | 0 (0.0%) |
| 60 to 64 Years | 317 (46.1%) | 0 (0.0%) |
| 65 to 74 Years | 299 (21.0%) | 0 (0.0%) |
| 75 Years and over | 48 (5.6%) | 0 (0.0%) |
| Total | 2,599 (44.2%) | 0 (0.0%) |
Employment Status by Educational Attainment in Johnson Lane
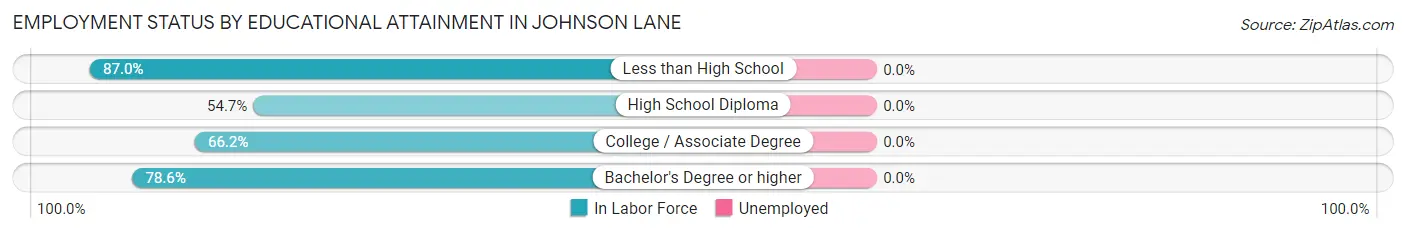
| Educational Attainment | In Labor Force | Unemployed |
| Less than High School | 107 (87.0%) | 0 (0.0%) |
| High School Diploma | 290 (54.7%) | 0 (0.0%) |
| College / Associate Degree | 857 (66.2%) | 0 (0.0%) |
| Bachelor's Degree or higher | 715 (78.6%) | 0 (0.0%) |
| Total | 1,969 (68.9%) | 0 (0.0%) |
Employment Occupations by Sex in Johnson Lane
Management, Business, Science and Arts Occupations
The most common Management, Business, Science and Arts occupations in Johnson Lane are Community & Social Service (242 | 9.6%), Management (179 | 7.1%), Business & Financial (170 | 6.8%), Education, Arts & Media (153 | 6.1%), and Computers, Engineering & Science (120 | 4.8%).

Management, Business, Science and Arts Occupations by Sex
Within the Management, Business, Science and Arts occupations in Johnson Lane, the most male-oriented occupations are Computers & Mathematics (100.0%), Architecture & Engineering (100.0%), and Legal Services & Support (100.0%), while the most female-oriented occupations are Life, Physical & Social Science (100.0%), Arts, Media & Entertainment (100.0%), and Education Instruction & Library (83.3%).
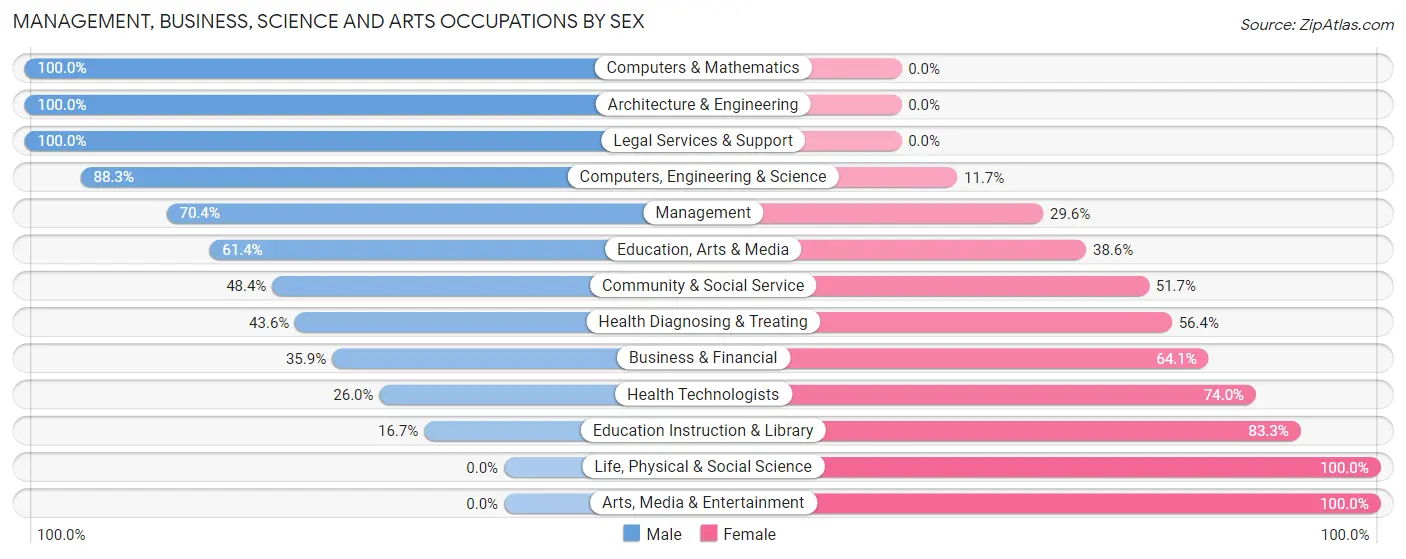
| Occupation | Male | Female |
| Management | 126 (70.4%) | 53 (29.6%) |
| Business & Financial | 61 (35.9%) | 109 (64.1%) |
| Computers, Engineering & Science | 106 (88.3%) | 14 (11.7%) |
| Computers & Mathematics | 10 (100.0%) | 0 (0.0%) |
| Architecture & Engineering | 96 (100.0%) | 0 (0.0%) |
| Life, Physical & Social Science | 0 (0.0%) | 14 (100.0%) |
| Community & Social Service | 117 (48.3%) | 125 (51.6%) |
| Education, Arts & Media | 94 (61.4%) | 59 (38.6%) |
| Legal Services & Support | 12 (100.0%) | 0 (0.0%) |
| Education Instruction & Library | 11 (16.7%) | 55 (83.3%) |
| Arts, Media & Entertainment | 0 (0.0%) | 11 (100.0%) |
| Health Diagnosing & Treating | 44 (43.6%) | 57 (56.4%) |
| Health Technologists | 13 (26.0%) | 37 (74.0%) |
| Total (Category) | 454 (55.9%) | 358 (44.1%) |
| Total (Overall) | 1,321 (52.4%) | 1,199 (47.6%) |
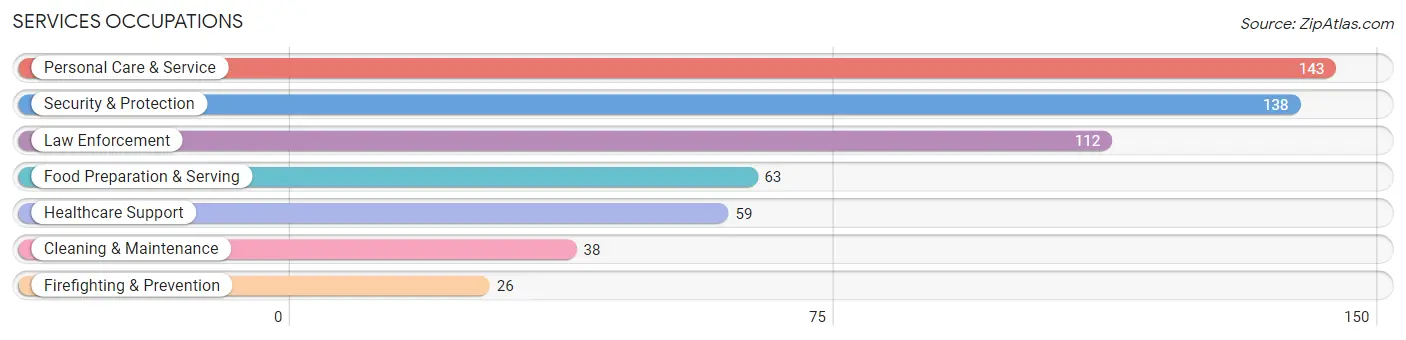
Services Occupations
The most common Services occupations in Johnson Lane are Personal Care & Service (143 | 5.7%), Security & Protection (138 | 5.5%), Law Enforcement (112 | 4.4%), Food Preparation & Serving (63 | 2.5%), and Healthcare Support (59 | 2.3%).
Services Occupations by Sex
Within the Services occupations in Johnson Lane, the most male-oriented occupations are Firefighting & Prevention (100.0%), Food Preparation & Serving (84.1%), and Security & Protection (78.3%), while the most female-oriented occupations are Healthcare Support (100.0%), Cleaning & Maintenance (100.0%), and Personal Care & Service (53.8%).
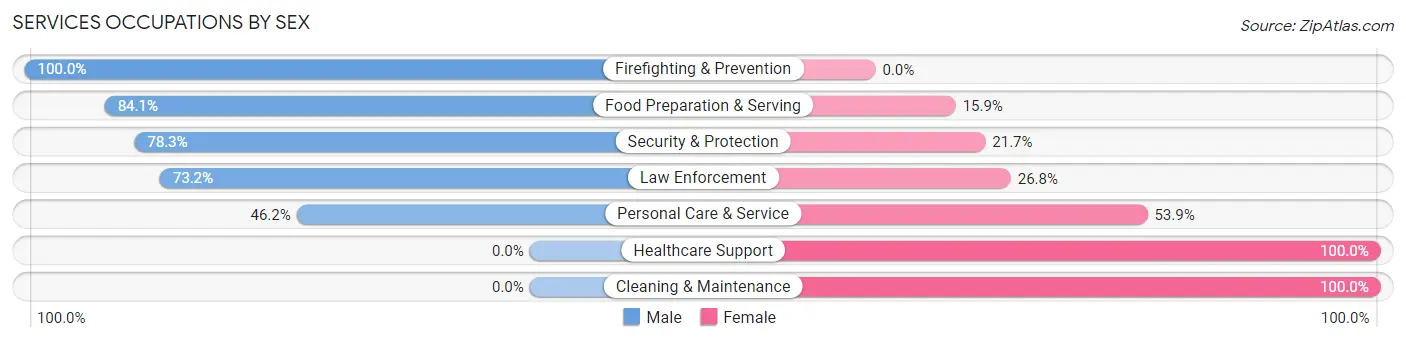
| Occupation | Male | Female |
| Healthcare Support | 0 (0.0%) | 59 (100.0%) |
| Security & Protection | 108 (78.3%) | 30 (21.7%) |
| Firefighting & Prevention | 26 (100.0%) | 0 (0.0%) |
| Law Enforcement | 82 (73.2%) | 30 (26.8%) |
| Food Preparation & Serving | 53 (84.1%) | 10 (15.9%) |
| Cleaning & Maintenance | 0 (0.0%) | 38 (100.0%) |
| Personal Care & Service | 66 (46.2%) | 77 (53.8%) |
| Total (Category) | 227 (51.5%) | 214 (48.5%) |
| Total (Overall) | 1,321 (52.4%) | 1,199 (47.6%) |
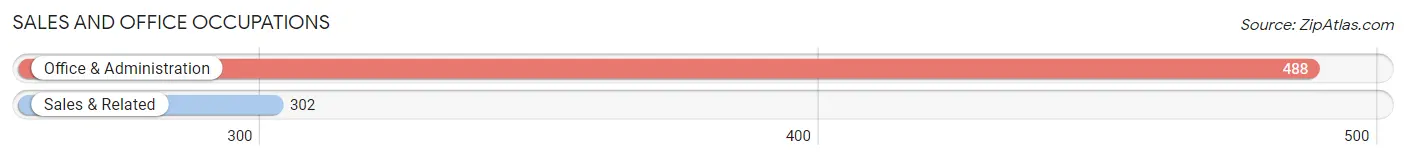
Sales and Office Occupations
The most common Sales and Office occupations in Johnson Lane are Office & Administration (488 | 19.4%), and Sales & Related (302 | 12.0%).
Sales and Office Occupations by Sex
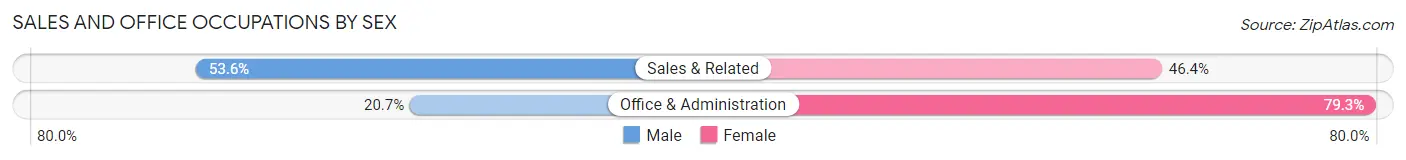
| Occupation | Male | Female |
| Sales & Related | 162 (53.6%) | 140 (46.4%) |
| Office & Administration | 101 (20.7%) | 387 (79.3%) |
| Total (Category) | 263 (33.3%) | 527 (66.7%) |
| Total (Overall) | 1,321 (52.4%) | 1,199 (47.6%) |
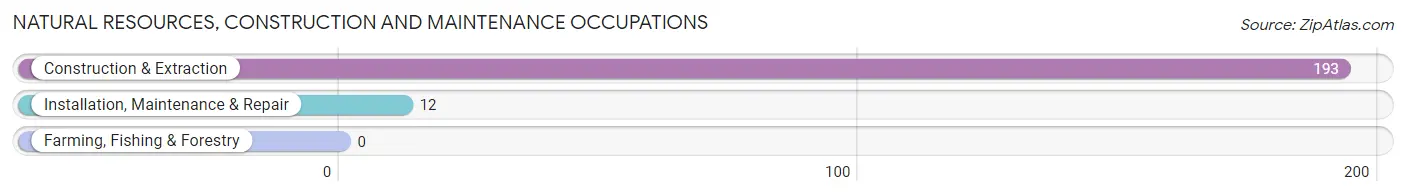
Natural Resources, Construction and Maintenance Occupations
The most common Natural Resources, Construction and Maintenance occupations in Johnson Lane are Construction & Extraction (193 | 7.7%), and Installation, Maintenance & Repair (12 | 0.5%).
Natural Resources, Construction and Maintenance Occupations by Sex
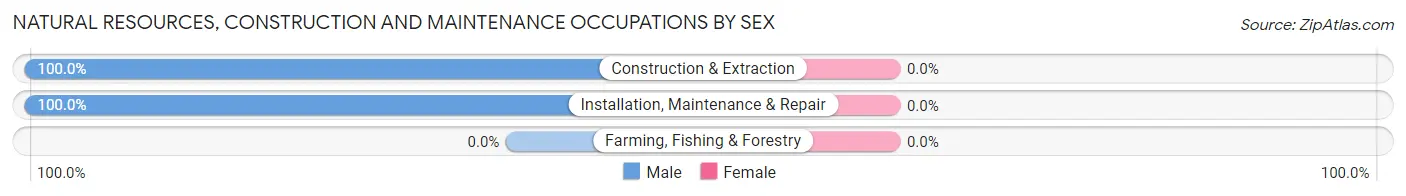
| Occupation | Male | Female |
| Farming, Fishing & Forestry | 0 (0.0%) | 0 (0.0%) |
| Construction & Extraction | 193 (100.0%) | 0 (0.0%) |
| Installation, Maintenance & Repair | 12 (100.0%) | 0 (0.0%) |
| Total (Category) | 205 (100.0%) | 0 (0.0%) |
| Total (Overall) | 1,321 (52.4%) | 1,199 (47.6%) |
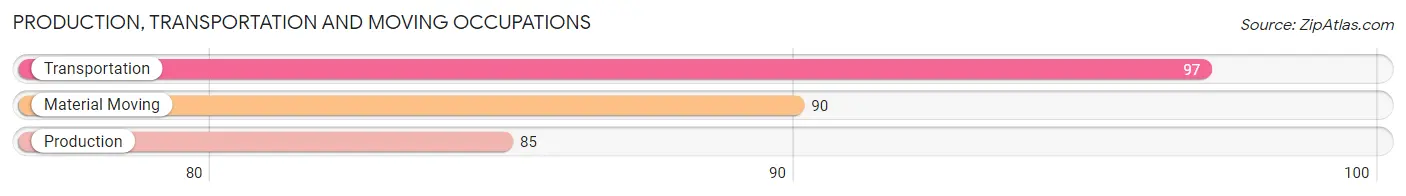
Production, Transportation and Moving Occupations
The most common Production, Transportation and Moving occupations in Johnson Lane are Transportation (97 | 3.8%), Material Moving (90 | 3.6%), and Production (85 | 3.4%).
Production, Transportation and Moving Occupations by Sex
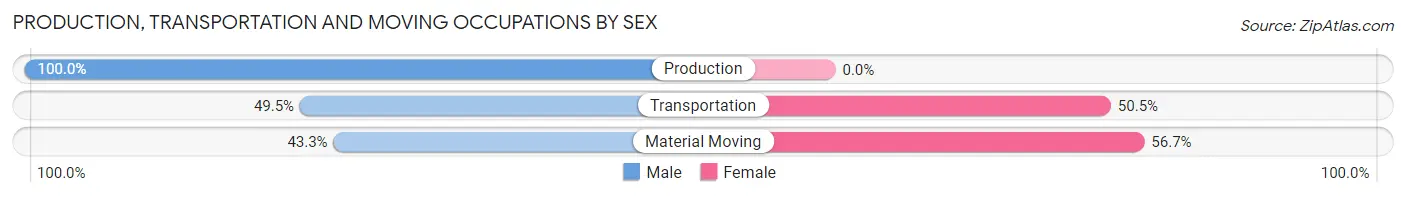
| Occupation | Male | Female |
| Production | 85 (100.0%) | 0 (0.0%) |
| Transportation | 48 (49.5%) | 49 (50.5%) |
| Material Moving | 39 (43.3%) | 51 (56.7%) |
| Total (Category) | 172 (63.2%) | 100 (36.8%) |
| Total (Overall) | 1,321 (52.4%) | 1,199 (47.6%) |
Employment Industries by Sex in Johnson Lane
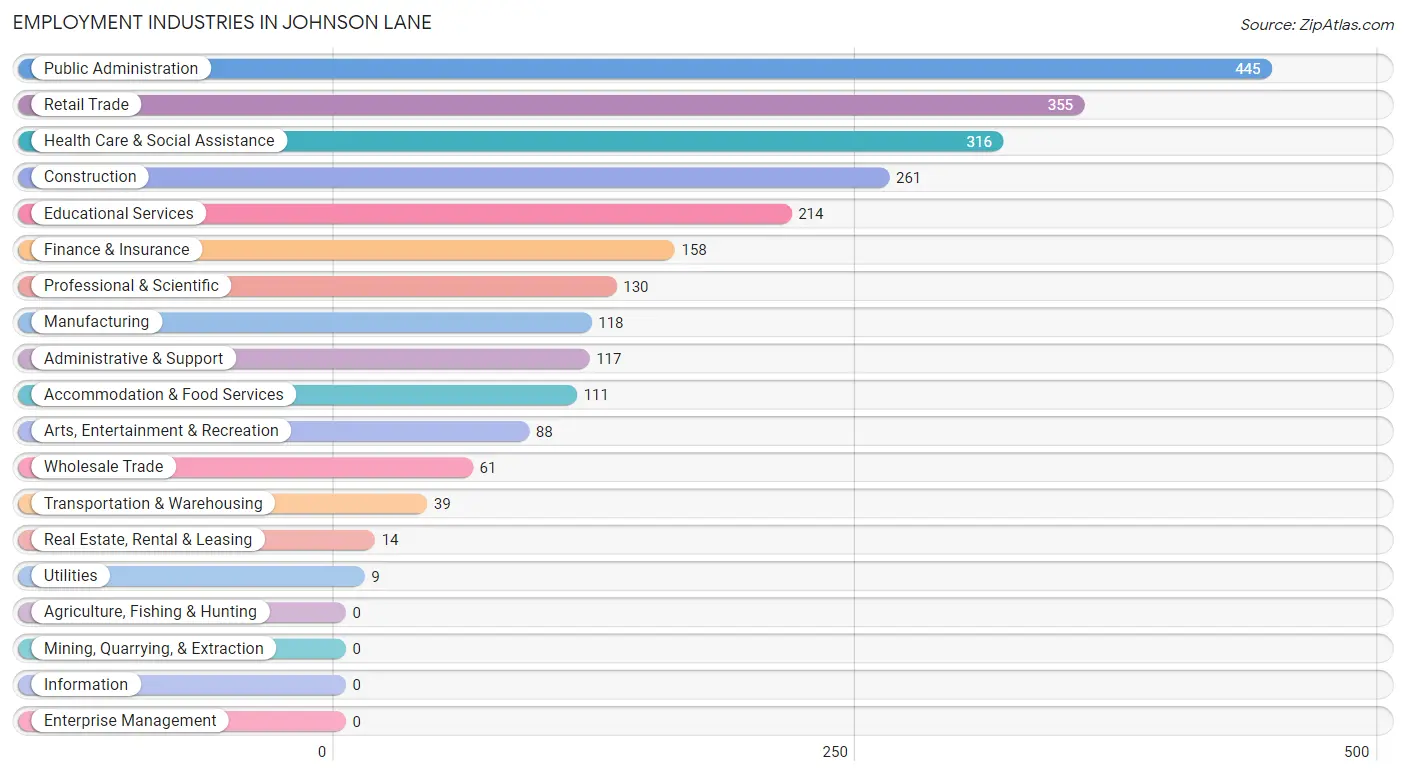
Employment Industries in Johnson Lane
The major employment industries in Johnson Lane include Public Administration (445 | 17.7%), Retail Trade (355 | 14.1%), Health Care & Social Assistance (316 | 12.5%), Construction (261 | 10.4%), and Educational Services (214 | 8.5%).
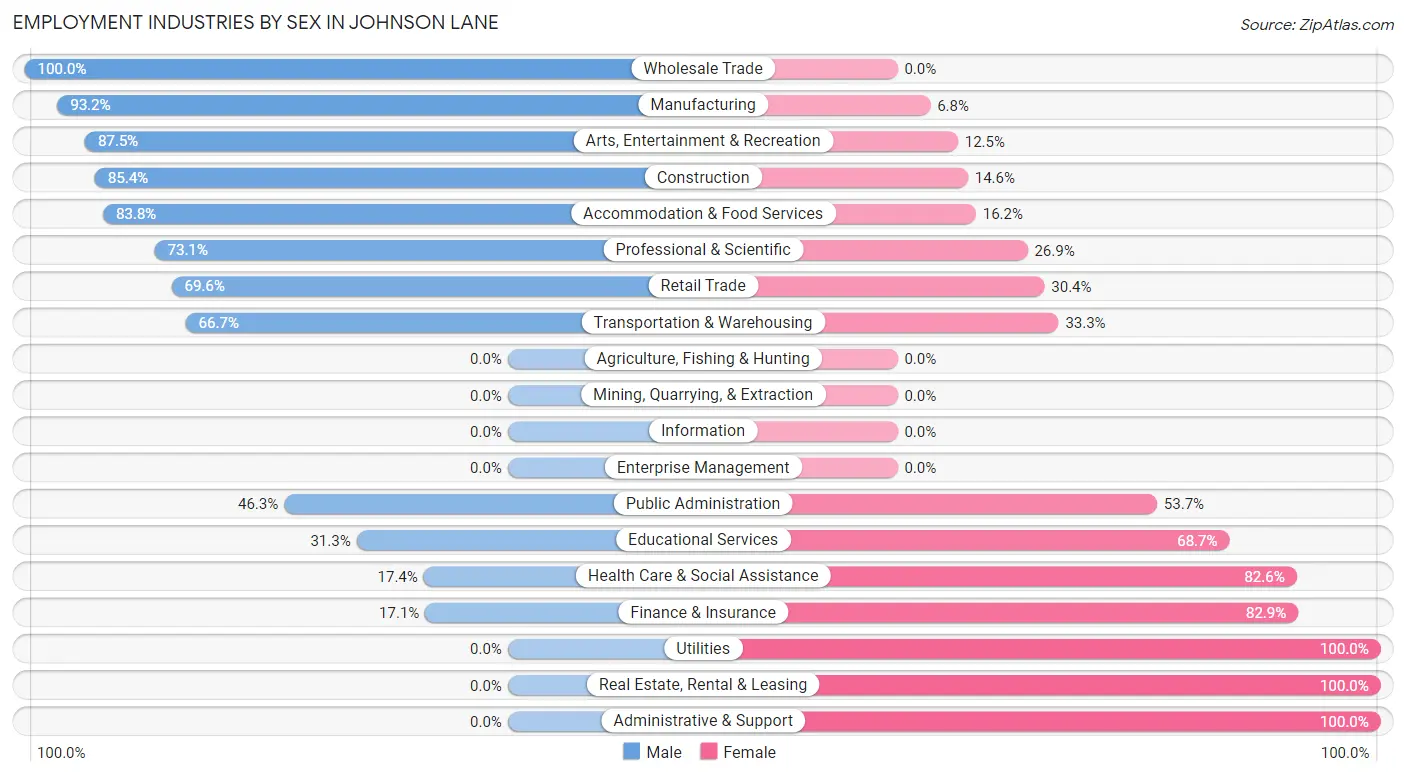
Employment Industries by Sex in Johnson Lane
The Johnson Lane industries that see more men than women are Wholesale Trade (100.0%), Manufacturing (93.2%), and Arts, Entertainment & Recreation (87.5%), whereas the industries that tend to have a higher number of women are Utilities (100.0%), Real Estate, Rental & Leasing (100.0%), and Administrative & Support (100.0%).
| Industry | Male | Female |
| Agriculture, Fishing & Hunting | 0 (0.0%) | 0 (0.0%) |
| Mining, Quarrying, & Extraction | 0 (0.0%) | 0 (0.0%) |
| Construction | 223 (85.4%) | 38 (14.6%) |
| Manufacturing | 110 (93.2%) | 8 (6.8%) |
| Wholesale Trade | 61 (100.0%) | 0 (0.0%) |
| Retail Trade | 247 (69.6%) | 108 (30.4%) |
| Transportation & Warehousing | 26 (66.7%) | 13 (33.3%) |
| Utilities | 0 (0.0%) | 9 (100.0%) |
| Information | 0 (0.0%) | 0 (0.0%) |
| Finance & Insurance | 27 (17.1%) | 131 (82.9%) |
| Real Estate, Rental & Leasing | 0 (0.0%) | 14 (100.0%) |
| Professional & Scientific | 95 (73.1%) | 35 (26.9%) |
| Enterprise Management | 0 (0.0%) | 0 (0.0%) |
| Administrative & Support | 0 (0.0%) | 117 (100.0%) |
| Educational Services | 67 (31.3%) | 147 (68.7%) |
| Health Care & Social Assistance | 55 (17.4%) | 261 (82.6%) |
| Arts, Entertainment & Recreation | 77 (87.5%) | 11 (12.5%) |
| Accommodation & Food Services | 93 (83.8%) | 18 (16.2%) |
| Public Administration | 206 (46.3%) | 239 (53.7%) |
| Total | 1,321 (52.4%) | 1,199 (47.6%) |
Education in Johnson Lane
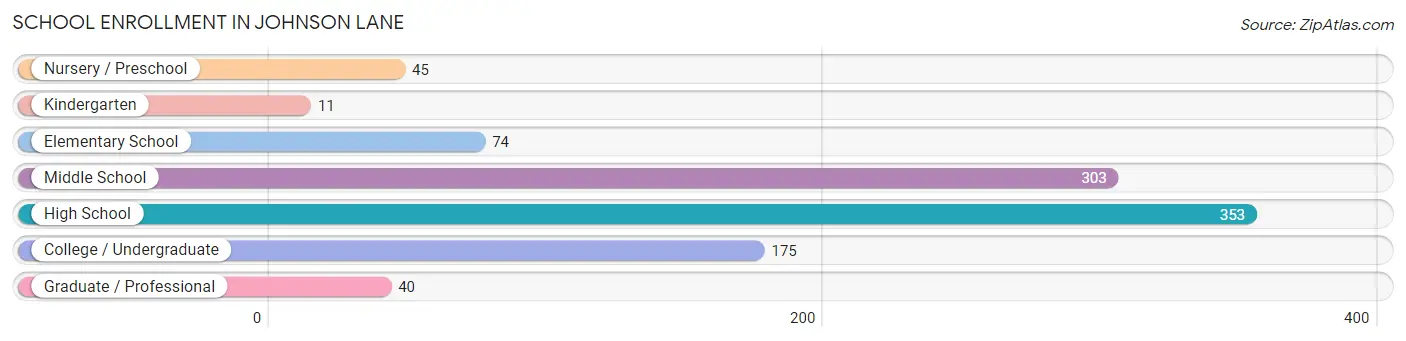
School Enrollment in Johnson Lane
The most common levels of schooling among the 1,001 students in Johnson Lane are high school (353 | 35.3%), middle school (303 | 30.3%), and college / undergraduate (175 | 17.5%).
| School Level | # Students | % Students |
| Nursery / Preschool | 45 | 4.5% |
| Kindergarten | 11 | 1.1% |
| Elementary School | 74 | 7.4% |
| Middle School | 303 | 30.3% |
| High School | 353 | 35.3% |
| College / Undergraduate | 175 | 17.5% |
| Graduate / Professional | 40 | 4.0% |
| Total | 1,001 | 100.0% |
School Enrollment by Age by Funding Source in Johnson Lane
Out of a total of 1,001 students who are enrolled in schools in Johnson Lane, 151 (15.1%) attend a private institution, while the remaining 850 (84.9%) are enrolled in public schools. The age group of 25 to 34 year olds has the highest likelihood of being enrolled in private schools, with 18 (100.0% in the age bracket) enrolled. Conversely, the age group of 5 to 9 year old has the lowest likelihood of being enrolled in a private school, with 85 (100.0% in the age bracket) attending a public institution.
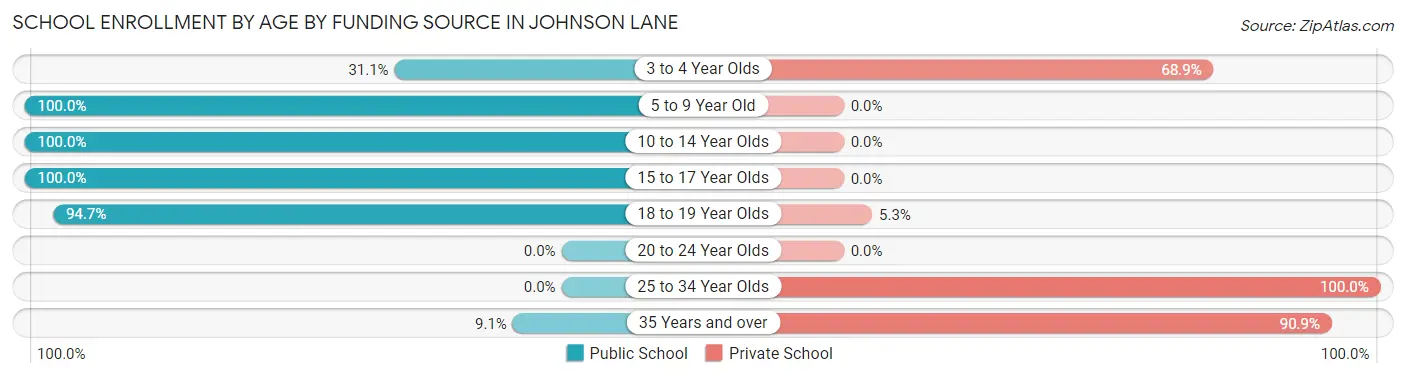
| Age Bracket | Public School | Private School |
| 3 to 4 Year Olds | 14 (31.1%) | 31 (68.9%) |
| 5 to 9 Year Old | 85 (100.0%) | 0 (0.0%) |
| 10 to 14 Year Olds | 312 (100.0%) | 0 (0.0%) |
| 15 to 17 Year Olds | 215 (100.0%) | 0 (0.0%) |
| 18 to 19 Year Olds | 215 (94.7%) | 12 (5.3%) |
| 20 to 24 Year Olds | 0 (0.0%) | 0 (0.0%) |
| 25 to 34 Year Olds | 0 (0.0%) | 18 (100.0%) |
| 35 Years and over | 9 (9.1%) | 90 (90.9%) |
| Total | 850 (84.9%) | 151 (15.1%) |
Educational Attainment by Field of Study in Johnson Lane
Business (390 | 22.5%), education (236 | 13.6%), liberal arts & history (185 | 10.6%), bio, nature & agricultural (174 | 10.0%), and science & technology (122 | 7.0%) are the most common fields of study among 1,737 individuals in Johnson Lane who have obtained a bachelor's degree or higher.
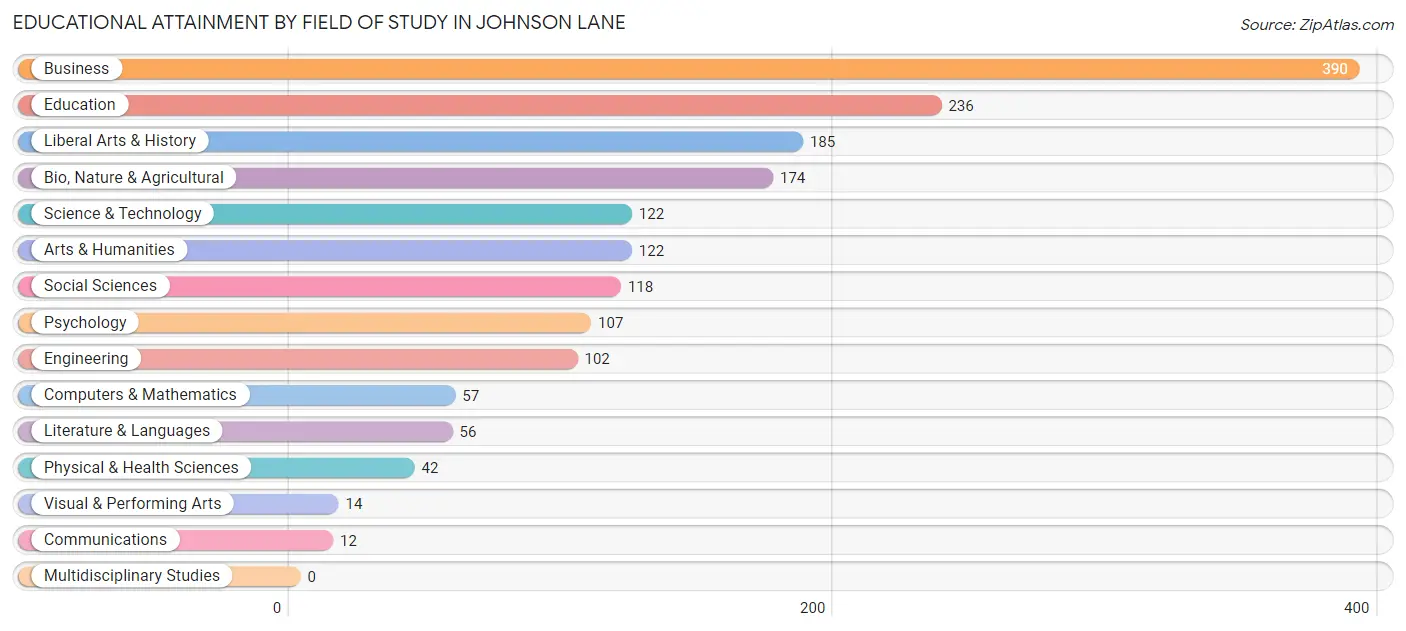
| Field of Study | # Graduates | % Graduates |
| Computers & Mathematics | 57 | 3.3% |
| Bio, Nature & Agricultural | 174 | 10.0% |
| Physical & Health Sciences | 42 | 2.4% |
| Psychology | 107 | 6.2% |
| Social Sciences | 118 | 6.8% |
| Engineering | 102 | 5.9% |
| Multidisciplinary Studies | 0 | 0.0% |
| Science & Technology | 122 | 7.0% |
| Business | 390 | 22.5% |
| Education | 236 | 13.6% |
| Literature & Languages | 56 | 3.2% |
| Liberal Arts & History | 185 | 10.6% |
| Visual & Performing Arts | 14 | 0.8% |
| Communications | 12 | 0.7% |
| Arts & Humanities | 122 | 7.0% |
| Total | 1,737 | 100.0% |
Transportation & Commute in Johnson Lane
Vehicle Availability by Sex in Johnson Lane
The most prevalent vehicle ownership categories in Johnson Lane are males with 2 vehicles (443, accounting for 32.8%) and females with 2 vehicles (410, making up 39.0%).
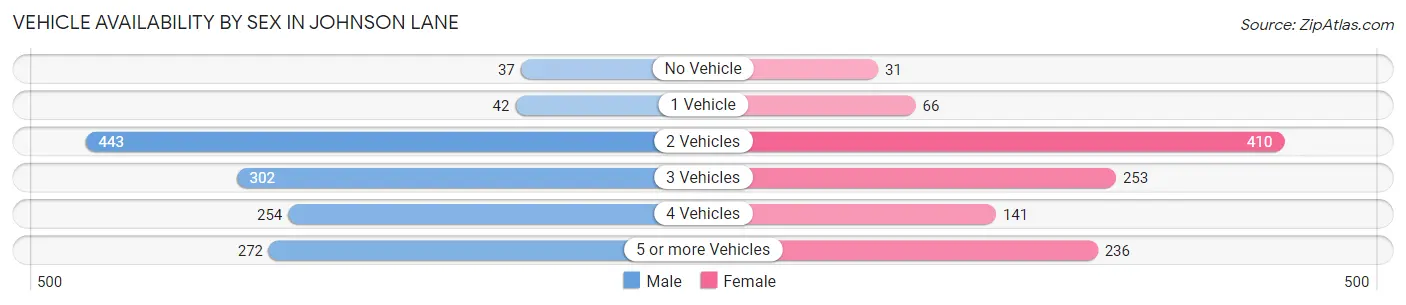
| Vehicles Available | Male | Female |
| No Vehicle | 37 (2.7%) | 31 (2.7%) |
| 1 Vehicle | 42 (3.1%) | 66 (5.8%) |
| 2 Vehicles | 443 (32.8%) | 410 (36.1%) |
| 3 Vehicles | 302 (22.4%) | 253 (22.3%) |
| 4 Vehicles | 254 (18.8%) | 141 (12.4%) |
| 5 or more Vehicles | 272 (20.2%) | 236 (20.8%) |
| Total | 1,350 (100.0%) | 1,137 (100.0%) |
Commute Time in Johnson Lane
The most frequently occuring commute durations in Johnson Lane are 15 to 19 minutes (527 commuters, 22.3%), 20 to 24 minutes (351 commuters, 14.9%), and 45 to 59 minutes (290 commuters, 12.3%).
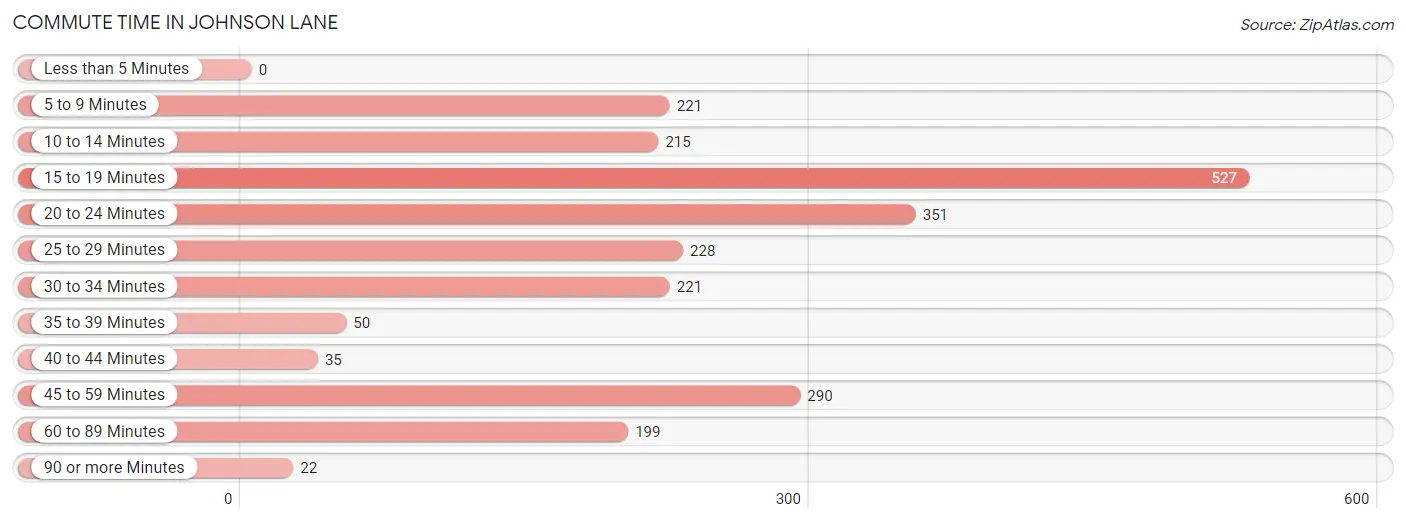
| Commute Time | # Commuters | % Commuters |
| Less than 5 Minutes | 0 | 0.0% |
| 5 to 9 Minutes | 221 | 9.4% |
| 10 to 14 Minutes | 215 | 9.1% |
| 15 to 19 Minutes | 527 | 22.3% |
| 20 to 24 Minutes | 351 | 14.9% |
| 25 to 29 Minutes | 228 | 9.7% |
| 30 to 34 Minutes | 221 | 9.4% |
| 35 to 39 Minutes | 50 | 2.1% |
| 40 to 44 Minutes | 35 | 1.5% |
| 45 to 59 Minutes | 290 | 12.3% |
| 60 to 89 Minutes | 199 | 8.4% |
| 90 or more Minutes | 22 | 0.9% |
Commute Time by Sex in Johnson Lane
The most common commute times in Johnson Lane are 45 to 59 minutes (202 commuters, 16.0%) for males and 15 to 19 minutes (349 commuters, 31.8%) for females.
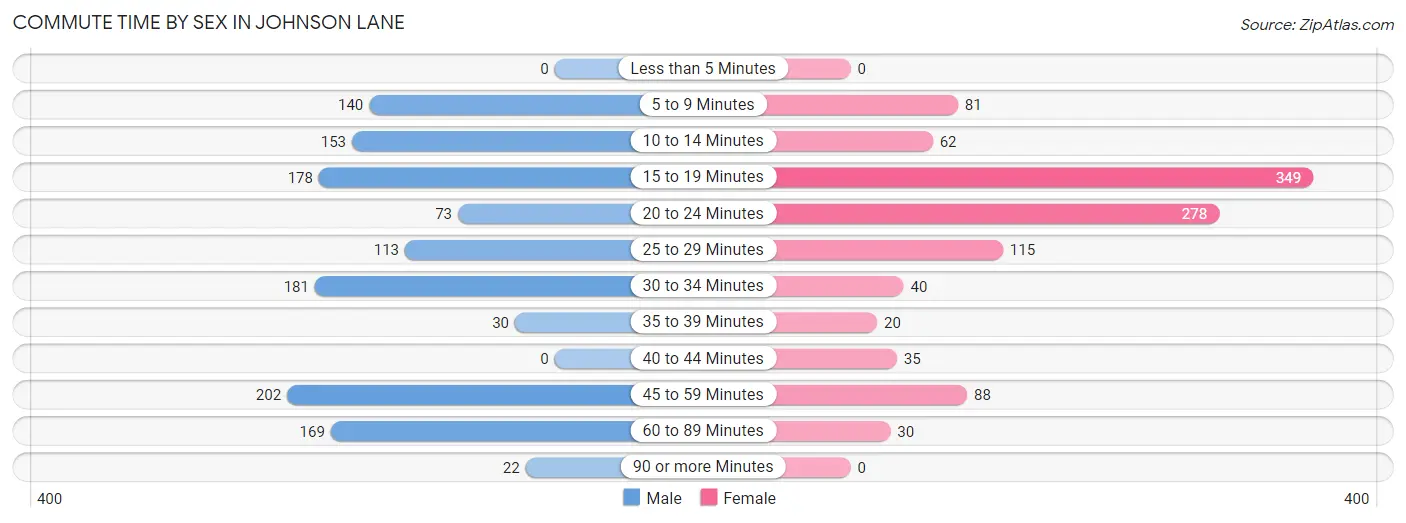
| Commute Time | Male | Female |
| Less than 5 Minutes | 0 (0.0%) | 0 (0.0%) |
| 5 to 9 Minutes | 140 (11.1%) | 81 (7.4%) |
| 10 to 14 Minutes | 153 (12.1%) | 62 (5.7%) |
| 15 to 19 Minutes | 178 (14.1%) | 349 (31.8%) |
| 20 to 24 Minutes | 73 (5.8%) | 278 (25.3%) |
| 25 to 29 Minutes | 113 (9.0%) | 115 (10.5%) |
| 30 to 34 Minutes | 181 (14.3%) | 40 (3.6%) |
| 35 to 39 Minutes | 30 (2.4%) | 20 (1.8%) |
| 40 to 44 Minutes | 0 (0.0%) | 35 (3.2%) |
| 45 to 59 Minutes | 202 (16.0%) | 88 (8.0%) |
| 60 to 89 Minutes | 169 (13.4%) | 30 (2.7%) |
| 90 or more Minutes | 22 (1.7%) | 0 (0.0%) |
Time of Departure to Work by Sex in Johnson Lane
The most frequent times of departure to work in Johnson Lane are 6:30 AM to 6:59 AM (231, 18.3%) for males and 7:30 AM to 7:59 AM (249, 22.7%) for females.
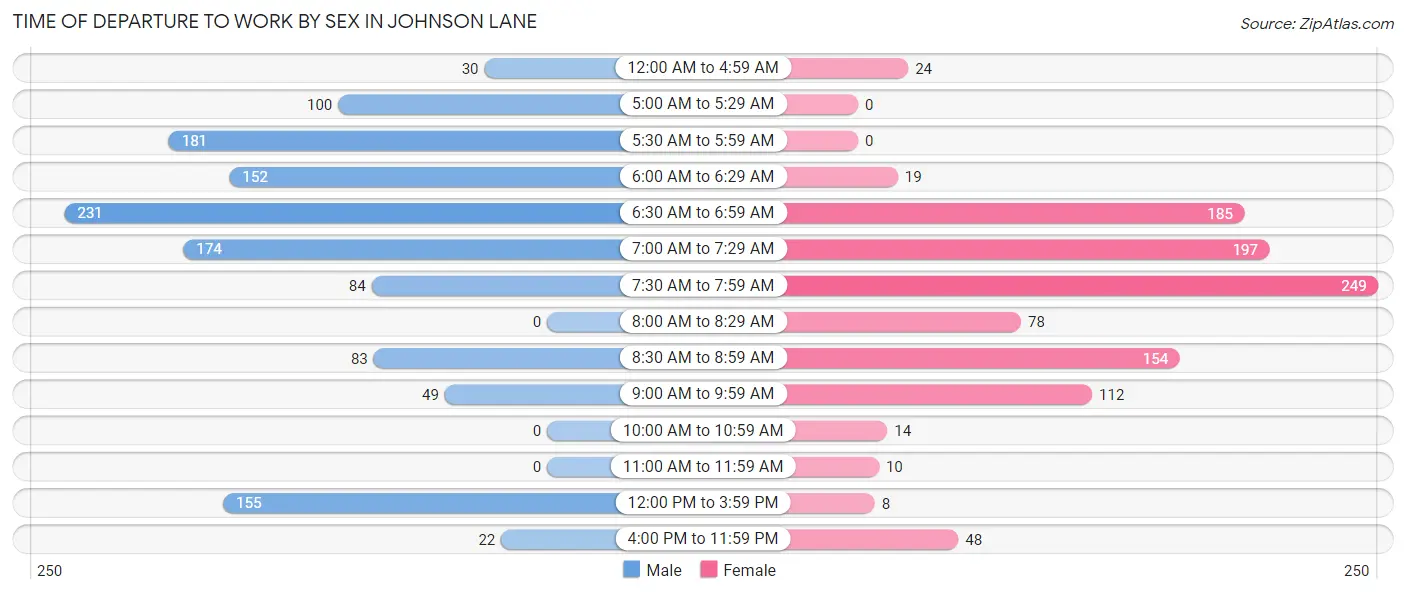
| Time of Departure | Male | Female |
| 12:00 AM to 4:59 AM | 30 (2.4%) | 24 (2.2%) |
| 5:00 AM to 5:29 AM | 100 (7.9%) | 0 (0.0%) |
| 5:30 AM to 5:59 AM | 181 (14.3%) | 0 (0.0%) |
| 6:00 AM to 6:29 AM | 152 (12.0%) | 19 (1.7%) |
| 6:30 AM to 6:59 AM | 231 (18.3%) | 185 (16.9%) |
| 7:00 AM to 7:29 AM | 174 (13.8%) | 197 (17.9%) |
| 7:30 AM to 7:59 AM | 84 (6.7%) | 249 (22.7%) |
| 8:00 AM to 8:29 AM | 0 (0.0%) | 78 (7.1%) |
| 8:30 AM to 8:59 AM | 83 (6.6%) | 154 (14.0%) |
| 9:00 AM to 9:59 AM | 49 (3.9%) | 112 (10.2%) |
| 10:00 AM to 10:59 AM | 0 (0.0%) | 14 (1.3%) |
| 11:00 AM to 11:59 AM | 0 (0.0%) | 10 (0.9%) |
| 12:00 PM to 3:59 PM | 155 (12.3%) | 8 (0.7%) |
| 4:00 PM to 11:59 PM | 22 (1.7%) | 48 (4.4%) |
| Total | 1,261 (100.0%) | 1,098 (100.0%) |
Housing Occupancy in Johnson Lane
Occupancy by Ownership in Johnson Lane
Of the total 2,652 dwellings in Johnson Lane, owner-occupied units account for 2,485 (93.7%), while renter-occupied units make up 167 (6.3%).
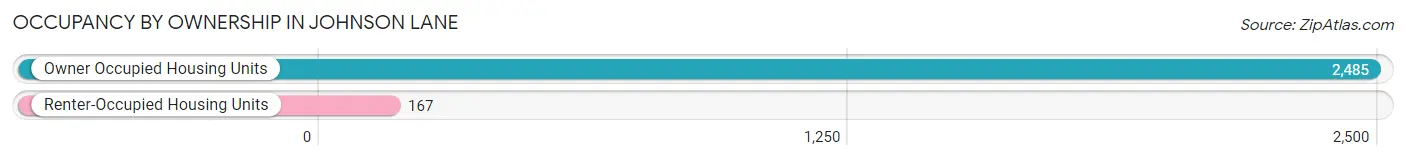
| Occupancy | # Housing Units | % Housing Units |
| Owner Occupied Housing Units | 2,485 | 93.7% |
| Renter-Occupied Housing Units | 167 | 6.3% |
| Total Occupied Housing Units | 2,652 | 100.0% |
Occupancy by Household Size in Johnson Lane
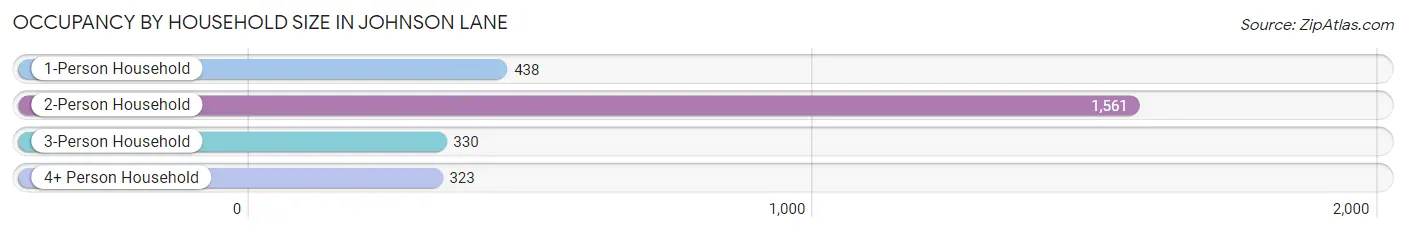
| Household Size | # Housing Units | % Housing Units |
| 1-Person Household | 438 | 16.5% |
| 2-Person Household | 1,561 | 58.9% |
| 3-Person Household | 330 | 12.4% |
| 4+ Person Household | 323 | 12.2% |
| Total Housing Units | 2,652 | 100.0% |
Occupancy by Ownership by Household Size in Johnson Lane
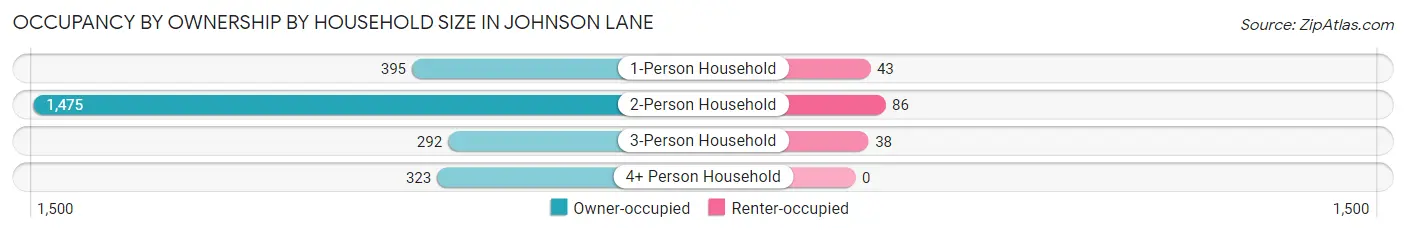
| Household Size | Owner-occupied | Renter-occupied |
| 1-Person Household | 395 (90.2%) | 43 (9.8%) |
| 2-Person Household | 1,475 (94.5%) | 86 (5.5%) |
| 3-Person Household | 292 (88.5%) | 38 (11.5%) |
| 4+ Person Household | 323 (100.0%) | 0 (0.0%) |
| Total Housing Units | 2,485 (93.7%) | 167 (6.3%) |
Occupancy by Educational Attainment in Johnson Lane
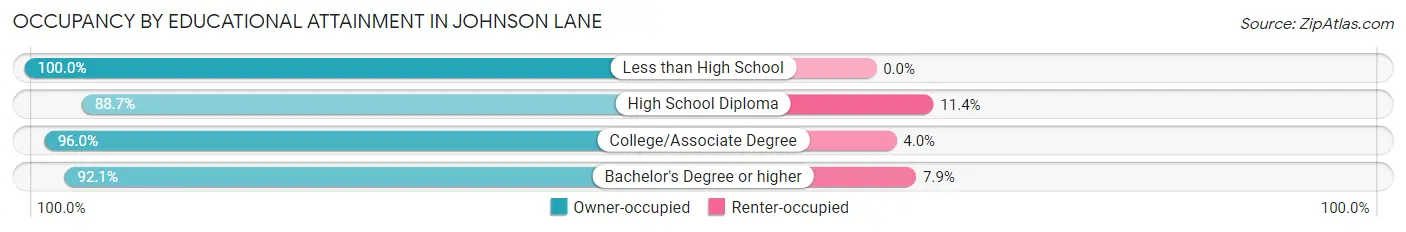
| Household Size | Owner-occupied | Renter-occupied |
| Less than High School | 113 (100.0%) | 0 (0.0%) |
| High School Diploma | 336 (88.6%) | 43 (11.4%) |
| College/Associate Degree | 1,152 (96.0%) | 48 (4.0%) |
| Bachelor's Degree or higher | 884 (92.1%) | 76 (7.9%) |
Occupancy by Age of Householder in Johnson Lane
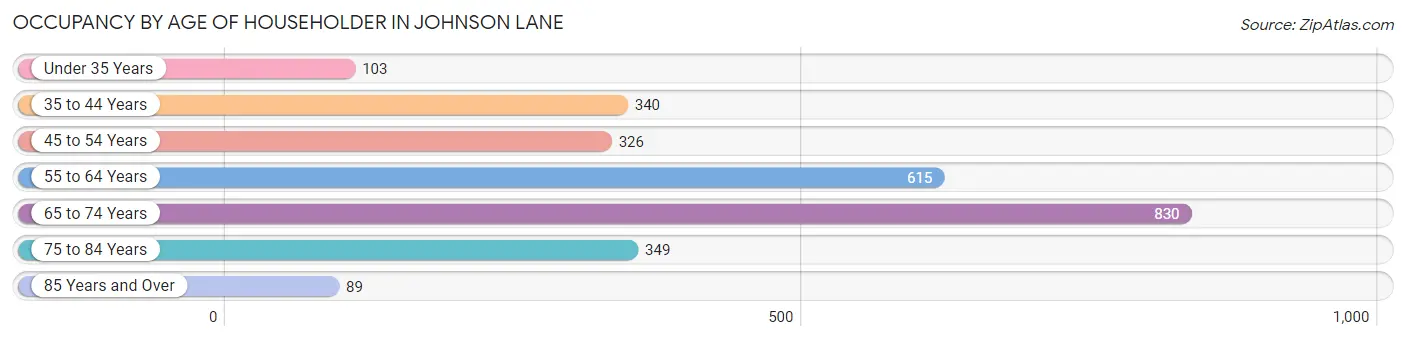
| Age Bracket | # Households | % Households |
| Under 35 Years | 103 | 3.9% |
| 35 to 44 Years | 340 | 12.8% |
| 45 to 54 Years | 326 | 12.3% |
| 55 to 64 Years | 615 | 23.2% |
| 65 to 74 Years | 830 | 31.3% |
| 75 to 84 Years | 349 | 13.2% |
| 85 Years and Over | 89 | 3.4% |
| Total | 2,652 | 100.0% |
Housing Finances in Johnson Lane
Median Income by Occupancy in Johnson Lane
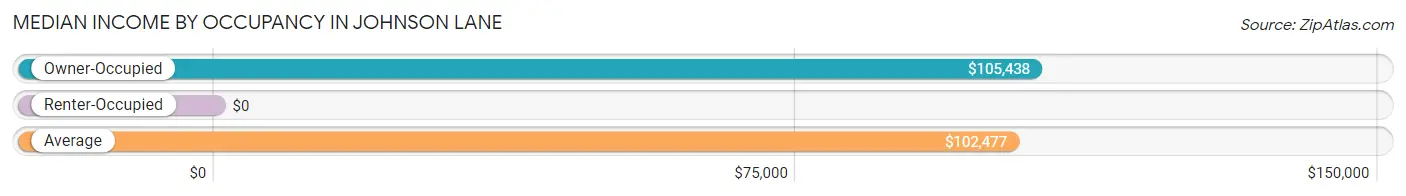
| Occupancy Type | # Households | Median Income |
| Owner-Occupied | 2,485 (93.7%) | $105,438 |
| Renter-Occupied | 167 (6.3%) | $0 |
| Average | 2,652 (100.0%) | $102,477 |
Occupancy by Householder Income Bracket in Johnson Lane
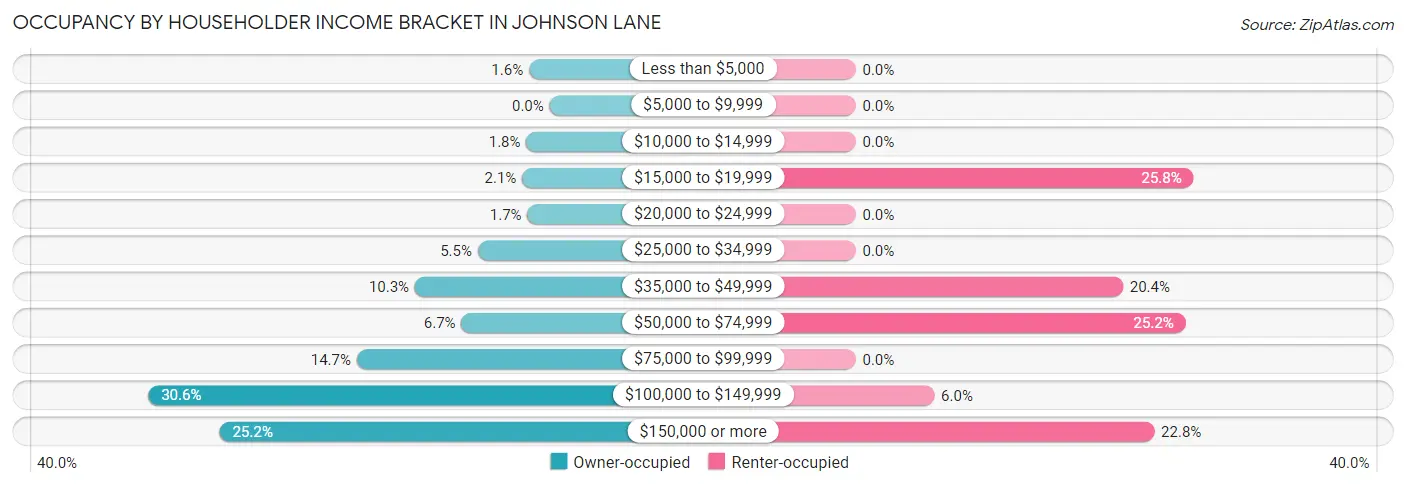
| Income Bracket | Owner-occupied | Renter-occupied |
| Less than $5,000 | 39 (1.6%) | 0 (0.0%) |
| $5,000 to $9,999 | 0 (0.0%) | 0 (0.0%) |
| $10,000 to $14,999 | 44 (1.8%) | 0 (0.0%) |
| $15,000 to $19,999 | 52 (2.1%) | 43 (25.8%) |
| $20,000 to $24,999 | 42 (1.7%) | 0 (0.0%) |
| $25,000 to $34,999 | 136 (5.5%) | 0 (0.0%) |
| $35,000 to $49,999 | 255 (10.3%) | 34 (20.4%) |
| $50,000 to $74,999 | 167 (6.7%) | 42 (25.2%) |
| $75,000 to $99,999 | 365 (14.7%) | 0 (0.0%) |
| $100,000 to $149,999 | 760 (30.6%) | 10 (6.0%) |
| $150,000 or more | 625 (25.2%) | 38 (22.8%) |
| Total | 2,485 (100.0%) | 167 (100.0%) |
Monthly Housing Cost Tiers in Johnson Lane
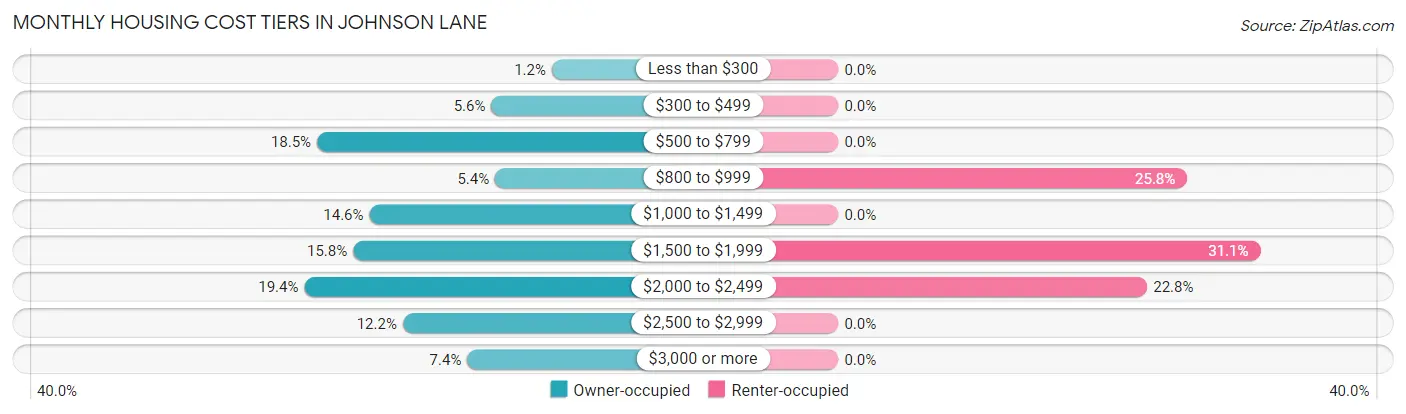
| Monthly Cost | Owner-occupied | Renter-occupied |
| Less than $300 | 29 (1.2%) | 0 (0.0%) |
| $300 to $499 | 140 (5.6%) | 0 (0.0%) |
| $500 to $799 | 459 (18.5%) | 0 (0.0%) |
| $800 to $999 | 133 (5.3%) | 43 (25.8%) |
| $1,000 to $1,499 | 363 (14.6%) | 0 (0.0%) |
| $1,500 to $1,999 | 393 (15.8%) | 52 (31.1%) |
| $2,000 to $2,499 | 482 (19.4%) | 38 (22.8%) |
| $2,500 to $2,999 | 302 (12.1%) | 0 (0.0%) |
| $3,000 or more | 184 (7.4%) | 0 (0.0%) |
| Total | 2,485 (100.0%) | 167 (100.0%) |
Physical Housing Characteristics in Johnson Lane
Housing Structures in Johnson Lane
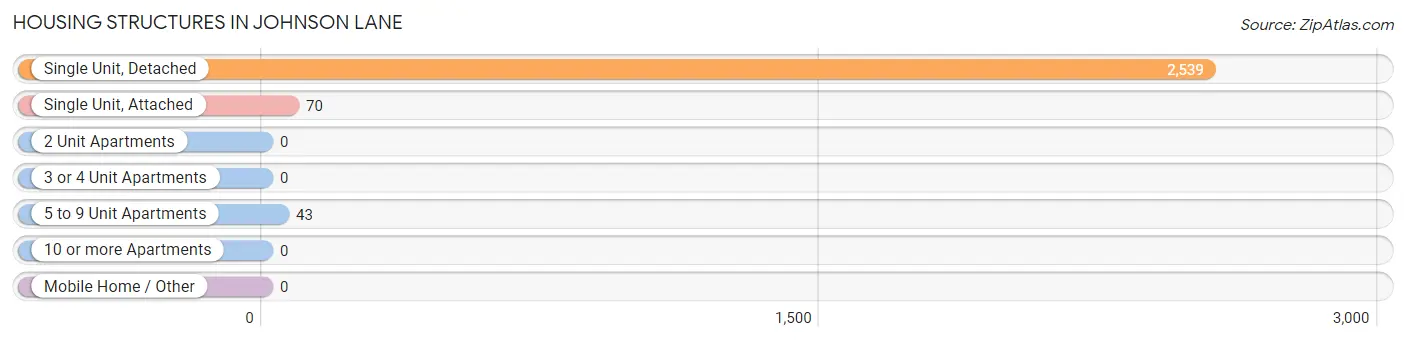
| Structure Type | # Housing Units | % Housing Units |
| Single Unit, Detached | 2,539 | 95.7% |
| Single Unit, Attached | 70 | 2.6% |
| 2 Unit Apartments | 0 | 0.0% |
| 3 or 4 Unit Apartments | 0 | 0.0% |
| 5 to 9 Unit Apartments | 43 | 1.6% |
| 10 or more Apartments | 0 | 0.0% |
| Mobile Home / Other | 0 | 0.0% |
| Total | 2,652 | 100.0% |
Housing Structures by Occupancy in Johnson Lane
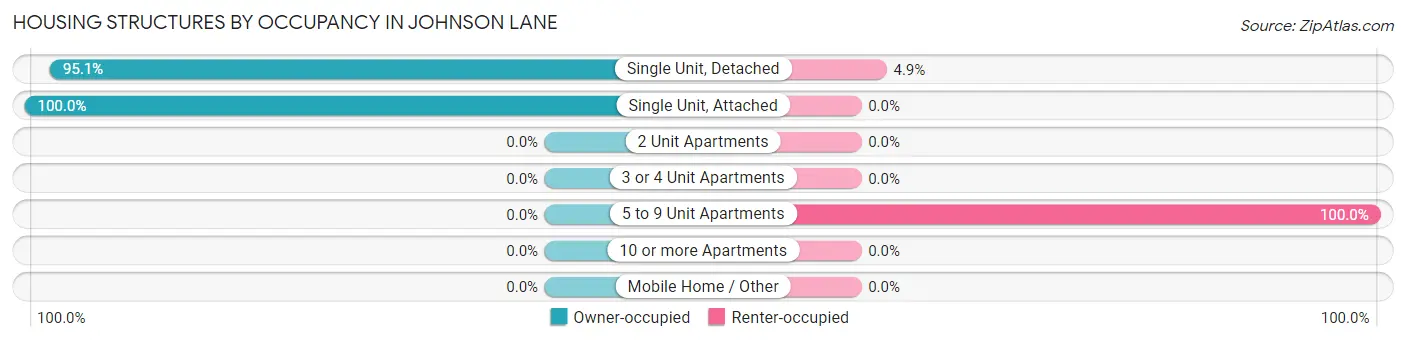
| Structure Type | Owner-occupied | Renter-occupied |
| Single Unit, Detached | 2,415 (95.1%) | 124 (4.9%) |
| Single Unit, Attached | 70 (100.0%) | 0 (0.0%) |
| 2 Unit Apartments | 0 (0.0%) | 0 (0.0%) |
| 3 or 4 Unit Apartments | 0 (0.0%) | 0 (0.0%) |
| 5 to 9 Unit Apartments | 0 (0.0%) | 43 (100.0%) |
| 10 or more Apartments | 0 (0.0%) | 0 (0.0%) |
| Mobile Home / Other | 0 (0.0%) | 0 (0.0%) |
| Total | 2,485 (93.7%) | 167 (6.3%) |
Housing Structures by Number of Rooms in Johnson Lane
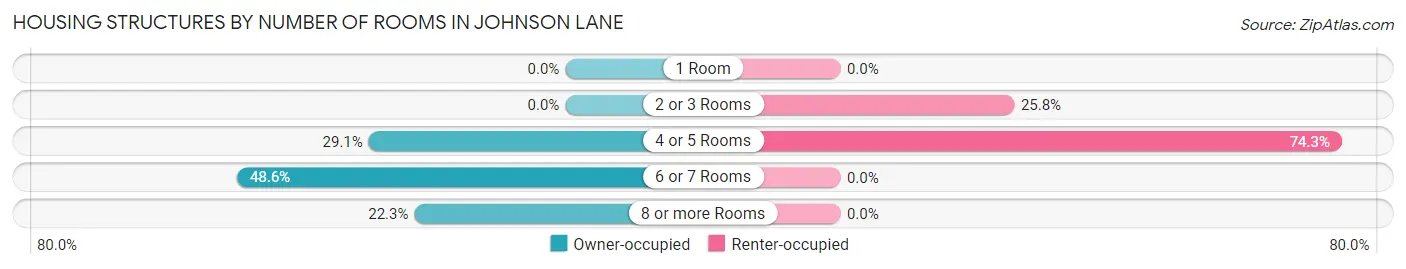
| Number of Rooms | Owner-occupied | Renter-occupied |
| 1 Room | 0 (0.0%) | 0 (0.0%) |
| 2 or 3 Rooms | 0 (0.0%) | 43 (25.8%) |
| 4 or 5 Rooms | 723 (29.1%) | 124 (74.3%) |
| 6 or 7 Rooms | 1,207 (48.6%) | 0 (0.0%) |
| 8 or more Rooms | 555 (22.3%) | 0 (0.0%) |
| Total | 2,485 (100.0%) | 167 (100.0%) |
Housing Structure by Heating Type in Johnson Lane
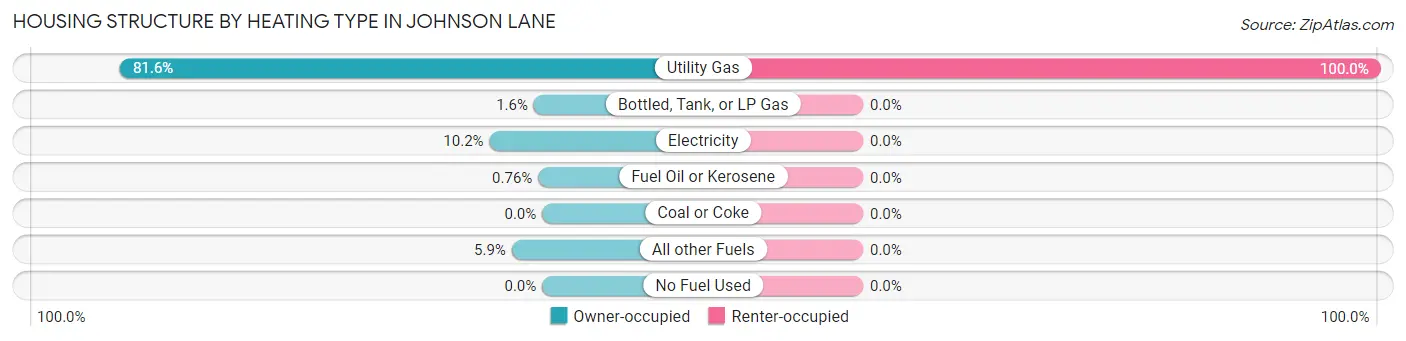
| Heating Type | Owner-occupied | Renter-occupied |
| Utility Gas | 2,027 (81.6%) | 167 (100.0%) |
| Bottled, Tank, or LP Gas | 40 (1.6%) | 0 (0.0%) |
| Electricity | 253 (10.2%) | 0 (0.0%) |
| Fuel Oil or Kerosene | 19 (0.8%) | 0 (0.0%) |
| Coal or Coke | 0 (0.0%) | 0 (0.0%) |
| All other Fuels | 146 (5.9%) | 0 (0.0%) |
| No Fuel Used | 0 (0.0%) | 0 (0.0%) |
| Total | 2,485 (100.0%) | 167 (100.0%) |
Household Vehicle Usage in Johnson Lane
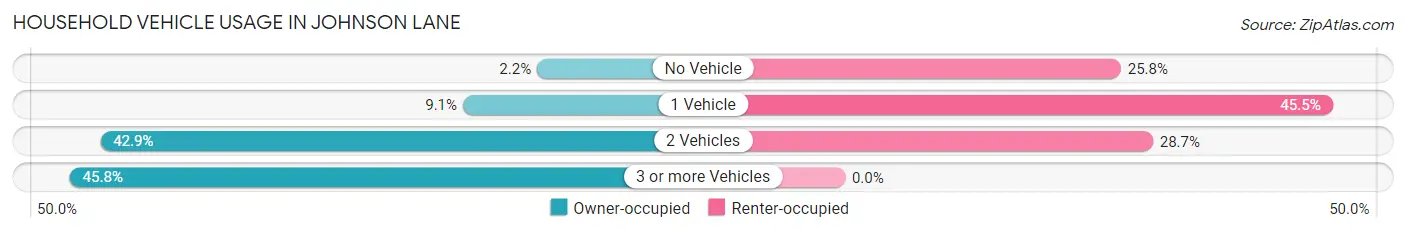
| Vehicles per Household | Owner-occupied | Renter-occupied |
| No Vehicle | 54 (2.2%) | 43 (25.8%) |
| 1 Vehicle | 226 (9.1%) | 76 (45.5%) |
| 2 Vehicles | 1,067 (42.9%) | 48 (28.7%) |
| 3 or more Vehicles | 1,138 (45.8%) | 0 (0.0%) |
| Total | 2,485 (100.0%) | 167 (100.0%) |
Real Estate & Mortgages in Johnson Lane
Real Estate and Mortgage Overview in Johnson Lane
| Characteristic | Without Mortgage | With Mortgage |
| Housing Units | 799 | 1,686 |
| Median Property Value | $694,600 | $626,100 |
| Median Household Income | $82,163 | $452 |
| Monthly Housing Costs | $696 | $172 |
| Real Estate Taxes | $3,231 | $31 |
Property Value by Mortgage Status in Johnson Lane
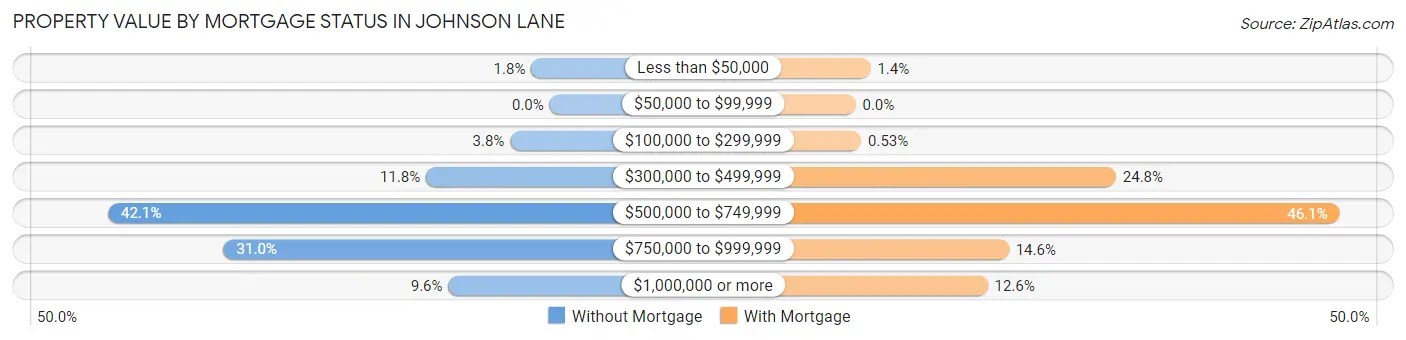
| Property Value | Without Mortgage | With Mortgage |
| Less than $50,000 | 14 (1.8%) | 24 (1.4%) |
| $50,000 to $99,999 | 0 (0.0%) | 0 (0.0%) |
| $100,000 to $299,999 | 30 (3.7%) | 9 (0.5%) |
| $300,000 to $499,999 | 94 (11.8%) | 418 (24.8%) |
| $500,000 to $749,999 | 336 (42.0%) | 777 (46.1%) |
| $750,000 to $999,999 | 248 (31.0%) | 246 (14.6%) |
| $1,000,000 or more | 77 (9.6%) | 212 (12.6%) |
| Total | 799 (100.0%) | 1,686 (100.0%) |
Household Income by Mortgage Status in Johnson Lane
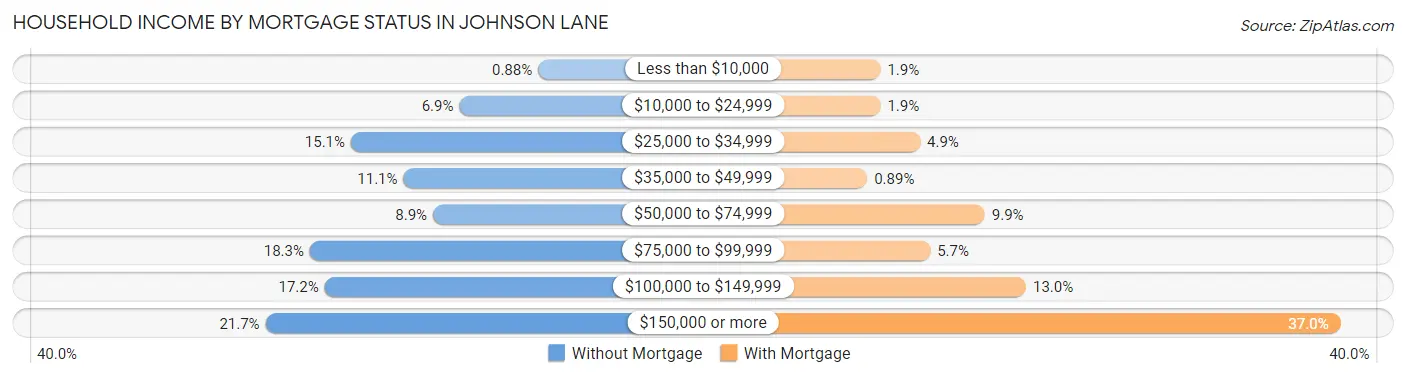
| Household Income | Without Mortgage | With Mortgage |
| Less than $10,000 | 7 (0.9%) | 32 (1.9%) |
| $10,000 to $24,999 | 55 (6.9%) | 32 (1.9%) |
| $25,000 to $34,999 | 121 (15.1%) | 83 (4.9%) |
| $35,000 to $49,999 | 89 (11.1%) | 15 (0.9%) |
| $50,000 to $74,999 | 71 (8.9%) | 166 (9.9%) |
| $75,000 to $99,999 | 146 (18.3%) | 96 (5.7%) |
| $100,000 to $149,999 | 137 (17.2%) | 219 (13.0%) |
| $150,000 or more | 173 (21.6%) | 623 (36.9%) |
| Total | 799 (100.0%) | 1,686 (100.0%) |
Property Value to Household Income Ratio in Johnson Lane
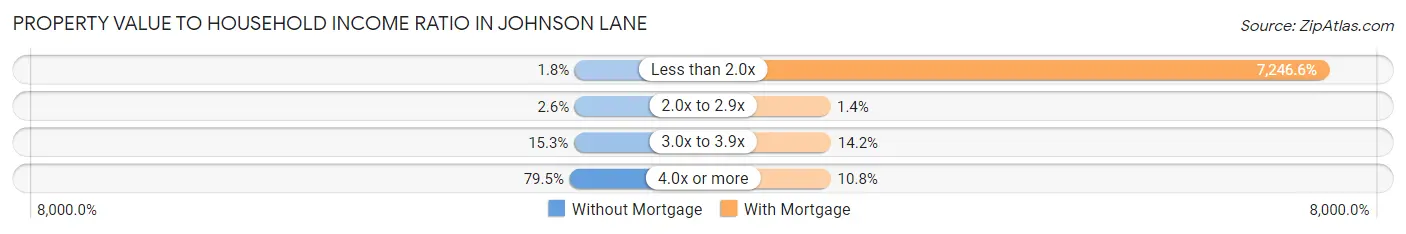
| Value-to-Income Ratio | Without Mortgage | With Mortgage |
| Less than 2.0x | 14 (1.8%) | 122,177 (7,246.6%) |
| 2.0x to 2.9x | 21 (2.6%) | 24 (1.4%) |
| 3.0x to 3.9x | 122 (15.3%) | 239 (14.2%) |
| 4.0x or more | 635 (79.5%) | 182 (10.8%) |
| Total | 799 (100.0%) | 1,686 (100.0%) |
Real Estate Taxes by Mortgage Status in Johnson Lane
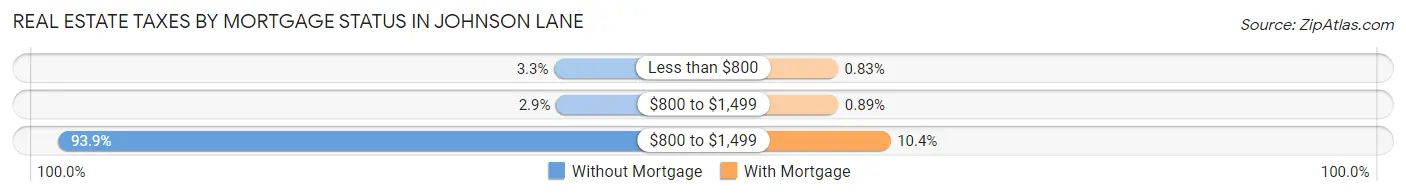
| Property Taxes | Without Mortgage | With Mortgage |
| Less than $800 | 26 (3.3%) | 14 (0.8%) |
| $800 to $1,499 | 23 (2.9%) | 15 (0.9%) |
| $800 to $1,499 | 750 (93.9%) | 176 (10.4%) |
| Total | 799 (100.0%) | 1,686 (100.0%) |
Health & Disability in Johnson Lane
Health Insurance Coverage by Age in Johnson Lane
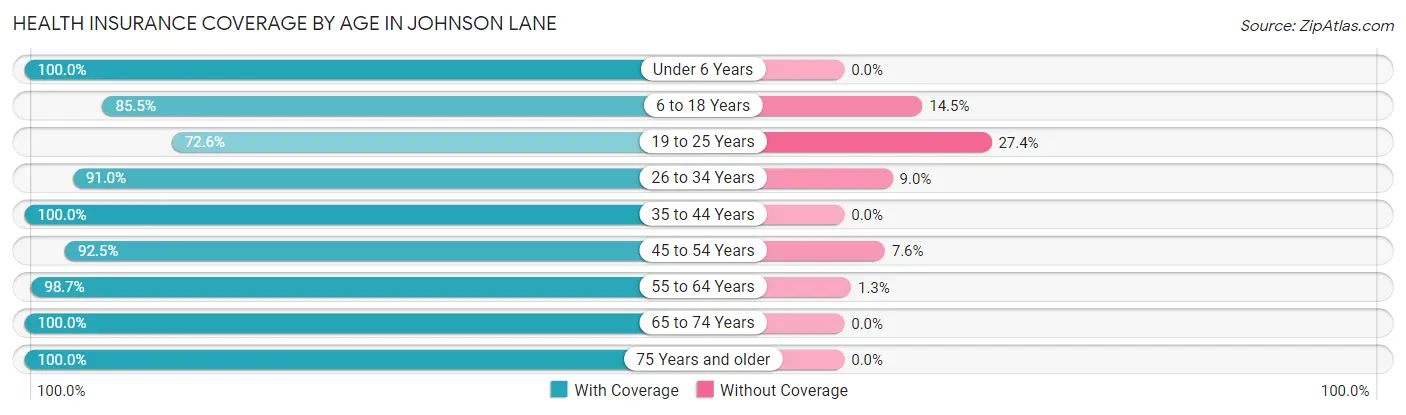
| Age Bracket | With Coverage | Without Coverage |
| Under 6 Years | 283 (100.0%) | 0 (0.0%) |
| 6 to 18 Years | 629 (85.5%) | 107 (14.5%) |
| 19 to 25 Years | 201 (72.6%) | 76 (27.4%) |
| 26 to 34 Years | 313 (91.0%) | 31 (9.0%) |
| 35 to 44 Years | 700 (100.0%) | 0 (0.0%) |
| 45 to 54 Years | 563 (92.4%) | 46 (7.5%) |
| 55 to 64 Years | 1,171 (98.7%) | 15 (1.3%) |
| 65 to 74 Years | 1,425 (100.0%) | 0 (0.0%) |
| 75 Years and older | 861 (100.0%) | 0 (0.0%) |
| Total | 6,146 (95.7%) | 275 (4.3%) |
Health Insurance Coverage by Citizenship Status in Johnson Lane
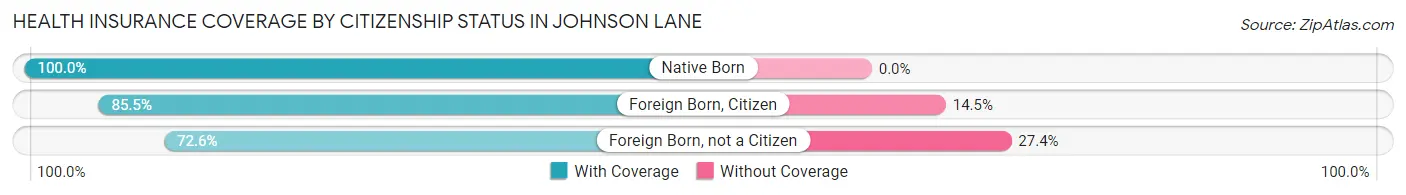
| Citizenship Status | With Coverage | Without Coverage |
| Native Born | 283 (100.0%) | 0 (0.0%) |
| Foreign Born, Citizen | 629 (85.5%) | 107 (14.5%) |
| Foreign Born, not a Citizen | 201 (72.6%) | 76 (27.4%) |
Health Insurance Coverage by Household Income in Johnson Lane
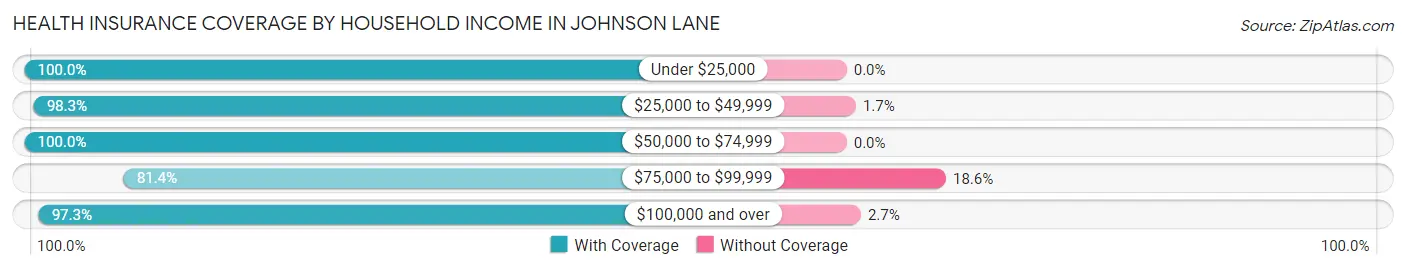
| Household Income | With Coverage | Without Coverage |
| Under $25,000 | 393 (100.0%) | 0 (0.0%) |
| $25,000 to $49,999 | 743 (98.3%) | 13 (1.7%) |
| $50,000 to $74,999 | 408 (100.0%) | 0 (0.0%) |
| $75,000 to $99,999 | 679 (81.4%) | 155 (18.6%) |
| $100,000 and over | 3,923 (97.3%) | 107 (2.7%) |
Public vs Private Health Insurance Coverage by Age in Johnson Lane
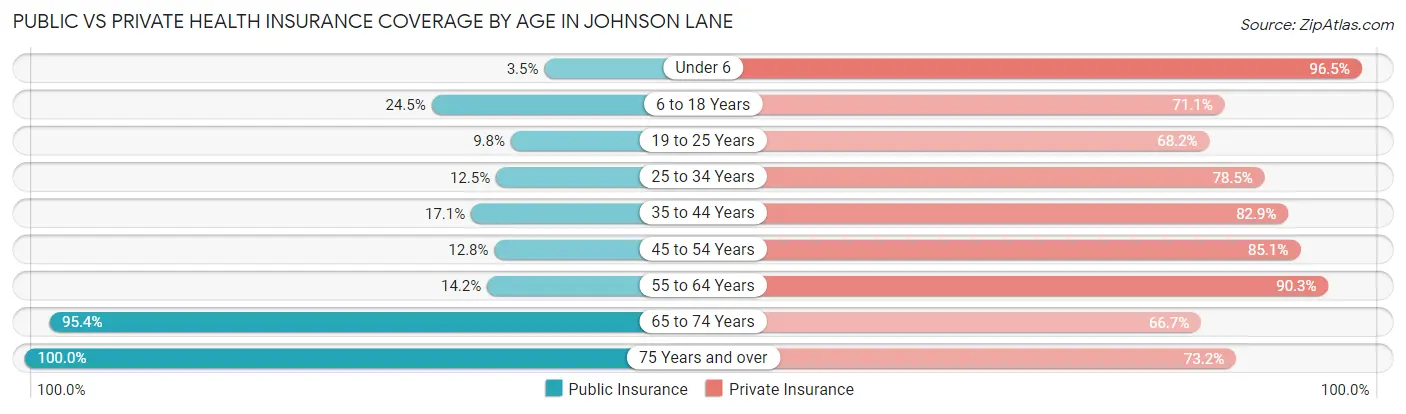
| Age Bracket | Public Insurance | Private Insurance |
| Under 6 | 10 (3.5%) | 273 (96.5%) |
| 6 to 18 Years | 180 (24.5%) | 523 (71.1%) |
| 19 to 25 Years | 27 (9.8%) | 189 (68.2%) |
| 25 to 34 Years | 43 (12.5%) | 270 (78.5%) |
| 35 to 44 Years | 120 (17.1%) | 580 (82.9%) |
| 45 to 54 Years | 78 (12.8%) | 518 (85.1%) |
| 55 to 64 Years | 168 (14.2%) | 1,071 (90.3%) |
| 65 to 74 Years | 1,360 (95.4%) | 950 (66.7%) |
| 75 Years and over | 861 (100.0%) | 630 (73.2%) |
| Total | 2,847 (44.3%) | 5,004 (77.9%) |
Disability Status by Sex by Age in Johnson Lane
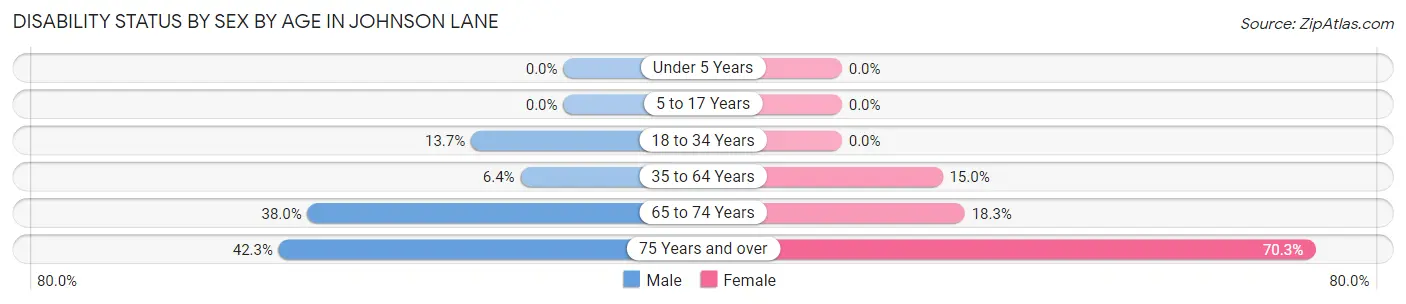
| Age Bracket | Male | Female |
| Under 5 Years | 0 (0.0%) | 0 (0.0%) |
| 5 to 17 Years | 0 (0.0%) | 0 (0.0%) |
| 18 to 34 Years | 71 (13.7%) | 0 (0.0%) |
| 35 to 64 Years | 72 (6.4%) | 204 (14.9%) |
| 65 to 74 Years | 250 (38.0%) | 140 (18.2%) |
| 75 Years and over | 199 (42.2%) | 274 (70.3%) |
Disability Class by Sex by Age in Johnson Lane
Disability Class: Hearing Difficulty
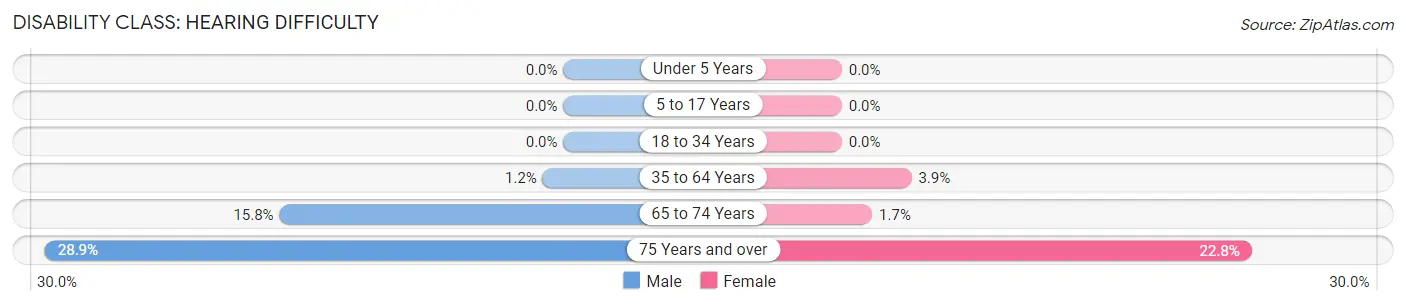
| Age Bracket | Male | Female |
| Under 5 Years | 0 (0.0%) | 0 (0.0%) |
| 5 to 17 Years | 0 (0.0%) | 0 (0.0%) |
| 18 to 34 Years | 0 (0.0%) | 0 (0.0%) |
| 35 to 64 Years | 13 (1.1%) | 53 (3.9%) |
| 65 to 74 Years | 104 (15.8%) | 13 (1.7%) |
| 75 Years and over | 136 (28.9%) | 89 (22.8%) |
Disability Class: Vision Difficulty
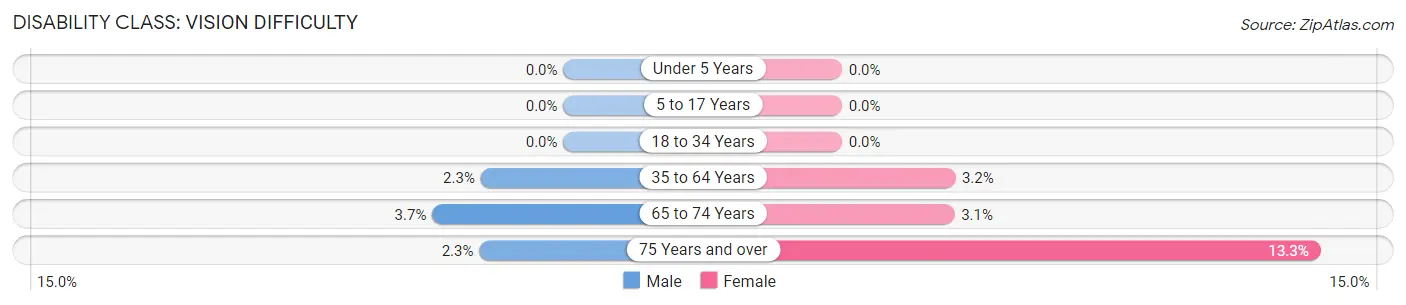
| Age Bracket | Male | Female |
| Under 5 Years | 0 (0.0%) | 0 (0.0%) |
| 5 to 17 Years | 0 (0.0%) | 0 (0.0%) |
| 18 to 34 Years | 0 (0.0%) | 0 (0.0%) |
| 35 to 64 Years | 26 (2.3%) | 43 (3.2%) |
| 65 to 74 Years | 24 (3.6%) | 24 (3.1%) |
| 75 Years and over | 11 (2.3%) | 52 (13.3%) |
Disability Class: Cognitive Difficulty
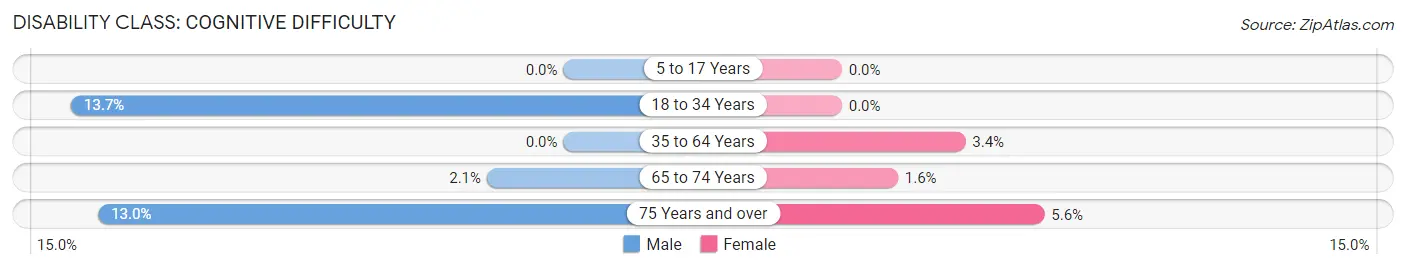
| Age Bracket | Male | Female |
| 5 to 17 Years | 0 (0.0%) | 0 (0.0%) |
| 18 to 34 Years | 71 (13.7%) | 0 (0.0%) |
| 35 to 64 Years | 0 (0.0%) | 47 (3.4%) |
| 65 to 74 Years | 14 (2.1%) | 12 (1.6%) |
| 75 Years and over | 61 (13.0%) | 22 (5.6%) |
Disability Class: Ambulatory Difficulty
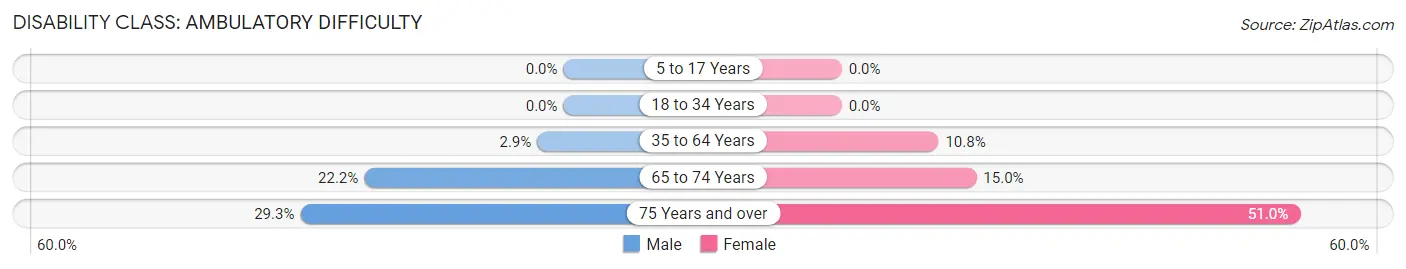
| Age Bracket | Male | Female |
| 5 to 17 Years | 0 (0.0%) | 0 (0.0%) |
| 18 to 34 Years | 0 (0.0%) | 0 (0.0%) |
| 35 to 64 Years | 33 (2.9%) | 147 (10.8%) |
| 65 to 74 Years | 146 (22.2%) | 115 (15.0%) |
| 75 Years and over | 138 (29.3%) | 199 (51.0%) |
Disability Class: Self-Care Difficulty
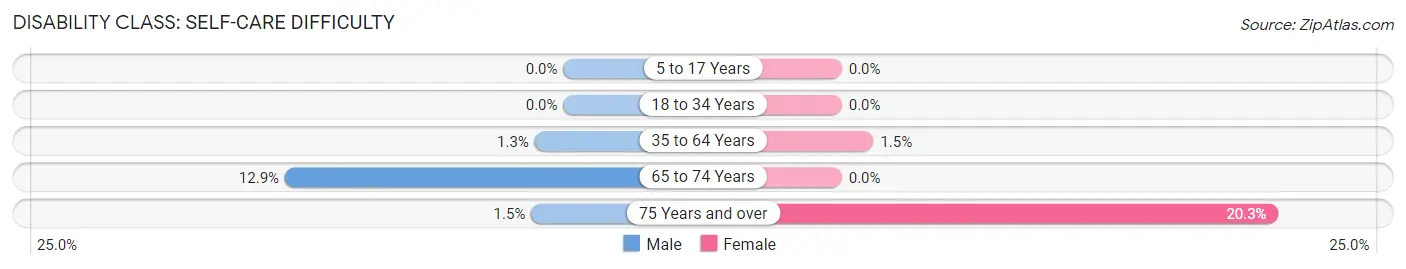
| Age Bracket | Male | Female |
| 5 to 17 Years | 0 (0.0%) | 0 (0.0%) |
| 18 to 34 Years | 0 (0.0%) | 0 (0.0%) |
| 35 to 64 Years | 15 (1.3%) | 20 (1.5%) |
| 65 to 74 Years | 85 (12.9%) | 0 (0.0%) |
| 75 Years and over | 7 (1.5%) | 79 (20.3%) |
Technology Access in Johnson Lane
Computing Device Access in Johnson Lane
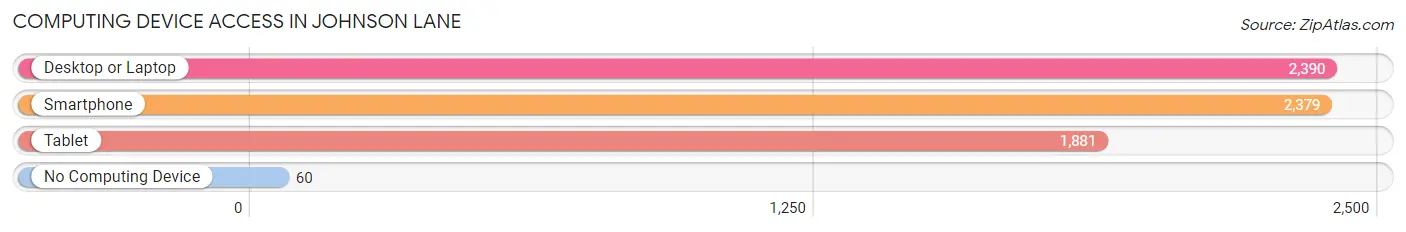
| Device Type | # Households | % Households |
| Desktop or Laptop | 2,390 | 90.1% |
| Smartphone | 2,379 | 89.7% |
| Tablet | 1,881 | 70.9% |
| No Computing Device | 60 | 2.3% |
| Total | 2,652 | 100.0% |
Internet Access in Johnson Lane
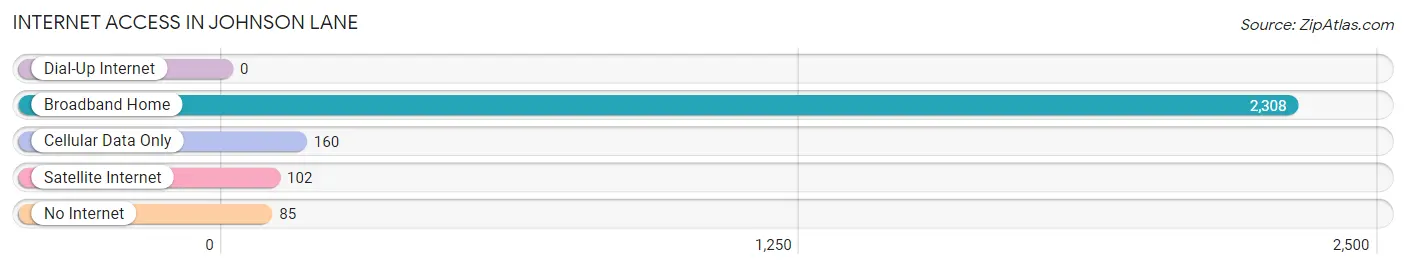
| Internet Type | # Households | % Households |
| Dial-Up Internet | 0 | 0.0% |
| Broadband Home | 2,308 | 87.0% |
| Cellular Data Only | 160 | 6.0% |
| Satellite Internet | 102 | 3.8% |
| No Internet | 85 | 3.2% |
| Total | 2,652 | 100.0% |
Johnson Lane Summary
John Lane, NV is a small unincorporated community located in the northern part of the state of Nevada. It is situated in the Humboldt County, approximately 20 miles south of the city of Winnemucca. The population of John Lane, NV was estimated to be around 200 people in 2020.
History
John Lane, NV was founded in the late 1800s by John Lane, a rancher and miner. He was one of the first settlers in the area and established a ranch and a small mining operation. The town was named after him and has remained a small, rural community ever since.
The town was originally a stop on the Central Pacific Railroad, which ran through the area in the late 1800s. The railroad was a major factor in the development of the town, as it provided a means of transportation for goods and people.
Geography
John Lane, NV is located in the northern part of the state of Nevada, in Humboldt County. It is situated in the Humboldt Valley, which is a large, flat valley surrounded by mountains. The town is located at an elevation of 4,000 feet above sea level.
The climate in John Lane, NV is semi-arid, with hot summers and cold winters. The average annual temperature is around 50 degrees Fahrenheit. The area receives an average of 8 inches of precipitation per year.
Economy
John Lane, NV is a small, rural community with a limited economy. The primary industry in the area is ranching and farming. The town also has a few small businesses, such as a gas station, a grocery store, and a few restaurants.
The town is also home to a few tourist attractions, such as the John Lane Museum, which is dedicated to the history of the town and its founder. The museum is open to the public and offers a variety of exhibits and activities.
Demographics
John Lane, NV has a population of around 200 people. The racial makeup of the town is predominantly white, with a small percentage of Hispanic and Native American residents. The median household income in the town is around $35,000.
The town has a high rate of poverty, with around 25% of the population living below the poverty line. The unemployment rate in the town is also high, with around 10% of the population unemployed.
Conclusion
John Lane, NV is a small, rural community located in the northern part of the state of Nevada. It was founded in the late 1800s by John Lane, a rancher and miner. The town has a population of around 200 people and is primarily a ranching and farming community. The town also has a few small businesses and tourist attractions. The town has a high rate of poverty and unemployment.
Common Questions
What is Per Capita Income in Johnson Lane?
Per Capita income in Johnson Lane is $50,850.
What is the Median Family Income in Johnson Lane?
Median Family Income in Johnson Lane is $118,084.
What is the Median Household income in Johnson Lane?
Median Household Income in Johnson Lane is $102,477.
What is Income or Wage Gap in Johnson Lane?
Income or Wage Gap in Johnson Lane is 30.1%.
Women in Johnson Lane earn 69.9 cents for every dollar earned by a man.
What is Inequality or Gini Index in Johnson Lane?
Inequality or Gini Index in Johnson Lane is 0.40.
What is the Total Population of Johnson Lane?
Total Population of Johnson Lane is 6,499.
What is the Total Male Population of Johnson Lane?
Total Male Population of Johnson Lane is 3,179.
What is the Total Female Population of Johnson Lane?
Total Female Population of Johnson Lane is 3,320.
What is the Ratio of Males per 100 Females in Johnson Lane?
There are 95.75 Males per 100 Females in Johnson Lane.
What is the Ratio of Females per 100 Males in Johnson Lane?
There are 104.44 Females per 100 Males in Johnson Lane.
What is the Median Population Age in Johnson Lane?
Median Population Age in Johnson Lane is 57.9 Years.
What is the Average Family Size in Johnson Lane
Average Family Size in Johnson Lane is 2.7 People.
What is the Average Household Size in Johnson Lane
Average Household Size in Johnson Lane is 2.5 People.
How Large is the Labor Force in Johnson Lane?
There are 2,599 People in the Labor Forcein in Johnson Lane.
What is the Percentage of People in the Labor Force in Johnson Lane?
44.2% of People are in the Labor Force in Johnson Lane.