Fish Springs, NV Map & Demographics
Fish Springs Map
Fish Springs Overview
$42,610
PER CAPITA INCOME
$104,375
AVG FAMILY INCOME
$95,795
AVG HOUSEHOLD INCOME
70.4%
WAGE / INCOME GAP [ % ]
29.6¢/ $1
WAGE / INCOME GAP [ $ ]
0.34
INEQUALITY / GINI INDEX
549
TOTAL POPULATION
276
MALE POPULATION
273
FEMALE POPULATION
101.10
MALES / 100 FEMALES
98.91
FEMALES / 100 MALES
59.0
MEDIAN AGE
2.7
AVG FAMILY SIZE
2.4
AVG HOUSEHOLD SIZE
215
LABOR FORCE [ PEOPLE ]
44.1%
PERCENT IN LABOR FORCE
1.4%
UNEMPLOYMENT RATE
Income in Fish Springs
Income Overview in Fish Springs
Per Capita Income in Fish Springs is $42,610, while median incomes of families and households are $104,375 and $95,795 respectively.
| Characteristic | Number | Measure |
| Per Capita Income | 549 | $42,610 |
| Median Family Income | 163 | $104,375 |
| Mean Family Income | 163 | $120,512 |
| Median Household Income | 225 | $95,795 |
| Mean Household Income | 225 | $102,568 |
| Income Deficit | 163 | $0 |
| Wage / Income Gap (%) | 549 | 70.36% |
| Wage / Income Gap ($) | 549 | 29.64¢ per $1 |
| Gini / Inequality Index | 549 | 0.34 |
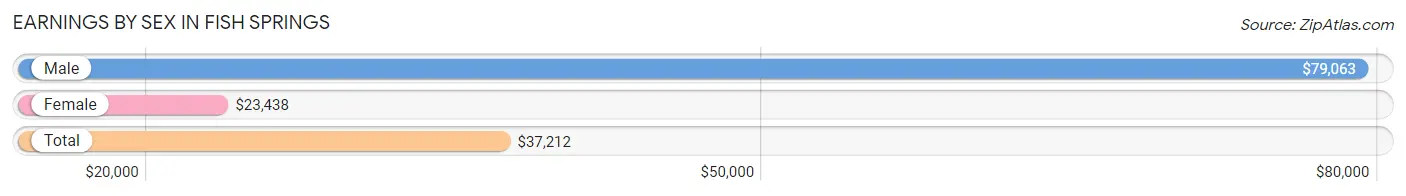
Earnings by Sex in Fish Springs
Average Earnings in Fish Springs are $37,212, $79,063 for men and $23,438 for women, a difference of 70.4%.
| Sex | Number | Average Earnings |
| Male | 133 (58.1%) | $79,063 |
| Female | 96 (41.9%) | $23,438 |
| Total | 229 (100.0%) | $37,212 |
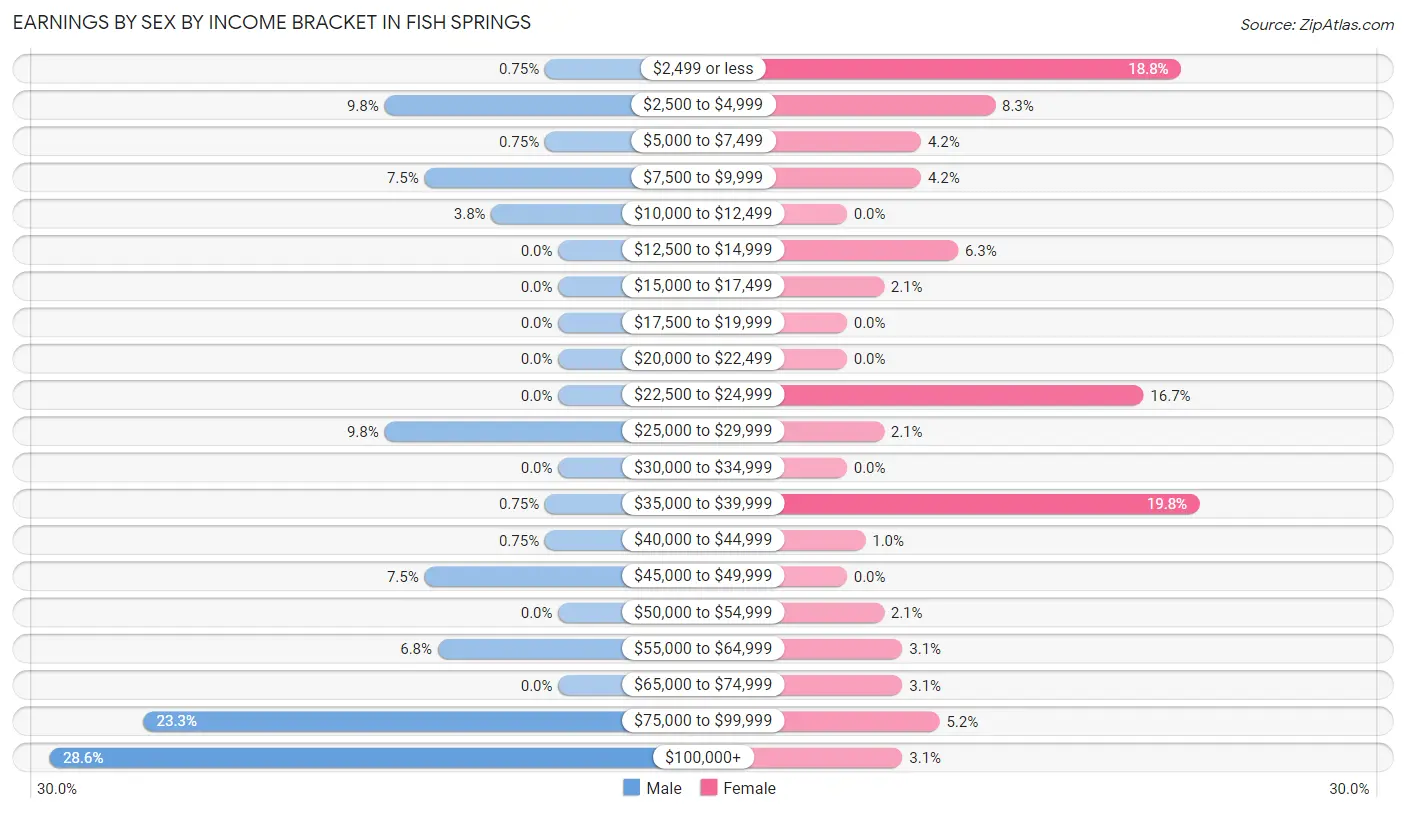
Earnings by Sex by Income Bracket in Fish Springs
The most common earnings brackets in Fish Springs are $100,000+ for men (38 | 28.6%) and $35,000 to $39,999 for women (19 | 19.8%).
| Income | Male | Female |
| $2,499 or less | 1 (0.7%) | 18 (18.8%) |
| $2,500 to $4,999 | 13 (9.8%) | 8 (8.3%) |
| $5,000 to $7,499 | 1 (0.7%) | 4 (4.2%) |
| $7,500 to $9,999 | 10 (7.5%) | 4 (4.2%) |
| $10,000 to $12,499 | 5 (3.8%) | 0 (0.0%) |
| $12,500 to $14,999 | 0 (0.0%) | 6 (6.2%) |
| $15,000 to $17,499 | 0 (0.0%) | 2 (2.1%) |
| $17,500 to $19,999 | 0 (0.0%) | 0 (0.0%) |
| $20,000 to $22,499 | 0 (0.0%) | 0 (0.0%) |
| $22,500 to $24,999 | 0 (0.0%) | 16 (16.7%) |
| $25,000 to $29,999 | 13 (9.8%) | 2 (2.1%) |
| $30,000 to $34,999 | 0 (0.0%) | 0 (0.0%) |
| $35,000 to $39,999 | 1 (0.7%) | 19 (19.8%) |
| $40,000 to $44,999 | 1 (0.7%) | 1 (1.0%) |
| $45,000 to $49,999 | 10 (7.5%) | 0 (0.0%) |
| $50,000 to $54,999 | 0 (0.0%) | 2 (2.1%) |
| $55,000 to $64,999 | 9 (6.8%) | 3 (3.1%) |
| $65,000 to $74,999 | 0 (0.0%) | 3 (3.1%) |
| $75,000 to $99,999 | 31 (23.3%) | 5 (5.2%) |
| $100,000+ | 38 (28.6%) | 3 (3.1%) |
| Total | 133 (100.0%) | 96 (100.0%) |
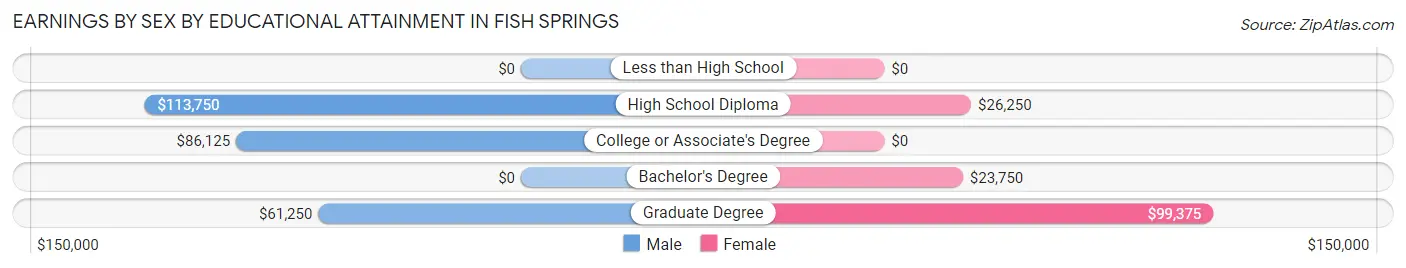
Earnings by Sex by Educational Attainment in Fish Springs
Average earnings in Fish Springs are $92,721 for men and $24,766 for women, a difference of 73.3%. Men with an educational attainment of high school diploma enjoy the highest average annual earnings of $113,750, while those with graduate degree education earn the least with $61,250. Women with an educational attainment of graduate degree earn the most with the average annual earnings of $99,375, while those with bachelor's degree education have the smallest earnings of $23,750.
| Educational Attainment | Male Income | Female Income |
| Less than High School | - | - |
| High School Diploma | $113,750 | $26,250 |
| College or Associate's Degree | $86,125 | $0 |
| Bachelor's Degree | - | - |
| Graduate Degree | $61,250 | $99,375 |
| Total | $92,721 | $24,766 |
Family Income in Fish Springs
Family Income Brackets in Fish Springs
According to the Fish Springs family income data, there are 55 families falling into the $100,000 to $149,999 income range, which is the most common income bracket and makes up 33.7% of all families.
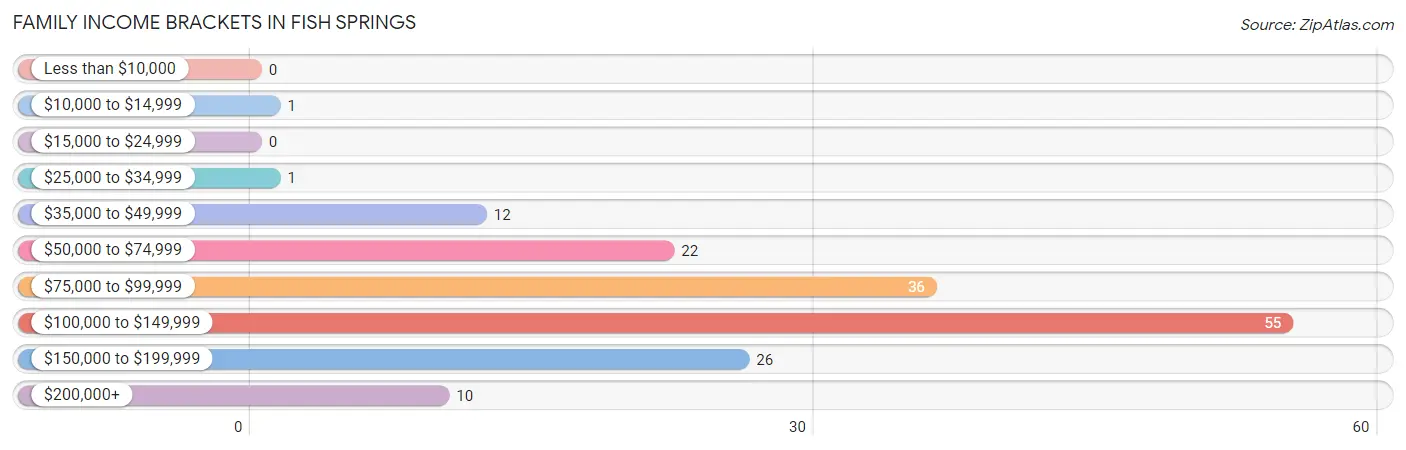
| Income Bracket | # Families | % Families |
| Less than $10,000 | 0 | 0.0% |
| $10,000 to $14,999 | 1 | 0.6% |
| $15,000 to $24,999 | 0 | 0.0% |
| $25,000 to $34,999 | 1 | 0.6% |
| $35,000 to $49,999 | 12 | 7.4% |
| $50,000 to $74,999 | 22 | 13.5% |
| $75,000 to $99,999 | 36 | 22.1% |
| $100,000 to $149,999 | 55 | 33.7% |
| $150,000 to $199,999 | 26 | 16.0% |
| $200,000+ | 10 | 6.1% |
Family Income by Famaliy Size in Fish Springs
2-person families (94 | 57.7%) account for the highest median family income in Fish Springs with $120,500 per family, while 2-person families (94 | 57.7%) have the highest median income of $60,250 per family member.
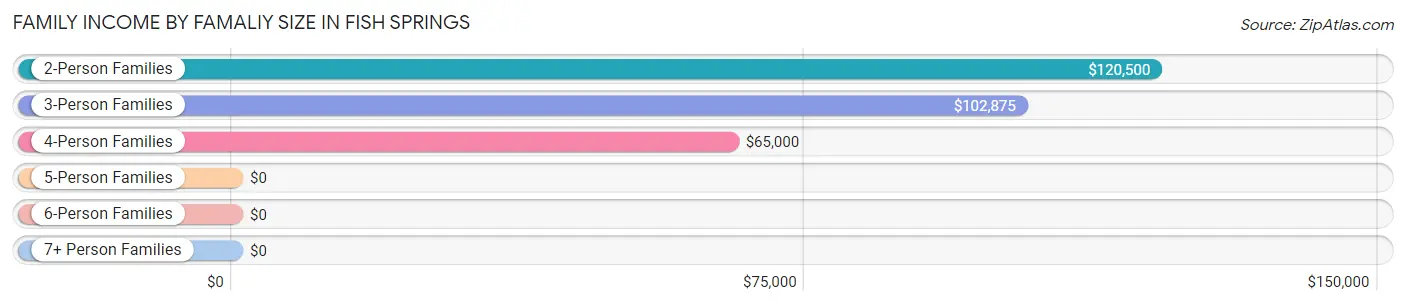
| Income Bracket | # Families | Median Income |
| 2-Person Families | 94 (57.7%) | $120,500 |
| 3-Person Families | 45 (27.6%) | $102,875 |
| 4-Person Families | 12 (7.4%) | $65,000 |
| 5-Person Families | 8 (4.9%) | $0 |
| 6-Person Families | 0 (0.0%) | $0 |
| 7+ Person Families | 4 (2.5%) | $0 |
| Total | 163 (100.0%) | $104,375 |
Family Income by Number of Earners in Fish Springs
The median family income in Fish Springs is $104,375, with families comprising 1 earner (63) having the highest median family income of $138,523, while families with 2 earners (47) have the lowest median family income of $69,375, accounting for 38.7% and 28.8% of families, respectively.
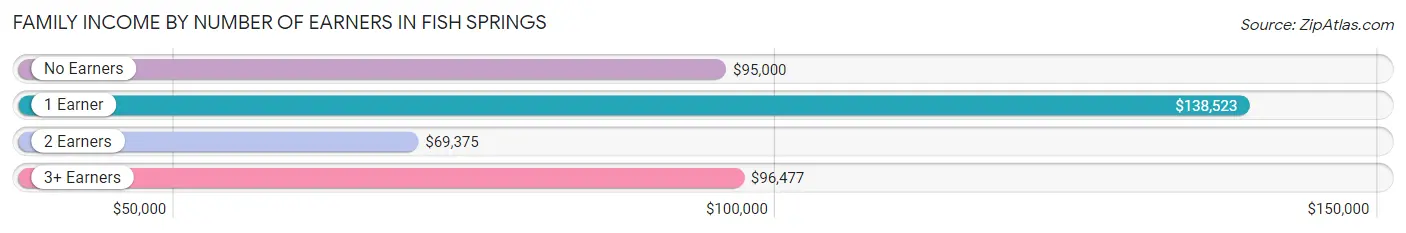
| Number of Earners | # Families | Median Income |
| No Earners | 32 (19.6%) | $95,000 |
| 1 Earner | 63 (38.7%) | $138,523 |
| 2 Earners | 47 (28.8%) | $69,375 |
| 3+ Earners | 21 (12.9%) | $96,477 |
| Total | 163 (100.0%) | $104,375 |
Household Income in Fish Springs
Household Income Brackets in Fish Springs
With 59 households falling in the category, the $100,000 to $149,999 income range is the most frequent in Fish Springs, accounting for 26.2% of all households. In contrast, only 1 households (0.4%) fall into the $10,000 to $14,999 income bracket, making it the least populous group.
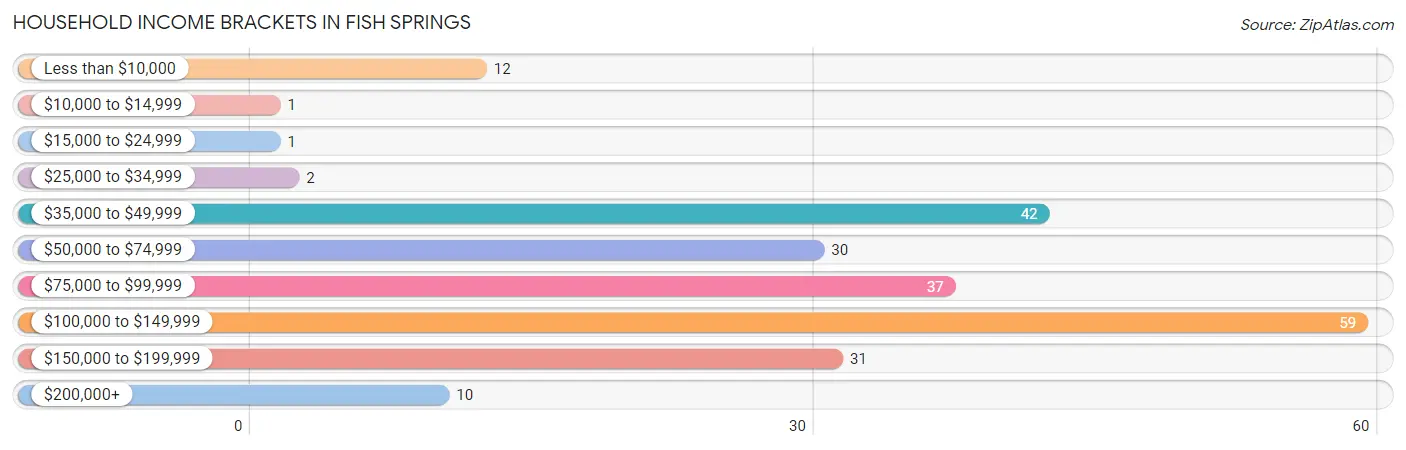
| Income Bracket | # Households | % Households |
| Less than $10,000 | 12 | 5.3% |
| $10,000 to $14,999 | 1 | 0.4% |
| $15,000 to $24,999 | 1 | 0.4% |
| $25,000 to $34,999 | 2 | 0.9% |
| $35,000 to $49,999 | 42 | 18.7% |
| $50,000 to $74,999 | 30 | 13.3% |
| $75,000 to $99,999 | 37 | 16.4% |
| $100,000 to $149,999 | 59 | 26.2% |
| $150,000 to $199,999 | 31 | 13.8% |
| $200,000+ | 10 | 4.4% |
Household Income by Householder Age in Fish Springs
The median household income in Fish Springs is $95,795, with the highest median household income of $113,750 found in the 25 to 44 years age bracket for the primary householder. A total of 24 households (10.7%) fall into this category.
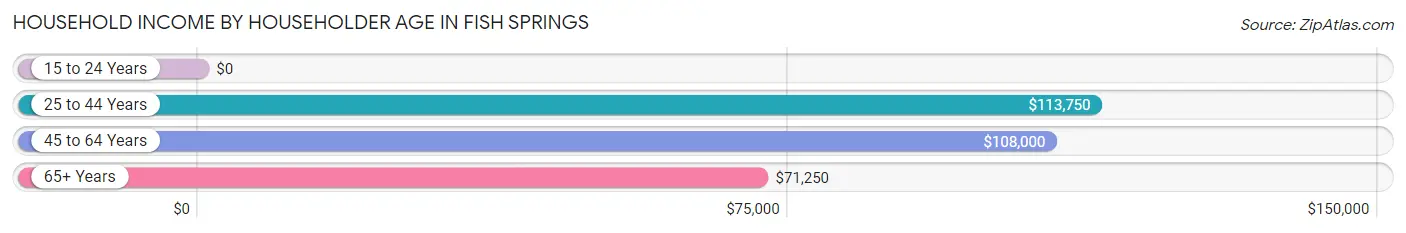
| Income Bracket | # Households | Median Income |
| 15 to 24 Years | 0 (0.0%) | $0 |
| 25 to 44 Years | 24 (10.7%) | $113,750 |
| 45 to 64 Years | 76 (33.8%) | $108,000 |
| 65+ Years | 125 (55.6%) | $71,250 |
| Total | 225 (100.0%) | $95,795 |
Poverty in Fish Springs
Income Below Poverty by Sex and Age in Fish Springs
With 0.7% poverty level for males and 4.8% for females among the residents of Fish Springs, 55 to 64 year old males and 65 to 74 year old females are the most vulnerable to poverty, with 1 males (2.0%) and 12 females (29.3%) in their respective age groups living below the poverty level.
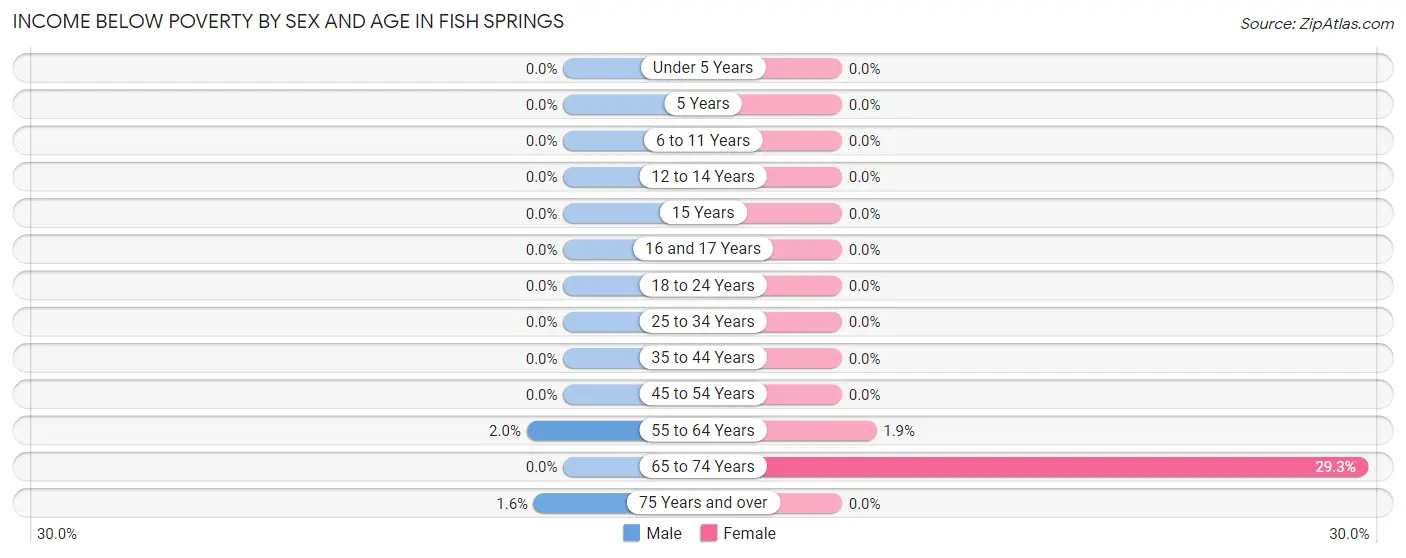
| Age Bracket | Male | Female |
| Under 5 Years | 0 (0.0%) | 0 (0.0%) |
| 5 Years | 0 (0.0%) | 0 (0.0%) |
| 6 to 11 Years | 0 (0.0%) | 0 (0.0%) |
| 12 to 14 Years | 0 (0.0%) | 0 (0.0%) |
| 15 Years | 0 (0.0%) | 0 (0.0%) |
| 16 and 17 Years | 0 (0.0%) | 0 (0.0%) |
| 18 to 24 Years | 0 (0.0%) | 0 (0.0%) |
| 25 to 34 Years | 0 (0.0%) | 0 (0.0%) |
| 35 to 44 Years | 0 (0.0%) | 0 (0.0%) |
| 45 to 54 Years | 0 (0.0%) | 0 (0.0%) |
| 55 to 64 Years | 1 (2.0%) | 1 (1.9%) |
| 65 to 74 Years | 0 (0.0%) | 12 (29.3%) |
| 75 Years and over | 1 (1.6%) | 0 (0.0%) |
| Total | 2 (0.7%) | 13 (4.8%) |
Income Above Poverty by Sex and Age in Fish Springs
According to the poverty statistics in Fish Springs, males aged under 5 years and females aged under 5 years are the age groups that are most secure financially, with 100.0% of males and 100.0% of females in these age groups living above the poverty line.
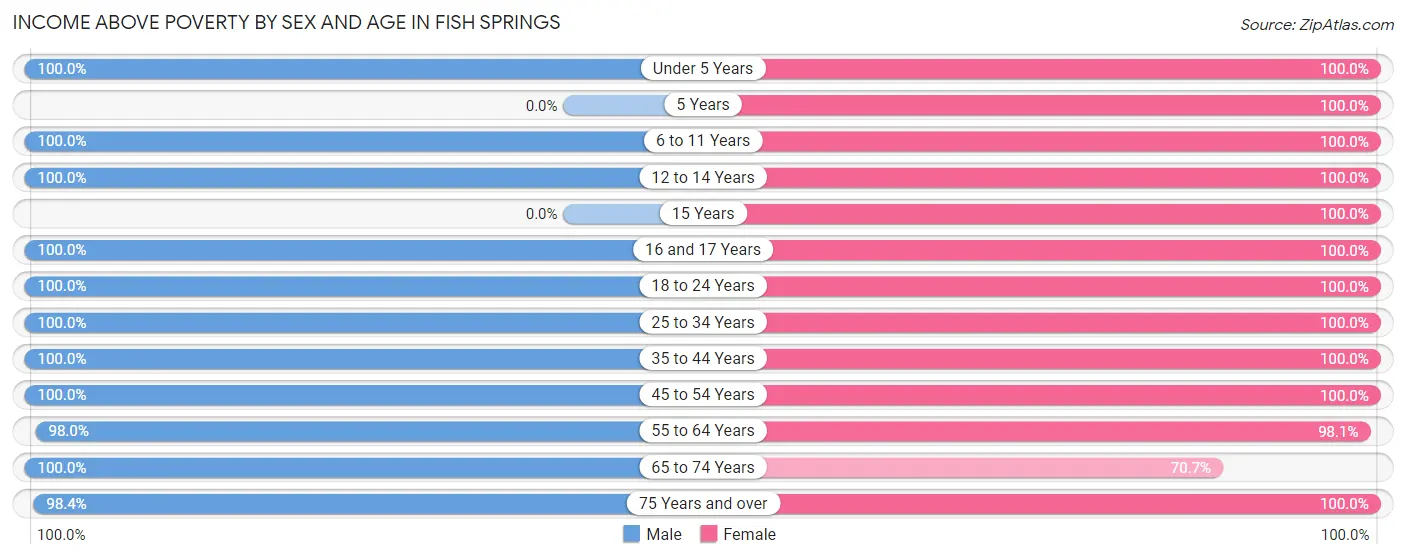
| Age Bracket | Male | Female |
| Under 5 Years | 13 (100.0%) | 13 (100.0%) |
| 5 Years | 0 (0.0%) | 2 (100.0%) |
| 6 to 11 Years | 8 (100.0%) | 11 (100.0%) |
| 12 to 14 Years | 8 (100.0%) | 5 (100.0%) |
| 15 Years | 0 (0.0%) | 2 (100.0%) |
| 16 and 17 Years | 8 (100.0%) | 15 (100.0%) |
| 18 to 24 Years | 19 (100.0%) | 2 (100.0%) |
| 25 to 34 Years | 12 (100.0%) | 13 (100.0%) |
| 35 to 44 Years | 16 (100.0%) | 16 (100.0%) |
| 45 to 54 Years | 30 (100.0%) | 37 (100.0%) |
| 55 to 64 Years | 48 (98.0%) | 51 (98.1%) |
| 65 to 74 Years | 52 (100.0%) | 29 (70.7%) |
| 75 Years and over | 60 (98.4%) | 64 (100.0%) |
| Total | 274 (99.3%) | 260 (95.2%) |
Income Below Poverty Among Married-Couple Families in Fish Springs
The poverty statistics for married-couple families in Fish Springs show that 0.7% or 1 of the total 151 families live below the poverty line. Families with no children have the highest poverty rate of 0.9%, comprising of 1 families. On the other hand, families with 1 or 2 children have the lowest poverty rate of 0.0%, which includes 0 families.
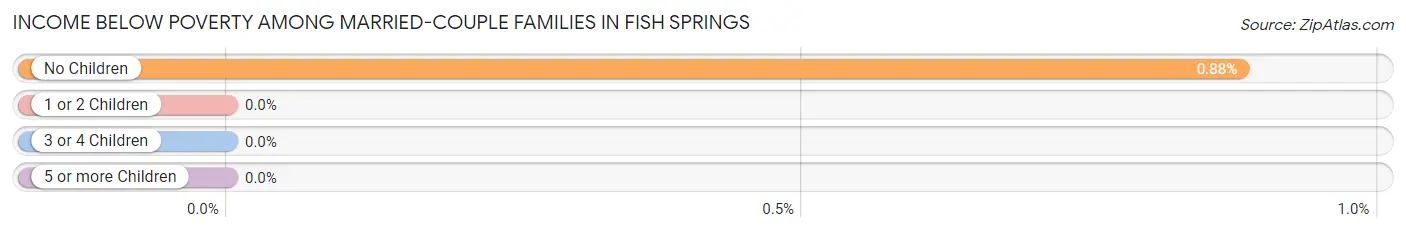
| Children | Above Poverty | Below Poverty |
| No Children | 112 (99.1%) | 1 (0.9%) |
| 1 or 2 Children | 29 (100.0%) | 0 (0.0%) |
| 3 or 4 Children | 5 (100.0%) | 0 (0.0%) |
| 5 or more Children | 4 (100.0%) | 0 (0.0%) |
| Total | 150 (99.3%) | 1 (0.7%) |
Income Below Poverty Among Single-Parent Households in Fish Springs
| Children | Single Father | Single Mother |
| No Children | 0 (0.0%) | 0 (0.0%) |
| 1 or 2 Children | 0 (0.0%) | 0 (0.0%) |
| 3 or 4 Children | 0 (0.0%) | 0 (0.0%) |
| 5 or more Children | 0 (0.0%) | 0 (0.0%) |
| Total | 0 (0.0%) | 0 (0.0%) |
Income Below Poverty Among Married-Couple vs Single-Parent Households in Fish Springs
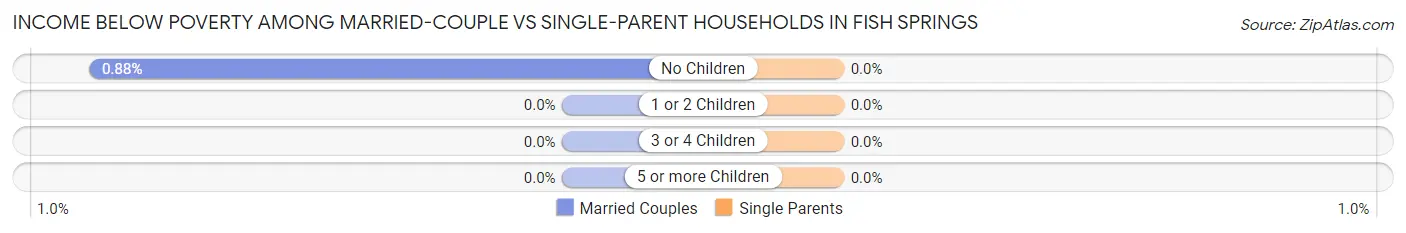
| Children | Married-Couple Families | Single-Parent Households |
| No Children | 1 (0.9%) | 0 (0.0%) |
| 1 or 2 Children | 0 (0.0%) | 0 (0.0%) |
| 3 or 4 Children | 0 (0.0%) | 0 (0.0%) |
| 5 or more Children | 0 (0.0%) | 0 (0.0%) |
| Total | 1 (0.7%) | 0 (0.0%) |
Race in Fish Springs
The most populous races in Fish Springs are White / Caucasian (517 | 94.2%), Hispanic or Latino (34 | 6.2%), and Two or more Races (26 | 4.7%).
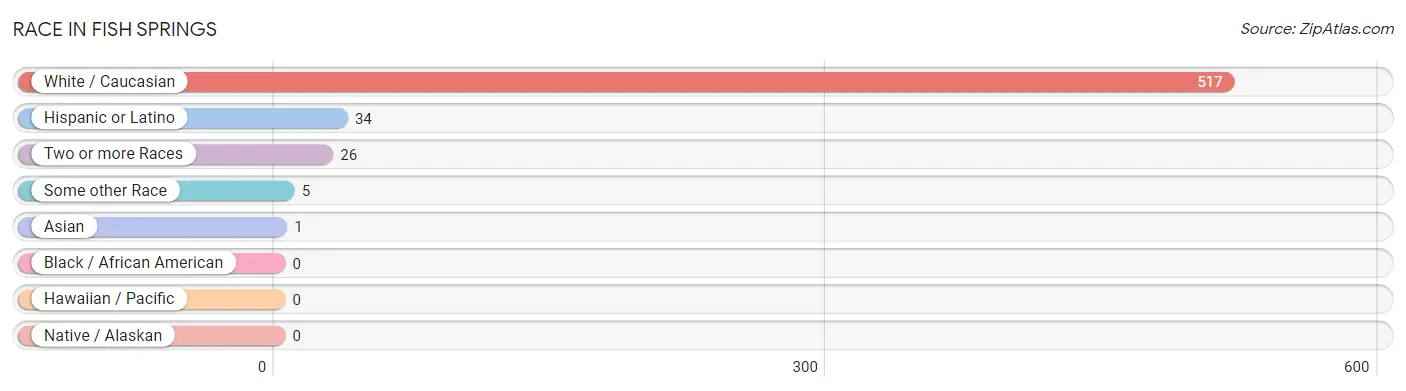
| Race | # Population | % Population |
| Asian | 1 | 0.2% |
| Black / African American | 0 | 0.0% |
| Hawaiian / Pacific | 0 | 0.0% |
| Hispanic or Latino | 34 | 6.2% |
| Native / Alaskan | 0 | 0.0% |
| White / Caucasian | 517 | 94.2% |
| Two or more Races | 26 | 4.7% |
| Some other Race | 5 | 0.9% |
| Total | 549 | 100.0% |
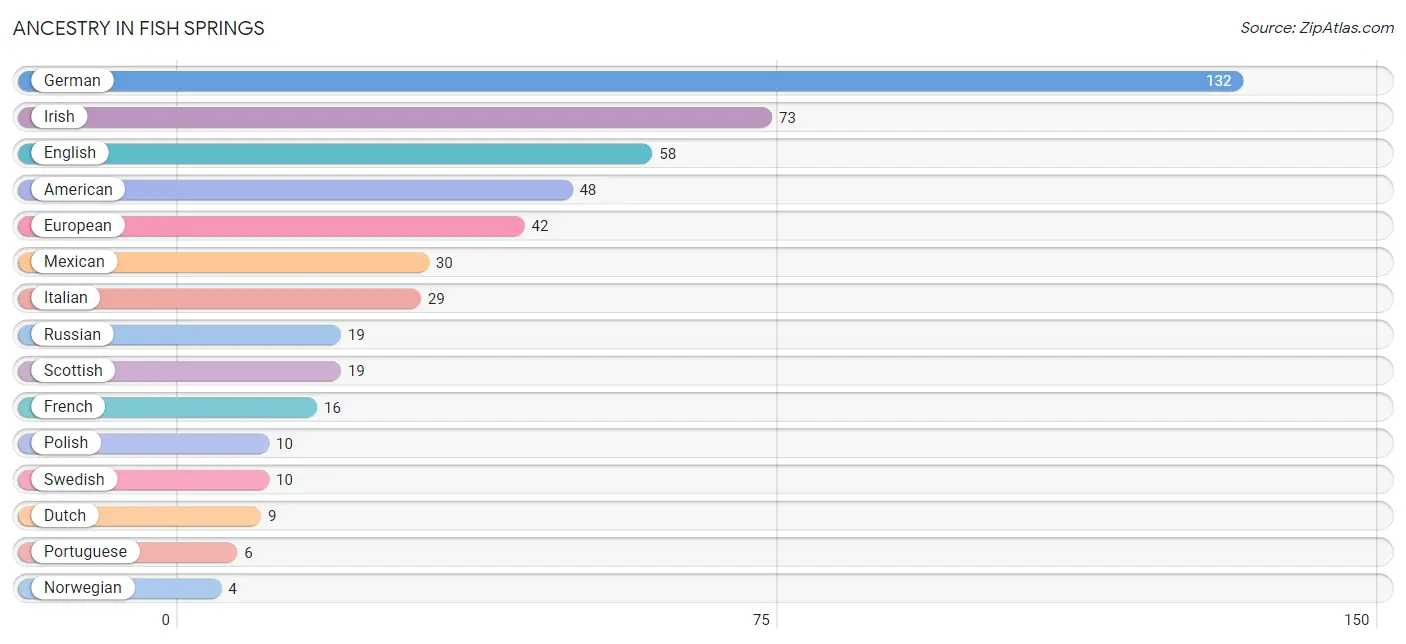
Ancestry in Fish Springs
The most populous ancestries reported in Fish Springs are German (132 | 24.0%), Irish (73 | 13.3%), English (58 | 10.6%), American (48 | 8.7%), and European (42 | 7.6%), together accounting for 64.3% of all Fish Springs residents.
| Ancestry | # Population | % Population |
| American | 48 | 8.7% |
| Austrian | 3 | 0.5% |
| Basque | 2 | 0.4% |
| Blackfeet | 1 | 0.2% |
| British | 1 | 0.2% |
| Czech | 1 | 0.2% |
| Danish | 3 | 0.5% |
| Dutch | 9 | 1.6% |
| English | 58 | 10.6% |
| European | 42 | 7.6% |
| French | 16 | 2.9% |
| German | 132 | 24.0% |
| Greek | 1 | 0.2% |
| Irish | 73 | 13.3% |
| Italian | 29 | 5.3% |
| Korean | 1 | 0.2% |
| Maltese | 1 | 0.2% |
| Mexican | 30 | 5.5% |
| Northern European | 2 | 0.4% |
| Norwegian | 4 | 0.7% |
| Polish | 10 | 1.8% |
| Portuguese | 6 | 1.1% |
| Puerto Rican | 2 | 0.4% |
| Russian | 19 | 3.5% |
| Scotch-Irish | 4 | 0.7% |
| Scottish | 19 | 3.5% |
| Slovak | 1 | 0.2% |
| Spanish | 2 | 0.4% |
| Swedish | 10 | 1.8% |
| Swiss | 2 | 0.4% |
| Welsh | 1 | 0.2% | View All 31 Rows |
Immigrants in Fish Springs
The most numerous immigrant groups reported in Fish Springs came from Central America (11 | 2.0%), Latin America (11 | 2.0%), Mexico (11 | 2.0%), Europe (2 | 0.4%), and England (1 | 0.2%), together accounting for 6.5% of all Fish Springs residents.
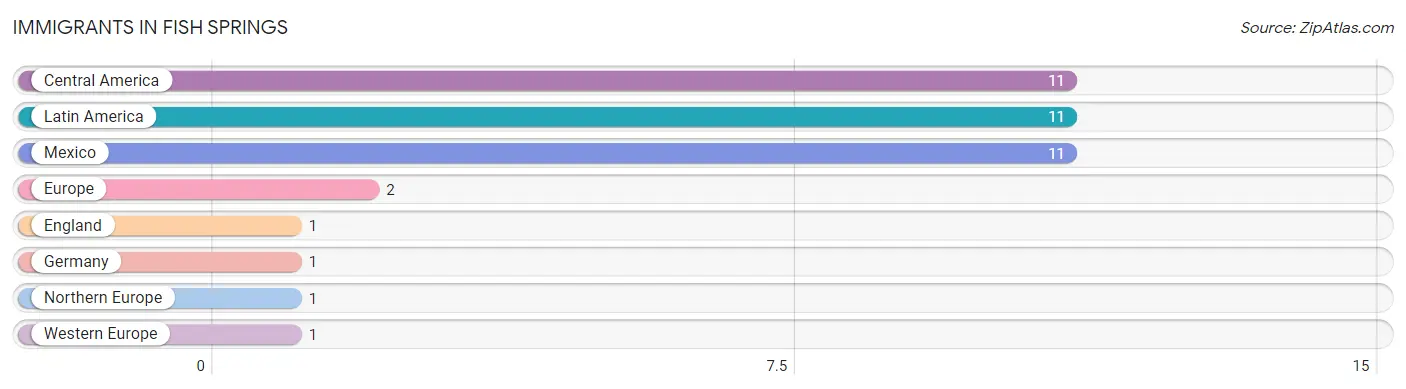
| Immigration Origin | # Population | % Population |
| Central America | 11 | 2.0% |
| England | 1 | 0.2% |
| Europe | 2 | 0.4% |
| Germany | 1 | 0.2% |
| Latin America | 11 | 2.0% |
| Mexico | 11 | 2.0% |
| Northern Europe | 1 | 0.2% |
| Western Europe | 1 | 0.2% | View All 8 Rows |
Sex and Age in Fish Springs
Sex and Age in Fish Springs
The most populous age groups in Fish Springs are 85 Years and over (29 | 10.5%) for men and 85 Years and over (31 | 11.4%) for women.
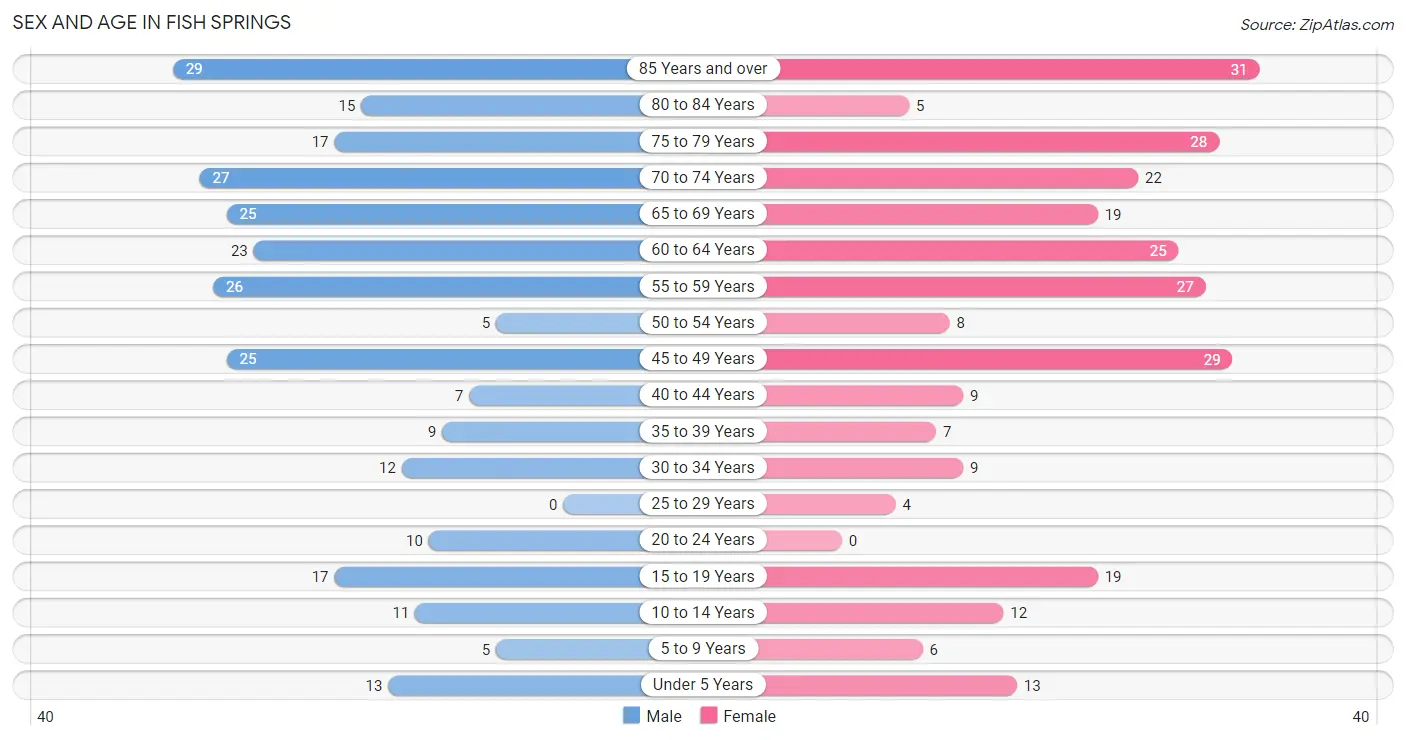
| Age Bracket | Male | Female |
| Under 5 Years | 13 (4.7%) | 13 (4.8%) |
| 5 to 9 Years | 5 (1.8%) | 6 (2.2%) |
| 10 to 14 Years | 11 (4.0%) | 12 (4.4%) |
| 15 to 19 Years | 17 (6.2%) | 19 (7.0%) |
| 20 to 24 Years | 10 (3.6%) | 0 (0.0%) |
| 25 to 29 Years | 0 (0.0%) | 4 (1.5%) |
| 30 to 34 Years | 12 (4.3%) | 9 (3.3%) |
| 35 to 39 Years | 9 (3.3%) | 7 (2.6%) |
| 40 to 44 Years | 7 (2.5%) | 9 (3.3%) |
| 45 to 49 Years | 25 (9.1%) | 29 (10.6%) |
| 50 to 54 Years | 5 (1.8%) | 8 (2.9%) |
| 55 to 59 Years | 26 (9.4%) | 27 (9.9%) |
| 60 to 64 Years | 23 (8.3%) | 25 (9.2%) |
| 65 to 69 Years | 25 (9.1%) | 19 (7.0%) |
| 70 to 74 Years | 27 (9.8%) | 22 (8.1%) |
| 75 to 79 Years | 17 (6.2%) | 28 (10.3%) |
| 80 to 84 Years | 15 (5.4%) | 5 (1.8%) |
| 85 Years and over | 29 (10.5%) | 31 (11.4%) |
| Total | 276 (100.0%) | 273 (100.0%) |
Families and Households in Fish Springs
Median Family Size in Fish Springs
The median family size in Fish Springs is 2.68 persons per family, with single female/mother families (5 | 3.1%) accounting for the largest median family size of 5.2 persons per family. On the other hand, married-couple families (151 | 92.6%) represent the smallest median family size with 2.58 persons per family.
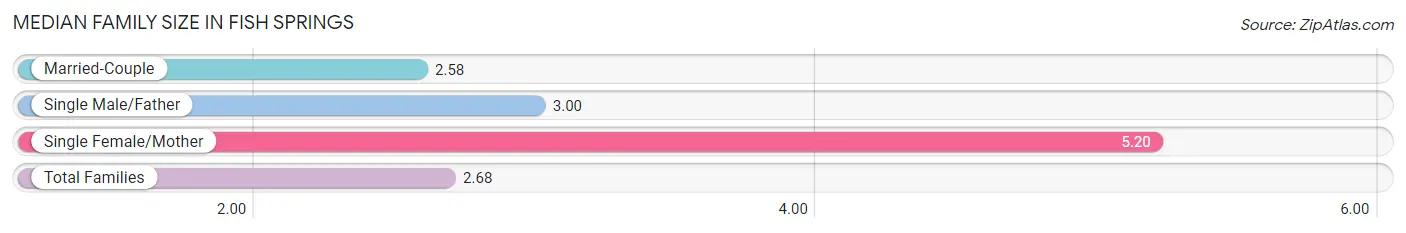
| Family Type | # Families | Family Size |
| Married-Couple | 151 (92.6%) | 2.58 |
| Single Male/Father | 7 (4.3%) | 3.00 |
| Single Female/Mother | 5 (3.1%) | 5.20 |
| Total Families | 163 (100.0%) | 2.68 |
Median Household Size in Fish Springs
The median household size in Fish Springs is 2.44 persons per household, with single female/mother households (5 | 2.2%) accounting for the largest median household size of 6.4 persons per household. non-family households (62 | 27.6%) represent the smallest median household size with 1.71 persons per household.
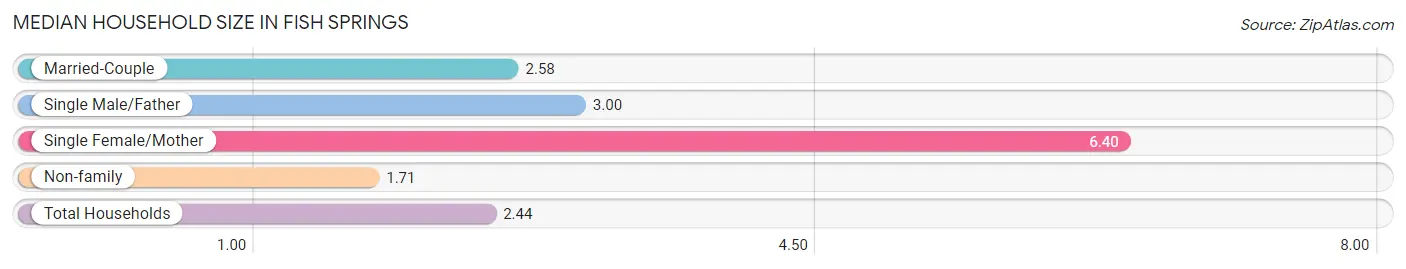
| Household Type | # Households | Household Size |
| Married-Couple | 151 (67.1%) | 2.58 |
| Single Male/Father | 7 (3.1%) | 3.00 |
| Single Female/Mother | 5 (2.2%) | 6.40 |
| Non-family | 62 (27.6%) | 1.71 |
| Total Households | 225 (100.0%) | 2.44 |
Household Size by Marriage Status in Fish Springs
Out of a total of 225 households in Fish Springs, 163 (72.4%) are family households, while 62 (27.6%) are nonfamily households. The most numerous type of family households are 2-person households, comprising 94, and the most common type of nonfamily households are 2-person households, comprising 40.
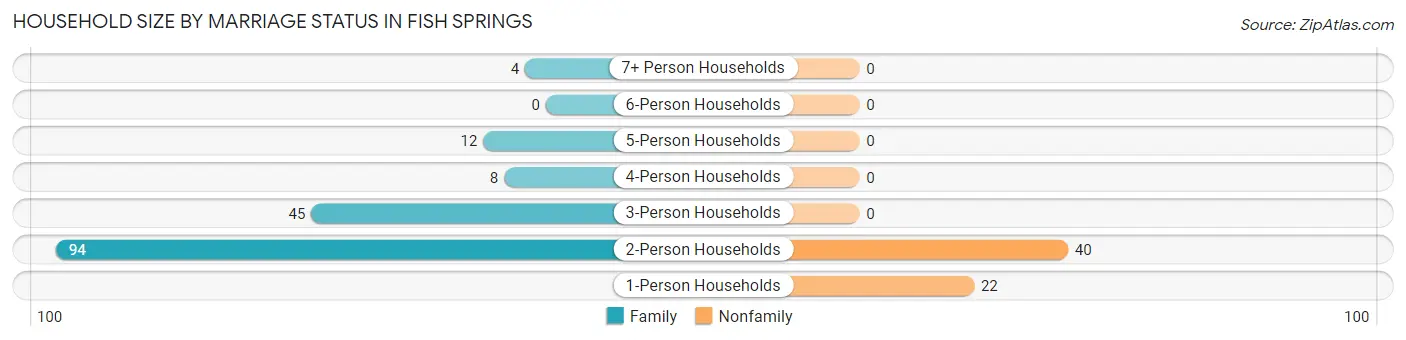
| Household Size | Family Households | Nonfamily Households |
| 1-Person Households | - | 22 (9.8%) |
| 2-Person Households | 94 (41.8%) | 40 (17.8%) |
| 3-Person Households | 45 (20.0%) | 0 (0.0%) |
| 4-Person Households | 8 (3.6%) | 0 (0.0%) |
| 5-Person Households | 12 (5.3%) | 0 (0.0%) |
| 6-Person Households | 0 (0.0%) | 0 (0.0%) |
| 7+ Person Households | 4 (1.8%) | 0 (0.0%) |
| Total | 163 (72.4%) | 62 (27.6%) |
Female Fertility in Fish Springs
Fertility by Age in Fish Springs
Average fertility rate in Fish Springs is 111.0 births per 1,000 women. Women in the age bracket of 20 to 34 years have the highest fertility rate with 154.0 births per 1,000 women. Women in the age bracket of 35 to 50 years acount for 77.8% of all women with births.
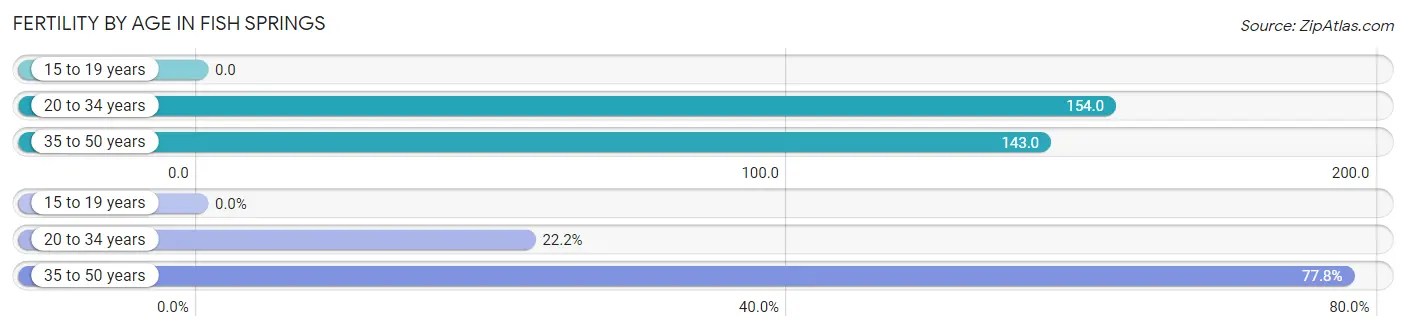
| Age Bracket | Women with Births | Births / 1,000 Women |
| 15 to 19 years | 0 (0.0%) | 0.0 |
| 20 to 34 years | 2 (22.2%) | 154.0 |
| 35 to 50 years | 7 (77.8%) | 143.0 |
| Total | 9 (100.0%) | 111.0 |
Fertility by Age by Marriage Status in Fish Springs
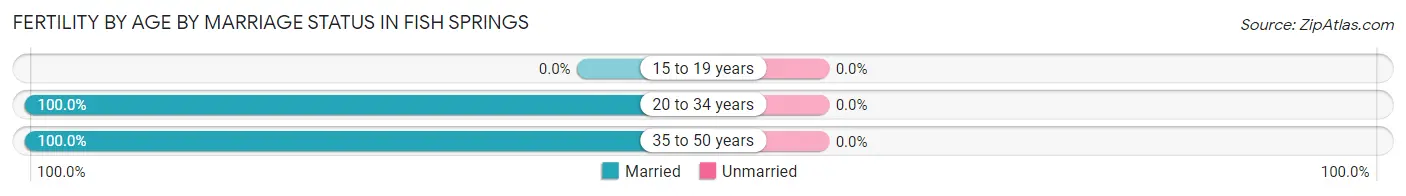
| Age Bracket | Married | Unmarried |
| 15 to 19 years | 0 (0.0%) | 0 (0.0%) |
| 20 to 34 years | 2 (100.0%) | 0 (0.0%) |
| 35 to 50 years | 7 (100.0%) | 0 (0.0%) |
| Total | 9 (100.0%) | 0 (0.0%) |
Fertility by Education in Fish Springs
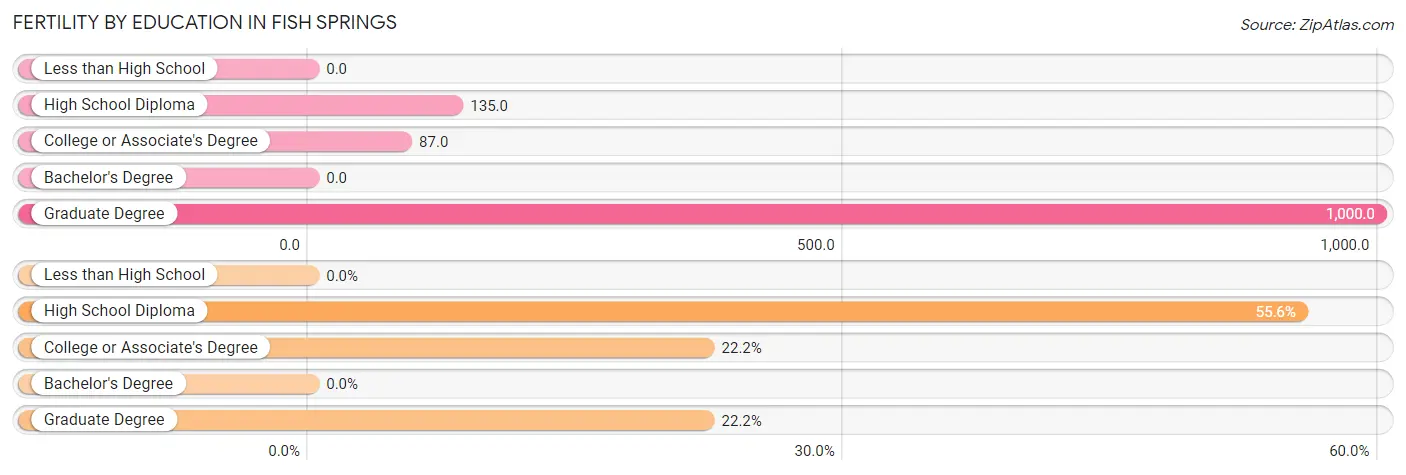
| Educational Attainment | Women with Births | Births / 1,000 Women |
| Less than High School | 0 (0.0%) | 0.0 |
| High School Diploma | 5 (55.6%) | 135.0 |
| College or Associate's Degree | 2 (22.2%) | 87.0 |
| Bachelor's Degree | 0 (0.0%) | 0.0 |
| Graduate Degree | 2 (22.2%) | 1,000.0 |
| Total | 9 (100.0%) | 111.0 |
Fertility by Education by Marriage Status in Fish Springs
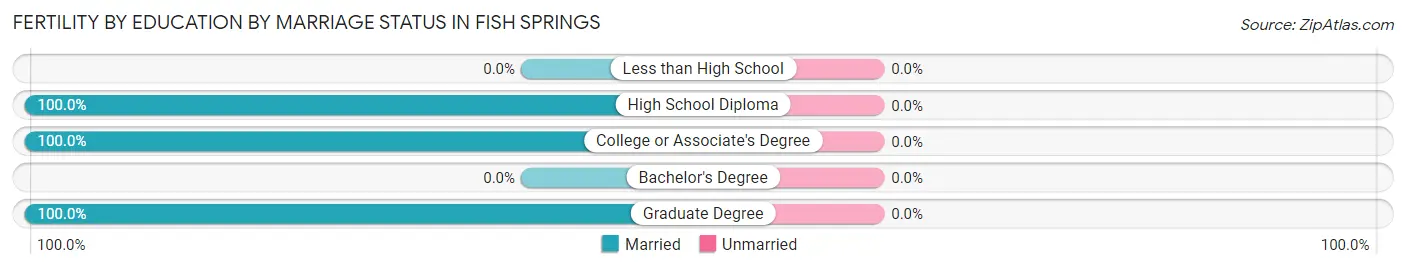
| Educational Attainment | Married | Unmarried |
| Less than High School | 0 (0.0%) | 0 (0.0%) |
| High School Diploma | 5 (100.0%) | 0 (0.0%) |
| College or Associate's Degree | 2 (100.0%) | 0 (0.0%) |
| Bachelor's Degree | 0 (0.0%) | 0 (0.0%) |
| Graduate Degree | 2 (100.0%) | 0 (0.0%) |
| Total | 9 (100.0%) | 0 (0.0%) |
Employment Characteristics in Fish Springs
Employment by Class of Employer in Fish Springs
Among the 211 employed individuals in Fish Springs, private company employees (98 | 46.5%), self-employed (not incorporated) (53 | 25.1%), and local government employees (22 | 10.4%) make up the most common classes of employment.
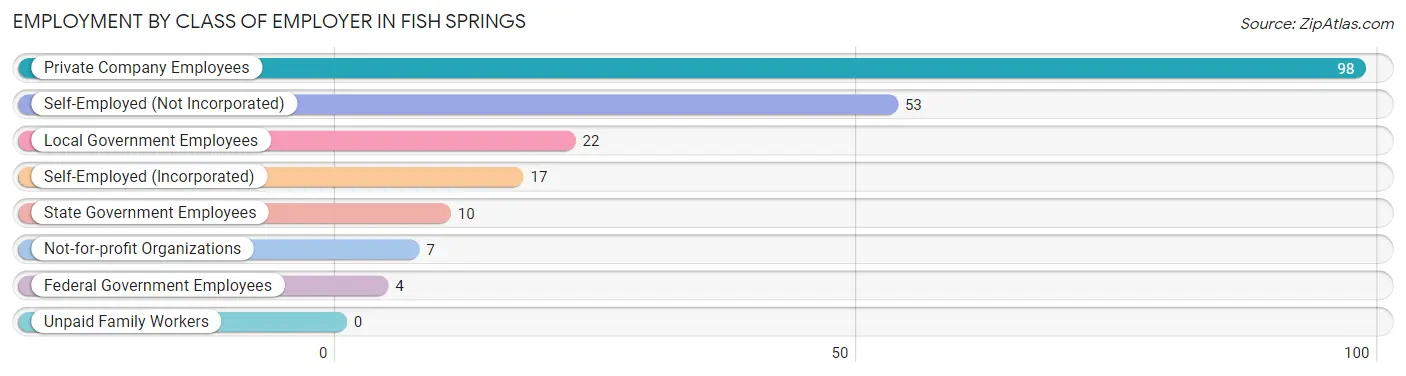
| Employer Class | # Employees | % Employees |
| Private Company Employees | 98 | 46.5% |
| Self-Employed (Incorporated) | 17 | 8.1% |
| Self-Employed (Not Incorporated) | 53 | 25.1% |
| Not-for-profit Organizations | 7 | 3.3% |
| Local Government Employees | 22 | 10.4% |
| State Government Employees | 10 | 4.7% |
| Federal Government Employees | 4 | 1.9% |
| Unpaid Family Workers | 0 | 0.0% |
| Total | 211 | 100.0% |
Employment Status by Age in Fish Springs
According to the labor force statistics for Fish Springs, out of the total population over 16 years of age (487), 44.1% or 215 individuals are in the labor force, with 1.4% or 3 of them unemployed. The age group with the highest labor force participation rate is 20 to 24 years, with 100.0% or 10 individuals in the labor force. Within the labor force, the 35 to 44 years age range has the highest percentage of unemployed individuals, with 11.1% or 3 of them being unemployed.
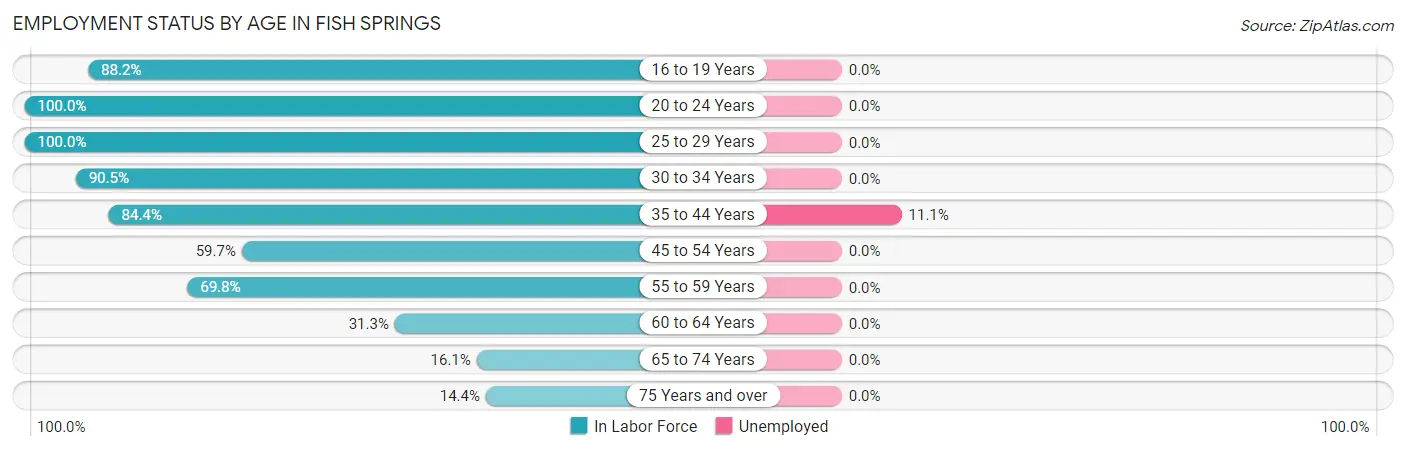
| Age Bracket | In Labor Force | Unemployed |
| 16 to 19 Years | 30 (88.2%) | 0 (0.0%) |
| 20 to 24 Years | 10 (100.0%) | 0 (0.0%) |
| 25 to 29 Years | 4 (100.0%) | 0 (0.0%) |
| 30 to 34 Years | 19 (90.5%) | 0 (0.0%) |
| 35 to 44 Years | 27 (84.4%) | 3 (11.1%) |
| 45 to 54 Years | 40 (59.7%) | 0 (0.0%) |
| 55 to 59 Years | 37 (69.8%) | 0 (0.0%) |
| 60 to 64 Years | 15 (31.3%) | 0 (0.0%) |
| 65 to 74 Years | 15 (16.1%) | 0 (0.0%) |
| 75 Years and over | 18 (14.4%) | 0 (0.0%) |
| Total | 215 (44.1%) | 3 (1.4%) |
Employment Status by Educational Attainment in Fish Springs
According to labor force statistics for Fish Springs, 63.1% of individuals (142) out of the total population between 25 and 64 years of age (225) are in the labor force, with 2.1% or 3 of them being unemployed. The group with the highest labor force participation rate are those with the educational attainment of less than high school, with 100.0% or 2 individuals in the labor force. Within the labor force, individuals with bachelor's degree or higher education have the highest percentage of unemployment, with 6.1% or 2 of them being unemployed.
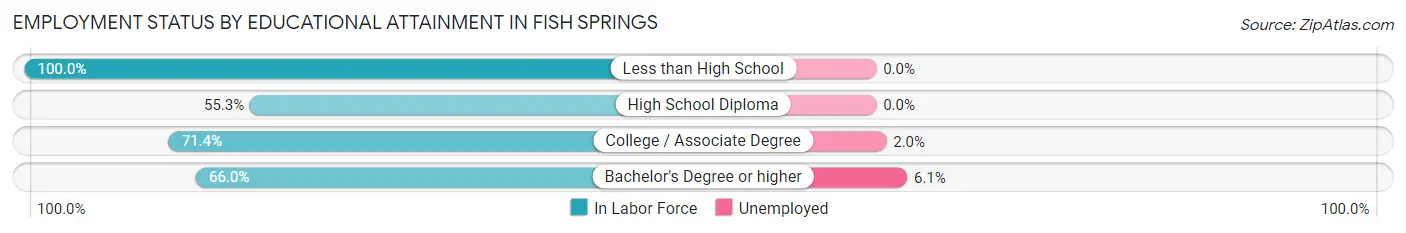
| Educational Attainment | In Labor Force | Unemployed |
| Less than High School | 2 (100.0%) | 0 (0.0%) |
| High School Diploma | 57 (55.3%) | 0 (0.0%) |
| College / Associate Degree | 50 (71.4%) | 1 (2.0%) |
| Bachelor's Degree or higher | 33 (66.0%) | 3 (6.1%) |
| Total | 142 (63.1%) | 5 (2.1%) |
Employment Occupations by Sex in Fish Springs
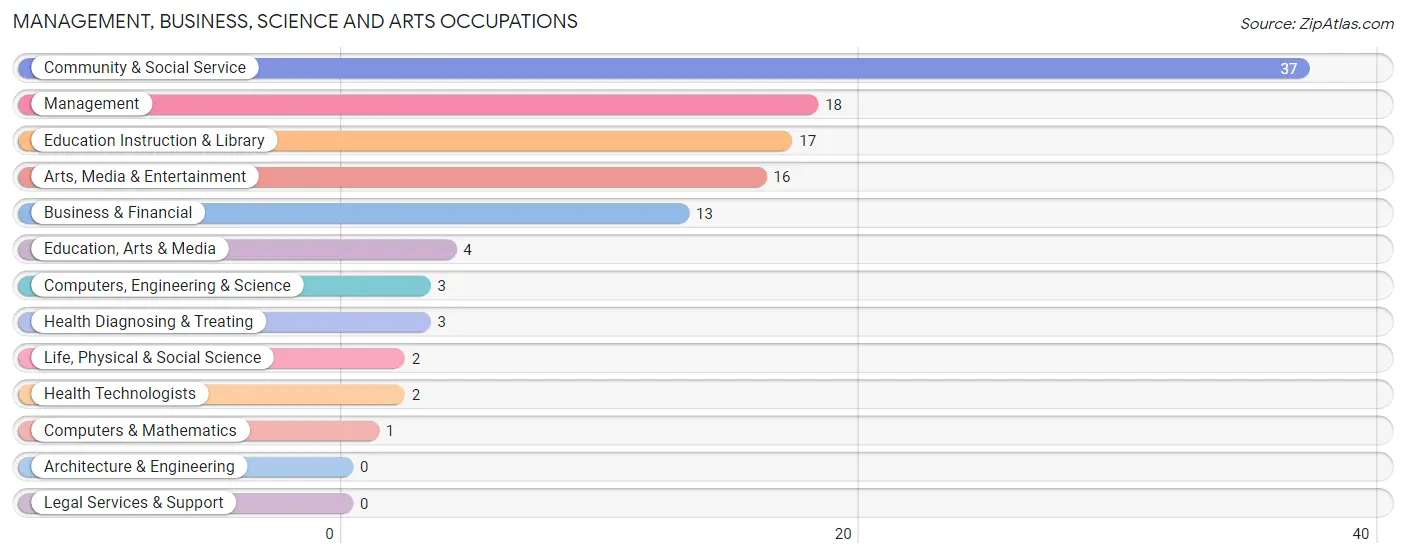
Management, Business, Science and Arts Occupations
The most common Management, Business, Science and Arts occupations in Fish Springs are Community & Social Service (37 | 17.4%), Management (18 | 8.5%), Education Instruction & Library (17 | 8.0%), Arts, Media & Entertainment (16 | 7.5%), and Business & Financial (13 | 6.1%).
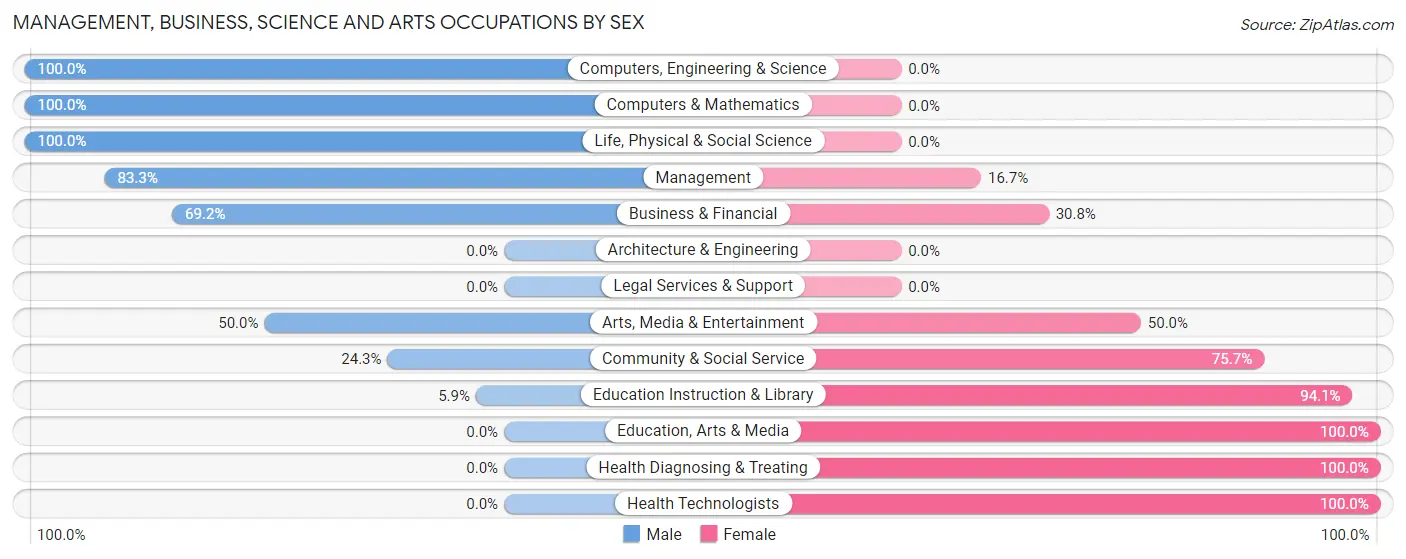
Management, Business, Science and Arts Occupations by Sex
Within the Management, Business, Science and Arts occupations in Fish Springs, the most male-oriented occupations are Computers, Engineering & Science (100.0%), Computers & Mathematics (100.0%), and Life, Physical & Social Science (100.0%), while the most female-oriented occupations are Education, Arts & Media (100.0%), Health Diagnosing & Treating (100.0%), and Health Technologists (100.0%).
| Occupation | Male | Female |
| Management | 15 (83.3%) | 3 (16.7%) |
| Business & Financial | 9 (69.2%) | 4 (30.8%) |
| Computers, Engineering & Science | 3 (100.0%) | 0 (0.0%) |
| Computers & Mathematics | 1 (100.0%) | 0 (0.0%) |
| Architecture & Engineering | 0 (0.0%) | 0 (0.0%) |
| Life, Physical & Social Science | 2 (100.0%) | 0 (0.0%) |
| Community & Social Service | 9 (24.3%) | 28 (75.7%) |
| Education, Arts & Media | 0 (0.0%) | 4 (100.0%) |
| Legal Services & Support | 0 (0.0%) | 0 (0.0%) |
| Education Instruction & Library | 1 (5.9%) | 16 (94.1%) |
| Arts, Media & Entertainment | 8 (50.0%) | 8 (50.0%) |
| Health Diagnosing & Treating | 0 (0.0%) | 3 (100.0%) |
| Health Technologists | 0 (0.0%) | 2 (100.0%) |
| Total (Category) | 36 (48.6%) | 38 (51.3%) |
| Total (Overall) | 130 (61.3%) | 82 (38.7%) |
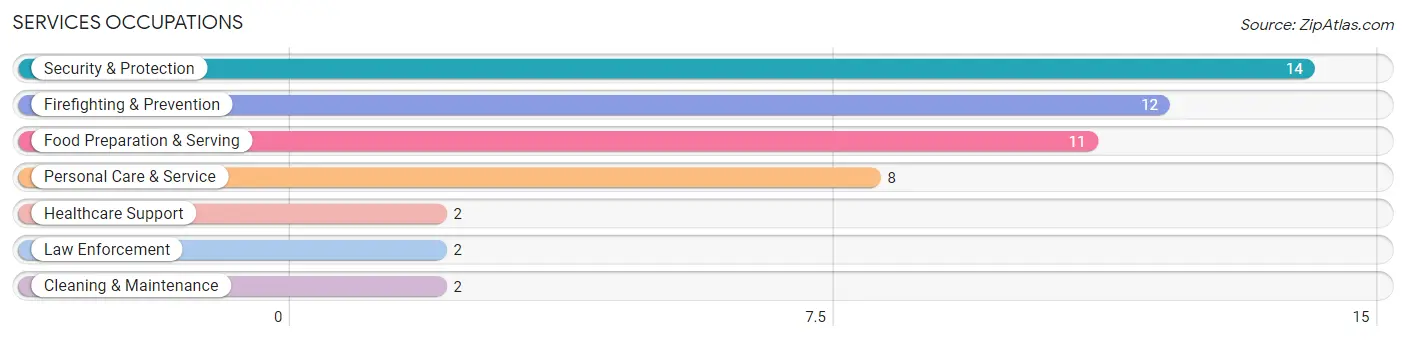
Services Occupations
The most common Services occupations in Fish Springs are Security & Protection (14 | 6.6%), Firefighting & Prevention (12 | 5.7%), Food Preparation & Serving (11 | 5.2%), Personal Care & Service (8 | 3.8%), and Healthcare Support (2 | 0.9%).
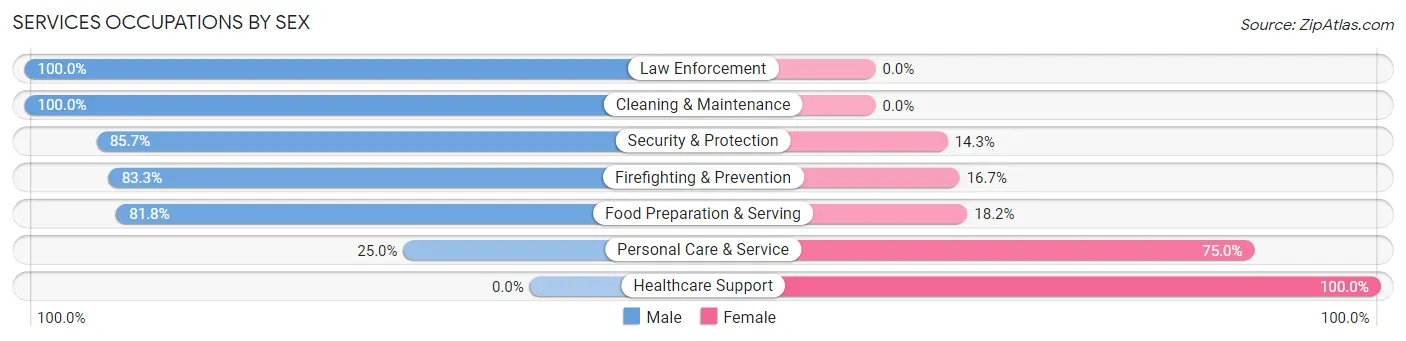
Services Occupations by Sex
Within the Services occupations in Fish Springs, the most male-oriented occupations are Law Enforcement (100.0%), Cleaning & Maintenance (100.0%), and Security & Protection (85.7%), while the most female-oriented occupations are Healthcare Support (100.0%), Personal Care & Service (75.0%), and Food Preparation & Serving (18.2%).
| Occupation | Male | Female |
| Healthcare Support | 0 (0.0%) | 2 (100.0%) |
| Security & Protection | 12 (85.7%) | 2 (14.3%) |
| Firefighting & Prevention | 10 (83.3%) | 2 (16.7%) |
| Law Enforcement | 2 (100.0%) | 0 (0.0%) |
| Food Preparation & Serving | 9 (81.8%) | 2 (18.2%) |
| Cleaning & Maintenance | 2 (100.0%) | 0 (0.0%) |
| Personal Care & Service | 2 (25.0%) | 6 (75.0%) |
| Total (Category) | 25 (67.6%) | 12 (32.4%) |
| Total (Overall) | 130 (61.3%) | 82 (38.7%) |
Sales and Office Occupations
The most common Sales and Office occupations in Fish Springs are Office & Administration (17 | 8.0%), and Sales & Related (16 | 7.5%).
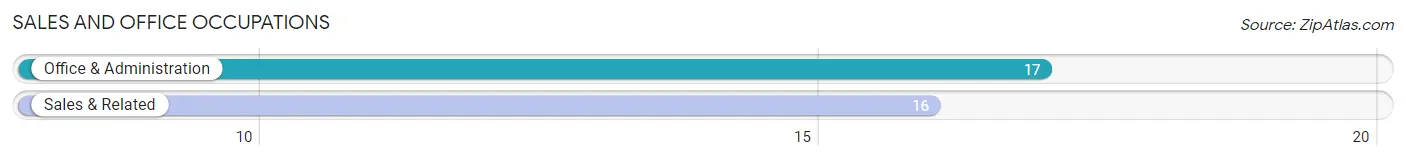
Sales and Office Occupations by Sex

| Occupation | Male | Female |
| Sales & Related | 14 (87.5%) | 2 (12.5%) |
| Office & Administration | 0 (0.0%) | 17 (100.0%) |
| Total (Category) | 14 (42.4%) | 19 (57.6%) |
| Total (Overall) | 130 (61.3%) | 82 (38.7%) |
Natural Resources, Construction and Maintenance Occupations
The most common Natural Resources, Construction and Maintenance occupations in Fish Springs are Construction & Extraction (22 | 10.4%), Installation, Maintenance & Repair (8 | 3.8%), and Farming, Fishing & Forestry (1 | 0.5%).
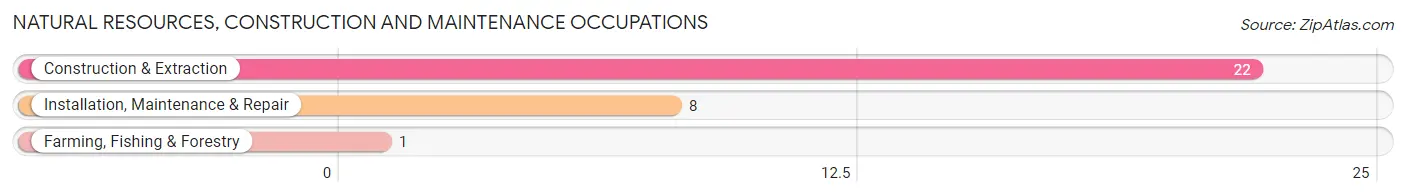
Natural Resources, Construction and Maintenance Occupations by Sex
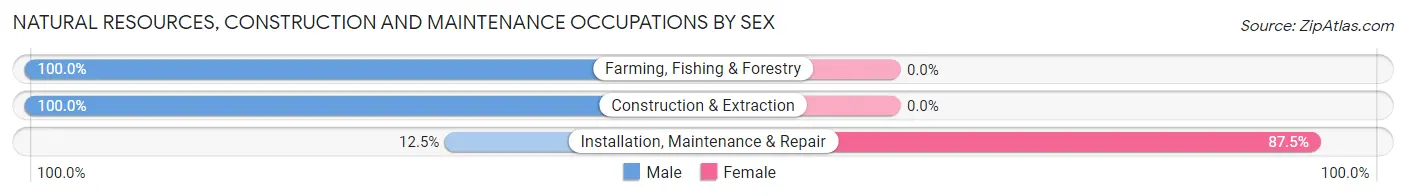
| Occupation | Male | Female |
| Farming, Fishing & Forestry | 1 (100.0%) | 0 (0.0%) |
| Construction & Extraction | 22 (100.0%) | 0 (0.0%) |
| Installation, Maintenance & Repair | 1 (12.5%) | 7 (87.5%) |
| Total (Category) | 24 (77.4%) | 7 (22.6%) |
| Total (Overall) | 130 (61.3%) | 82 (38.7%) |
Production, Transportation and Moving Occupations
The most common Production, Transportation and Moving occupations in Fish Springs are Production (16 | 7.5%), Transportation (11 | 5.2%), and Material Moving (10 | 4.7%).
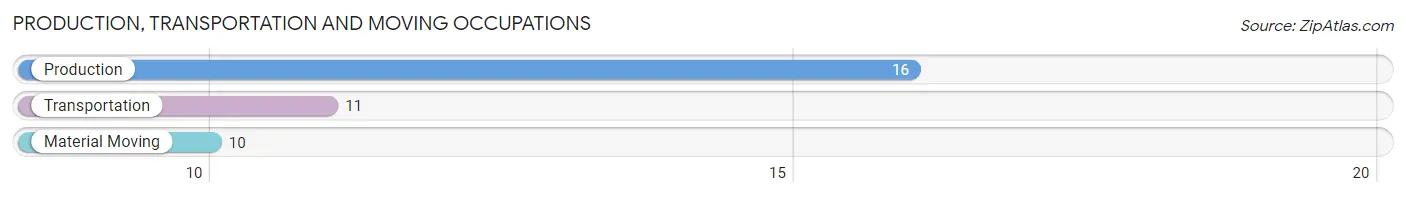
Production, Transportation and Moving Occupations by Sex
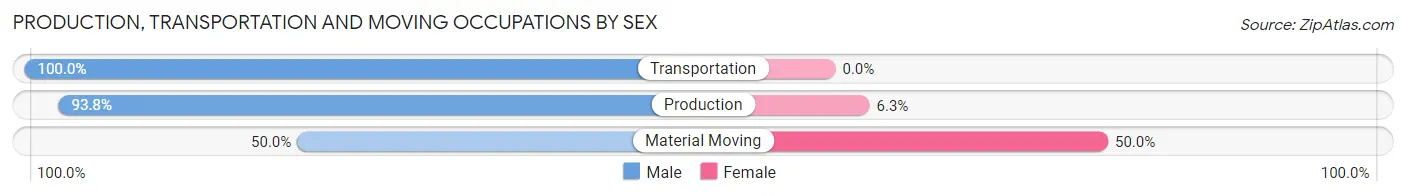
| Occupation | Male | Female |
| Production | 15 (93.8%) | 1 (6.2%) |
| Transportation | 11 (100.0%) | 0 (0.0%) |
| Material Moving | 5 (50.0%) | 5 (50.0%) |
| Total (Category) | 31 (83.8%) | 6 (16.2%) |
| Total (Overall) | 130 (61.3%) | 82 (38.7%) |
Employment Industries by Sex in Fish Springs
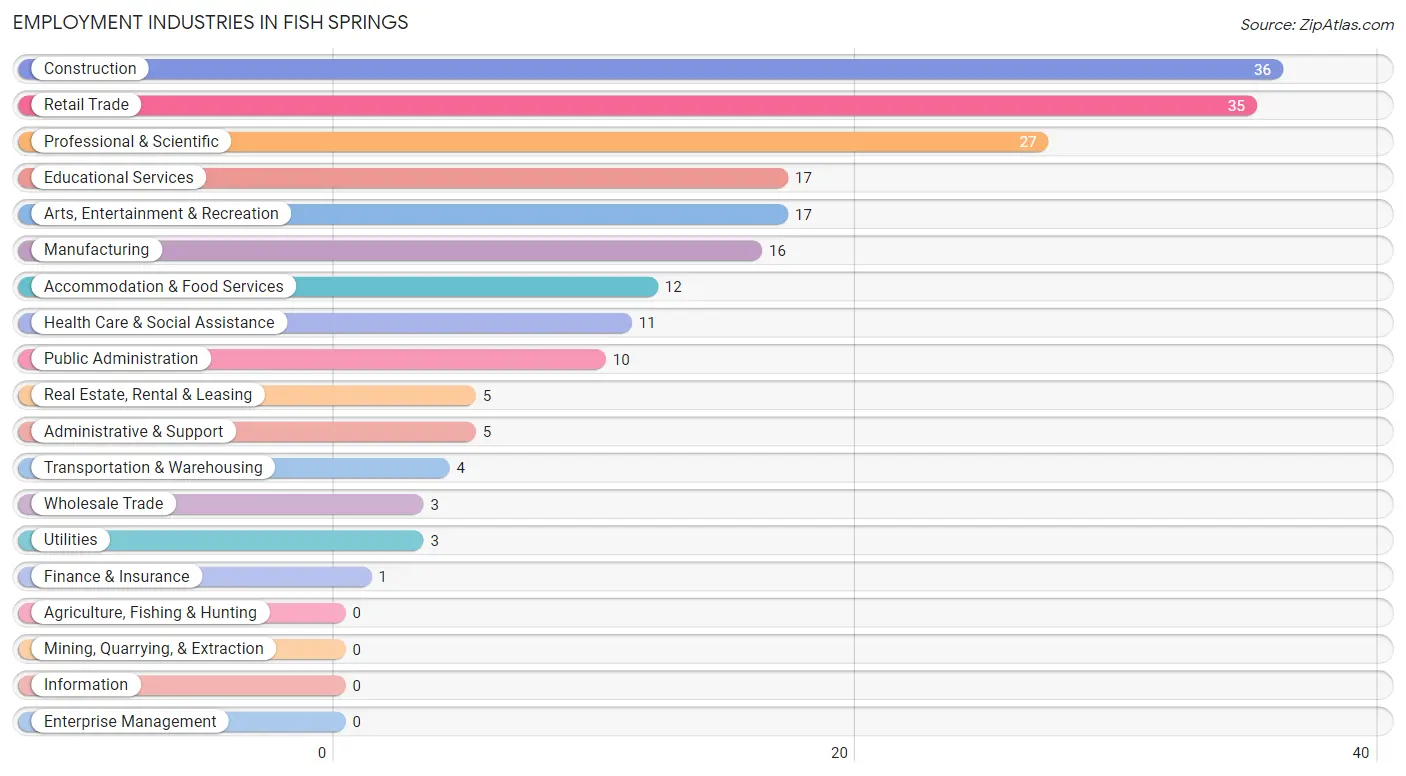
Employment Industries in Fish Springs
The major employment industries in Fish Springs include Construction (36 | 17.0%), Retail Trade (35 | 16.5%), Professional & Scientific (27 | 12.7%), Educational Services (17 | 8.0%), and Arts, Entertainment & Recreation (17 | 8.0%).
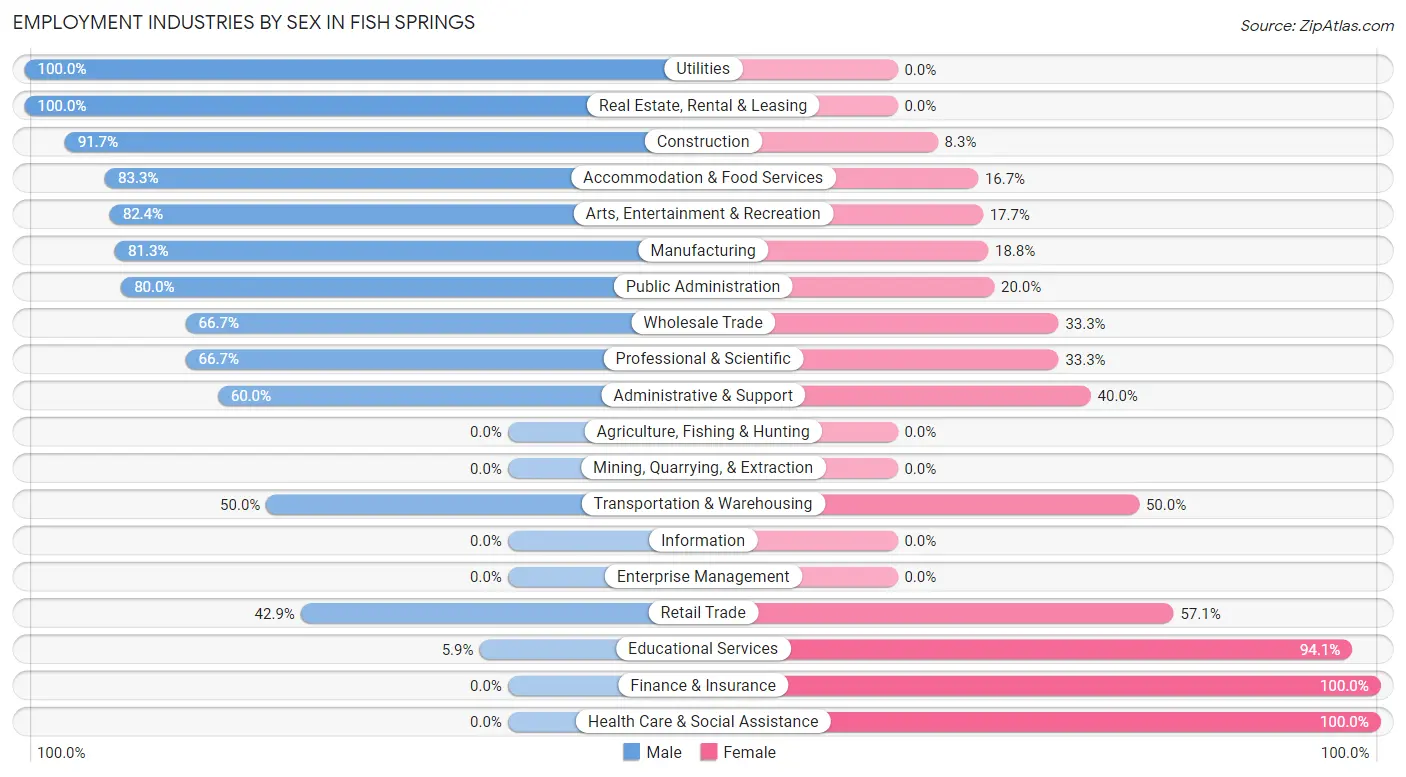
Employment Industries by Sex in Fish Springs
The Fish Springs industries that see more men than women are Utilities (100.0%), Real Estate, Rental & Leasing (100.0%), and Construction (91.7%), whereas the industries that tend to have a higher number of women are Finance & Insurance (100.0%), Health Care & Social Assistance (100.0%), and Educational Services (94.1%).
| Industry | Male | Female |
| Agriculture, Fishing & Hunting | 0 (0.0%) | 0 (0.0%) |
| Mining, Quarrying, & Extraction | 0 (0.0%) | 0 (0.0%) |
| Construction | 33 (91.7%) | 3 (8.3%) |
| Manufacturing | 13 (81.2%) | 3 (18.8%) |
| Wholesale Trade | 2 (66.7%) | 1 (33.3%) |
| Retail Trade | 15 (42.9%) | 20 (57.1%) |
| Transportation & Warehousing | 2 (50.0%) | 2 (50.0%) |
| Utilities | 3 (100.0%) | 0 (0.0%) |
| Information | 0 (0.0%) | 0 (0.0%) |
| Finance & Insurance | 0 (0.0%) | 1 (100.0%) |
| Real Estate, Rental & Leasing | 5 (100.0%) | 0 (0.0%) |
| Professional & Scientific | 18 (66.7%) | 9 (33.3%) |
| Enterprise Management | 0 (0.0%) | 0 (0.0%) |
| Administrative & Support | 3 (60.0%) | 2 (40.0%) |
| Educational Services | 1 (5.9%) | 16 (94.1%) |
| Health Care & Social Assistance | 0 (0.0%) | 11 (100.0%) |
| Arts, Entertainment & Recreation | 14 (82.4%) | 3 (17.6%) |
| Accommodation & Food Services | 10 (83.3%) | 2 (16.7%) |
| Public Administration | 8 (80.0%) | 2 (20.0%) |
| Total | 130 (61.3%) | 82 (38.7%) |
Education in Fish Springs
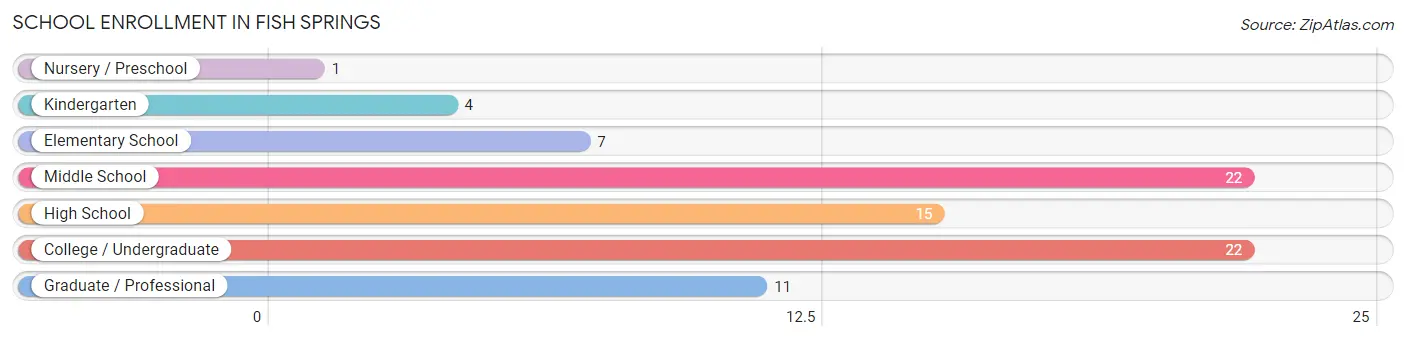
School Enrollment in Fish Springs
The most common levels of schooling among the 82 students in Fish Springs are middle school (22 | 26.8%), college / undergraduate (22 | 26.8%), and high school (15 | 18.3%).
| School Level | # Students | % Students |
| Nursery / Preschool | 1 | 1.2% |
| Kindergarten | 4 | 4.9% |
| Elementary School | 7 | 8.5% |
| Middle School | 22 | 26.8% |
| High School | 15 | 18.3% |
| College / Undergraduate | 22 | 26.8% |
| Graduate / Professional | 11 | 13.4% |
| Total | 82 | 100.0% |
School Enrollment by Age by Funding Source in Fish Springs
Out of a total of 82 students who are enrolled in schools in Fish Springs, 8 (9.8%) attend a private institution, while the remaining 74 (90.2%) are enrolled in public schools. The age group of 5 to 9 year old has the highest likelihood of being enrolled in private schools, with 4 (36.4% in the age bracket) enrolled. Conversely, the age group of 3 to 4 year olds has the lowest likelihood of being enrolled in a private school, with 1 (100.0% in the age bracket) attending a public institution.
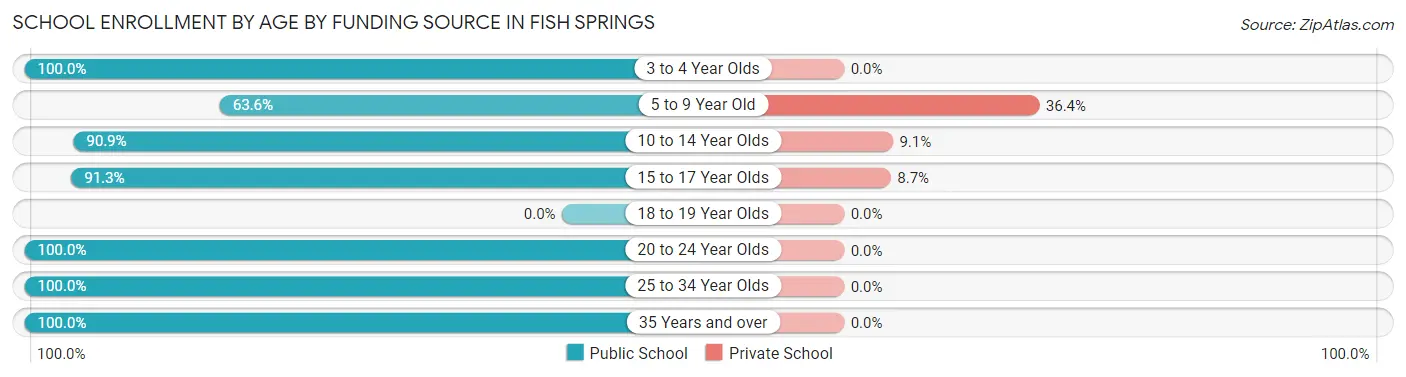
| Age Bracket | Public School | Private School |
| 3 to 4 Year Olds | 1 (100.0%) | 0 (0.0%) |
| 5 to 9 Year Old | 7 (63.6%) | 4 (36.4%) |
| 10 to 14 Year Olds | 20 (90.9%) | 2 (9.1%) |
| 15 to 17 Year Olds | 21 (91.3%) | 2 (8.7%) |
| 18 to 19 Year Olds | 0 (0.0%) | 0 (0.0%) |
| 20 to 24 Year Olds | 9 (100.0%) | 0 (0.0%) |
| 25 to 34 Year Olds | 2 (100.0%) | 0 (0.0%) |
| 35 Years and over | 14 (100.0%) | 0 (0.0%) |
| Total | 74 (90.2%) | 8 (9.8%) |
Educational Attainment by Field of Study in Fish Springs
Bio, nature & agricultural (17 | 18.1%), education (16 | 17.0%), physical & health sciences (15 | 16.0%), literature & languages (15 | 16.0%), and social sciences (8 | 8.5%) are the most common fields of study among 94 individuals in Fish Springs who have obtained a bachelor's degree or higher.
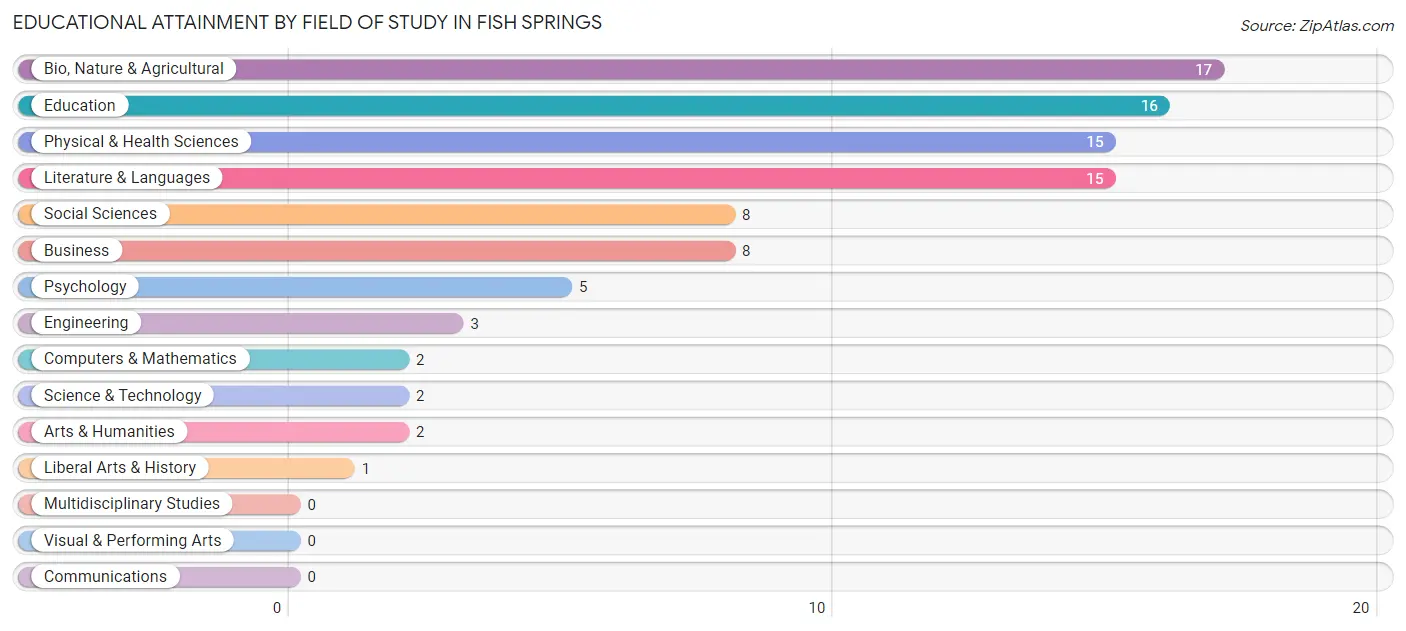
| Field of Study | # Graduates | % Graduates |
| Computers & Mathematics | 2 | 2.1% |
| Bio, Nature & Agricultural | 17 | 18.1% |
| Physical & Health Sciences | 15 | 16.0% |
| Psychology | 5 | 5.3% |
| Social Sciences | 8 | 8.5% |
| Engineering | 3 | 3.2% |
| Multidisciplinary Studies | 0 | 0.0% |
| Science & Technology | 2 | 2.1% |
| Business | 8 | 8.5% |
| Education | 16 | 17.0% |
| Literature & Languages | 15 | 16.0% |
| Liberal Arts & History | 1 | 1.1% |
| Visual & Performing Arts | 0 | 0.0% |
| Communications | 0 | 0.0% |
| Arts & Humanities | 2 | 2.1% |
| Total | 94 | 100.0% |
Transportation & Commute in Fish Springs
Vehicle Availability by Sex in Fish Springs
The most prevalent vehicle ownership categories in Fish Springs are males with 4 vehicles (37, accounting for 28.5%) and females with 4 vehicles (23, making up 45.7%).
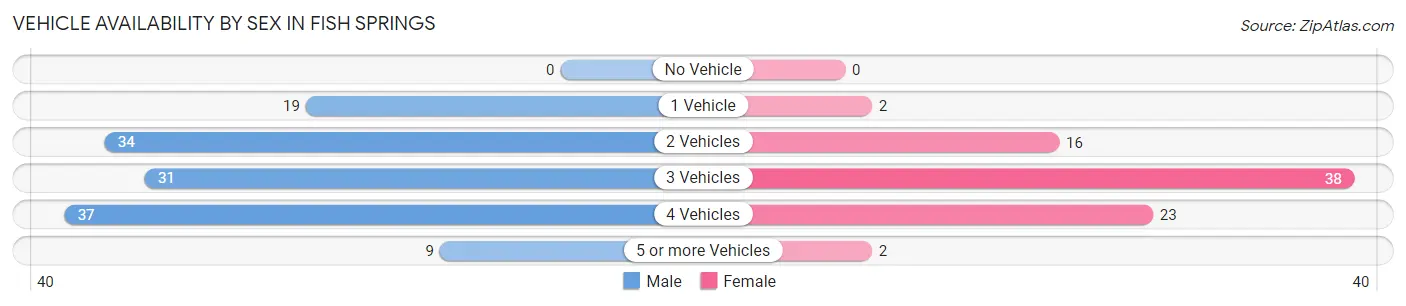
| Vehicles Available | Male | Female |
| No Vehicle | 0 (0.0%) | 0 (0.0%) |
| 1 Vehicle | 19 (14.6%) | 2 (2.5%) |
| 2 Vehicles | 34 (26.2%) | 16 (19.8%) |
| 3 Vehicles | 31 (23.8%) | 38 (46.9%) |
| 4 Vehicles | 37 (28.5%) | 23 (28.4%) |
| 5 or more Vehicles | 9 (6.9%) | 2 (2.5%) |
| Total | 130 (100.0%) | 81 (100.0%) |
Commute Time in Fish Springs
The most frequently occuring commute durations in Fish Springs are 15 to 19 minutes (36 commuters, 19.3%), 10 to 14 minutes (27 commuters, 14.4%), and 20 to 24 minutes (26 commuters, 13.9%).
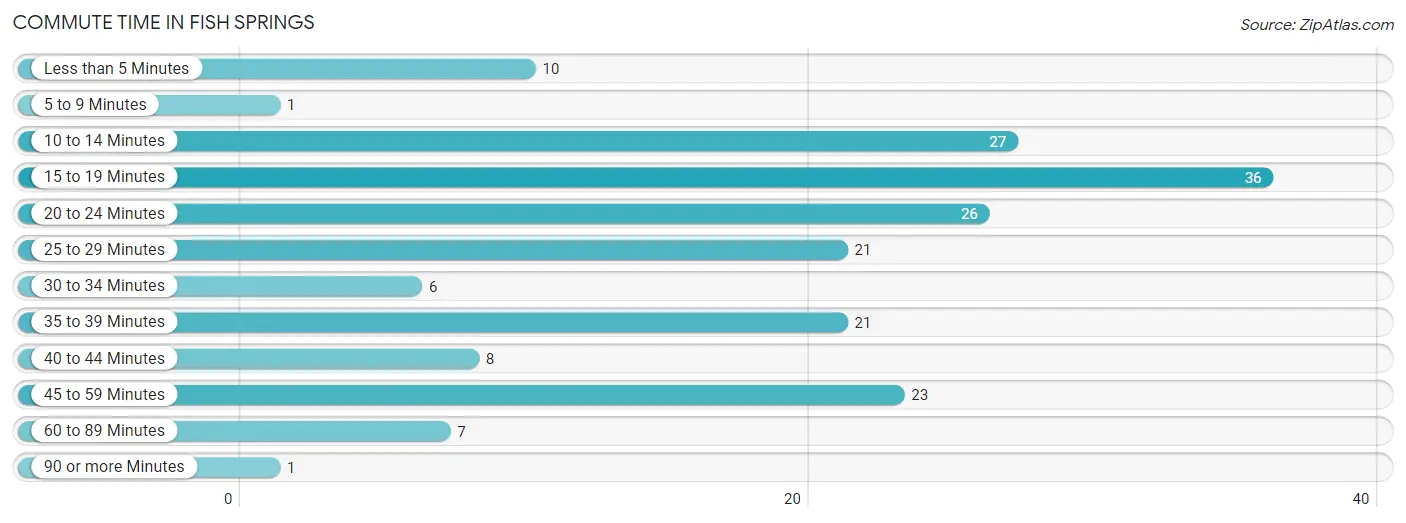
| Commute Time | # Commuters | % Commuters |
| Less than 5 Minutes | 10 | 5.3% |
| 5 to 9 Minutes | 1 | 0.5% |
| 10 to 14 Minutes | 27 | 14.4% |
| 15 to 19 Minutes | 36 | 19.3% |
| 20 to 24 Minutes | 26 | 13.9% |
| 25 to 29 Minutes | 21 | 11.2% |
| 30 to 34 Minutes | 6 | 3.2% |
| 35 to 39 Minutes | 21 | 11.2% |
| 40 to 44 Minutes | 8 | 4.3% |
| 45 to 59 Minutes | 23 | 12.3% |
| 60 to 89 Minutes | 7 | 3.7% |
| 90 or more Minutes | 1 | 0.5% |
Commute Time by Sex in Fish Springs
The most common commute times in Fish Springs are 15 to 19 minutes (25 commuters, 21.2%) for males and 35 to 39 minutes (19 commuters, 27.5%) for females.
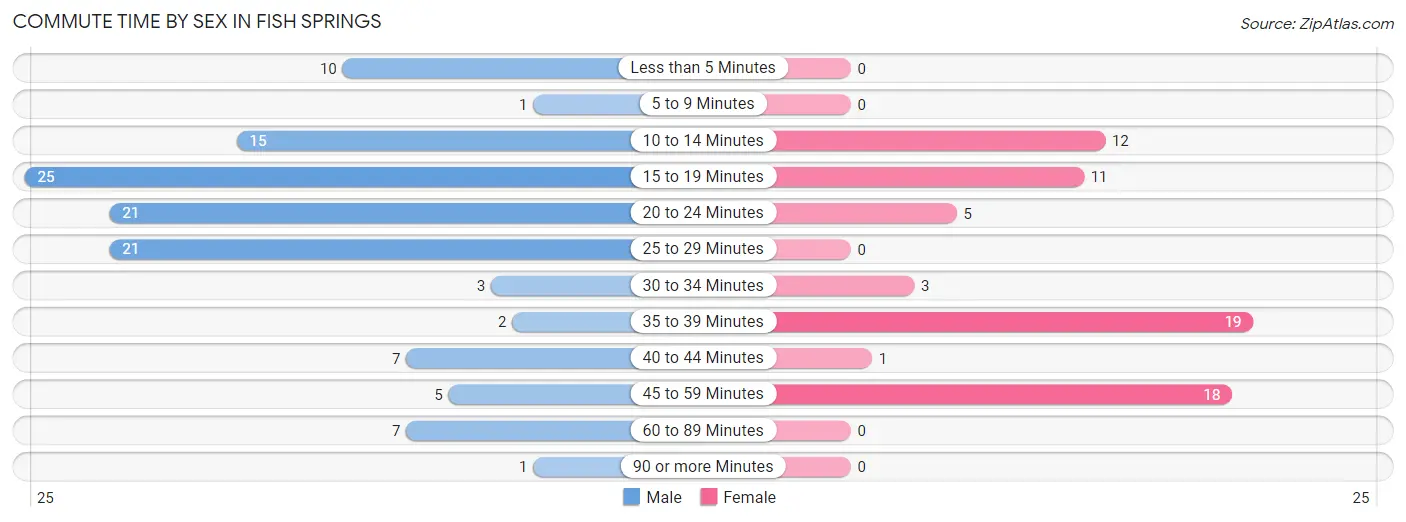
| Commute Time | Male | Female |
| Less than 5 Minutes | 10 (8.5%) | 0 (0.0%) |
| 5 to 9 Minutes | 1 (0.9%) | 0 (0.0%) |
| 10 to 14 Minutes | 15 (12.7%) | 12 (17.4%) |
| 15 to 19 Minutes | 25 (21.2%) | 11 (15.9%) |
| 20 to 24 Minutes | 21 (17.8%) | 5 (7.2%) |
| 25 to 29 Minutes | 21 (17.8%) | 0 (0.0%) |
| 30 to 34 Minutes | 3 (2.5%) | 3 (4.3%) |
| 35 to 39 Minutes | 2 (1.7%) | 19 (27.5%) |
| 40 to 44 Minutes | 7 (5.9%) | 1 (1.5%) |
| 45 to 59 Minutes | 5 (4.2%) | 18 (26.1%) |
| 60 to 89 Minutes | 7 (5.9%) | 0 (0.0%) |
| 90 or more Minutes | 1 (0.9%) | 0 (0.0%) |
Time of Departure to Work by Sex in Fish Springs
The most frequent times of departure to work in Fish Springs are 6:30 AM to 6:59 AM (38, 32.2%) for males and 7:00 AM to 7:29 AM (20, 29.0%) for females.
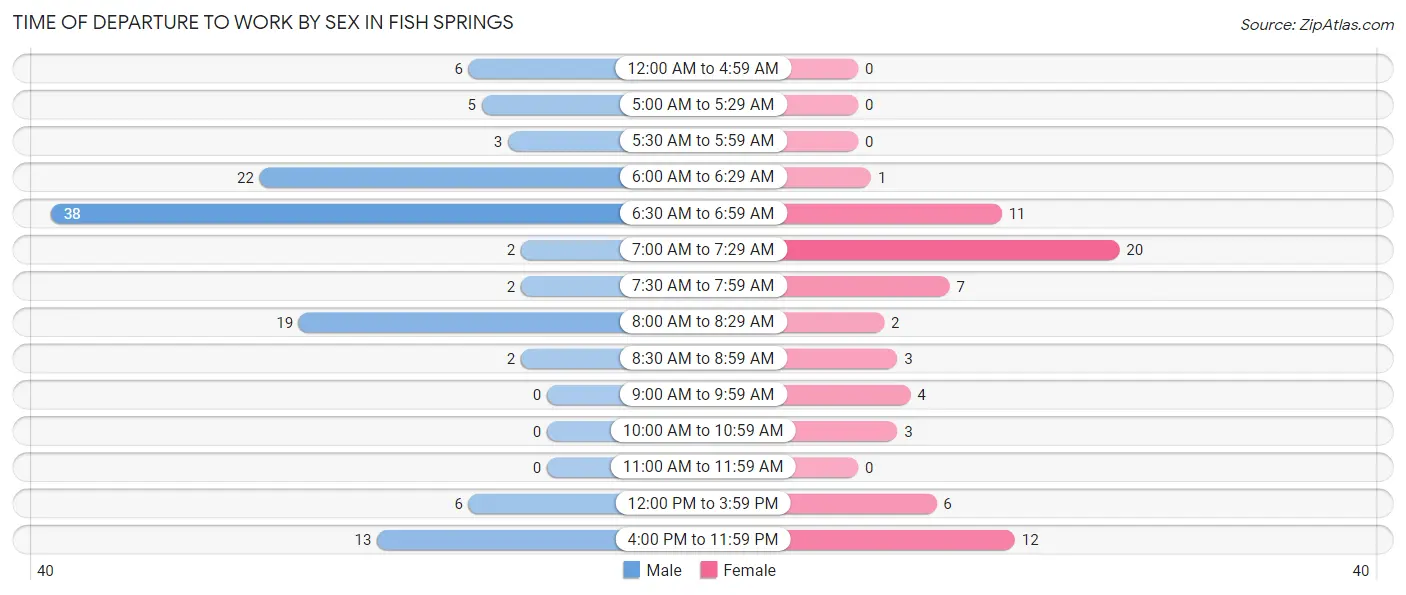
| Time of Departure | Male | Female |
| 12:00 AM to 4:59 AM | 6 (5.1%) | 0 (0.0%) |
| 5:00 AM to 5:29 AM | 5 (4.2%) | 0 (0.0%) |
| 5:30 AM to 5:59 AM | 3 (2.5%) | 0 (0.0%) |
| 6:00 AM to 6:29 AM | 22 (18.6%) | 1 (1.5%) |
| 6:30 AM to 6:59 AM | 38 (32.2%) | 11 (15.9%) |
| 7:00 AM to 7:29 AM | 2 (1.7%) | 20 (29.0%) |
| 7:30 AM to 7:59 AM | 2 (1.7%) | 7 (10.1%) |
| 8:00 AM to 8:29 AM | 19 (16.1%) | 2 (2.9%) |
| 8:30 AM to 8:59 AM | 2 (1.7%) | 3 (4.3%) |
| 9:00 AM to 9:59 AM | 0 (0.0%) | 4 (5.8%) |
| 10:00 AM to 10:59 AM | 0 (0.0%) | 3 (4.3%) |
| 11:00 AM to 11:59 AM | 0 (0.0%) | 0 (0.0%) |
| 12:00 PM to 3:59 PM | 6 (5.1%) | 6 (8.7%) |
| 4:00 PM to 11:59 PM | 13 (11.0%) | 12 (17.4%) |
| Total | 118 (100.0%) | 69 (100.0%) |
Housing Occupancy in Fish Springs
Occupancy by Ownership in Fish Springs
Of the total 225 dwellings in Fish Springs, owner-occupied units account for 198 (88.0%), while renter-occupied units make up 27 (12.0%).
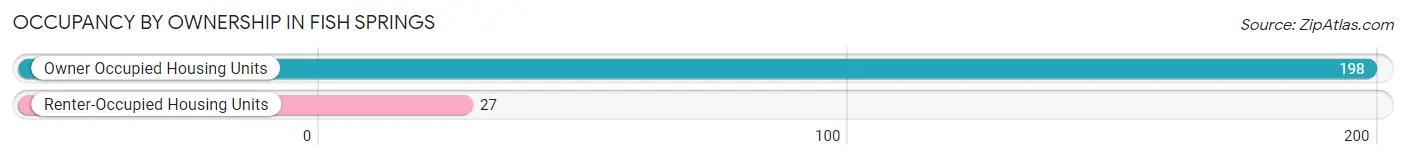
| Occupancy | # Housing Units | % Housing Units |
| Owner Occupied Housing Units | 198 | 88.0% |
| Renter-Occupied Housing Units | 27 | 12.0% |
| Total Occupied Housing Units | 225 | 100.0% |
Occupancy by Household Size in Fish Springs
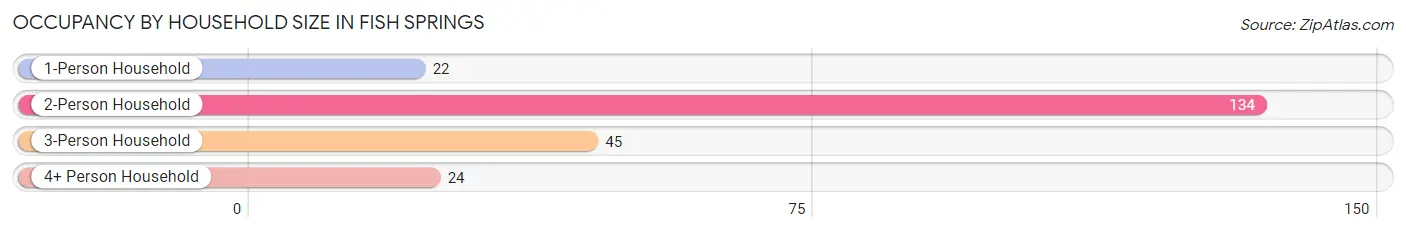
| Household Size | # Housing Units | % Housing Units |
| 1-Person Household | 22 | 9.8% |
| 2-Person Household | 134 | 59.6% |
| 3-Person Household | 45 | 20.0% |
| 4+ Person Household | 24 | 10.7% |
| Total Housing Units | 225 | 100.0% |
Occupancy by Ownership by Household Size in Fish Springs
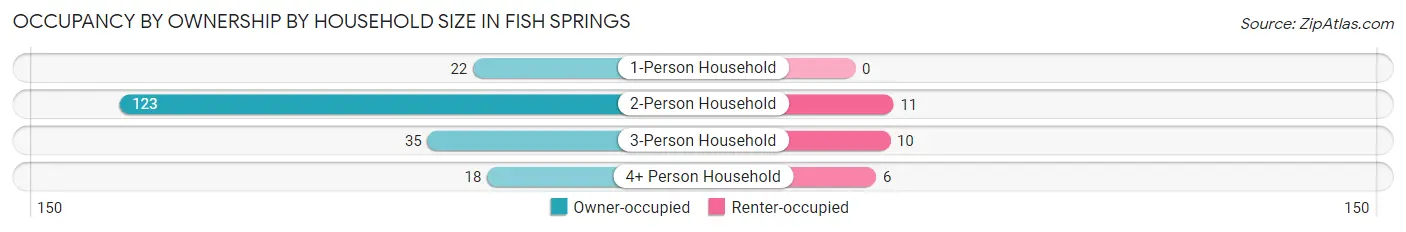
| Household Size | Owner-occupied | Renter-occupied |
| 1-Person Household | 22 (100.0%) | 0 (0.0%) |
| 2-Person Household | 123 (91.8%) | 11 (8.2%) |
| 3-Person Household | 35 (77.8%) | 10 (22.2%) |
| 4+ Person Household | 18 (75.0%) | 6 (25.0%) |
| Total Housing Units | 198 (88.0%) | 27 (12.0%) |
Occupancy by Educational Attainment in Fish Springs
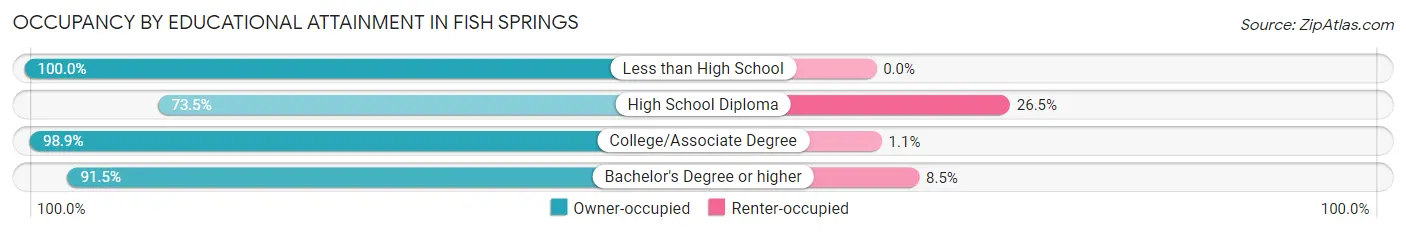
| Household Size | Owner-occupied | Renter-occupied |
| Less than High School | 3 (100.0%) | 0 (0.0%) |
| High School Diploma | 61 (73.5%) | 22 (26.5%) |
| College/Associate Degree | 91 (98.9%) | 1 (1.1%) |
| Bachelor's Degree or higher | 43 (91.5%) | 4 (8.5%) |
Occupancy by Age of Householder in Fish Springs
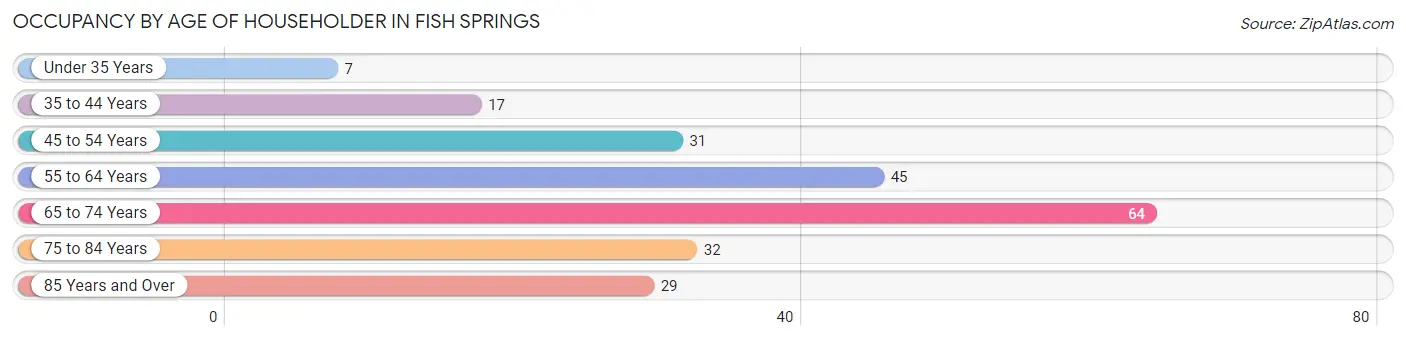
| Age Bracket | # Households | % Households |
| Under 35 Years | 7 | 3.1% |
| 35 to 44 Years | 17 | 7.6% |
| 45 to 54 Years | 31 | 13.8% |
| 55 to 64 Years | 45 | 20.0% |
| 65 to 74 Years | 64 | 28.4% |
| 75 to 84 Years | 32 | 14.2% |
| 85 Years and Over | 29 | 12.9% |
| Total | 225 | 100.0% |
Housing Finances in Fish Springs
Median Income by Occupancy in Fish Springs
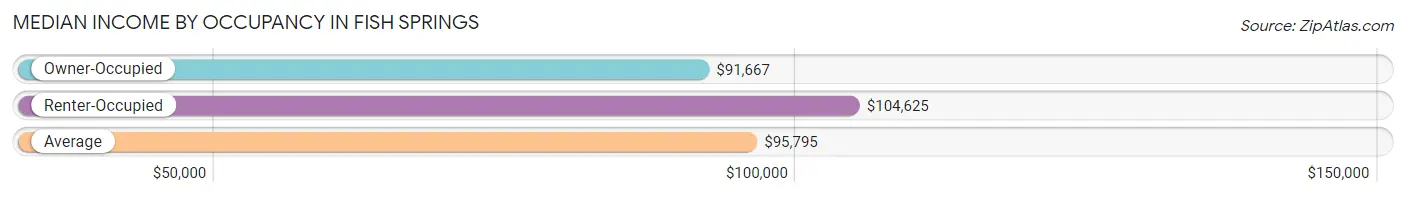
| Occupancy Type | # Households | Median Income |
| Owner-Occupied | 198 (88.0%) | $91,667 |
| Renter-Occupied | 27 (12.0%) | $104,625 |
| Average | 225 (100.0%) | $95,795 |
Occupancy by Householder Income Bracket in Fish Springs
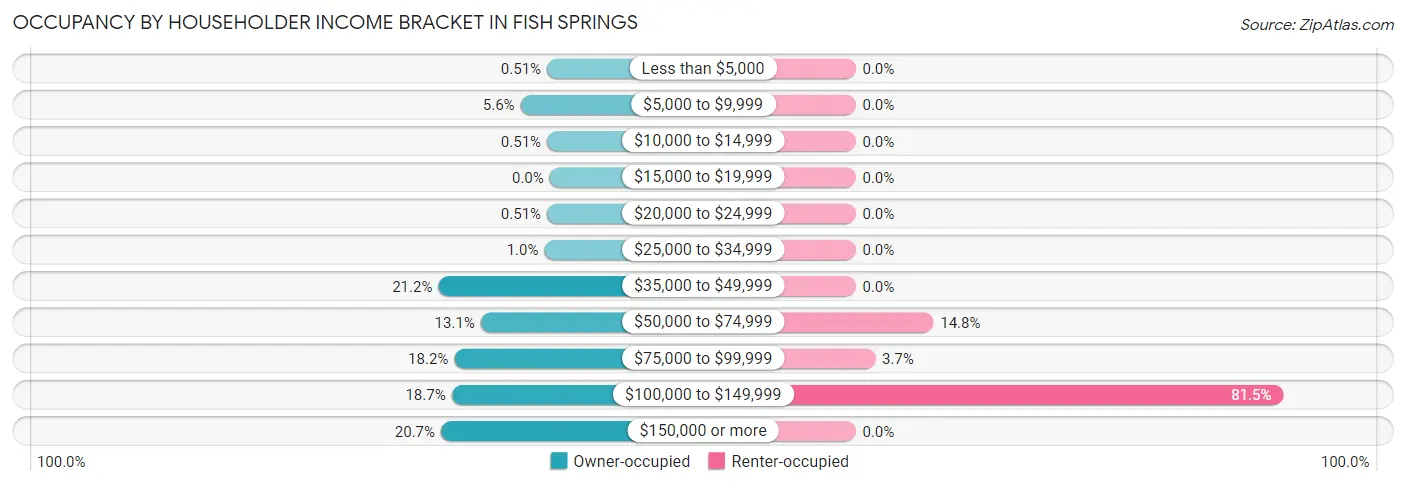
| Income Bracket | Owner-occupied | Renter-occupied |
| Less than $5,000 | 1 (0.5%) | 0 (0.0%) |
| $5,000 to $9,999 | 11 (5.6%) | 0 (0.0%) |
| $10,000 to $14,999 | 1 (0.5%) | 0 (0.0%) |
| $15,000 to $19,999 | 0 (0.0%) | 0 (0.0%) |
| $20,000 to $24,999 | 1 (0.5%) | 0 (0.0%) |
| $25,000 to $34,999 | 2 (1.0%) | 0 (0.0%) |
| $35,000 to $49,999 | 42 (21.2%) | 0 (0.0%) |
| $50,000 to $74,999 | 26 (13.1%) | 4 (14.8%) |
| $75,000 to $99,999 | 36 (18.2%) | 1 (3.7%) |
| $100,000 to $149,999 | 37 (18.7%) | 22 (81.5%) |
| $150,000 or more | 41 (20.7%) | 0 (0.0%) |
| Total | 198 (100.0%) | 27 (100.0%) |
Monthly Housing Cost Tiers in Fish Springs
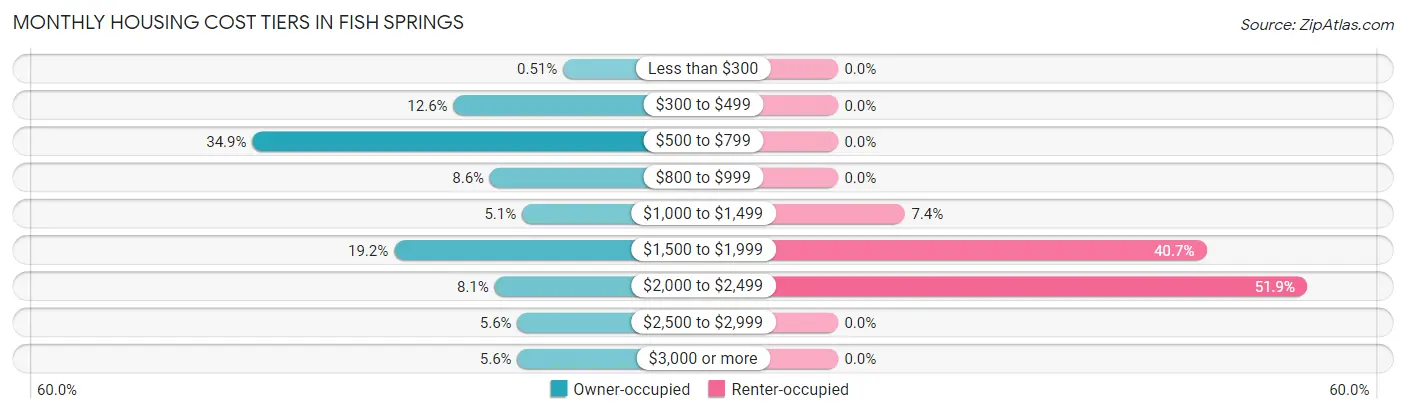
| Monthly Cost | Owner-occupied | Renter-occupied |
| Less than $300 | 1 (0.5%) | 0 (0.0%) |
| $300 to $499 | 25 (12.6%) | 0 (0.0%) |
| $500 to $799 | 69 (34.8%) | 0 (0.0%) |
| $800 to $999 | 17 (8.6%) | 0 (0.0%) |
| $1,000 to $1,499 | 10 (5.1%) | 2 (7.4%) |
| $1,500 to $1,999 | 38 (19.2%) | 11 (40.7%) |
| $2,000 to $2,499 | 16 (8.1%) | 14 (51.8%) |
| $2,500 to $2,999 | 11 (5.6%) | 0 (0.0%) |
| $3,000 or more | 11 (5.6%) | 0 (0.0%) |
| Total | 198 (100.0%) | 27 (100.0%) |
Physical Housing Characteristics in Fish Springs
Housing Structures in Fish Springs
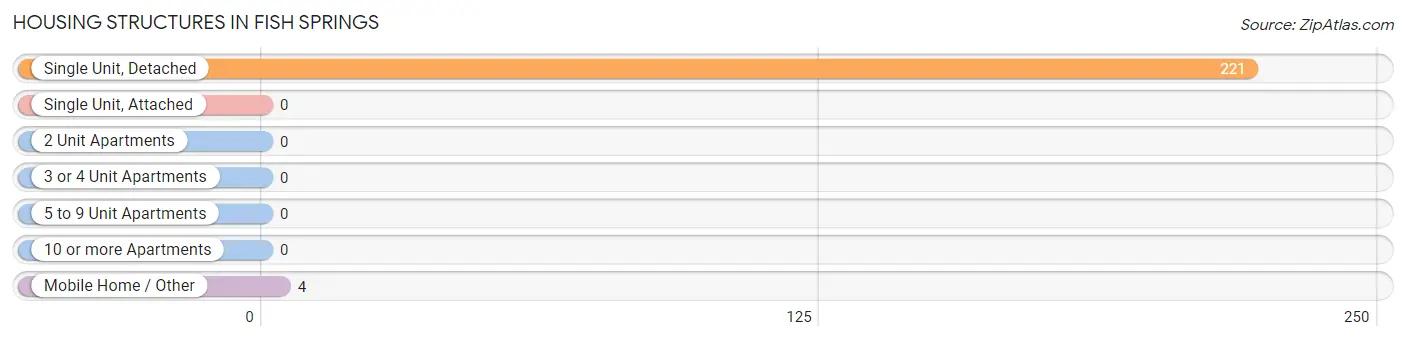
| Structure Type | # Housing Units | % Housing Units |
| Single Unit, Detached | 221 | 98.2% |
| Single Unit, Attached | 0 | 0.0% |
| 2 Unit Apartments | 0 | 0.0% |
| 3 or 4 Unit Apartments | 0 | 0.0% |
| 5 to 9 Unit Apartments | 0 | 0.0% |
| 10 or more Apartments | 0 | 0.0% |
| Mobile Home / Other | 4 | 1.8% |
| Total | 225 | 100.0% |
Housing Structures by Occupancy in Fish Springs
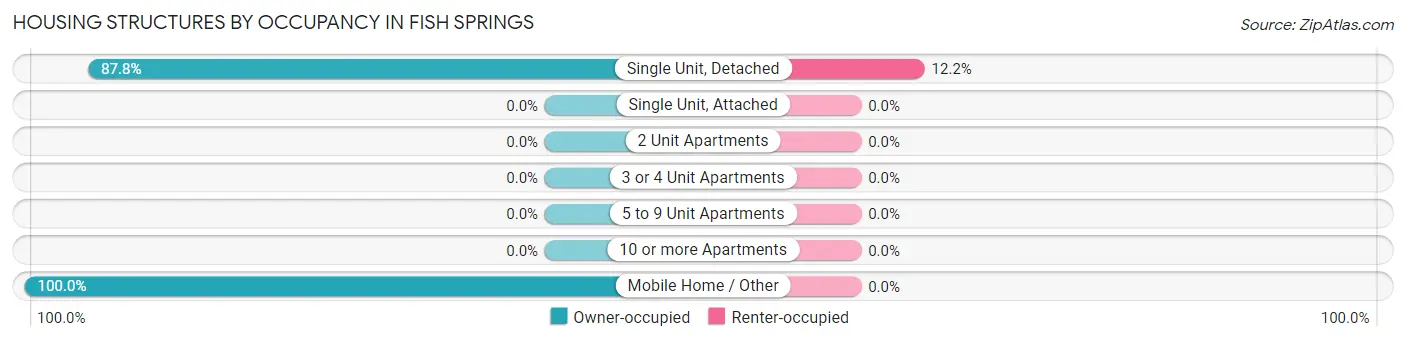
| Structure Type | Owner-occupied | Renter-occupied |
| Single Unit, Detached | 194 (87.8%) | 27 (12.2%) |
| Single Unit, Attached | 0 (0.0%) | 0 (0.0%) |
| 2 Unit Apartments | 0 (0.0%) | 0 (0.0%) |
| 3 or 4 Unit Apartments | 0 (0.0%) | 0 (0.0%) |
| 5 to 9 Unit Apartments | 0 (0.0%) | 0 (0.0%) |
| 10 or more Apartments | 0 (0.0%) | 0 (0.0%) |
| Mobile Home / Other | 4 (100.0%) | 0 (0.0%) |
| Total | 198 (88.0%) | 27 (12.0%) |
Housing Structures by Number of Rooms in Fish Springs
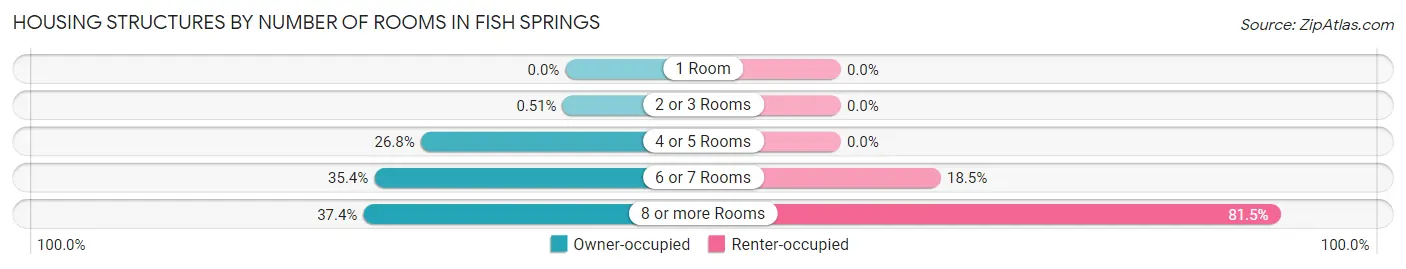
| Number of Rooms | Owner-occupied | Renter-occupied |
| 1 Room | 0 (0.0%) | 0 (0.0%) |
| 2 or 3 Rooms | 1 (0.5%) | 0 (0.0%) |
| 4 or 5 Rooms | 53 (26.8%) | 0 (0.0%) |
| 6 or 7 Rooms | 70 (35.3%) | 5 (18.5%) |
| 8 or more Rooms | 74 (37.4%) | 22 (81.5%) |
| Total | 198 (100.0%) | 27 (100.0%) |
Housing Structure by Heating Type in Fish Springs
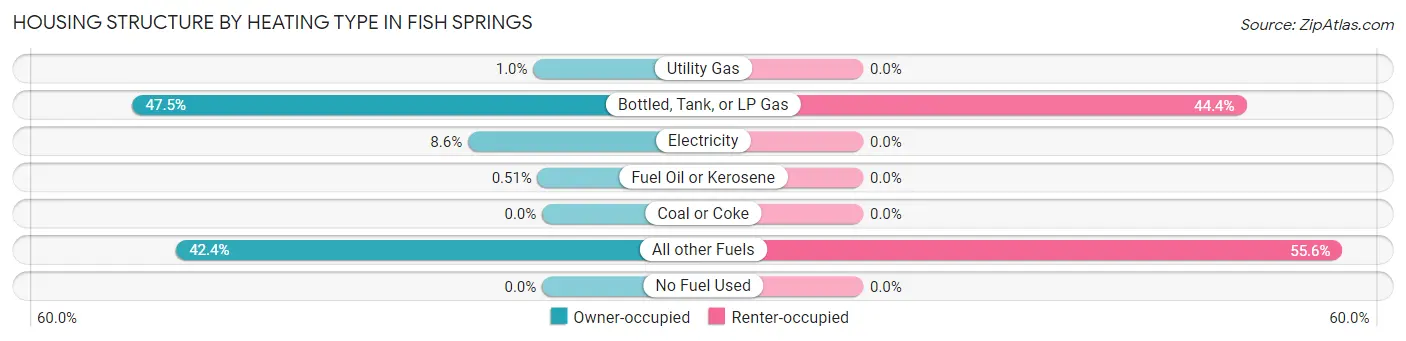
| Heating Type | Owner-occupied | Renter-occupied |
| Utility Gas | 2 (1.0%) | 0 (0.0%) |
| Bottled, Tank, or LP Gas | 94 (47.5%) | 12 (44.4%) |
| Electricity | 17 (8.6%) | 0 (0.0%) |
| Fuel Oil or Kerosene | 1 (0.5%) | 0 (0.0%) |
| Coal or Coke | 0 (0.0%) | 0 (0.0%) |
| All other Fuels | 84 (42.4%) | 15 (55.6%) |
| No Fuel Used | 0 (0.0%) | 0 (0.0%) |
| Total | 198 (100.0%) | 27 (100.0%) |
Household Vehicle Usage in Fish Springs
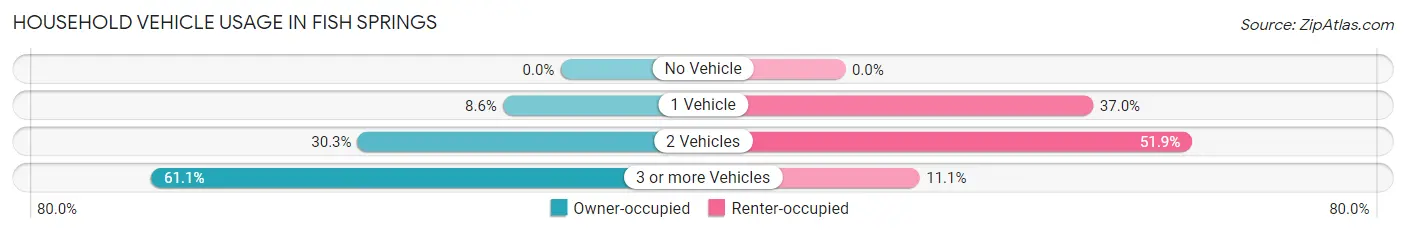
| Vehicles per Household | Owner-occupied | Renter-occupied |
| No Vehicle | 0 (0.0%) | 0 (0.0%) |
| 1 Vehicle | 17 (8.6%) | 10 (37.0%) |
| 2 Vehicles | 60 (30.3%) | 14 (51.8%) |
| 3 or more Vehicles | 121 (61.1%) | 3 (11.1%) |
| Total | 198 (100.0%) | 27 (100.0%) |
Real Estate & Mortgages in Fish Springs
Real Estate and Mortgage Overview in Fish Springs
| Characteristic | Without Mortgage | With Mortgage |
| Housing Units | 112 | 86 |
| Median Property Value | $602,500 | $676,800 |
| Median Household Income | $58,750 | $24 |
| Monthly Housing Costs | $604 | $11 |
| Real Estate Taxes | $2,593 | $0 |
Property Value by Mortgage Status in Fish Springs
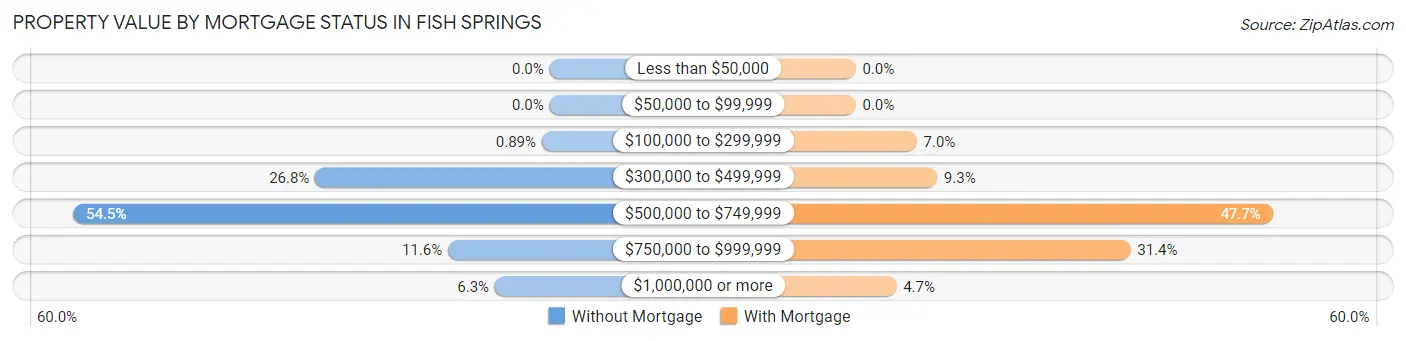
| Property Value | Without Mortgage | With Mortgage |
| Less than $50,000 | 0 (0.0%) | 0 (0.0%) |
| $50,000 to $99,999 | 0 (0.0%) | 0 (0.0%) |
| $100,000 to $299,999 | 1 (0.9%) | 6 (7.0%) |
| $300,000 to $499,999 | 30 (26.8%) | 8 (9.3%) |
| $500,000 to $749,999 | 61 (54.5%) | 41 (47.7%) |
| $750,000 to $999,999 | 13 (11.6%) | 27 (31.4%) |
| $1,000,000 or more | 7 (6.2%) | 4 (4.6%) |
| Total | 112 (100.0%) | 86 (100.0%) |
Household Income by Mortgage Status in Fish Springs
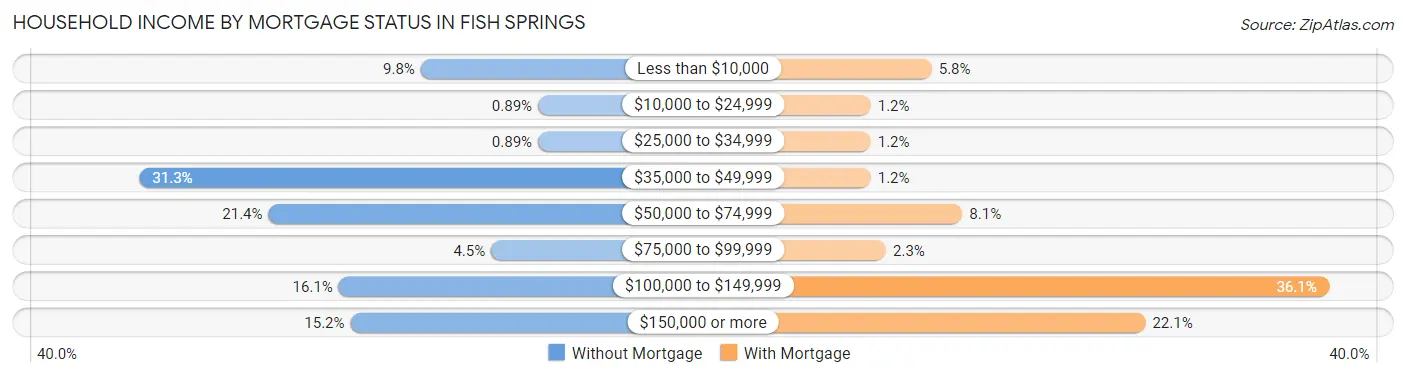
| Household Income | Without Mortgage | With Mortgage |
| Less than $10,000 | 11 (9.8%) | 5 (5.8%) |
| $10,000 to $24,999 | 1 (0.9%) | 1 (1.2%) |
| $25,000 to $34,999 | 1 (0.9%) | 1 (1.2%) |
| $35,000 to $49,999 | 35 (31.2%) | 1 (1.2%) |
| $50,000 to $74,999 | 24 (21.4%) | 7 (8.1%) |
| $75,000 to $99,999 | 5 (4.5%) | 2 (2.3%) |
| $100,000 to $149,999 | 18 (16.1%) | 31 (36.0%) |
| $150,000 or more | 17 (15.2%) | 19 (22.1%) |
| Total | 112 (100.0%) | 86 (100.0%) |
Property Value to Household Income Ratio in Fish Springs
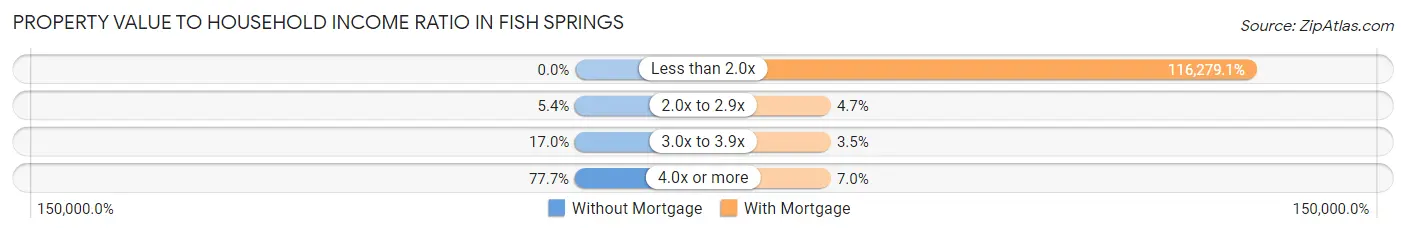
| Value-to-Income Ratio | Without Mortgage | With Mortgage |
| Less than 2.0x | 0 (0.0%) | 100,000 (116,279.1%) |
| 2.0x to 2.9x | 6 (5.4%) | 4 (4.6%) |
| 3.0x to 3.9x | 19 (17.0%) | 3 (3.5%) |
| 4.0x or more | 87 (77.7%) | 6 (7.0%) |
| Total | 112 (100.0%) | 86 (100.0%) |
Real Estate Taxes by Mortgage Status in Fish Springs
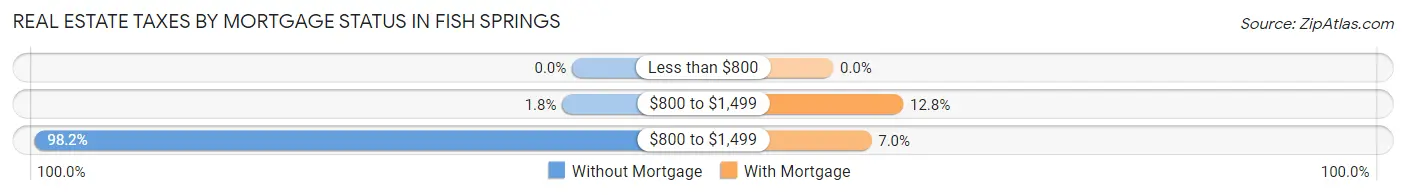
| Property Taxes | Without Mortgage | With Mortgage |
| Less than $800 | 0 (0.0%) | 0 (0.0%) |
| $800 to $1,499 | 2 (1.8%) | 11 (12.8%) |
| $800 to $1,499 | 110 (98.2%) | 6 (7.0%) |
| Total | 112 (100.0%) | 86 (100.0%) |
Health & Disability in Fish Springs
Health Insurance Coverage by Age in Fish Springs
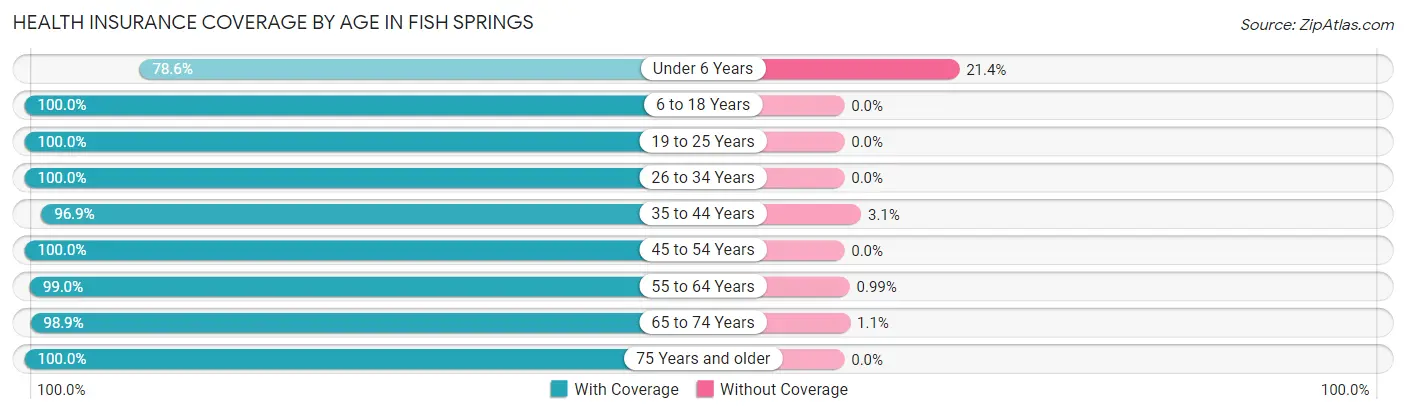
| Age Bracket | With Coverage | Without Coverage |
| Under 6 Years | 22 (78.6%) | 6 (21.4%) |
| 6 to 18 Years | 57 (100.0%) | 0 (0.0%) |
| 19 to 25 Years | 21 (100.0%) | 0 (0.0%) |
| 26 to 34 Years | 25 (100.0%) | 0 (0.0%) |
| 35 to 44 Years | 31 (96.9%) | 1 (3.1%) |
| 45 to 54 Years | 67 (100.0%) | 0 (0.0%) |
| 55 to 64 Years | 100 (99.0%) | 1 (1.0%) |
| 65 to 74 Years | 92 (98.9%) | 1 (1.1%) |
| 75 Years and older | 125 (100.0%) | 0 (0.0%) |
| Total | 540 (98.4%) | 9 (1.6%) |
Health Insurance Coverage by Citizenship Status in Fish Springs
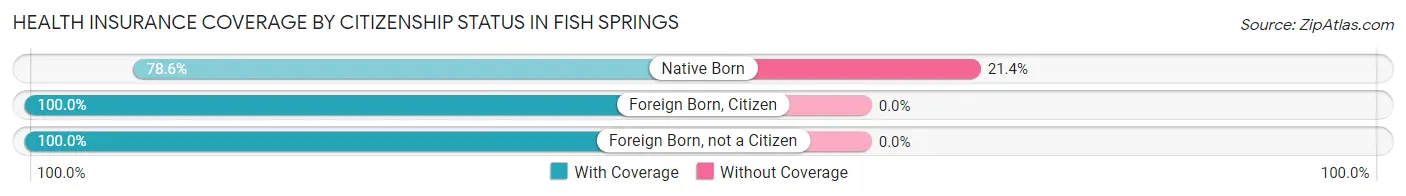
| Citizenship Status | With Coverage | Without Coverage |
| Native Born | 22 (78.6%) | 6 (21.4%) |
| Foreign Born, Citizen | 57 (100.0%) | 0 (0.0%) |
| Foreign Born, not a Citizen | 21 (100.0%) | 0 (0.0%) |
Health Insurance Coverage by Household Income in Fish Springs
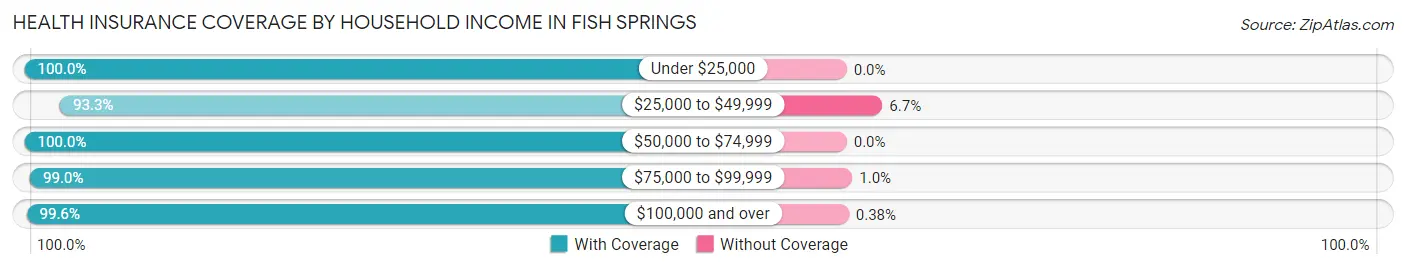
| Household Income | With Coverage | Without Coverage |
| Under $25,000 | 15 (100.0%) | 0 (0.0%) |
| $25,000 to $49,999 | 98 (93.3%) | 7 (6.7%) |
| $50,000 to $74,999 | 71 (100.0%) | 0 (0.0%) |
| $75,000 to $99,999 | 95 (99.0%) | 1 (1.0%) |
| $100,000 and over | 261 (99.6%) | 1 (0.4%) |
Public vs Private Health Insurance Coverage by Age in Fish Springs
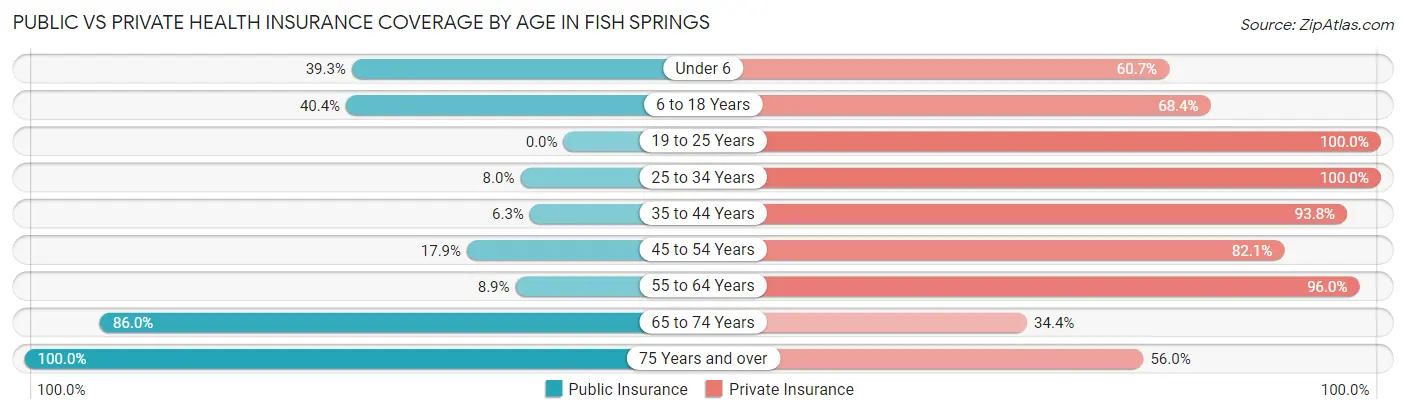
| Age Bracket | Public Insurance | Private Insurance |
| Under 6 | 11 (39.3%) | 17 (60.7%) |
| 6 to 18 Years | 23 (40.4%) | 39 (68.4%) |
| 19 to 25 Years | 0 (0.0%) | 21 (100.0%) |
| 25 to 34 Years | 2 (8.0%) | 25 (100.0%) |
| 35 to 44 Years | 2 (6.2%) | 30 (93.8%) |
| 45 to 54 Years | 12 (17.9%) | 55 (82.1%) |
| 55 to 64 Years | 9 (8.9%) | 97 (96.0%) |
| 65 to 74 Years | 80 (86.0%) | 32 (34.4%) |
| 75 Years and over | 125 (100.0%) | 70 (56.0%) |
| Total | 264 (48.1%) | 386 (70.3%) |
Disability Status by Sex by Age in Fish Springs
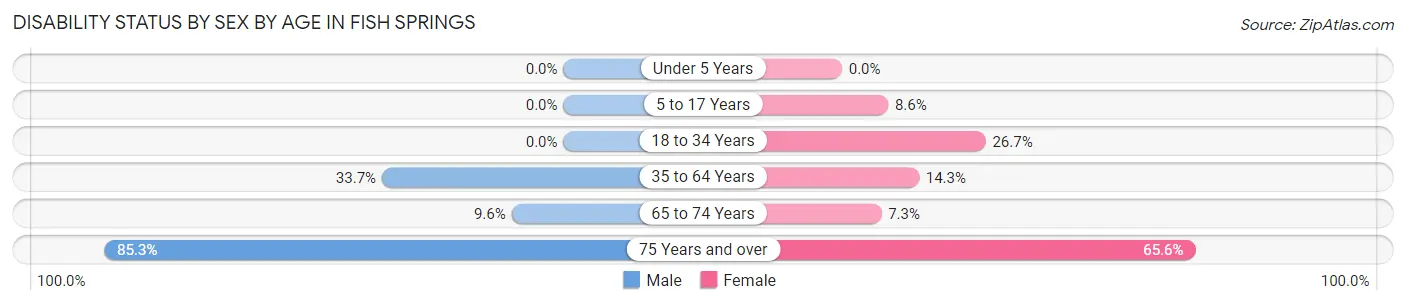
| Age Bracket | Male | Female |
| Under 5 Years | 0 (0.0%) | 0 (0.0%) |
| 5 to 17 Years | 0 (0.0%) | 3 (8.6%) |
| 18 to 34 Years | 0 (0.0%) | 4 (26.7%) |
| 35 to 64 Years | 32 (33.7%) | 15 (14.3%) |
| 65 to 74 Years | 5 (9.6%) | 3 (7.3%) |
| 75 Years and over | 52 (85.3%) | 42 (65.6%) |
Disability Class by Sex by Age in Fish Springs
Disability Class: Hearing Difficulty
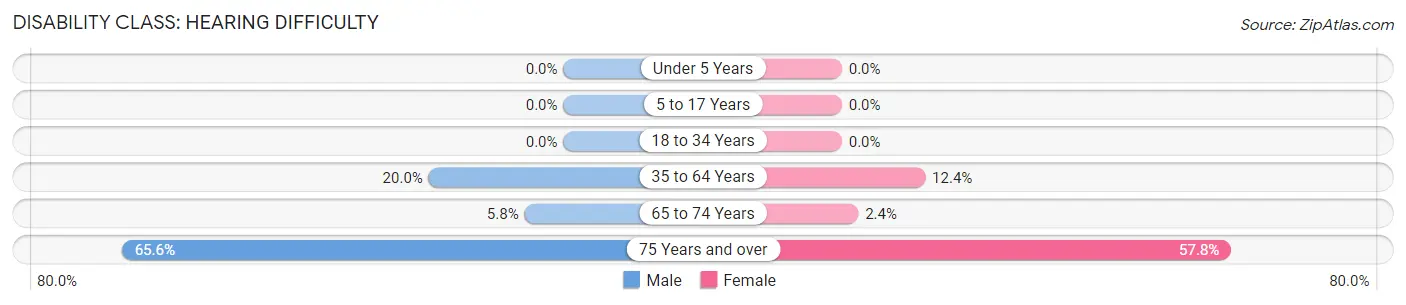
| Age Bracket | Male | Female |
| Under 5 Years | 0 (0.0%) | 0 (0.0%) |
| 5 to 17 Years | 0 (0.0%) | 0 (0.0%) |
| 18 to 34 Years | 0 (0.0%) | 0 (0.0%) |
| 35 to 64 Years | 19 (20.0%) | 13 (12.4%) |
| 65 to 74 Years | 3 (5.8%) | 1 (2.4%) |
| 75 Years and over | 40 (65.6%) | 37 (57.8%) |
Disability Class: Vision Difficulty
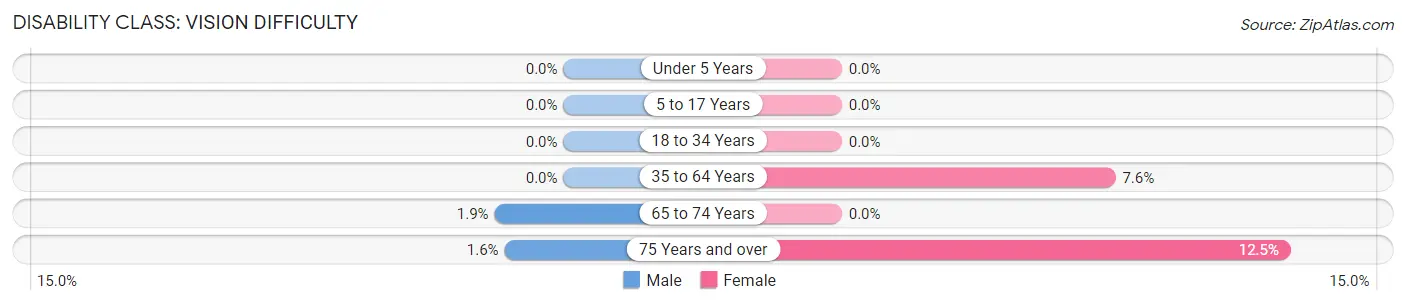
| Age Bracket | Male | Female |
| Under 5 Years | 0 (0.0%) | 0 (0.0%) |
| 5 to 17 Years | 0 (0.0%) | 0 (0.0%) |
| 18 to 34 Years | 0 (0.0%) | 0 (0.0%) |
| 35 to 64 Years | 0 (0.0%) | 8 (7.6%) |
| 65 to 74 Years | 1 (1.9%) | 0 (0.0%) |
| 75 Years and over | 1 (1.6%) | 8 (12.5%) |
Disability Class: Cognitive Difficulty
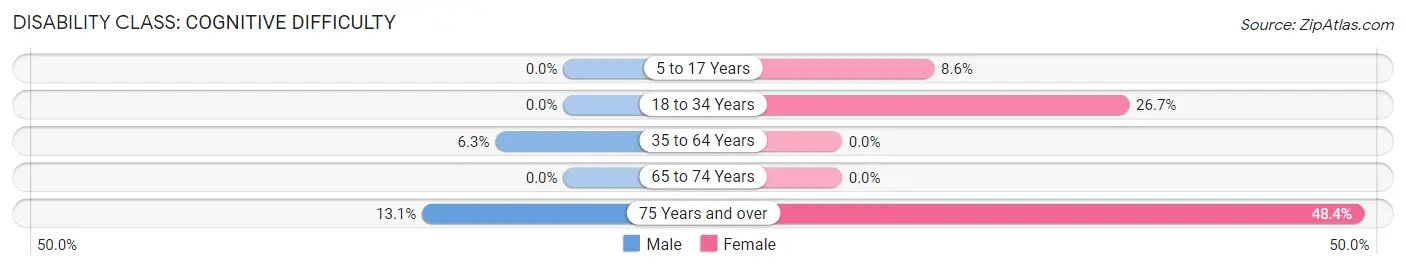
| Age Bracket | Male | Female |
| 5 to 17 Years | 0 (0.0%) | 3 (8.6%) |
| 18 to 34 Years | 0 (0.0%) | 4 (26.7%) |
| 35 to 64 Years | 6 (6.3%) | 0 (0.0%) |
| 65 to 74 Years | 0 (0.0%) | 0 (0.0%) |
| 75 Years and over | 8 (13.1%) | 31 (48.4%) |
Disability Class: Ambulatory Difficulty
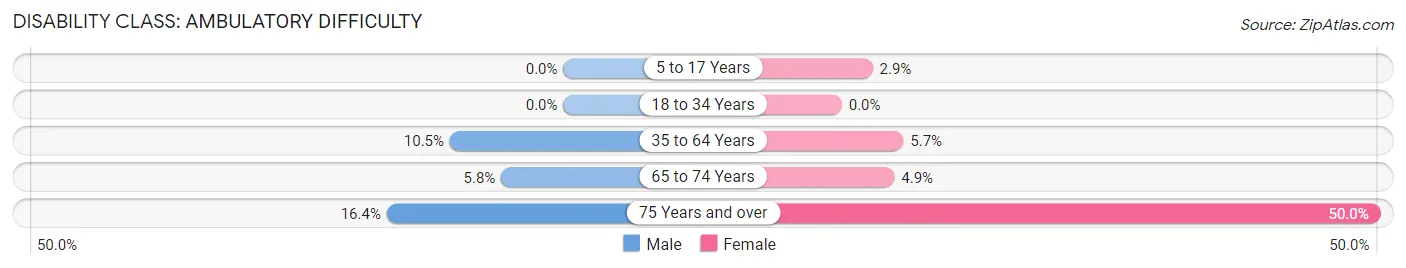
| Age Bracket | Male | Female |
| 5 to 17 Years | 0 (0.0%) | 1 (2.9%) |
| 18 to 34 Years | 0 (0.0%) | 0 (0.0%) |
| 35 to 64 Years | 10 (10.5%) | 6 (5.7%) |
| 65 to 74 Years | 3 (5.8%) | 2 (4.9%) |
| 75 Years and over | 10 (16.4%) | 32 (50.0%) |
Disability Class: Self-Care Difficulty
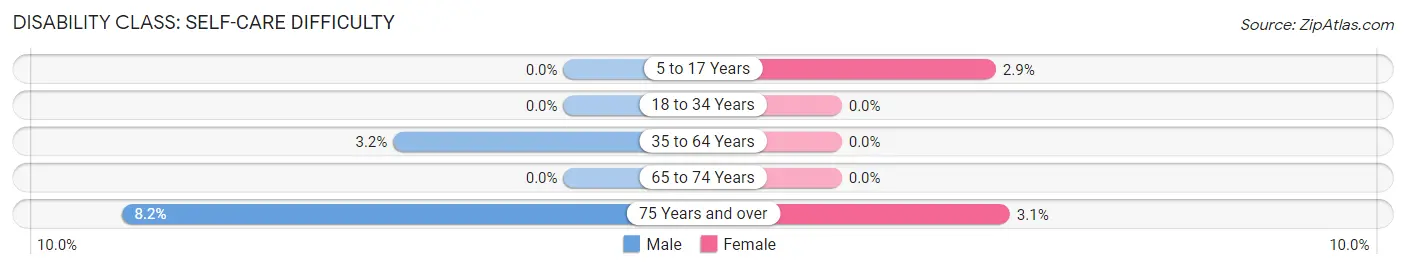
| Age Bracket | Male | Female |
| 5 to 17 Years | 0 (0.0%) | 1 (2.9%) |
| 18 to 34 Years | 0 (0.0%) | 0 (0.0%) |
| 35 to 64 Years | 3 (3.2%) | 0 (0.0%) |
| 65 to 74 Years | 0 (0.0%) | 0 (0.0%) |
| 75 Years and over | 5 (8.2%) | 2 (3.1%) |
Technology Access in Fish Springs
Computing Device Access in Fish Springs
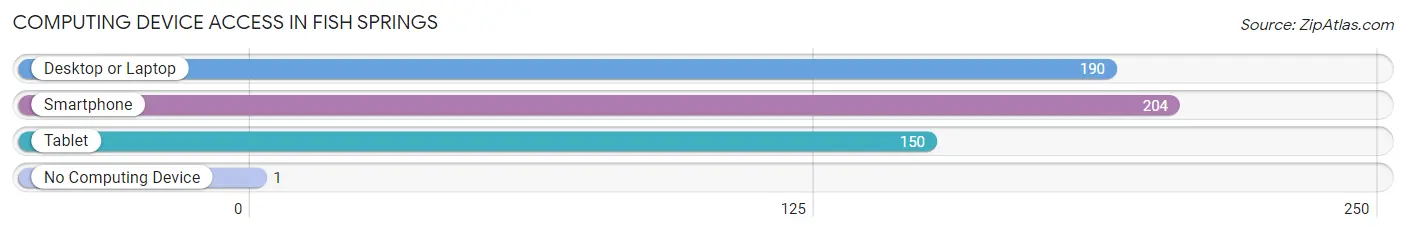
| Device Type | # Households | % Households |
| Desktop or Laptop | 190 | 84.4% |
| Smartphone | 204 | 90.7% |
| Tablet | 150 | 66.7% |
| No Computing Device | 1 | 0.4% |
| Total | 225 | 100.0% |
Internet Access in Fish Springs
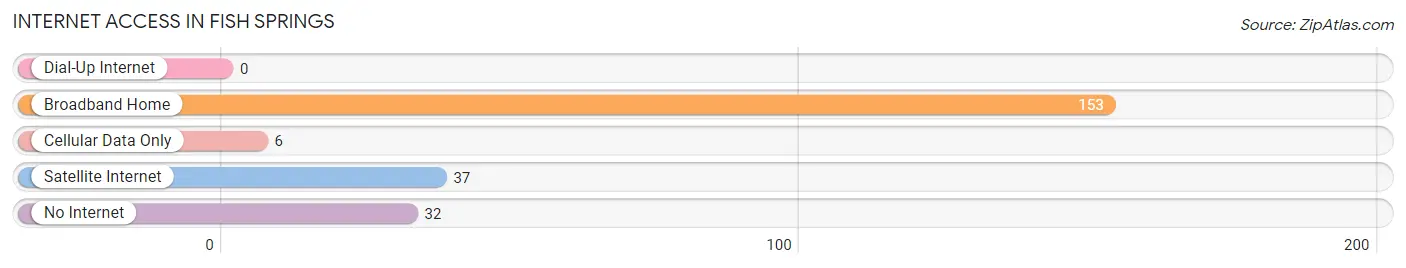
| Internet Type | # Households | % Households |
| Dial-Up Internet | 0 | 0.0% |
| Broadband Home | 153 | 68.0% |
| Cellular Data Only | 6 | 2.7% |
| Satellite Internet | 37 | 16.4% |
| No Internet | 32 | 14.2% |
| Total | 225 | 100.0% |
Fish Springs Summary
History
Fish Springs is an unincorporated community located in the Fish Springs Valley of White Pine County, Nevada. It is located approximately 20 miles south of the town of Ely and is home to a population of approximately 200 people. The area was first settled in the late 1800s by Mormon pioneers who were looking for a place to raise their families and practice their faith. The area was originally known as Fish Springs Ranch, and the name was changed to Fish Springs in the early 1900s.
The area was originally inhabited by the Northern Paiute people, who were nomadic hunter-gatherers. The first settlers in the area were Mormon pioneers, who arrived in the late 1800s. They established a small community and built a church, which still stands today. The area was also home to a number of ranches, which raised cattle and sheep.
The area was also home to a number of mines, including the Fish Springs Mine, which was established in the early 1900s. The mine was a major producer of copper, lead, and zinc, and it operated until the late 1940s.
Geography
Fish Springs is located in the Fish Springs Valley of White Pine County, Nevada. The area is located in the Great Basin Desert, and the terrain is mostly flat and dry. The area is surrounded by mountains, including the White Pine Range to the east and the Snake Range to the west. The area is also home to a number of small lakes, including Fish Springs Lake, which is located just north of the town.
The climate in Fish Springs is semi-arid, with hot summers and cold winters. The average annual temperature is around 50 degrees Fahrenheit, and the average annual precipitation is around 8 inches.
Economy
The economy of Fish Springs is largely based on ranching and farming. The area is home to a number of ranches, which raise cattle and sheep. The area is also home to a number of small farms, which grow hay, alfalfa, and other crops.
The area is also home to a number of small businesses, including a general store, a gas station, and a post office. The area is also home to a number of tourist attractions, including the Fish Springs National Wildlife Refuge, which is located just north of the town.
Demographics
As of the 2010 census, the population of Fish Springs was 200 people. The racial makeup of the town was 97.5% White, 0.5% Native American, 0.5% Asian, and 1.5% from other races. The median household income was $37,500, and the median family income was $41,250. The per capita income was $17,500.
Conclusion
Fish Springs is a small unincorporated community located in the Fish Springs Valley of White Pine County, Nevada. The area was first settled in the late 1800s by Mormon pioneers, and it is now home to a population of approximately 200 people. The economy of the area is largely based on ranching and farming, and the area is also home to a number of small businesses and tourist attractions. The population of Fish Springs is mostly White, with a small percentage of Native American and Asian residents. The median household income is $37,500, and the per capita income is $17,500.
Common Questions
What is Per Capita Income in Fish Springs?
Per Capita income in Fish Springs is $42,610.
What is the Median Family Income in Fish Springs?
Median Family Income in Fish Springs is $104,375.
What is the Median Household income in Fish Springs?
Median Household Income in Fish Springs is $95,795.
What is Income or Wage Gap in Fish Springs?
Income or Wage Gap in Fish Springs is 70.4%.
Women in Fish Springs earn 29.6 cents for every dollar earned by a man.
What is Inequality or Gini Index in Fish Springs?
Inequality or Gini Index in Fish Springs is 0.34.
What is the Total Population of Fish Springs?
Total Population of Fish Springs is 549.
What is the Total Male Population of Fish Springs?
Total Male Population of Fish Springs is 276.
What is the Total Female Population of Fish Springs?
Total Female Population of Fish Springs is 273.
What is the Ratio of Males per 100 Females in Fish Springs?
There are 101.10 Males per 100 Females in Fish Springs.
What is the Ratio of Females per 100 Males in Fish Springs?
There are 98.91 Females per 100 Males in Fish Springs.
What is the Median Population Age in Fish Springs?
Median Population Age in Fish Springs is 59.0 Years.
What is the Average Family Size in Fish Springs
Average Family Size in Fish Springs is 2.7 People.
What is the Average Household Size in Fish Springs
Average Household Size in Fish Springs is 2.4 People.
How Large is the Labor Force in Fish Springs?
There are 215 People in the Labor Forcein in Fish Springs.
What is the Percentage of People in the Labor Force in Fish Springs?
44.1% of People are in the Labor Force in Fish Springs.
What is the Unemployment Rate in Fish Springs?
Unemployment Rate in Fish Springs is 1.4%.