Silver Springs, NV Map & Demographics
Silver Springs Map
Silver Springs Overview
$27,693
PER CAPITA INCOME
$52,679
AVG FAMILY INCOME
$47,584
AVG HOUSEHOLD INCOME
20.2%
WAGE / INCOME GAP [ % ]
79.8¢/ $1
WAGE / INCOME GAP [ $ ]
0.45
INEQUALITY / GINI INDEX
5,117
TOTAL POPULATION
2,882
MALE POPULATION
2,235
FEMALE POPULATION
128.95
MALES / 100 FEMALES
77.55
FEMALES / 100 MALES
52.6
MEDIAN AGE
2.9
AVG FAMILY SIZE
2.2
AVG HOUSEHOLD SIZE
1,923
LABOR FORCE [ PEOPLE ]
43.0%
PERCENT IN LABOR FORCE
9.0%
UNEMPLOYMENT RATE
Silver Springs Zip Codes
Silver Springs Area Codes
Income in Silver Springs
Income Overview in Silver Springs
Per Capita Income in Silver Springs is $27,693, while median incomes of families and households are $52,679 and $47,584 respectively.
| Characteristic | Number | Measure |
| Per Capita Income | 5,117 | $27,693 |
| Median Family Income | 1,238 | $52,679 |
| Mean Family Income | 1,238 | $71,858 |
| Median Household Income | 2,324 | $47,584 |
| Mean Household Income | 2,324 | $61,051 |
| Income Deficit | 1,238 | $0 |
| Wage / Income Gap (%) | 5,117 | 20.18% |
| Wage / Income Gap ($) | 5,117 | 79.82¢ per $1 |
| Gini / Inequality Index | 5,117 | 0.45 |
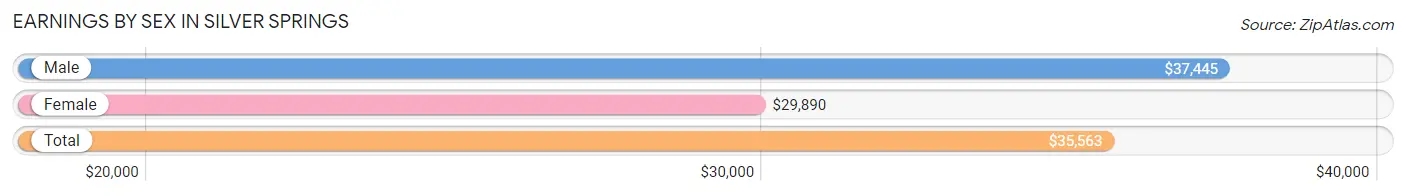
Earnings by Sex in Silver Springs
Average Earnings in Silver Springs are $35,563, $37,445 for men and $29,890 for women, a difference of 20.2%.
| Sex | Number | Average Earnings |
| Male | 1,209 (59.5%) | $37,445 |
| Female | 823 (40.5%) | $29,890 |
| Total | 2,032 (100.0%) | $35,563 |
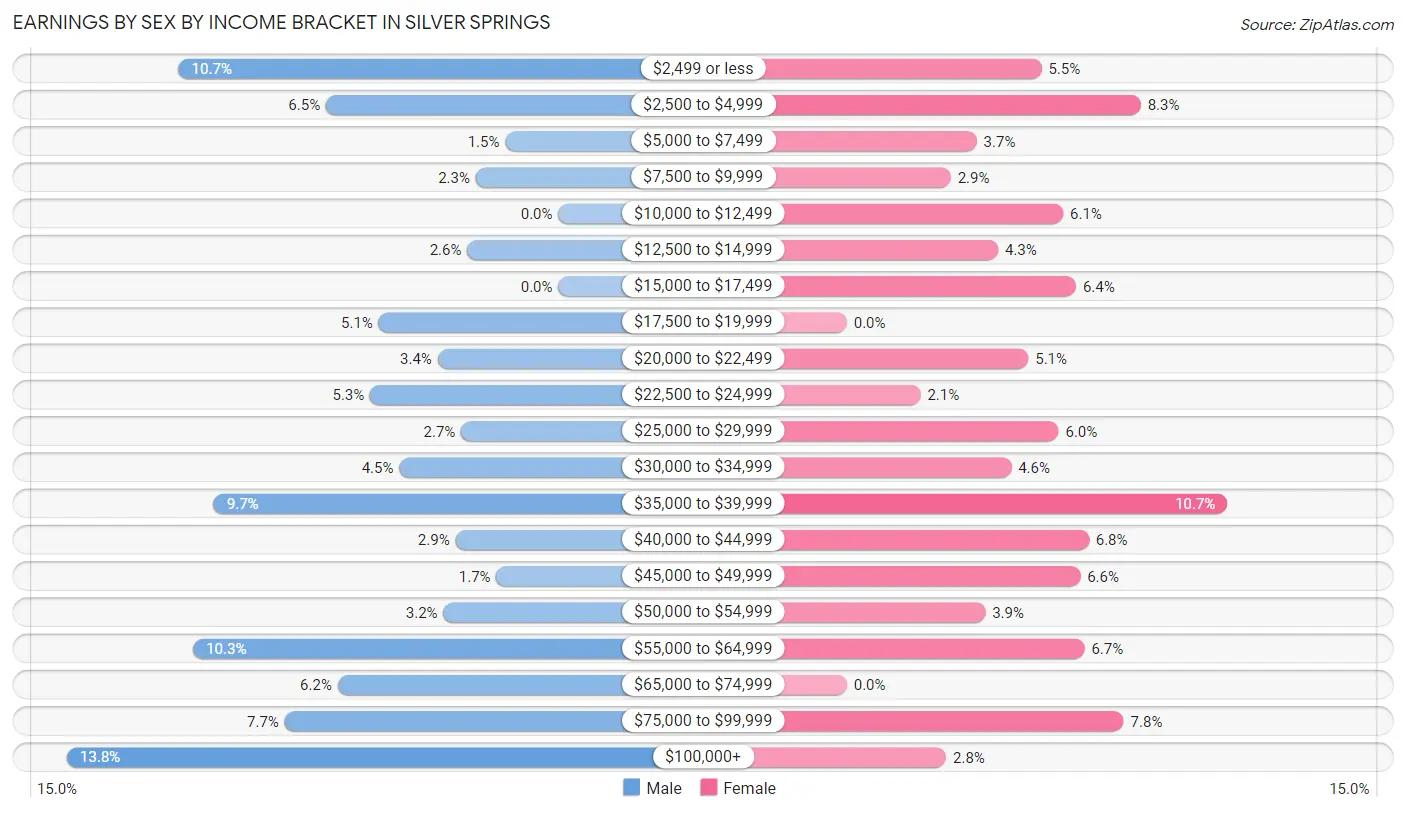
Earnings by Sex by Income Bracket in Silver Springs
The most common earnings brackets in Silver Springs are $100,000+ for men (167 | 13.8%) and $35,000 to $39,999 for women (88 | 10.7%).
| Income | Male | Female |
| $2,499 or less | 129 (10.7%) | 45 (5.5%) |
| $2,500 to $4,999 | 79 (6.5%) | 68 (8.3%) |
| $5,000 to $7,499 | 18 (1.5%) | 30 (3.6%) |
| $7,500 to $9,999 | 28 (2.3%) | 24 (2.9%) |
| $10,000 to $12,499 | 0 (0.0%) | 50 (6.1%) |
| $12,500 to $14,999 | 31 (2.6%) | 35 (4.3%) |
| $15,000 to $17,499 | 0 (0.0%) | 53 (6.4%) |
| $17,500 to $19,999 | 61 (5.1%) | 0 (0.0%) |
| $20,000 to $22,499 | 41 (3.4%) | 42 (5.1%) |
| $22,500 to $24,999 | 64 (5.3%) | 17 (2.1%) |
| $25,000 to $29,999 | 33 (2.7%) | 49 (5.9%) |
| $30,000 to $34,999 | 54 (4.5%) | 38 (4.6%) |
| $35,000 to $39,999 | 117 (9.7%) | 88 (10.7%) |
| $40,000 to $44,999 | 35 (2.9%) | 56 (6.8%) |
| $45,000 to $49,999 | 21 (1.7%) | 54 (6.6%) |
| $50,000 to $54,999 | 39 (3.2%) | 32 (3.9%) |
| $55,000 to $64,999 | 124 (10.3%) | 55 (6.7%) |
| $65,000 to $74,999 | 75 (6.2%) | 0 (0.0%) |
| $75,000 to $99,999 | 93 (7.7%) | 64 (7.8%) |
| $100,000+ | 167 (13.8%) | 23 (2.8%) |
| Total | 1,209 (100.0%) | 823 (100.0%) |
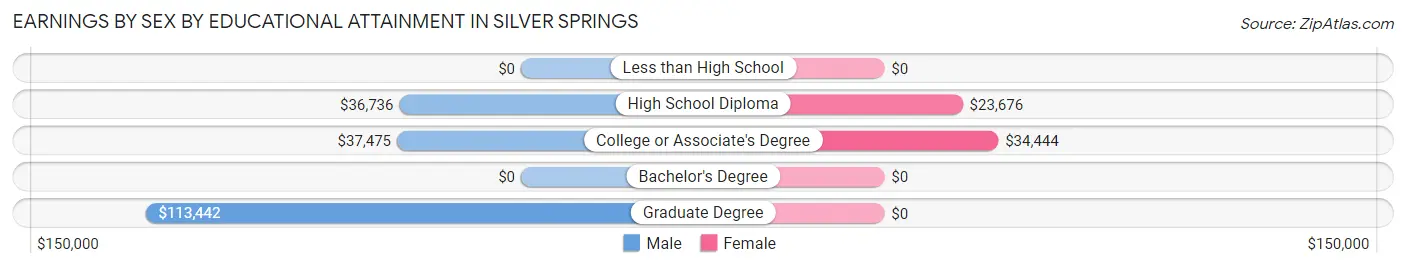
Earnings by Sex by Educational Attainment in Silver Springs
Average earnings in Silver Springs are $37,426 for men and $33,792 for women, a difference of 9.7%. Men with an educational attainment of graduate degree enjoy the highest average annual earnings of $113,442, while those with high school diploma education earn the least with $36,736. Women with an educational attainment of college or associate's degree earn the most with the average annual earnings of $34,444, while those with high school diploma education have the smallest earnings of $23,676.
| Educational Attainment | Male Income | Female Income |
| Less than High School | - | - |
| High School Diploma | $36,736 | $23,676 |
| College or Associate's Degree | $37,475 | $34,444 |
| Bachelor's Degree | - | - |
| Graduate Degree | $113,442 | $0 |
| Total | $37,426 | $33,792 |
Family Income in Silver Springs
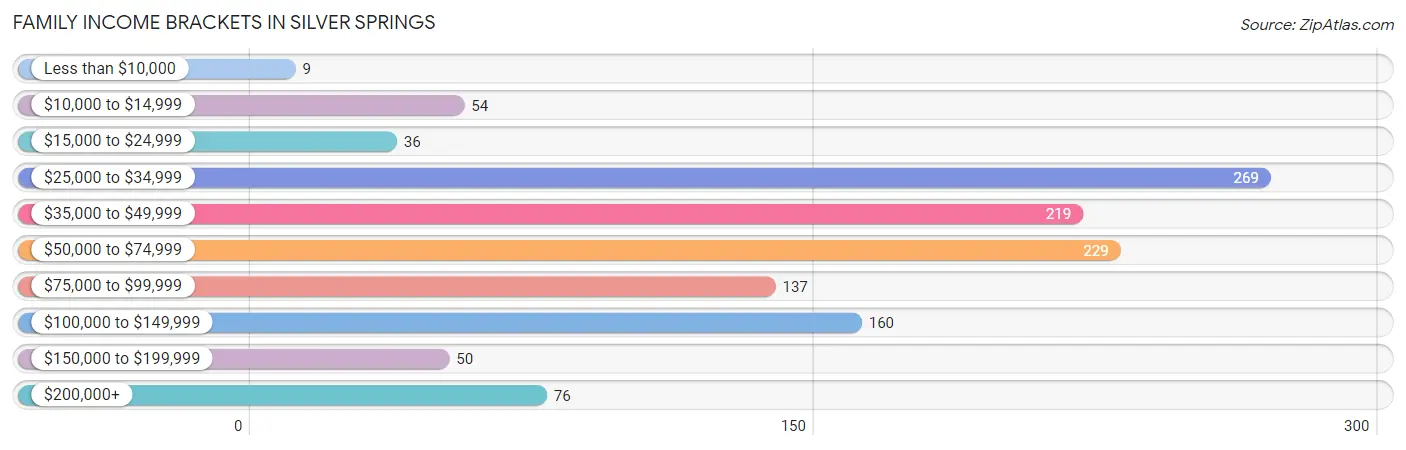
Family Income Brackets in Silver Springs
According to the Silver Springs family income data, there are 269 families falling into the $25,000 to $34,999 income range, which is the most common income bracket and makes up 21.7% of all families. Conversely, the less than $10,000 income bracket is the least frequent group with only 9 families (0.7%) belonging to this category.
| Income Bracket | # Families | % Families |
| Less than $10,000 | 9 | 0.7% |
| $10,000 to $14,999 | 54 | 4.4% |
| $15,000 to $24,999 | 36 | 2.9% |
| $25,000 to $34,999 | 269 | 21.7% |
| $35,000 to $49,999 | 219 | 17.7% |
| $50,000 to $74,999 | 229 | 18.5% |
| $75,000 to $99,999 | 137 | 11.1% |
| $100,000 to $149,999 | 160 | 12.9% |
| $150,000 to $199,999 | 50 | 4.0% |
| $200,000+ | 76 | 6.1% |
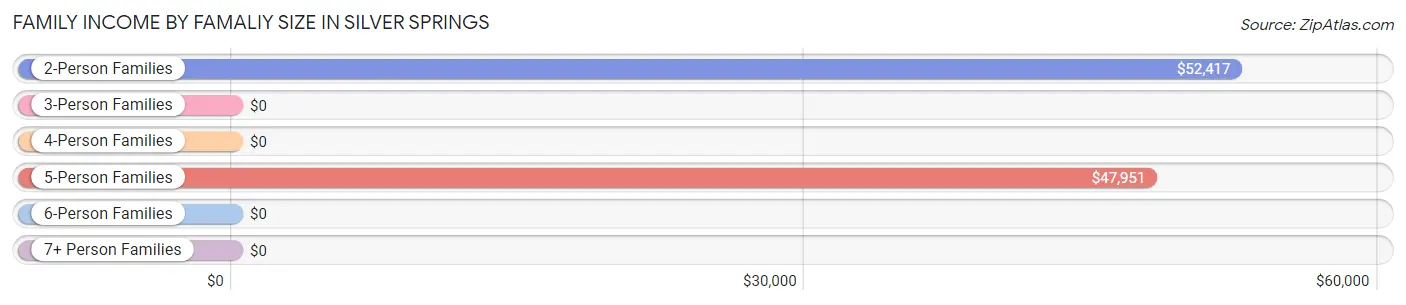
Family Income by Famaliy Size in Silver Springs
2-person families (666 | 53.8%) account for the highest median family income in Silver Springs with $52,417 per family, while 2-person families (666 | 53.8%) have the highest median income of $26,208 per family member.
| Income Bracket | # Families | Median Income |
| 2-Person Families | 666 (53.8%) | $52,417 |
| 3-Person Families | 263 (21.2%) | $0 |
| 4-Person Families | 176 (14.2%) | $0 |
| 5-Person Families | 100 (8.1%) | $47,951 |
| 6-Person Families | 12 (1.0%) | $0 |
| 7+ Person Families | 21 (1.7%) | $0 |
| Total | 1,238 (100.0%) | $52,679 |
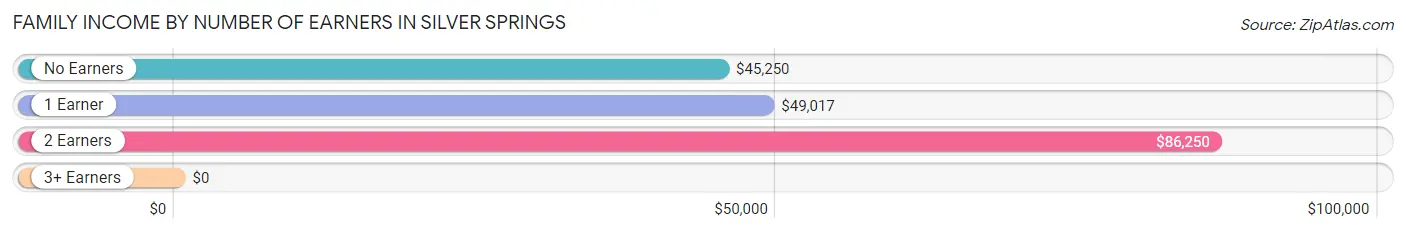
Family Income by Number of Earners in Silver Springs
| Number of Earners | # Families | Median Income |
| No Earners | 427 (34.5%) | $45,250 |
| 1 Earner | 416 (33.6%) | $49,017 |
| 2 Earners | 309 (25.0%) | $86,250 |
| 3+ Earners | 86 (7.0%) | $0 |
| Total | 1,238 (100.0%) | $52,679 |
Household Income in Silver Springs
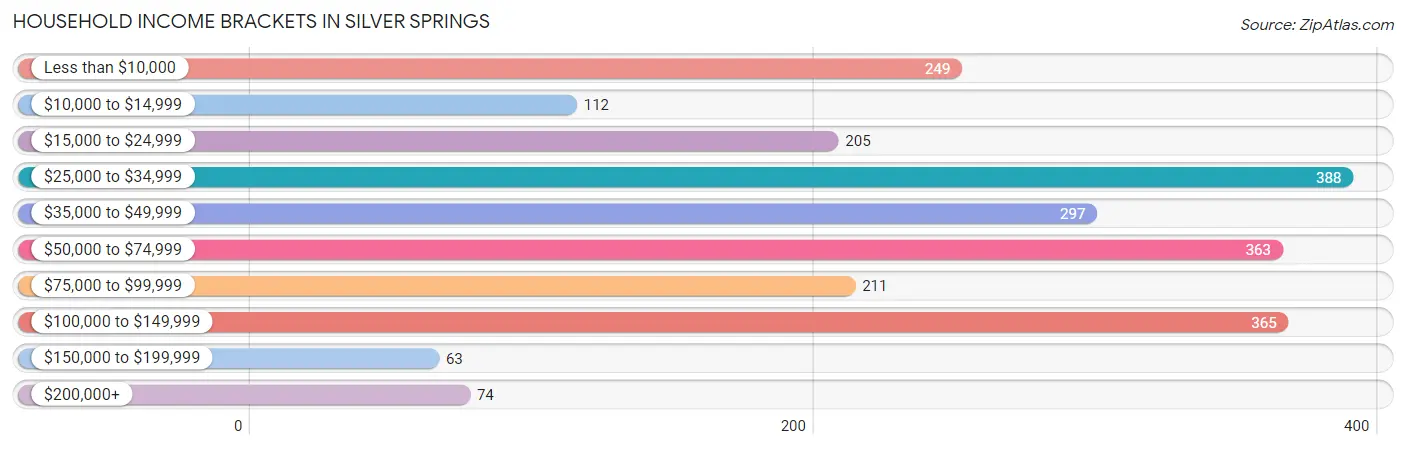
Household Income Brackets in Silver Springs
With 388 households falling in the category, the $25,000 to $34,999 income range is the most frequent in Silver Springs, accounting for 16.7% of all households. In contrast, only 63 households (2.7%) fall into the $150,000 to $199,999 income bracket, making it the least populous group.
| Income Bracket | # Households | % Households |
| Less than $10,000 | 249 | 10.7% |
| $10,000 to $14,999 | 112 | 4.8% |
| $15,000 to $24,999 | 205 | 8.8% |
| $25,000 to $34,999 | 388 | 16.7% |
| $35,000 to $49,999 | 297 | 12.8% |
| $50,000 to $74,999 | 363 | 15.6% |
| $75,000 to $99,999 | 211 | 9.1% |
| $100,000 to $149,999 | 365 | 15.7% |
| $150,000 to $199,999 | 63 | 2.7% |
| $200,000+ | 74 | 3.2% |
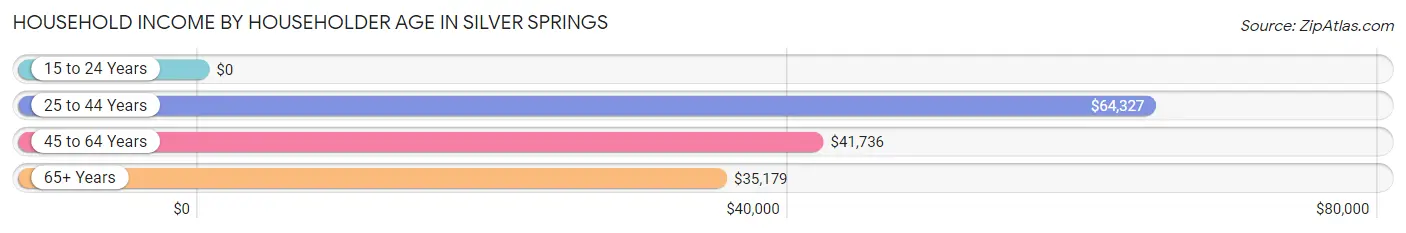
Household Income by Householder Age in Silver Springs
The median household income in Silver Springs is $47,584, with the highest median household income of $64,327 found in the 25 to 44 years age bracket for the primary householder. A total of 655 households (28.2%) fall into this category.
| Income Bracket | # Households | Median Income |
| 15 to 24 Years | 0 (0.0%) | $0 |
| 25 to 44 Years | 655 (28.2%) | $64,327 |
| 45 to 64 Years | 893 (38.4%) | $41,736 |
| 65+ Years | 776 (33.4%) | $35,179 |
| Total | 2,324 (100.0%) | $47,584 |
Poverty in Silver Springs
Income Below Poverty by Sex and Age in Silver Springs
With 13.0% poverty level for males and 18.6% for females among the residents of Silver Springs, 55 to 64 year old males and 15 year old females are the most vulnerable to poverty, with 160 males (28.4%) and 12 females (100.0%) in their respective age groups living below the poverty level.
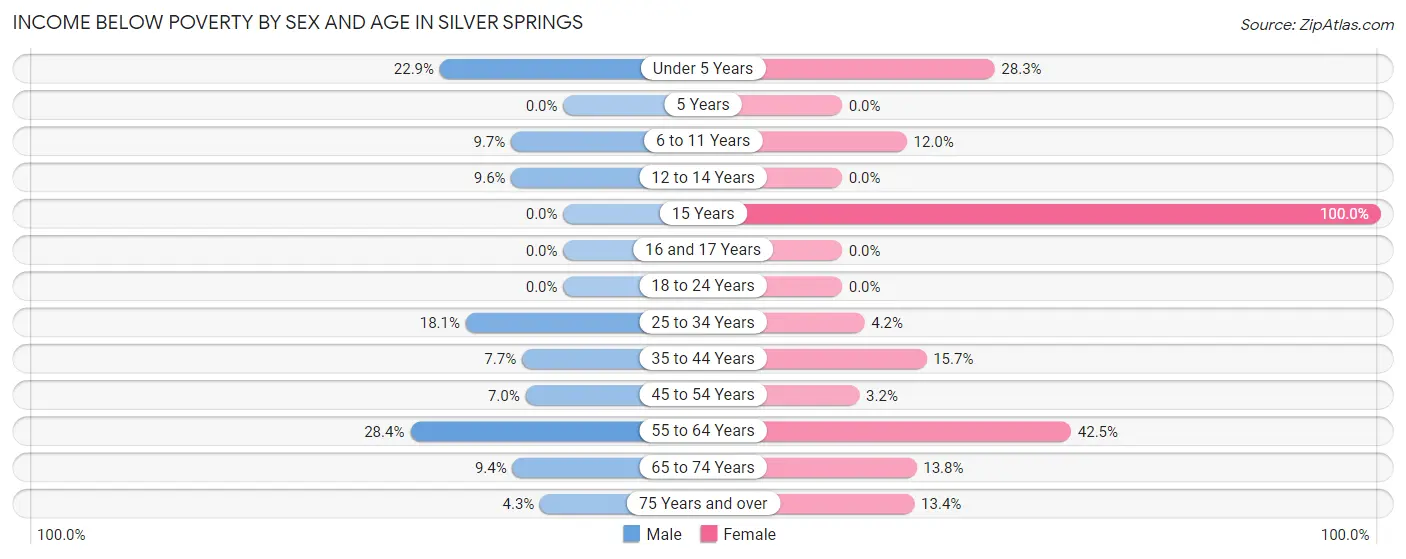
| Age Bracket | Male | Female |
| Under 5 Years | 11 (22.9%) | 17 (28.3%) |
| 5 Years | 0 (0.0%) | 0 (0.0%) |
| 6 to 11 Years | 16 (9.7%) | 16 (12.0%) |
| 12 to 14 Years | 8 (9.6%) | 0 (0.0%) |
| 15 Years | 0 (0.0%) | 12 (100.0%) |
| 16 and 17 Years | 0 (0.0%) | 0 (0.0%) |
| 18 to 24 Years | 0 (0.0%) | 0 (0.0%) |
| 25 to 34 Years | 65 (18.1%) | 7 (4.2%) |
| 35 to 44 Years | 38 (7.7%) | 34 (15.7%) |
| 45 to 54 Years | 20 (7.0%) | 10 (3.2%) |
| 55 to 64 Years | 160 (28.4%) | 233 (42.5%) |
| 65 to 74 Years | 45 (9.4%) | 47 (13.8%) |
| 75 Years and over | 8 (4.3%) | 36 (13.4%) |
| Total | 371 (13.0%) | 412 (18.6%) |
Income Above Poverty by Sex and Age in Silver Springs
According to the poverty statistics in Silver Springs, males aged 15 years and females aged 12 to 14 years are the age groups that are most secure financially, with 100.0% of males and 100.0% of females in these age groups living above the poverty line.
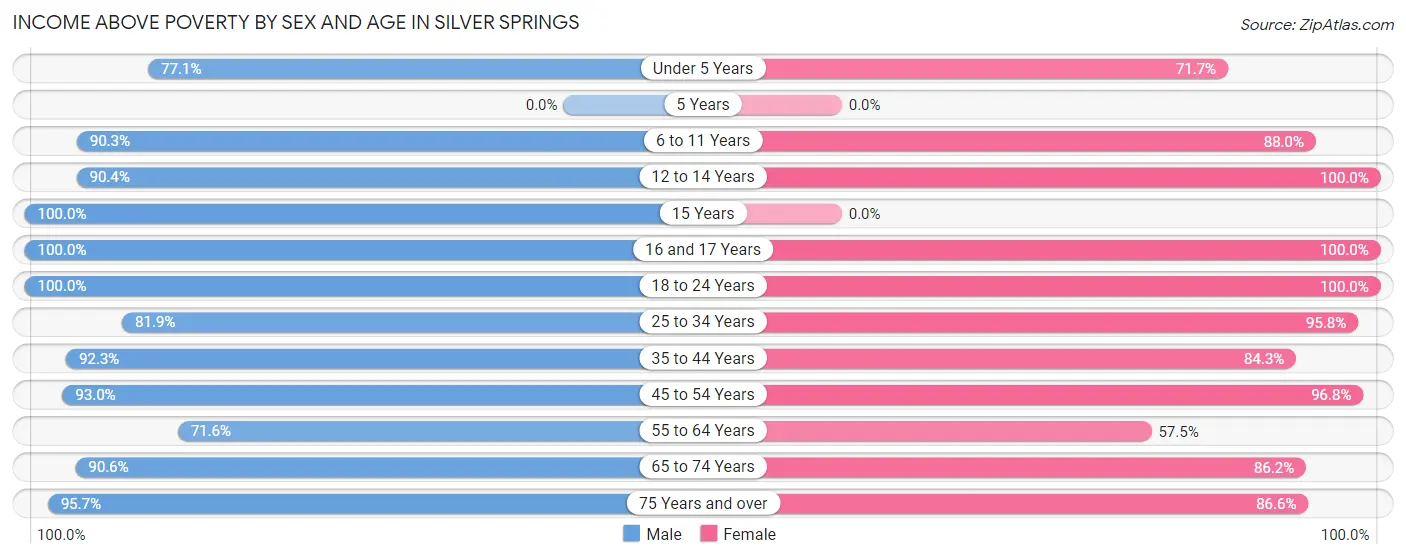
| Age Bracket | Male | Female |
| Under 5 Years | 37 (77.1%) | 43 (71.7%) |
| 5 Years | 0 (0.0%) | 0 (0.0%) |
| 6 to 11 Years | 149 (90.3%) | 117 (88.0%) |
| 12 to 14 Years | 75 (90.4%) | 66 (100.0%) |
| 15 Years | 37 (100.0%) | 0 (0.0%) |
| 16 and 17 Years | 29 (100.0%) | 11 (100.0%) |
| 18 to 24 Years | 122 (100.0%) | 83 (100.0%) |
| 25 to 34 Years | 294 (81.9%) | 161 (95.8%) |
| 35 to 44 Years | 457 (92.3%) | 183 (84.3%) |
| 45 to 54 Years | 265 (93.0%) | 301 (96.8%) |
| 55 to 64 Years | 403 (71.6%) | 315 (57.5%) |
| 65 to 74 Years | 432 (90.6%) | 293 (86.2%) |
| 75 Years and over | 178 (95.7%) | 232 (86.6%) |
| Total | 2,478 (87.0%) | 1,805 (81.4%) |
Income Below Poverty Among Married-Couple Families in Silver Springs
The poverty statistics for married-couple families in Silver Springs show that 2.9% or 25 of the total 849 families live below the poverty line. Families with 3 or 4 children have the highest poverty rate of 41.7%, comprising of 10 families. On the other hand, families with 1 or 2 children have the lowest poverty rate of 0.0%, which includes 0 families.
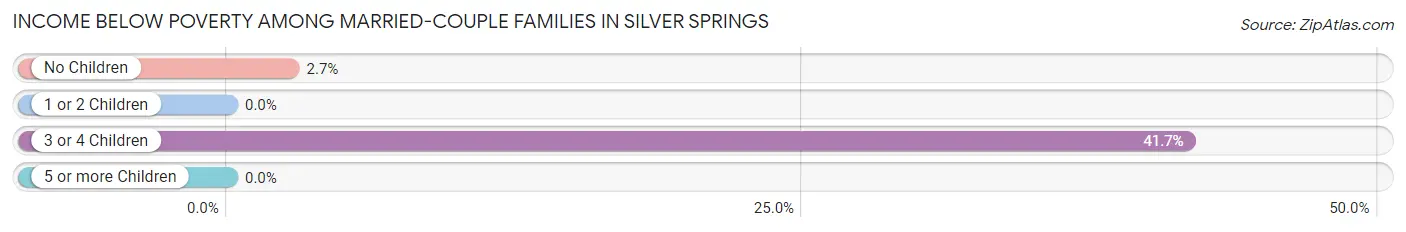
| Children | Above Poverty | Below Poverty |
| No Children | 544 (97.3%) | 15 (2.7%) |
| 1 or 2 Children | 259 (100.0%) | 0 (0.0%) |
| 3 or 4 Children | 14 (58.3%) | 10 (41.7%) |
| 5 or more Children | 7 (100.0%) | 0 (0.0%) |
| Total | 824 (97.1%) | 25 (2.9%) |
Income Below Poverty Among Single-Parent Households in Silver Springs
According to the poverty data in Silver Springs, 16.8% or 47 single-father households and 14.7% or 16 single-mother households are living below the poverty line. Among single-father households, those with 1 or 2 children have the highest poverty rate, with 7 households (100.0%) experiencing poverty. Likewise, among single-mother households, those with 3 or 4 children have the highest poverty rate, with 9 households (100.0%) falling below the poverty line.
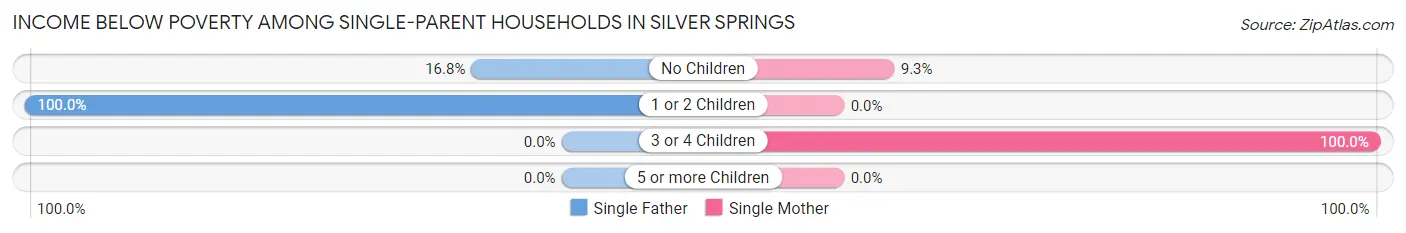
| Children | Single Father | Single Mother |
| No Children | 40 (16.8%) | 7 (9.3%) |
| 1 or 2 Children | 7 (100.0%) | 0 (0.0%) |
| 3 or 4 Children | 0 (0.0%) | 9 (100.0%) |
| 5 or more Children | 0 (0.0%) | 0 (0.0%) |
| Total | 47 (16.8%) | 16 (14.7%) |
Income Below Poverty Among Married-Couple vs Single-Parent Households in Silver Springs
The poverty data for Silver Springs shows that 25 of the married-couple family households (2.9%) and 63 of the single-parent households (16.2%) are living below the poverty level. Within the married-couple family households, those with 3 or 4 children have the highest poverty rate, with 10 households (41.7%) falling below the poverty line. Among the single-parent households, those with 1 or 2 children have the highest poverty rate, with 7 household (21.9%) living below poverty.
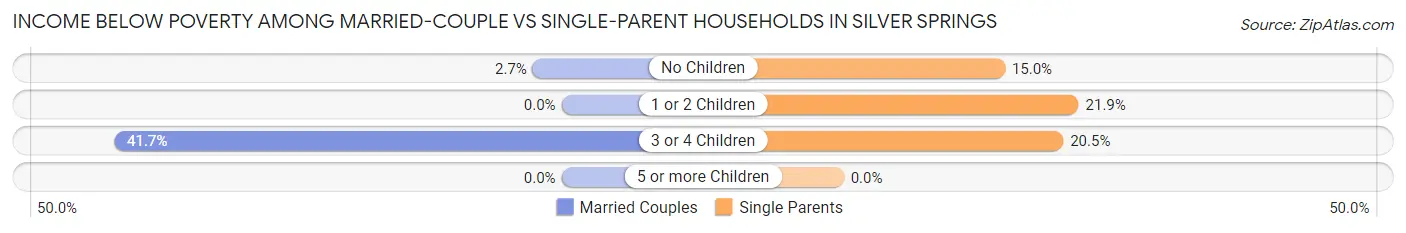
| Children | Married-Couple Families | Single-Parent Households |
| No Children | 15 (2.7%) | 47 (15.0%) |
| 1 or 2 Children | 0 (0.0%) | 7 (21.9%) |
| 3 or 4 Children | 10 (41.7%) | 9 (20.4%) |
| 5 or more Children | 0 (0.0%) | 0 (0.0%) |
| Total | 25 (2.9%) | 63 (16.2%) |
Race in Silver Springs
The most populous races in Silver Springs are White / Caucasian (4,327 | 84.6%), Two or more Races (390 | 7.6%), and Hispanic or Latino (349 | 6.8%).
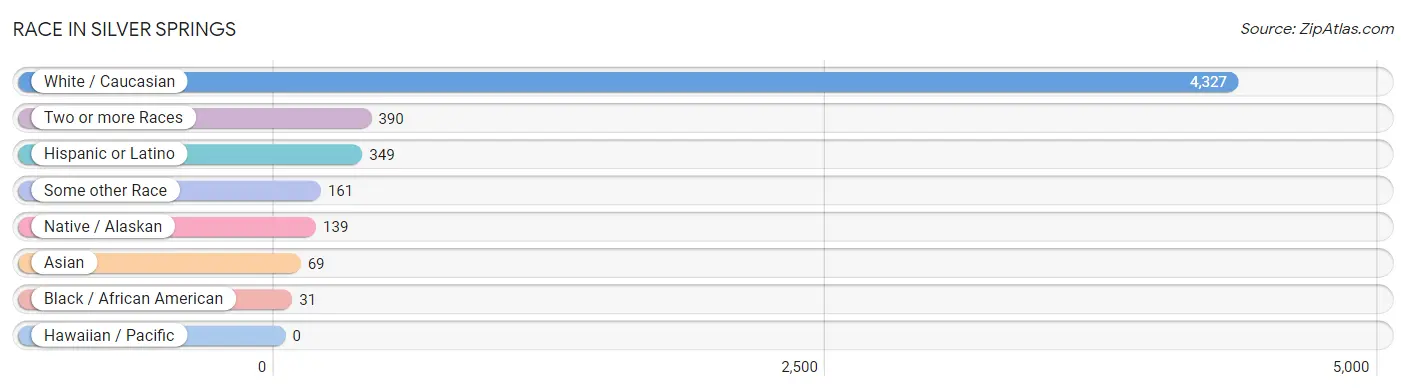
| Race | # Population | % Population |
| Asian | 69 | 1.3% |
| Black / African American | 31 | 0.6% |
| Hawaiian / Pacific | 0 | 0.0% |
| Hispanic or Latino | 349 | 6.8% |
| Native / Alaskan | 139 | 2.7% |
| White / Caucasian | 4,327 | 84.6% |
| Two or more Races | 390 | 7.6% |
| Some other Race | 161 | 3.2% |
| Total | 5,117 | 100.0% |
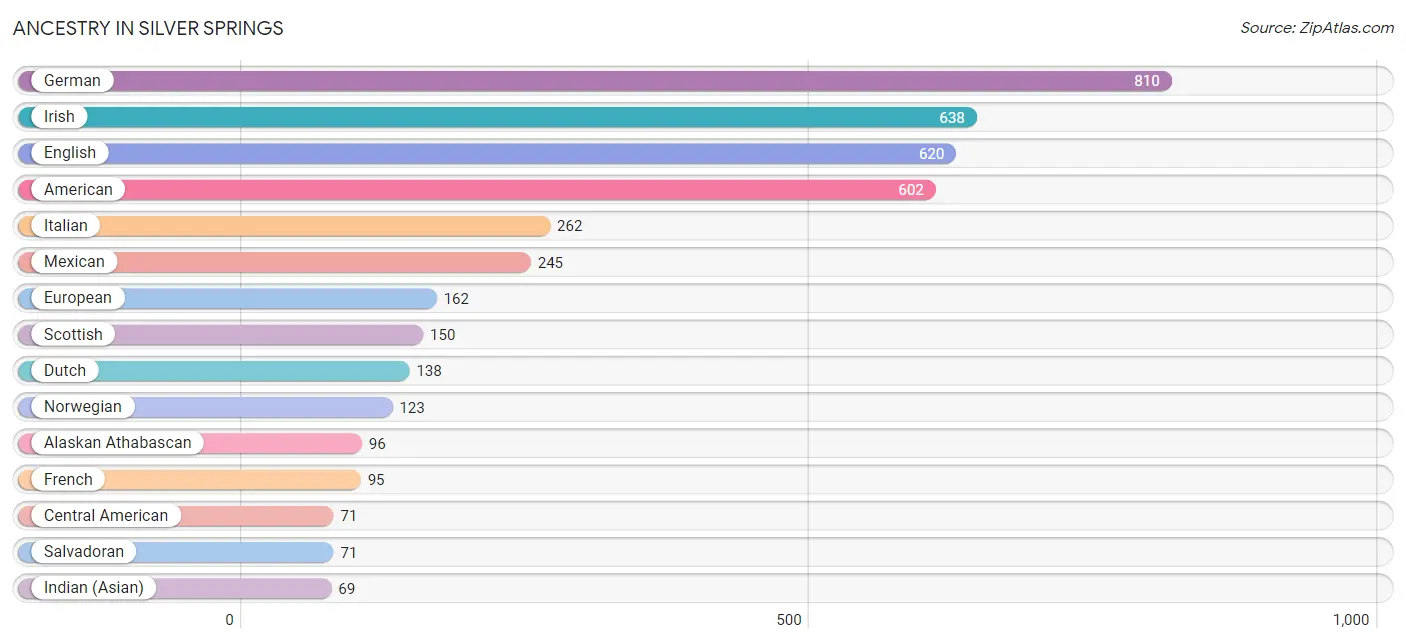
Ancestry in Silver Springs
The most populous ancestries reported in Silver Springs are German (810 | 15.8%), Irish (638 | 12.5%), English (620 | 12.1%), American (602 | 11.8%), and Italian (262 | 5.1%), together accounting for 57.3% of all Silver Springs residents.
| Ancestry | # Population | % Population |
| Alaskan Athabascan | 96 | 1.9% |
| American | 602 | 11.8% |
| Arab | 7 | 0.1% |
| Belgian | 15 | 0.3% |
| Belizean | 7 | 0.1% |
| British | 28 | 0.5% |
| Canadian | 25 | 0.5% |
| Central American | 71 | 1.4% |
| Cherokee | 11 | 0.2% |
| Czech | 30 | 0.6% |
| Danish | 61 | 1.2% |
| Dutch | 138 | 2.7% |
| English | 620 | 12.1% |
| European | 162 | 3.2% |
| Finnish | 43 | 0.8% |
| French | 95 | 1.9% |
| French Canadian | 18 | 0.4% |
| German | 810 | 15.8% |
| Guamanian / Chamorro | 1 | 0.0% |
| Hungarian | 30 | 0.6% |
| Indian (Asian) | 69 | 1.3% |
| Irish | 638 | 12.5% |
| Italian | 262 | 5.1% |
| Korean | 15 | 0.3% |
| Mexican | 245 | 4.8% |
| Native Hawaiian | 9 | 0.2% |
| Navajo | 12 | 0.2% |
| Norwegian | 123 | 2.4% |
| Paiute | 13 | 0.3% |
| Polish | 59 | 1.1% |
| Portuguese | 10 | 0.2% |
| Russian | 45 | 0.9% |
| Salvadoran | 71 | 1.4% |
| Scandinavian | 13 | 0.3% |
| Scottish | 150 | 2.9% |
| Slovene | 7 | 0.1% |
| Spaniard | 12 | 0.2% |
| Spanish | 4 | 0.1% |
| Swedish | 57 | 1.1% | View All 39 Rows |
Immigrants in Silver Springs
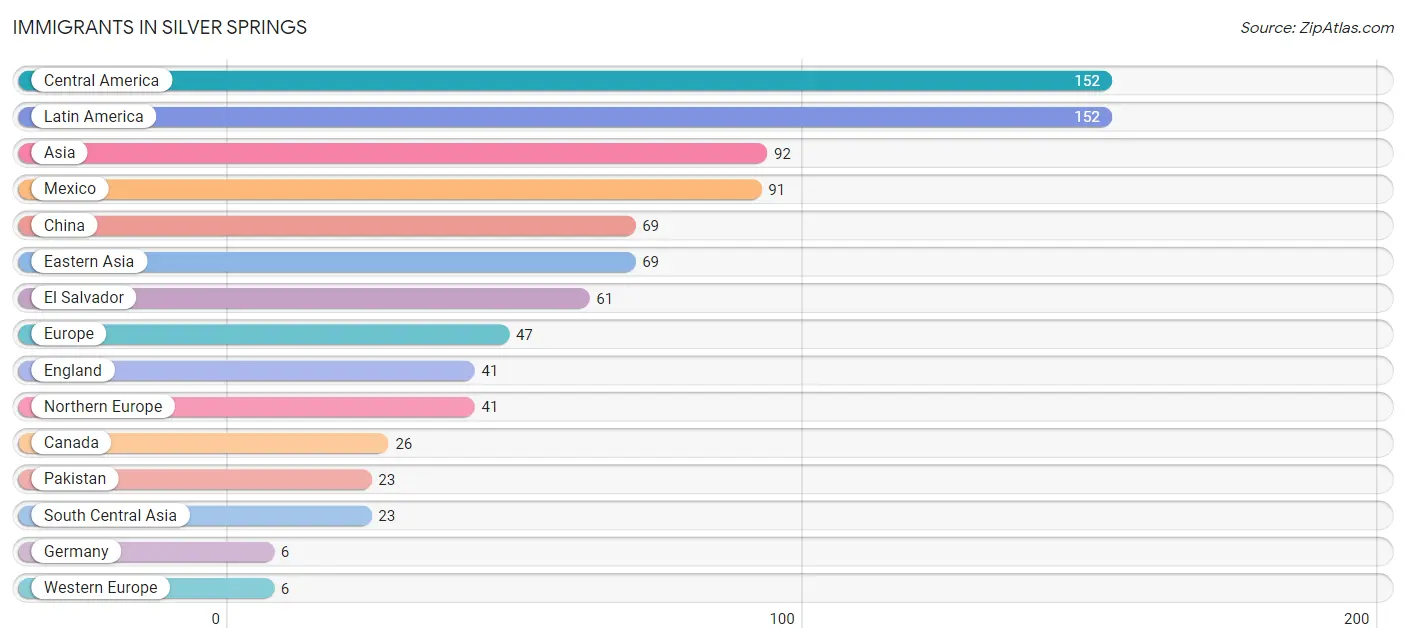
The most numerous immigrant groups reported in Silver Springs came from Central America (152 | 3.0%), Latin America (152 | 3.0%), Asia (92 | 1.8%), Mexico (91 | 1.8%), and China (69 | 1.3%), together accounting for 10.9% of all Silver Springs residents.
| Immigration Origin | # Population | % Population |
| Asia | 92 | 1.8% |
| Canada | 26 | 0.5% |
| Central America | 152 | 3.0% |
| China | 69 | 1.3% |
| Eastern Asia | 69 | 1.3% |
| El Salvador | 61 | 1.2% |
| England | 41 | 0.8% |
| Europe | 47 | 0.9% |
| Germany | 6 | 0.1% |
| Latin America | 152 | 3.0% |
| Mexico | 91 | 1.8% |
| Northern Europe | 41 | 0.8% |
| Pakistan | 23 | 0.4% |
| South Central Asia | 23 | 0.4% |
| Western Europe | 6 | 0.1% | View All 15 Rows |
Sex and Age in Silver Springs
Sex and Age in Silver Springs
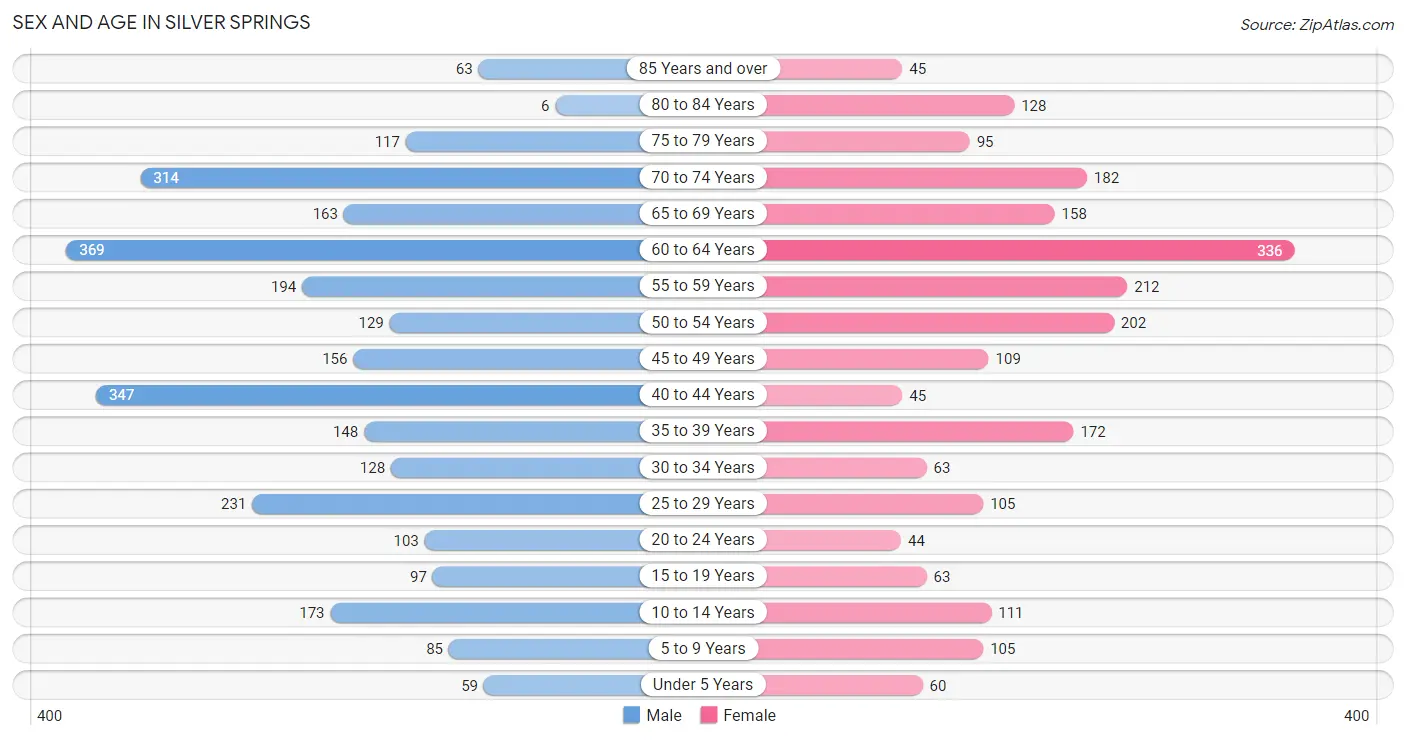
The most populous age groups in Silver Springs are 60 to 64 Years (369 | 12.8%) for men and 60 to 64 Years (336 | 15.0%) for women.
| Age Bracket | Male | Female |
| Under 5 Years | 59 (2.1%) | 60 (2.7%) |
| 5 to 9 Years | 85 (2.9%) | 105 (4.7%) |
| 10 to 14 Years | 173 (6.0%) | 111 (5.0%) |
| 15 to 19 Years | 97 (3.4%) | 63 (2.8%) |
| 20 to 24 Years | 103 (3.6%) | 44 (2.0%) |
| 25 to 29 Years | 231 (8.0%) | 105 (4.7%) |
| 30 to 34 Years | 128 (4.4%) | 63 (2.8%) |
| 35 to 39 Years | 148 (5.1%) | 172 (7.7%) |
| 40 to 44 Years | 347 (12.0%) | 45 (2.0%) |
| 45 to 49 Years | 156 (5.4%) | 109 (4.9%) |
| 50 to 54 Years | 129 (4.5%) | 202 (9.0%) |
| 55 to 59 Years | 194 (6.7%) | 212 (9.5%) |
| 60 to 64 Years | 369 (12.8%) | 336 (15.0%) |
| 65 to 69 Years | 163 (5.7%) | 158 (7.1%) |
| 70 to 74 Years | 314 (10.9%) | 182 (8.1%) |
| 75 to 79 Years | 117 (4.1%) | 95 (4.3%) |
| 80 to 84 Years | 6 (0.2%) | 128 (5.7%) |
| 85 Years and over | 63 (2.2%) | 45 (2.0%) |
| Total | 2,882 (100.0%) | 2,235 (100.0%) |
Families and Households in Silver Springs
Median Family Size in Silver Springs
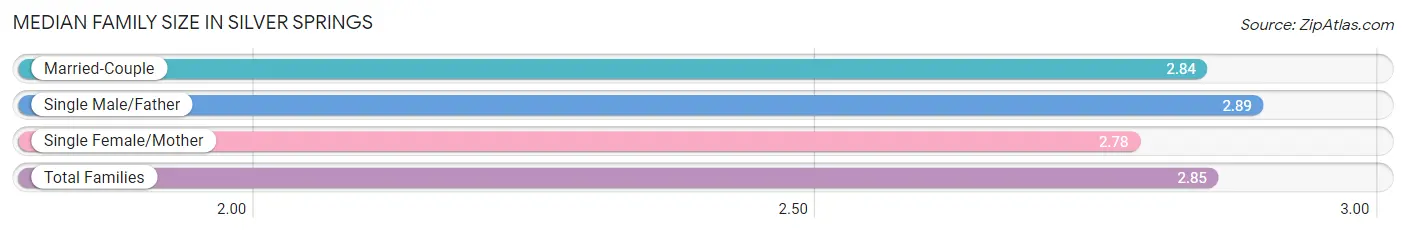
The median family size in Silver Springs is 2.85 persons per family, with single male/father families (280 | 22.6%) accounting for the largest median family size of 2.89 persons per family. On the other hand, single female/mother families (109 | 8.8%) represent the smallest median family size with 2.78 persons per family.
| Family Type | # Families | Family Size |
| Married-Couple | 849 (68.6%) | 2.84 |
| Single Male/Father | 280 (22.6%) | 2.89 |
| Single Female/Mother | 109 (8.8%) | 2.78 |
| Total Families | 1,238 (100.0%) | 2.85 |
Median Household Size in Silver Springs
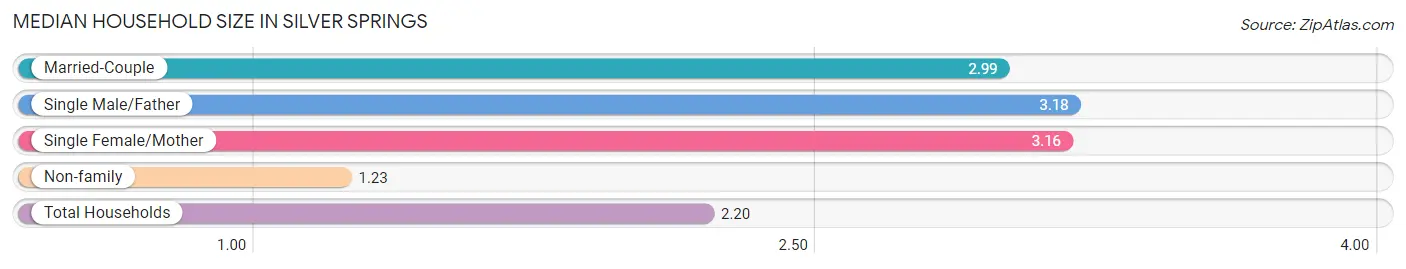
The median household size in Silver Springs is 2.20 persons per household, with single male/father households (280 | 12.0%) accounting for the largest median household size of 3.18 persons per household. non-family households (1,086 | 46.7%) represent the smallest median household size with 1.23 persons per household.
| Household Type | # Households | Household Size |
| Married-Couple | 849 (36.5%) | 2.99 |
| Single Male/Father | 280 (12.0%) | 3.18 |
| Single Female/Mother | 109 (4.7%) | 3.16 |
| Non-family | 1,086 (46.7%) | 1.23 |
| Total Households | 2,324 (100.0%) | 2.20 |
Household Size by Marriage Status in Silver Springs
Out of a total of 2,324 households in Silver Springs, 1,238 (53.3%) are family households, while 1,086 (46.7%) are nonfamily households. The most numerous type of family households are 2-person households, comprising 609, and the most common type of nonfamily households are 1-person households, comprising 868.
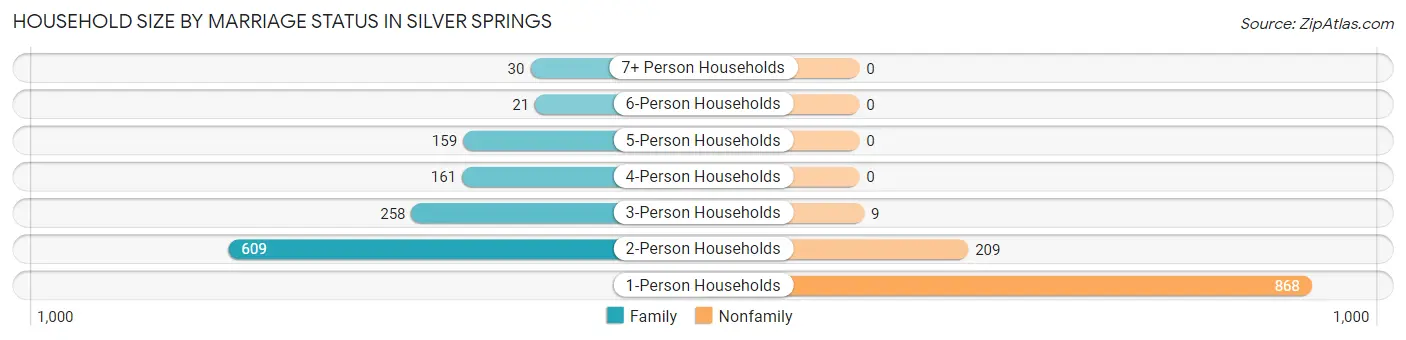
| Household Size | Family Households | Nonfamily Households |
| 1-Person Households | - | 868 (37.3%) |
| 2-Person Households | 609 (26.2%) | 209 (9.0%) |
| 3-Person Households | 258 (11.1%) | 9 (0.4%) |
| 4-Person Households | 161 (6.9%) | 0 (0.0%) |
| 5-Person Households | 159 (6.8%) | 0 (0.0%) |
| 6-Person Households | 21 (0.9%) | 0 (0.0%) |
| 7+ Person Households | 30 (1.3%) | 0 (0.0%) |
| Total | 1,238 (53.3%) | 1,086 (46.7%) |
Female Fertility in Silver Springs
Fertility by Age in Silver Springs
Average fertility rate in Silver Springs is 60.0 births per 1,000 women. Women in the age bracket of 20 to 34 years have the highest fertility rate with 146.0 births per 1,000 women. Women in the age bracket of 20 to 34 years acount for 77.5% of all women with births.
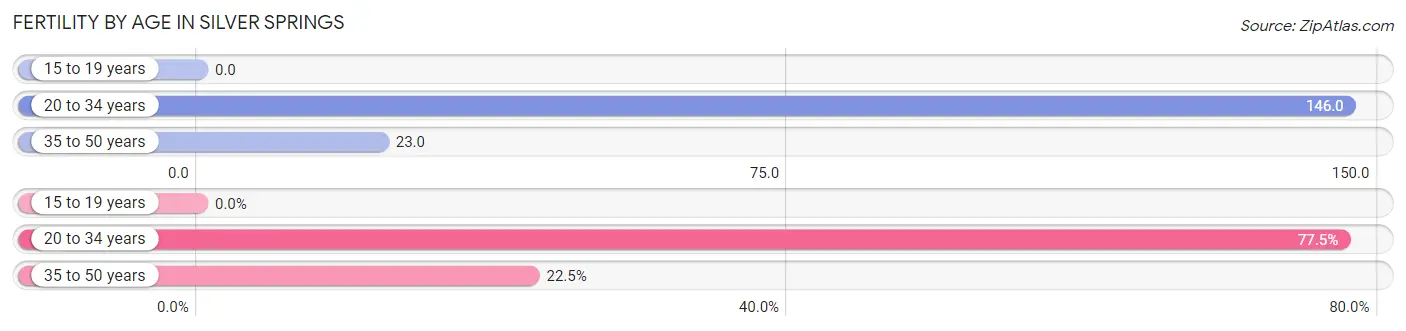
| Age Bracket | Women with Births | Births / 1,000 Women |
| 15 to 19 years | 0 (0.0%) | 0.0 |
| 20 to 34 years | 31 (77.5%) | 146.0 |
| 35 to 50 years | 9 (22.5%) | 23.0 |
| Total | 40 (100.0%) | 60.0 |
Fertility by Age by Marriage Status in Silver Springs
35.0% of women with births (40) in Silver Springs are married. The highest percentage of unmarried women with births falls into 35 to 50 years age bracket with 100.0% of them unmarried at the time of birth, while the lowest percentage of unmarried women with births belong to 20 to 34 years age bracket with 54.8% of them unmarried.
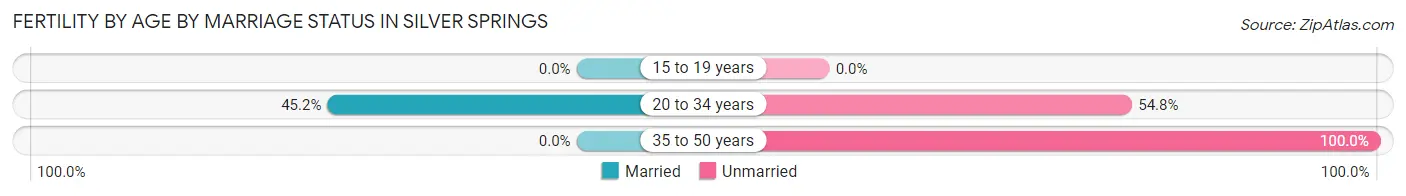
| Age Bracket | Married | Unmarried |
| 15 to 19 years | 0 (0.0%) | 0 (0.0%) |
| 20 to 34 years | 14 (45.2%) | 17 (54.8%) |
| 35 to 50 years | 0 (0.0%) | 9 (100.0%) |
| Total | 14 (35.0%) | 26 (65.0%) |
Fertility by Education in Silver Springs
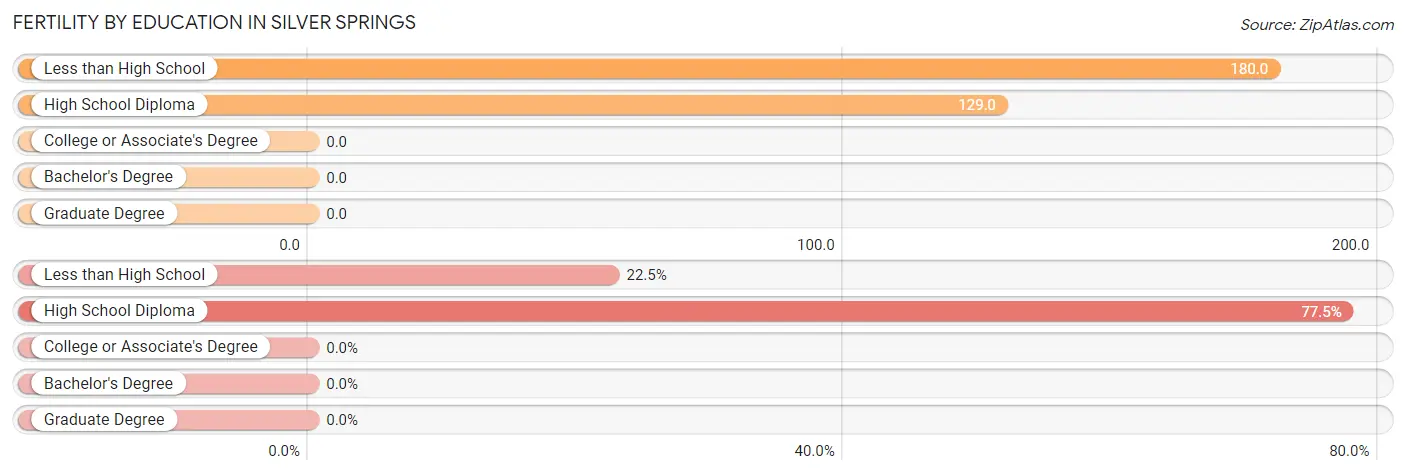
| Educational Attainment | Women with Births | Births / 1,000 Women |
| Less than High School | 9 (22.5%) | 180.0 |
| High School Diploma | 31 (77.5%) | 129.0 |
| College or Associate's Degree | 0 (0.0%) | 0.0 |
| Bachelor's Degree | 0 (0.0%) | 0.0 |
| Graduate Degree | 0 (0.0%) | 0.0 |
| Total | 40 (100.0%) | 60.0 |
Fertility by Education by Marriage Status in Silver Springs
65.0% of women with births in Silver Springs are unmarried. Women with the educational attainment of high school diploma are most likely to be married with 45.2% of them married at childbirth, while women with the educational attainment of less than high school are least likely to be married with 100.0% of them unmarried at childbirth.
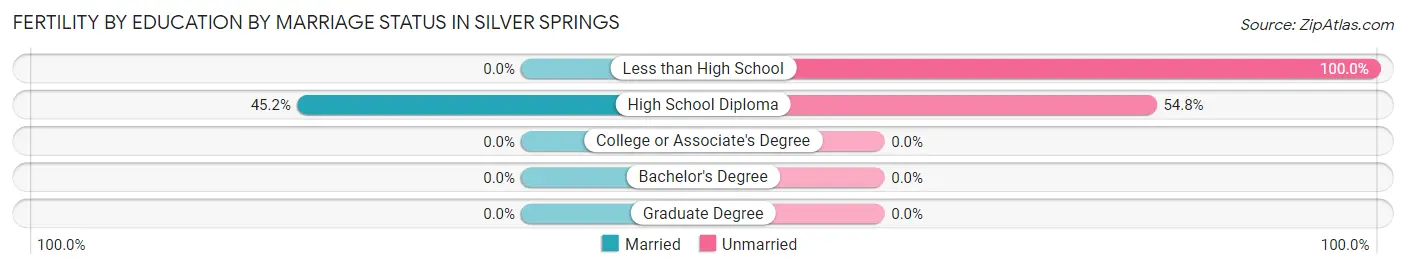
| Educational Attainment | Married | Unmarried |
| Less than High School | 0 (0.0%) | 9 (100.0%) |
| High School Diploma | 14 (45.2%) | 17 (54.8%) |
| College or Associate's Degree | 0 (0.0%) | 0 (0.0%) |
| Bachelor's Degree | 0 (0.0%) | 0 (0.0%) |
| Graduate Degree | 0 (0.0%) | 0 (0.0%) |
| Total | 14 (35.0%) | 26 (65.0%) |
Employment Characteristics in Silver Springs
Employment by Class of Employer in Silver Springs
Among the 1,692 employed individuals in Silver Springs, private company employees (1,249 | 73.8%), local government employees (108 | 6.4%), and self-employed (not incorporated) (98 | 5.8%) make up the most common classes of employment.
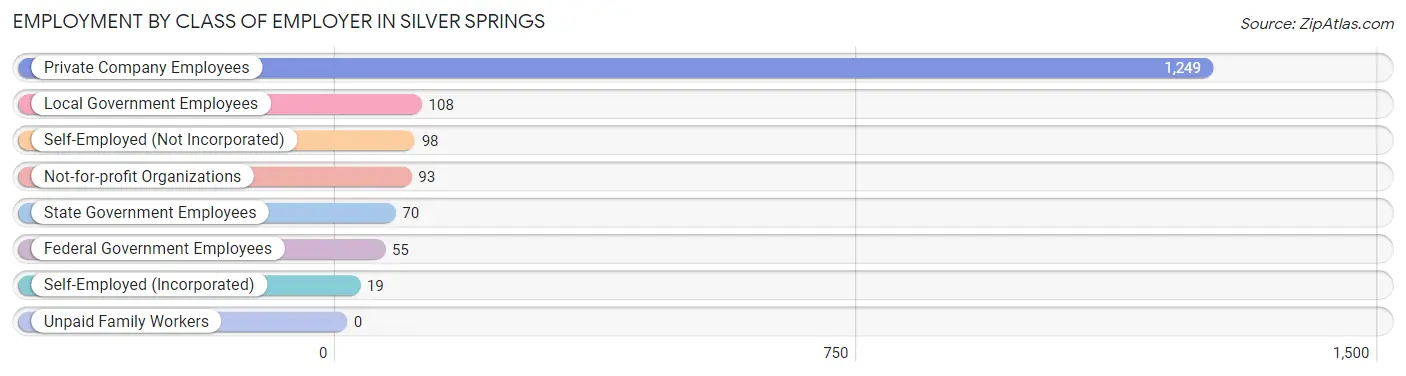
| Employer Class | # Employees | % Employees |
| Private Company Employees | 1,249 | 73.8% |
| Self-Employed (Incorporated) | 19 | 1.1% |
| Self-Employed (Not Incorporated) | 98 | 5.8% |
| Not-for-profit Organizations | 93 | 5.5% |
| Local Government Employees | 108 | 6.4% |
| State Government Employees | 70 | 4.1% |
| Federal Government Employees | 55 | 3.3% |
| Unpaid Family Workers | 0 | 0.0% |
| Total | 1,692 | 100.0% |
Employment Status by Age in Silver Springs
According to the labor force statistics for Silver Springs, out of the total population over 16 years of age (4,472), 43.0% or 1,923 individuals are in the labor force, with 9.0% or 173 of them unemployed. The age group with the highest labor force participation rate is 25 to 29 years, with 100.0% or 336 individuals in the labor force. Within the labor force, the 65 to 74 years age range has the highest percentage of unemployed individuals, with 24.0% or 30 of them being unemployed.
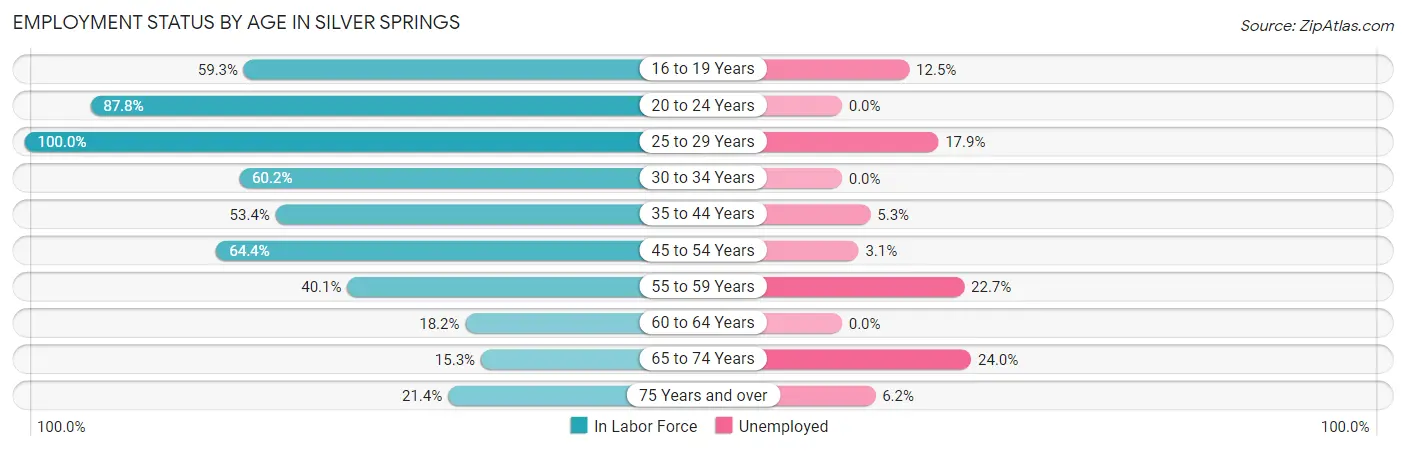
| Age Bracket | In Labor Force | Unemployed |
| 16 to 19 Years | 64 (59.3%) | 8 (12.5%) |
| 20 to 24 Years | 129 (87.8%) | 0 (0.0%) |
| 25 to 29 Years | 336 (100.0%) | 60 (17.9%) |
| 30 to 34 Years | 115 (60.2%) | 0 (0.0%) |
| 35 to 44 Years | 380 (53.4%) | 20 (5.3%) |
| 45 to 54 Years | 384 (64.4%) | 12 (3.1%) |
| 55 to 59 Years | 163 (40.1%) | 37 (22.7%) |
| 60 to 64 Years | 128 (18.2%) | 0 (0.0%) |
| 65 to 74 Years | 125 (15.3%) | 30 (24.0%) |
| 75 Years and over | 97 (21.4%) | 6 (6.2%) |
| Total | 1,923 (43.0%) | 173 (9.0%) |
Employment Status by Educational Attainment in Silver Springs
According to labor force statistics for Silver Springs, 51.1% of individuals (1,505) out of the total population between 25 and 64 years of age (2,946) are in the labor force, with 8.6% or 129 of them being unemployed. The group with the highest labor force participation rate are those with the educational attainment of bachelor's degree or higher, with 76.3% or 322 individuals in the labor force. Within the labor force, individuals with less than high school education have the highest percentage of unemployment, with 50.3% or 76 of them being unemployed.
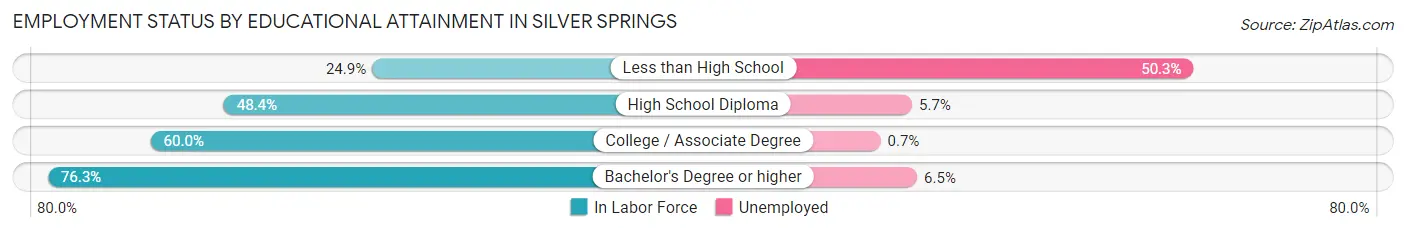
| Educational Attainment | In Labor Force | Unemployed |
| Less than High School | 151 (24.9%) | 305 (50.3%) |
| High School Diploma | 487 (48.4%) | 57 (5.7%) |
| College / Associate Degree | 546 (60.0%) | 6 (0.7%) |
| Bachelor's Degree or higher | 322 (76.3%) | 27 (6.5%) |
| Total | 1,505 (51.1%) | 253 (8.6%) |
Employment Occupations by Sex in Silver Springs
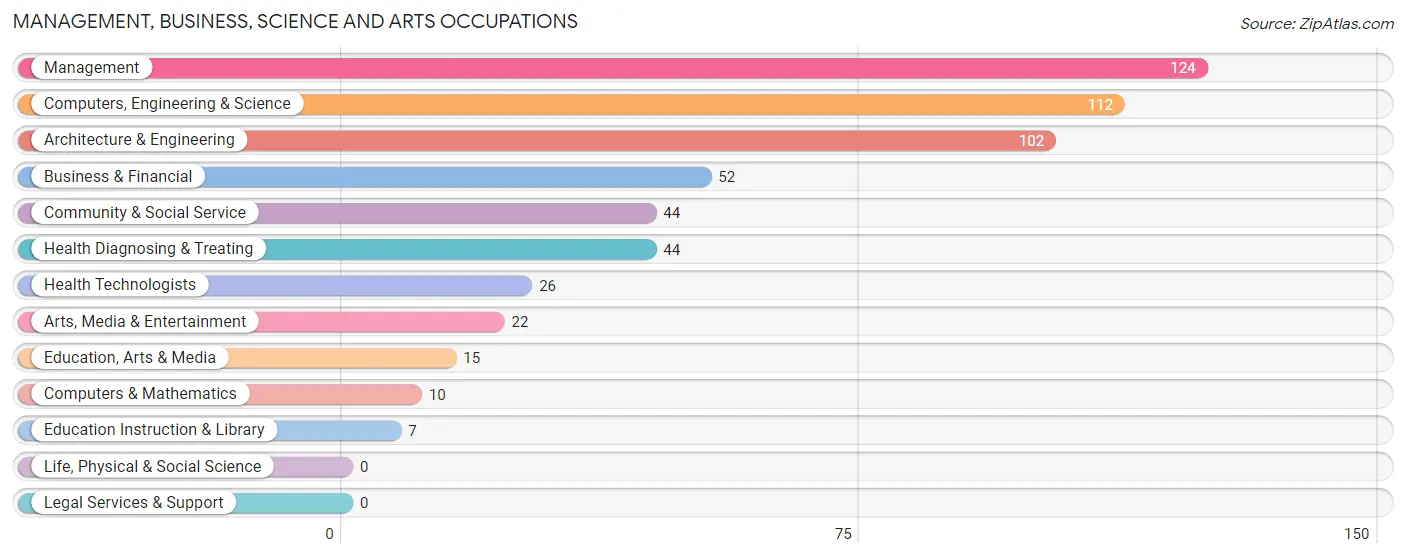
Management, Business, Science and Arts Occupations
The most common Management, Business, Science and Arts occupations in Silver Springs are Management (124 | 7.1%), Computers, Engineering & Science (112 | 6.4%), Architecture & Engineering (102 | 5.8%), Business & Financial (52 | 3.0%), and Community & Social Service (44 | 2.5%).
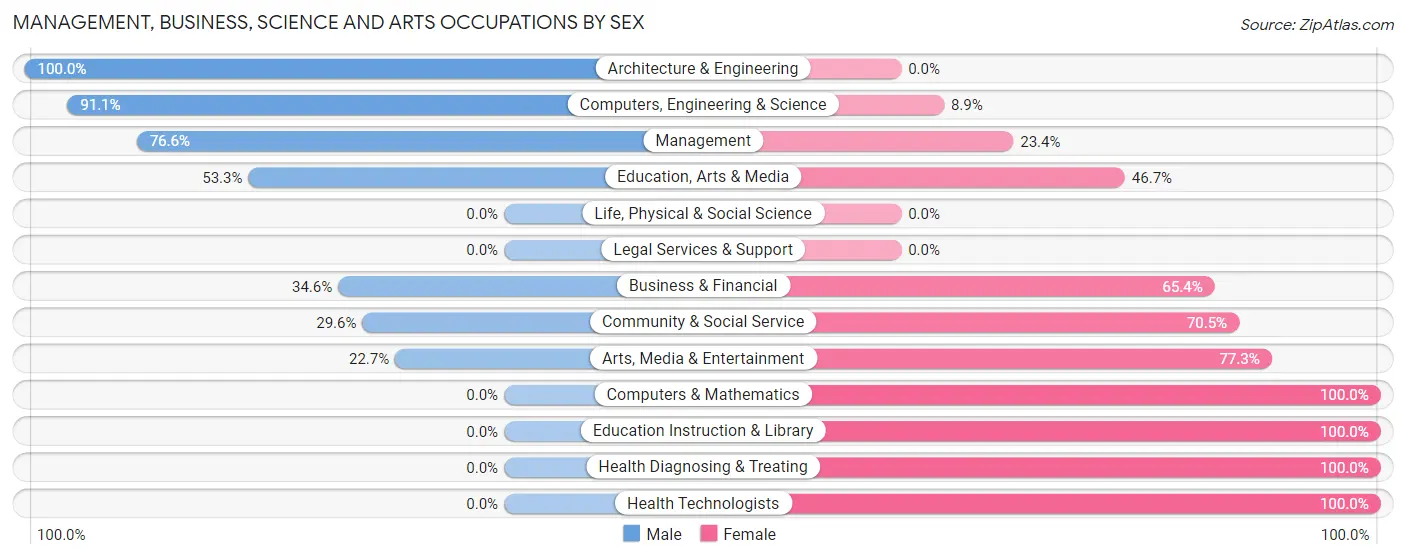
Management, Business, Science and Arts Occupations by Sex
Within the Management, Business, Science and Arts occupations in Silver Springs, the most male-oriented occupations are Architecture & Engineering (100.0%), Computers, Engineering & Science (91.1%), and Management (76.6%), while the most female-oriented occupations are Computers & Mathematics (100.0%), Education Instruction & Library (100.0%), and Health Diagnosing & Treating (100.0%).
| Occupation | Male | Female |
| Management | 95 (76.6%) | 29 (23.4%) |
| Business & Financial | 18 (34.6%) | 34 (65.4%) |
| Computers, Engineering & Science | 102 (91.1%) | 10 (8.9%) |
| Computers & Mathematics | 0 (0.0%) | 10 (100.0%) |
| Architecture & Engineering | 102 (100.0%) | 0 (0.0%) |
| Life, Physical & Social Science | 0 (0.0%) | 0 (0.0%) |
| Community & Social Service | 13 (29.5%) | 31 (70.5%) |
| Education, Arts & Media | 8 (53.3%) | 7 (46.7%) |
| Legal Services & Support | 0 (0.0%) | 0 (0.0%) |
| Education Instruction & Library | 0 (0.0%) | 7 (100.0%) |
| Arts, Media & Entertainment | 5 (22.7%) | 17 (77.3%) |
| Health Diagnosing & Treating | 0 (0.0%) | 44 (100.0%) |
| Health Technologists | 0 (0.0%) | 26 (100.0%) |
| Total (Category) | 228 (60.6%) | 148 (39.4%) |
| Total (Overall) | 1,050 (60.1%) | 698 (39.9%) |
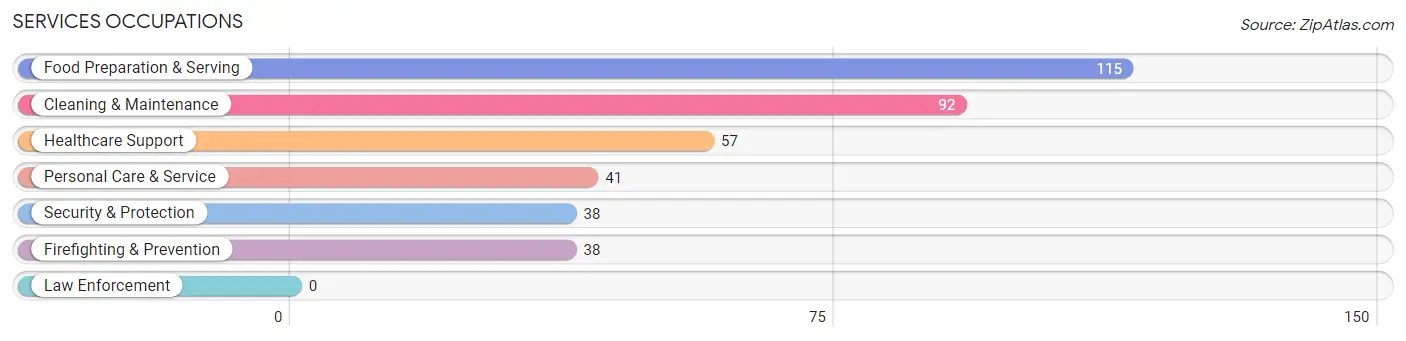
Services Occupations
The most common Services occupations in Silver Springs are Food Preparation & Serving (115 | 6.6%), Cleaning & Maintenance (92 | 5.3%), Healthcare Support (57 | 3.3%), Personal Care & Service (41 | 2.4%), and Security & Protection (38 | 2.2%).
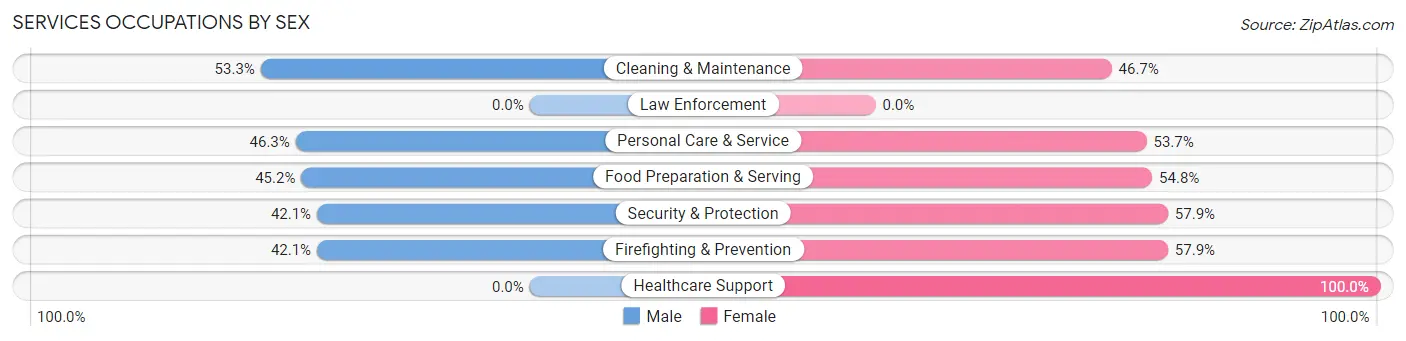
Services Occupations by Sex
Within the Services occupations in Silver Springs, the most male-oriented occupations are Cleaning & Maintenance (53.3%), Personal Care & Service (46.3%), and Food Preparation & Serving (45.2%), while the most female-oriented occupations are Healthcare Support (100.0%), Security & Protection (57.9%), and Firefighting & Prevention (57.9%).
| Occupation | Male | Female |
| Healthcare Support | 0 (0.0%) | 57 (100.0%) |
| Security & Protection | 16 (42.1%) | 22 (57.9%) |
| Firefighting & Prevention | 16 (42.1%) | 22 (57.9%) |
| Law Enforcement | 0 (0.0%) | 0 (0.0%) |
| Food Preparation & Serving | 52 (45.2%) | 63 (54.8%) |
| Cleaning & Maintenance | 49 (53.3%) | 43 (46.7%) |
| Personal Care & Service | 19 (46.3%) | 22 (53.7%) |
| Total (Category) | 136 (39.7%) | 207 (60.4%) |
| Total (Overall) | 1,050 (60.1%) | 698 (39.9%) |
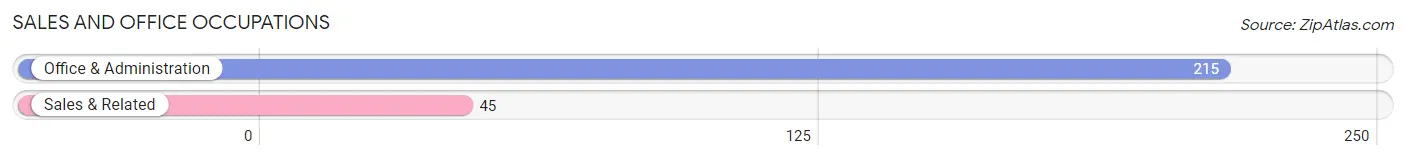
Sales and Office Occupations
The most common Sales and Office occupations in Silver Springs are Office & Administration (215 | 12.3%), and Sales & Related (45 | 2.6%).
Sales and Office Occupations by Sex
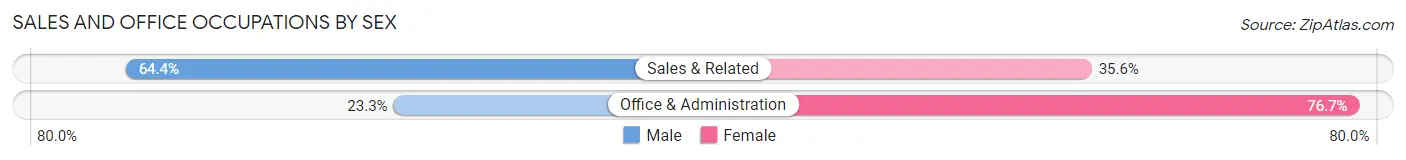
| Occupation | Male | Female |
| Sales & Related | 29 (64.4%) | 16 (35.6%) |
| Office & Administration | 50 (23.3%) | 165 (76.7%) |
| Total (Category) | 79 (30.4%) | 181 (69.6%) |
| Total (Overall) | 1,050 (60.1%) | 698 (39.9%) |
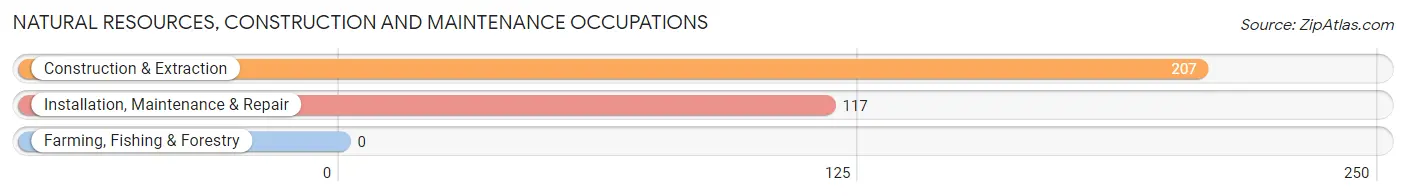
Natural Resources, Construction and Maintenance Occupations
The most common Natural Resources, Construction and Maintenance occupations in Silver Springs are Construction & Extraction (207 | 11.8%), and Installation, Maintenance & Repair (117 | 6.7%).
Natural Resources, Construction and Maintenance Occupations by Sex
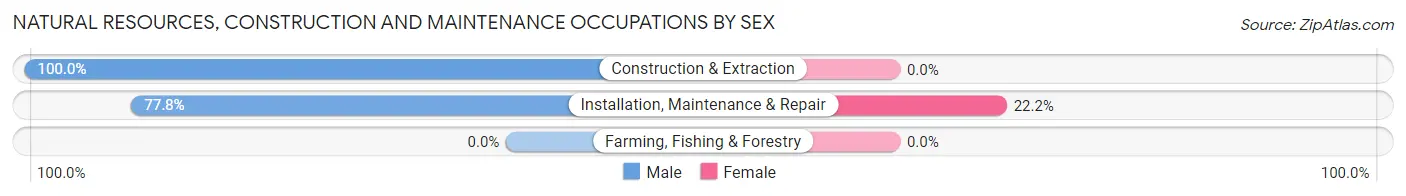
| Occupation | Male | Female |
| Farming, Fishing & Forestry | 0 (0.0%) | 0 (0.0%) |
| Construction & Extraction | 207 (100.0%) | 0 (0.0%) |
| Installation, Maintenance & Repair | 91 (77.8%) | 26 (22.2%) |
| Total (Category) | 298 (92.0%) | 26 (8.0%) |
| Total (Overall) | 1,050 (60.1%) | 698 (39.9%) |
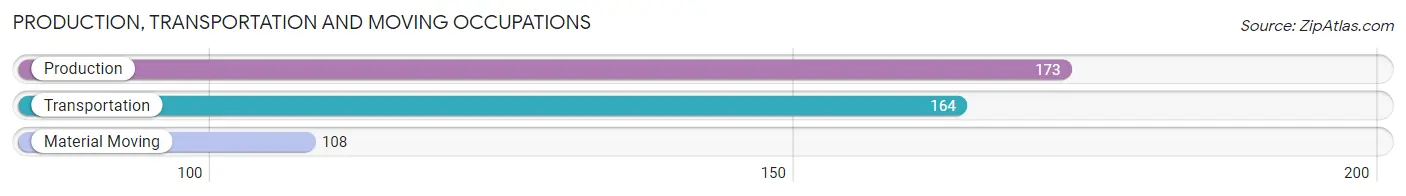
Production, Transportation and Moving Occupations
The most common Production, Transportation and Moving occupations in Silver Springs are Production (173 | 9.9%), Transportation (164 | 9.4%), and Material Moving (108 | 6.2%).
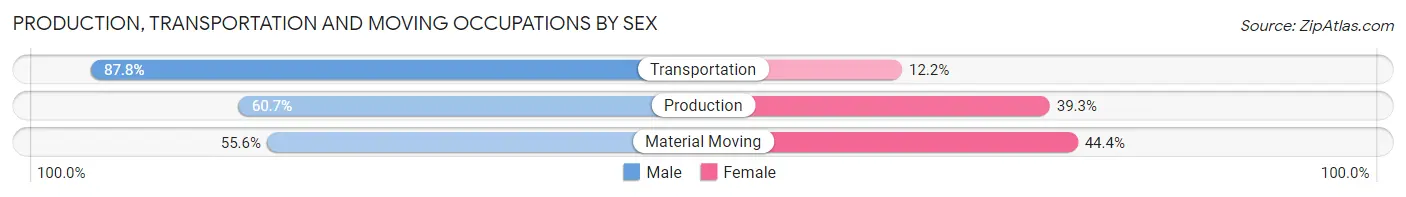
Production, Transportation and Moving Occupations by Sex
| Occupation | Male | Female |
| Production | 105 (60.7%) | 68 (39.3%) |
| Transportation | 144 (87.8%) | 20 (12.2%) |
| Material Moving | 60 (55.6%) | 48 (44.4%) |
| Total (Category) | 309 (69.4%) | 136 (30.6%) |
| Total (Overall) | 1,050 (60.1%) | 698 (39.9%) |
Employment Industries by Sex in Silver Springs
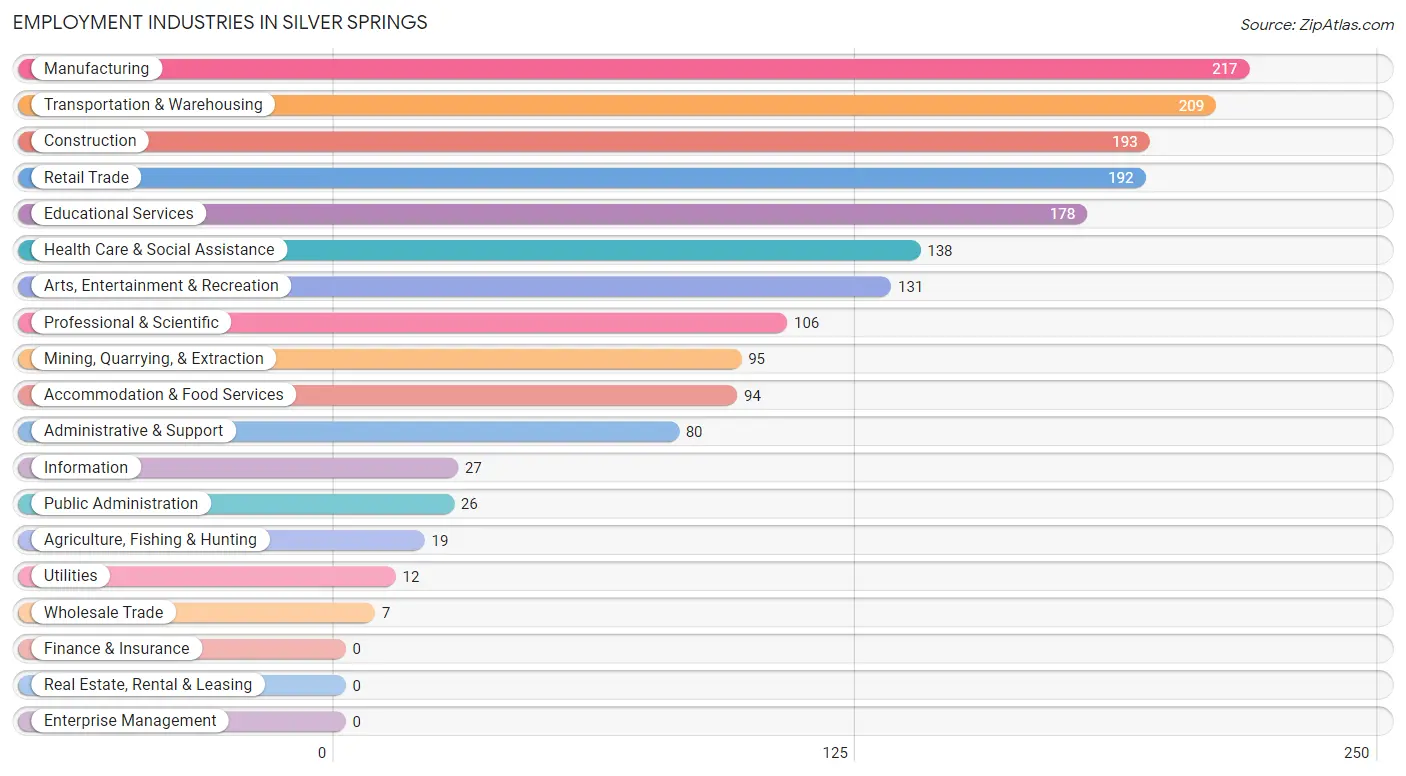
Employment Industries in Silver Springs
The major employment industries in Silver Springs include Manufacturing (217 | 12.4%), Transportation & Warehousing (209 | 12.0%), Construction (193 | 11.0%), Retail Trade (192 | 11.0%), and Educational Services (178 | 10.2%).
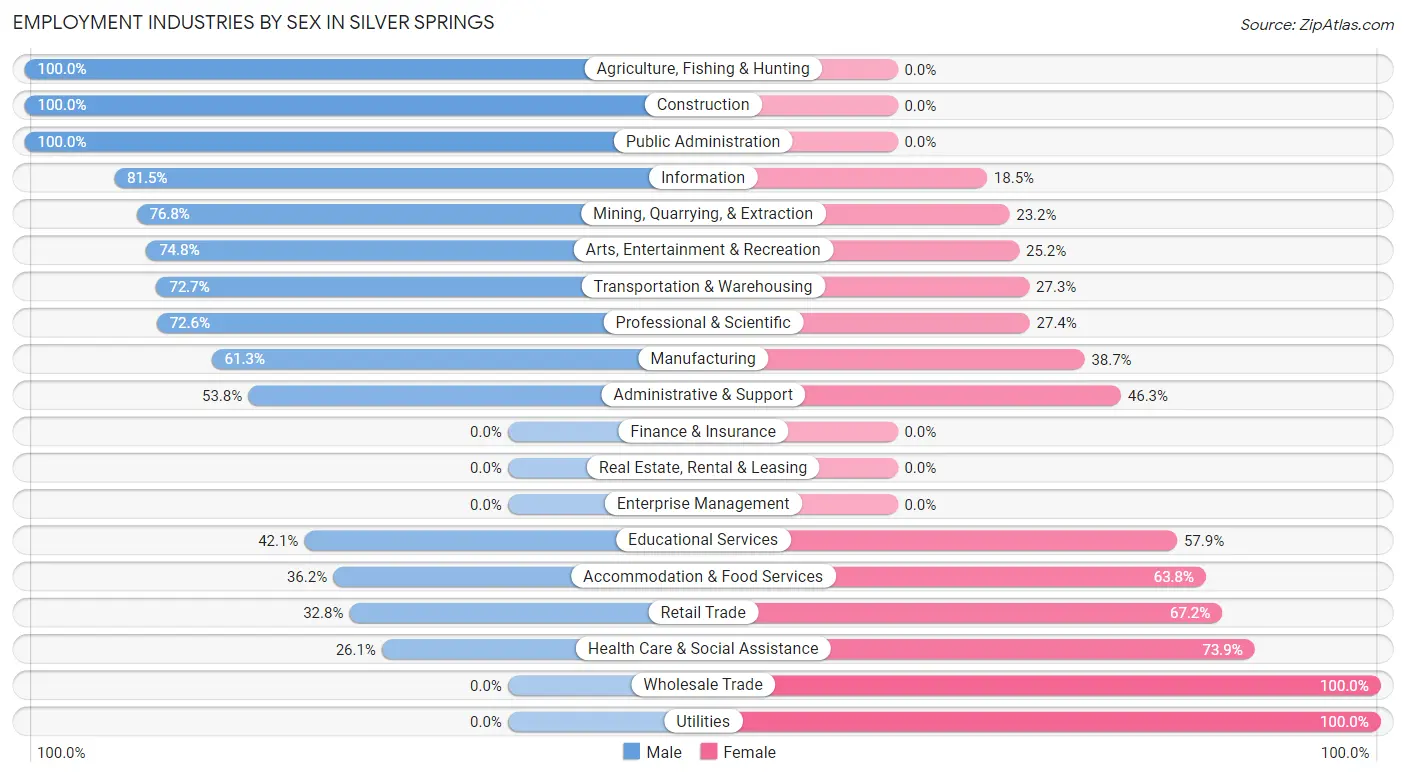
Employment Industries by Sex in Silver Springs
The Silver Springs industries that see more men than women are Agriculture, Fishing & Hunting (100.0%), Construction (100.0%), and Public Administration (100.0%), whereas the industries that tend to have a higher number of women are Wholesale Trade (100.0%), Utilities (100.0%), and Health Care & Social Assistance (73.9%).
| Industry | Male | Female |
| Agriculture, Fishing & Hunting | 19 (100.0%) | 0 (0.0%) |
| Mining, Quarrying, & Extraction | 73 (76.8%) | 22 (23.2%) |
| Construction | 193 (100.0%) | 0 (0.0%) |
| Manufacturing | 133 (61.3%) | 84 (38.7%) |
| Wholesale Trade | 0 (0.0%) | 7 (100.0%) |
| Retail Trade | 63 (32.8%) | 129 (67.2%) |
| Transportation & Warehousing | 152 (72.7%) | 57 (27.3%) |
| Utilities | 0 (0.0%) | 12 (100.0%) |
| Information | 22 (81.5%) | 5 (18.5%) |
| Finance & Insurance | 0 (0.0%) | 0 (0.0%) |
| Real Estate, Rental & Leasing | 0 (0.0%) | 0 (0.0%) |
| Professional & Scientific | 77 (72.6%) | 29 (27.4%) |
| Enterprise Management | 0 (0.0%) | 0 (0.0%) |
| Administrative & Support | 43 (53.7%) | 37 (46.3%) |
| Educational Services | 75 (42.1%) | 103 (57.9%) |
| Health Care & Social Assistance | 36 (26.1%) | 102 (73.9%) |
| Arts, Entertainment & Recreation | 98 (74.8%) | 33 (25.2%) |
| Accommodation & Food Services | 34 (36.2%) | 60 (63.8%) |
| Public Administration | 26 (100.0%) | 0 (0.0%) |
| Total | 1,050 (60.1%) | 698 (39.9%) |
Education in Silver Springs
School Enrollment in Silver Springs
The most common levels of schooling among the 679 students in Silver Springs are middle school (195 | 28.7%), elementary school (186 | 27.4%), and high school (140 | 20.6%).
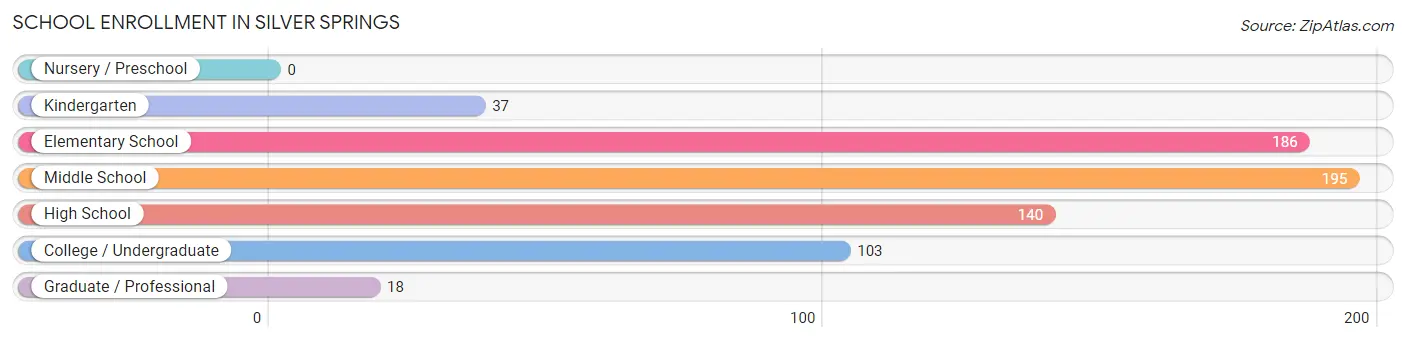
| School Level | # Students | % Students |
| Nursery / Preschool | 0 | 0.0% |
| Kindergarten | 37 | 5.4% |
| Elementary School | 186 | 27.4% |
| Middle School | 195 | 28.7% |
| High School | 140 | 20.6% |
| College / Undergraduate | 103 | 15.2% |
| Graduate / Professional | 18 | 2.6% |
| Total | 679 | 100.0% |
School Enrollment by Age by Funding Source in Silver Springs
Out of a total of 679 students who are enrolled in schools in Silver Springs, 70 (10.3%) attend a private institution, while the remaining 609 (89.7%) are enrolled in public schools. The age group of 18 to 19 year olds has the highest likelihood of being enrolled in private schools, with 8 (100.0% in the age bracket) enrolled. Conversely, the age group of 25 to 34 year olds has the lowest likelihood of being enrolled in a private school, with 46 (100.0% in the age bracket) attending a public institution.
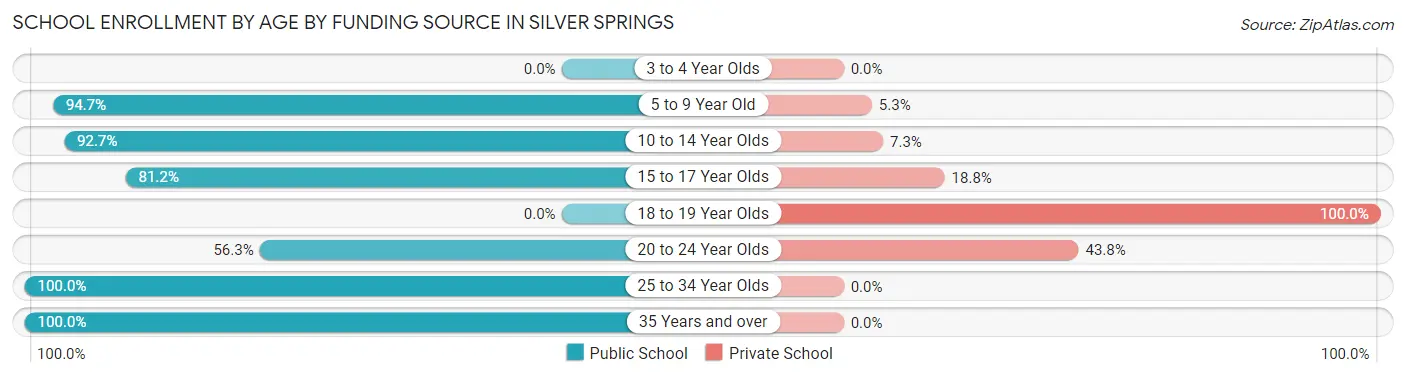
| Age Bracket | Public School | Private School |
| 3 to 4 Year Olds | 0 (0.0%) | 0 (0.0%) |
| 5 to 9 Year Old | 180 (94.7%) | 10 (5.3%) |
| 10 to 14 Year Olds | 240 (92.7%) | 19 (7.3%) |
| 15 to 17 Year Olds | 82 (81.2%) | 19 (18.8%) |
| 18 to 19 Year Olds | 0 (0.0%) | 8 (100.0%) |
| 20 to 24 Year Olds | 18 (56.2%) | 14 (43.8%) |
| 25 to 34 Year Olds | 46 (100.0%) | 0 (0.0%) |
| 35 Years and over | 43 (100.0%) | 0 (0.0%) |
| Total | 609 (89.7%) | 70 (10.3%) |
Educational Attainment by Field of Study in Silver Springs
Business (162 | 27.4%), engineering (82 | 13.9%), bio, nature & agricultural (69 | 11.7%), visual & performing arts (48 | 8.1%), and arts & humanities (44 | 7.4%) are the most common fields of study among 591 individuals in Silver Springs who have obtained a bachelor's degree or higher.
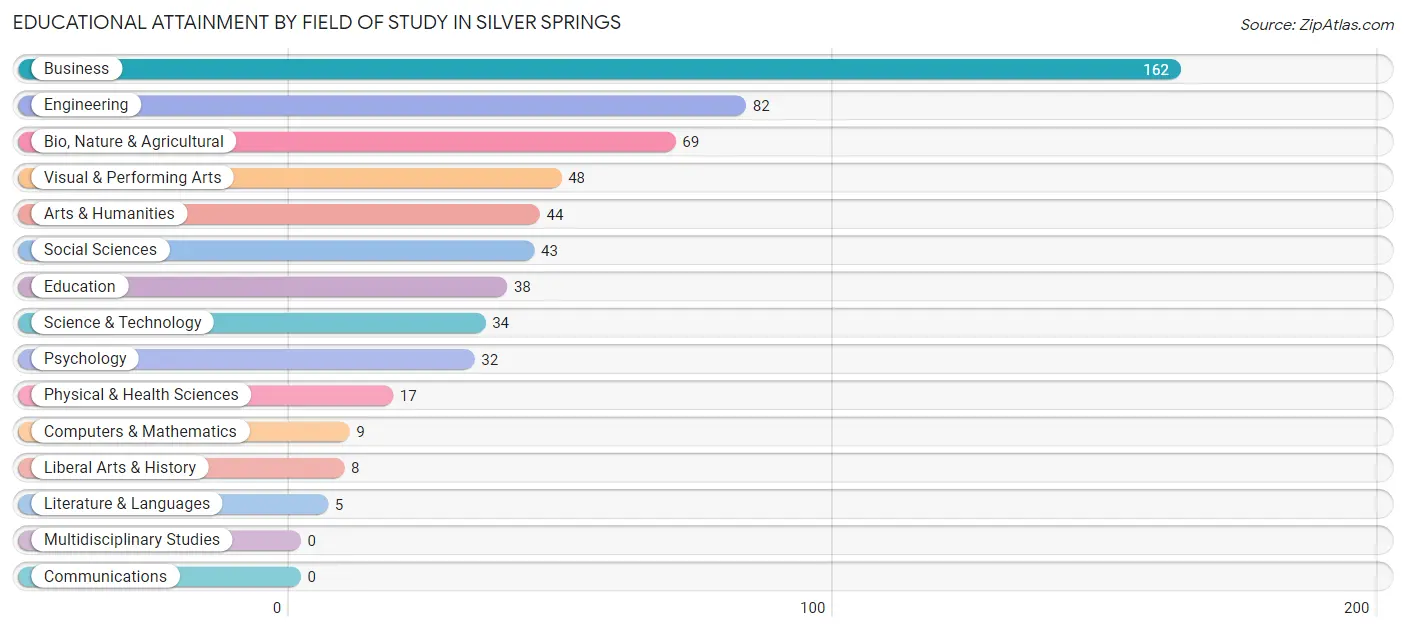
| Field of Study | # Graduates | % Graduates |
| Computers & Mathematics | 9 | 1.5% |
| Bio, Nature & Agricultural | 69 | 11.7% |
| Physical & Health Sciences | 17 | 2.9% |
| Psychology | 32 | 5.4% |
| Social Sciences | 43 | 7.3% |
| Engineering | 82 | 13.9% |
| Multidisciplinary Studies | 0 | 0.0% |
| Science & Technology | 34 | 5.8% |
| Business | 162 | 27.4% |
| Education | 38 | 6.4% |
| Literature & Languages | 5 | 0.9% |
| Liberal Arts & History | 8 | 1.3% |
| Visual & Performing Arts | 48 | 8.1% |
| Communications | 0 | 0.0% |
| Arts & Humanities | 44 | 7.4% |
| Total | 591 | 100.0% |
Transportation & Commute in Silver Springs
Vehicle Availability by Sex in Silver Springs
The most prevalent vehicle ownership categories in Silver Springs are males with 2 vehicles (521, accounting for 49.6%) and females with 2 vehicles (224, making up 81.1%).
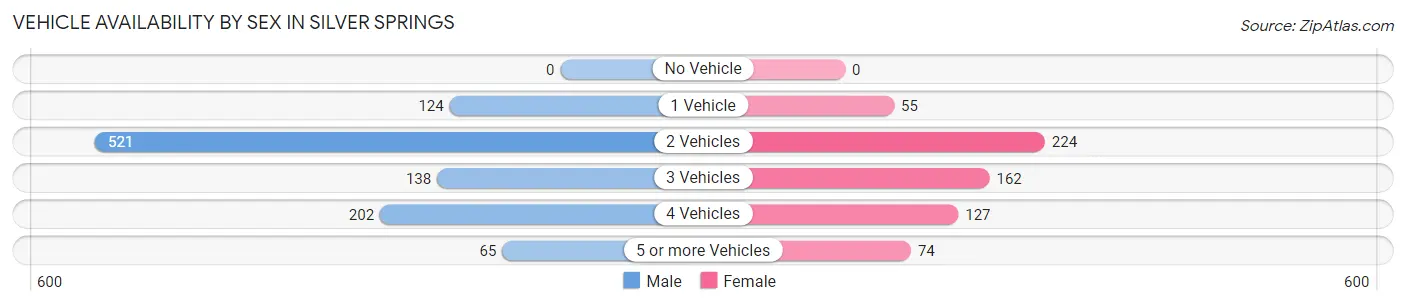
| Vehicles Available | Male | Female |
| No Vehicle | 0 (0.0%) | 0 (0.0%) |
| 1 Vehicle | 124 (11.8%) | 55 (8.6%) |
| 2 Vehicles | 521 (49.6%) | 224 (34.9%) |
| 3 Vehicles | 138 (13.1%) | 162 (25.2%) |
| 4 Vehicles | 202 (19.2%) | 127 (19.8%) |
| 5 or more Vehicles | 65 (6.2%) | 74 (11.5%) |
| Total | 1,050 (100.0%) | 642 (100.0%) |
Commute Time in Silver Springs
The most frequently occuring commute durations in Silver Springs are 45 to 59 minutes (318 commuters, 19.6%), 30 to 34 minutes (260 commuters, 16.0%), and 60 to 89 minutes (205 commuters, 12.6%).
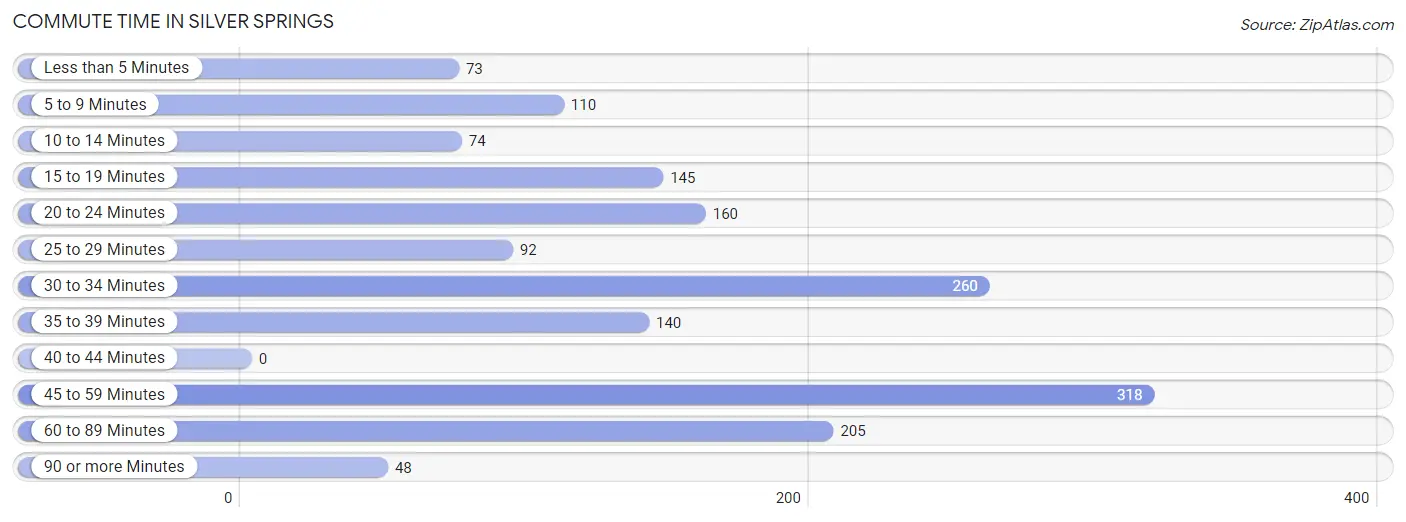
| Commute Time | # Commuters | % Commuters |
| Less than 5 Minutes | 73 | 4.5% |
| 5 to 9 Minutes | 110 | 6.8% |
| 10 to 14 Minutes | 74 | 4.5% |
| 15 to 19 Minutes | 145 | 8.9% |
| 20 to 24 Minutes | 160 | 9.9% |
| 25 to 29 Minutes | 92 | 5.7% |
| 30 to 34 Minutes | 260 | 16.0% |
| 35 to 39 Minutes | 140 | 8.6% |
| 40 to 44 Minutes | 0 | 0.0% |
| 45 to 59 Minutes | 318 | 19.6% |
| 60 to 89 Minutes | 205 | 12.6% |
| 90 or more Minutes | 48 | 2.9% |
Commute Time by Sex in Silver Springs
The most common commute times in Silver Springs are 30 to 34 minutes (214 commuters, 20.6%) for males and 45 to 59 minutes (123 commuters, 21.1%) for females.
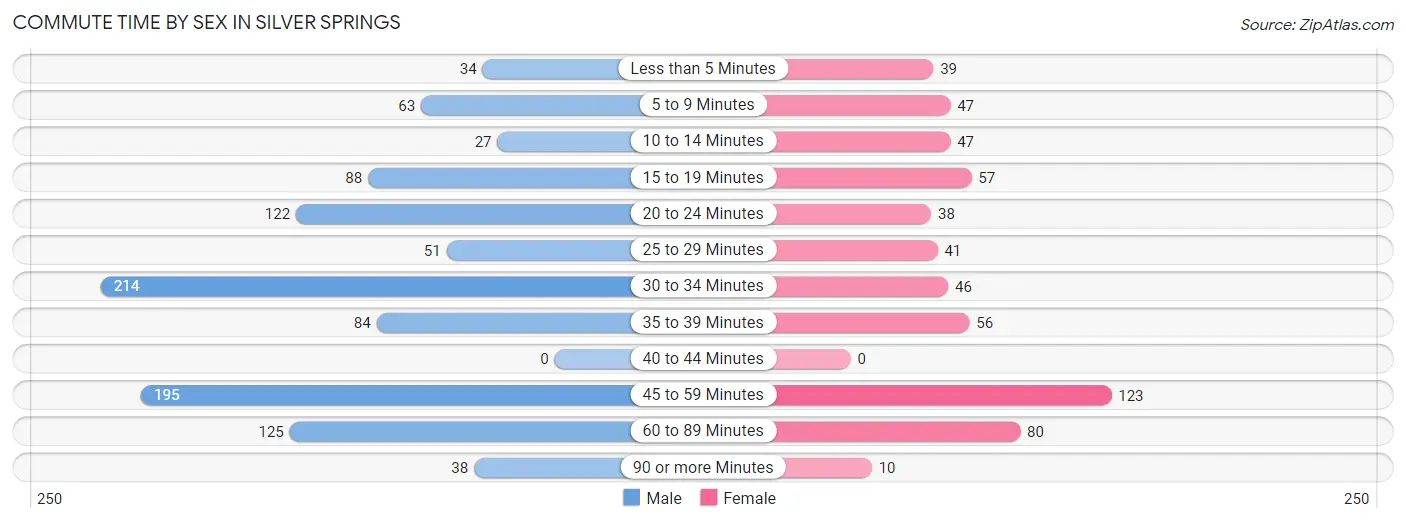
| Commute Time | Male | Female |
| Less than 5 Minutes | 34 (3.3%) | 39 (6.7%) |
| 5 to 9 Minutes | 63 (6.0%) | 47 (8.1%) |
| 10 to 14 Minutes | 27 (2.6%) | 47 (8.1%) |
| 15 to 19 Minutes | 88 (8.5%) | 57 (9.8%) |
| 20 to 24 Minutes | 122 (11.7%) | 38 (6.5%) |
| 25 to 29 Minutes | 51 (4.9%) | 41 (7.0%) |
| 30 to 34 Minutes | 214 (20.6%) | 46 (7.9%) |
| 35 to 39 Minutes | 84 (8.1%) | 56 (9.6%) |
| 40 to 44 Minutes | 0 (0.0%) | 0 (0.0%) |
| 45 to 59 Minutes | 195 (18.7%) | 123 (21.1%) |
| 60 to 89 Minutes | 125 (12.0%) | 80 (13.7%) |
| 90 or more Minutes | 38 (3.6%) | 10 (1.7%) |
Time of Departure to Work by Sex in Silver Springs
The most frequent times of departure to work in Silver Springs are 12:00 AM to 4:59 AM (296, 28.4%) for males and 5:00 AM to 5:29 AM (107, 18.3%) for females.
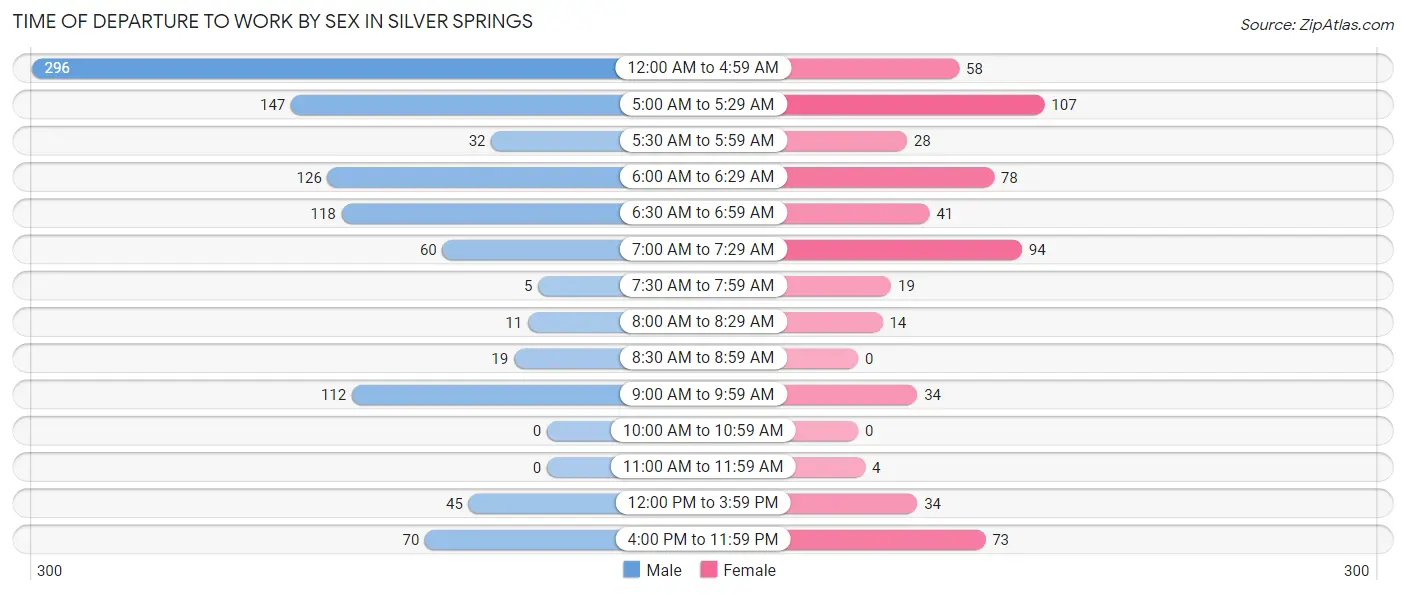
| Time of Departure | Male | Female |
| 12:00 AM to 4:59 AM | 296 (28.4%) | 58 (9.9%) |
| 5:00 AM to 5:29 AM | 147 (14.1%) | 107 (18.3%) |
| 5:30 AM to 5:59 AM | 32 (3.1%) | 28 (4.8%) |
| 6:00 AM to 6:29 AM | 126 (12.1%) | 78 (13.4%) |
| 6:30 AM to 6:59 AM | 118 (11.3%) | 41 (7.0%) |
| 7:00 AM to 7:29 AM | 60 (5.8%) | 94 (16.1%) |
| 7:30 AM to 7:59 AM | 5 (0.5%) | 19 (3.3%) |
| 8:00 AM to 8:29 AM | 11 (1.1%) | 14 (2.4%) |
| 8:30 AM to 8:59 AM | 19 (1.8%) | 0 (0.0%) |
| 9:00 AM to 9:59 AM | 112 (10.8%) | 34 (5.8%) |
| 10:00 AM to 10:59 AM | 0 (0.0%) | 0 (0.0%) |
| 11:00 AM to 11:59 AM | 0 (0.0%) | 4 (0.7%) |
| 12:00 PM to 3:59 PM | 45 (4.3%) | 34 (5.8%) |
| 4:00 PM to 11:59 PM | 70 (6.7%) | 73 (12.5%) |
| Total | 1,041 (100.0%) | 584 (100.0%) |
Housing Occupancy in Silver Springs
Occupancy by Ownership in Silver Springs
Of the total 2,324 dwellings in Silver Springs, owner-occupied units account for 1,867 (80.3%), while renter-occupied units make up 457 (19.7%).
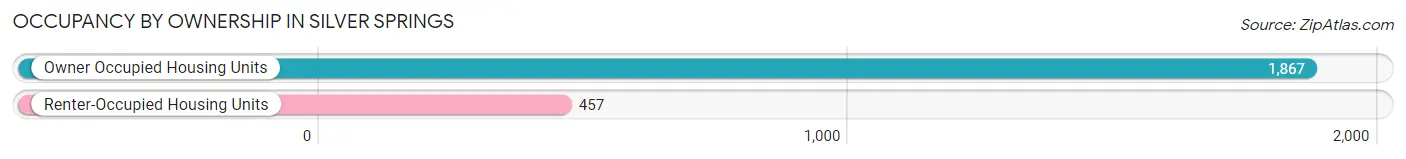
| Occupancy | # Housing Units | % Housing Units |
| Owner Occupied Housing Units | 1,867 | 80.3% |
| Renter-Occupied Housing Units | 457 | 19.7% |
| Total Occupied Housing Units | 2,324 | 100.0% |
Occupancy by Household Size in Silver Springs
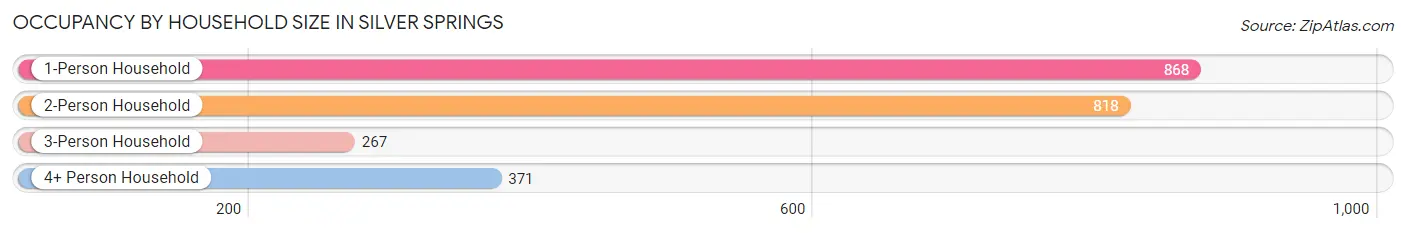
| Household Size | # Housing Units | % Housing Units |
| 1-Person Household | 868 | 37.3% |
| 2-Person Household | 818 | 35.2% |
| 3-Person Household | 267 | 11.5% |
| 4+ Person Household | 371 | 16.0% |
| Total Housing Units | 2,324 | 100.0% |
Occupancy by Ownership by Household Size in Silver Springs
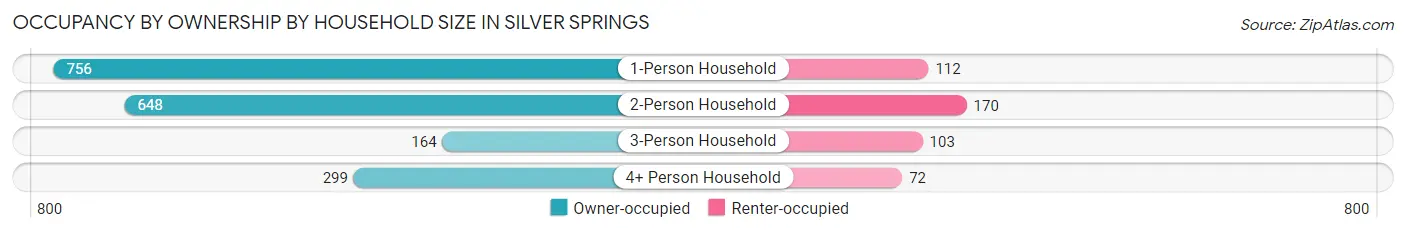
| Household Size | Owner-occupied | Renter-occupied |
| 1-Person Household | 756 (87.1%) | 112 (12.9%) |
| 2-Person Household | 648 (79.2%) | 170 (20.8%) |
| 3-Person Household | 164 (61.4%) | 103 (38.6%) |
| 4+ Person Household | 299 (80.6%) | 72 (19.4%) |
| Total Housing Units | 1,867 (80.3%) | 457 (19.7%) |
Occupancy by Educational Attainment in Silver Springs
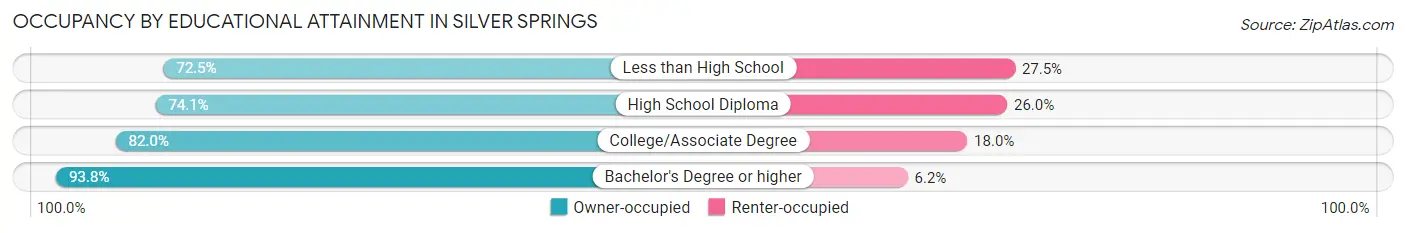
| Household Size | Owner-occupied | Renter-occupied |
| Less than High School | 224 (72.5%) | 85 (27.5%) |
| High School Diploma | 505 (74.1%) | 177 (26.0%) |
| College/Associate Degree | 777 (82.0%) | 171 (18.0%) |
| Bachelor's Degree or higher | 361 (93.8%) | 24 (6.2%) |
Occupancy by Age of Householder in Silver Springs
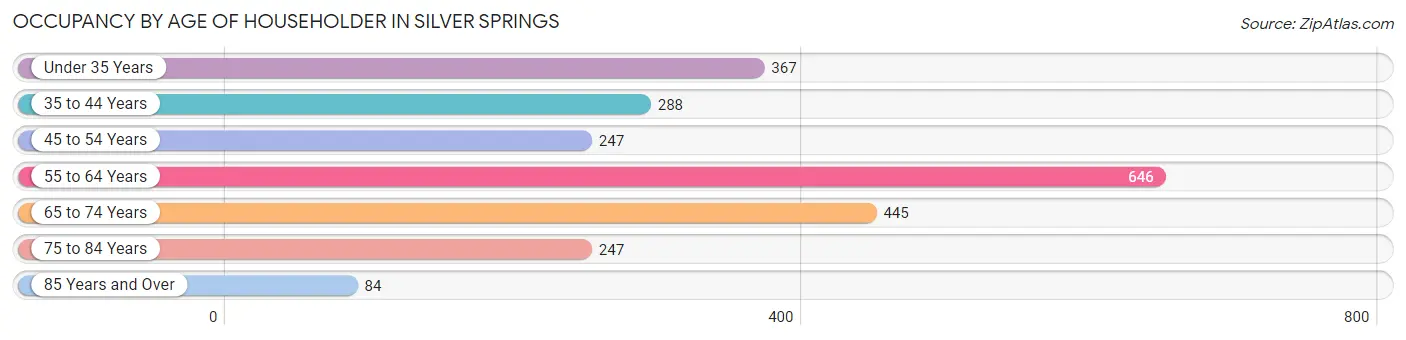
| Age Bracket | # Households | % Households |
| Under 35 Years | 367 | 15.8% |
| 35 to 44 Years | 288 | 12.4% |
| 45 to 54 Years | 247 | 10.6% |
| 55 to 64 Years | 646 | 27.8% |
| 65 to 74 Years | 445 | 19.2% |
| 75 to 84 Years | 247 | 10.6% |
| 85 Years and Over | 84 | 3.6% |
| Total | 2,324 | 100.0% |
Housing Finances in Silver Springs
Median Income by Occupancy in Silver Springs
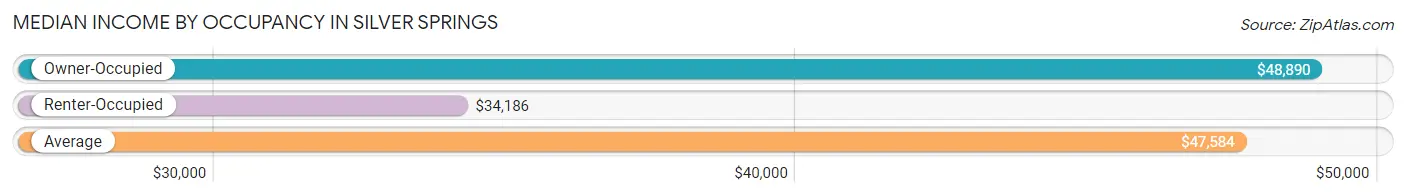
| Occupancy Type | # Households | Median Income |
| Owner-Occupied | 1,867 (80.3%) | $48,890 |
| Renter-Occupied | 457 (19.7%) | $34,186 |
| Average | 2,324 (100.0%) | $47,584 |
Occupancy by Householder Income Bracket in Silver Springs
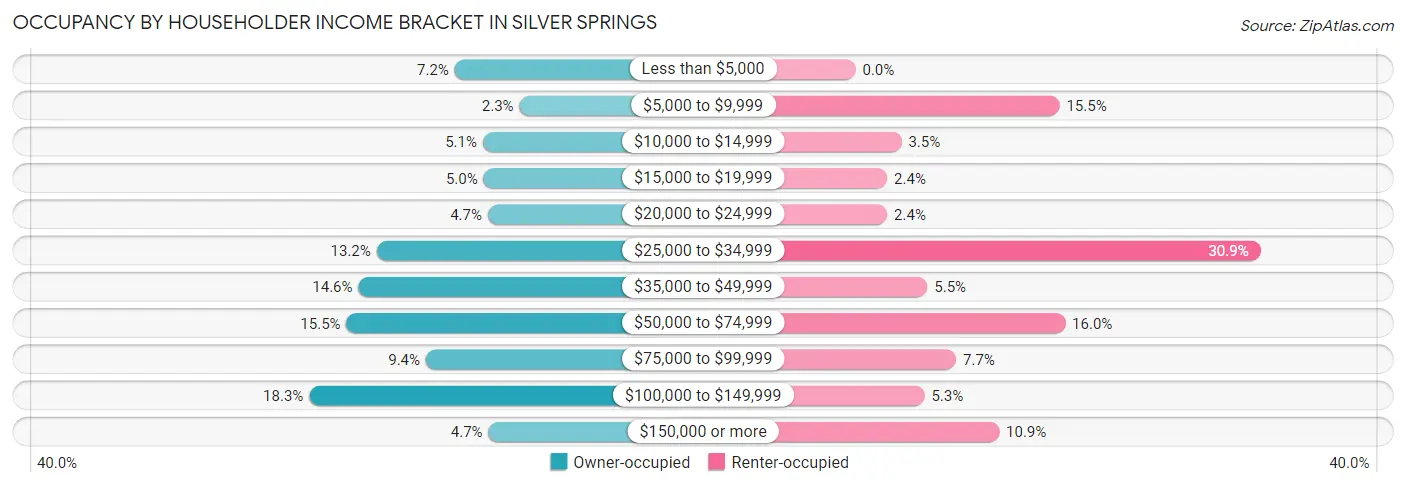
| Income Bracket | Owner-occupied | Renter-occupied |
| Less than $5,000 | 135 (7.2%) | 0 (0.0%) |
| $5,000 to $9,999 | 43 (2.3%) | 71 (15.5%) |
| $10,000 to $14,999 | 95 (5.1%) | 16 (3.5%) |
| $15,000 to $19,999 | 94 (5.0%) | 11 (2.4%) |
| $20,000 to $24,999 | 88 (4.7%) | 11 (2.4%) |
| $25,000 to $34,999 | 246 (13.2%) | 141 (30.8%) |
| $35,000 to $49,999 | 272 (14.6%) | 25 (5.5%) |
| $50,000 to $74,999 | 289 (15.5%) | 73 (16.0%) |
| $75,000 to $99,999 | 176 (9.4%) | 35 (7.7%) |
| $100,000 to $149,999 | 342 (18.3%) | 24 (5.2%) |
| $150,000 or more | 87 (4.7%) | 50 (10.9%) |
| Total | 1,867 (100.0%) | 457 (100.0%) |
Monthly Housing Cost Tiers in Silver Springs
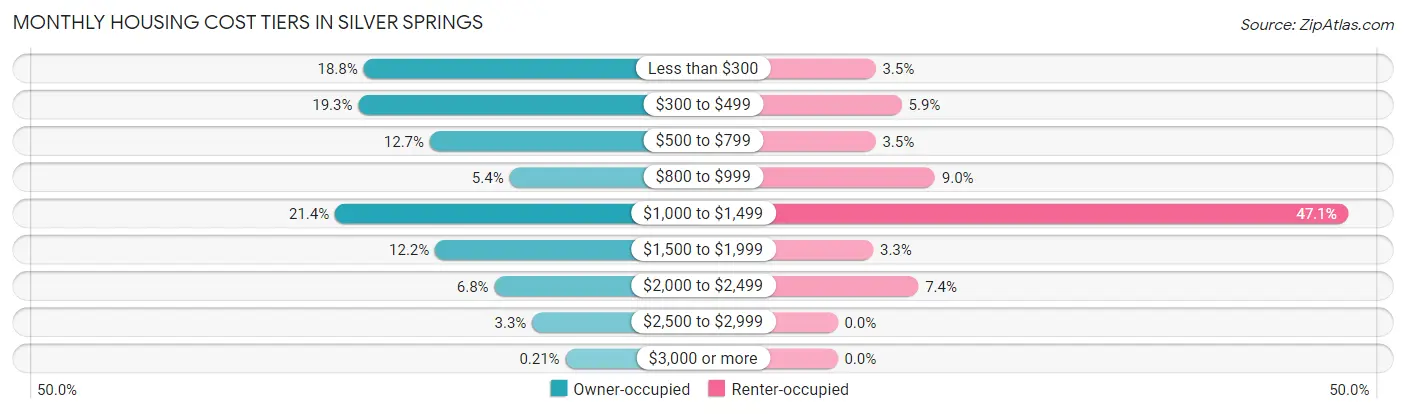
| Monthly Cost | Owner-occupied | Renter-occupied |
| Less than $300 | 351 (18.8%) | 16 (3.5%) |
| $300 to $499 | 360 (19.3%) | 27 (5.9%) |
| $500 to $799 | 237 (12.7%) | 16 (3.5%) |
| $800 to $999 | 100 (5.4%) | 41 (9.0%) |
| $1,000 to $1,499 | 400 (21.4%) | 215 (47.0%) |
| $1,500 to $1,999 | 228 (12.2%) | 15 (3.3%) |
| $2,000 to $2,499 | 126 (6.8%) | 34 (7.4%) |
| $2,500 to $2,999 | 61 (3.3%) | 0 (0.0%) |
| $3,000 or more | 4 (0.2%) | 0 (0.0%) |
| Total | 1,867 (100.0%) | 457 (100.0%) |
Physical Housing Characteristics in Silver Springs
Housing Structures in Silver Springs
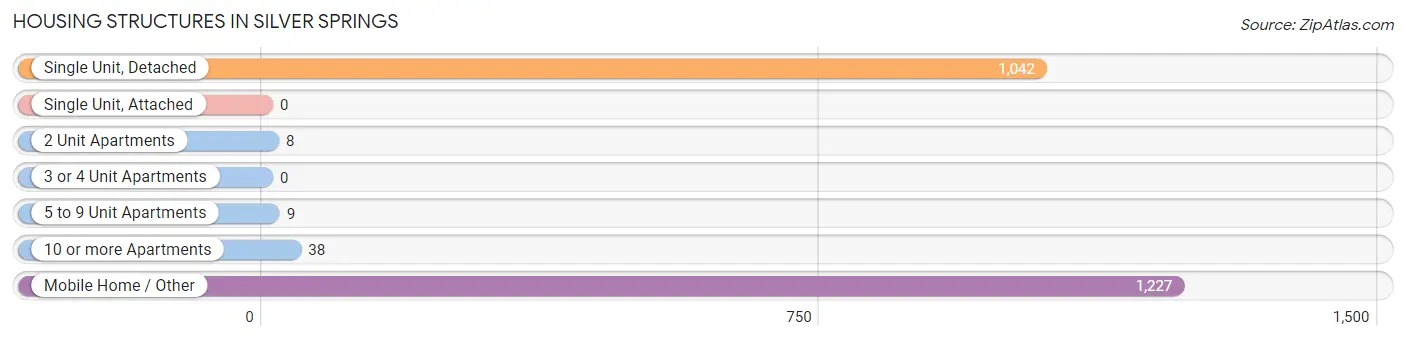
| Structure Type | # Housing Units | % Housing Units |
| Single Unit, Detached | 1,042 | 44.8% |
| Single Unit, Attached | 0 | 0.0% |
| 2 Unit Apartments | 8 | 0.3% |
| 3 or 4 Unit Apartments | 0 | 0.0% |
| 5 to 9 Unit Apartments | 9 | 0.4% |
| 10 or more Apartments | 38 | 1.6% |
| Mobile Home / Other | 1,227 | 52.8% |
| Total | 2,324 | 100.0% |
Housing Structures by Occupancy in Silver Springs
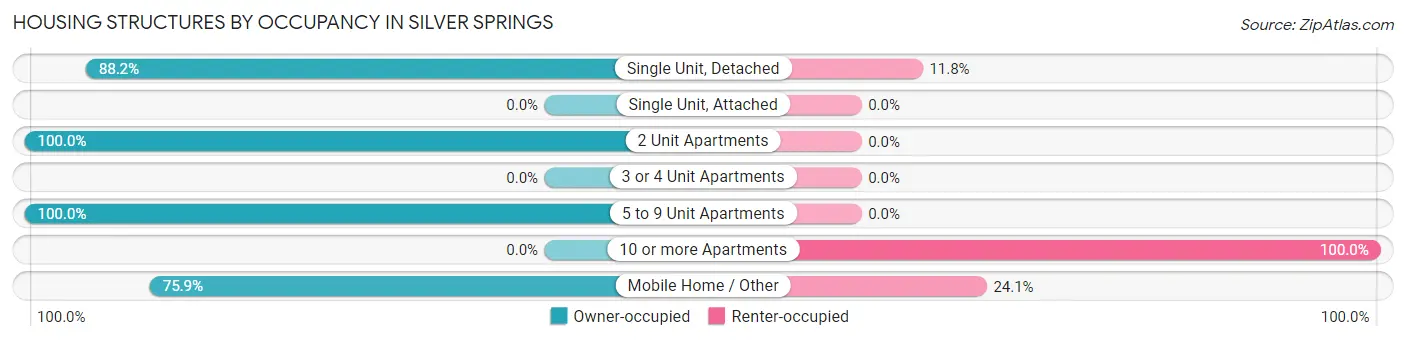
| Structure Type | Owner-occupied | Renter-occupied |
| Single Unit, Detached | 919 (88.2%) | 123 (11.8%) |
| Single Unit, Attached | 0 (0.0%) | 0 (0.0%) |
| 2 Unit Apartments | 8 (100.0%) | 0 (0.0%) |
| 3 or 4 Unit Apartments | 0 (0.0%) | 0 (0.0%) |
| 5 to 9 Unit Apartments | 9 (100.0%) | 0 (0.0%) |
| 10 or more Apartments | 0 (0.0%) | 38 (100.0%) |
| Mobile Home / Other | 931 (75.9%) | 296 (24.1%) |
| Total | 1,867 (80.3%) | 457 (19.7%) |
Housing Structures by Number of Rooms in Silver Springs
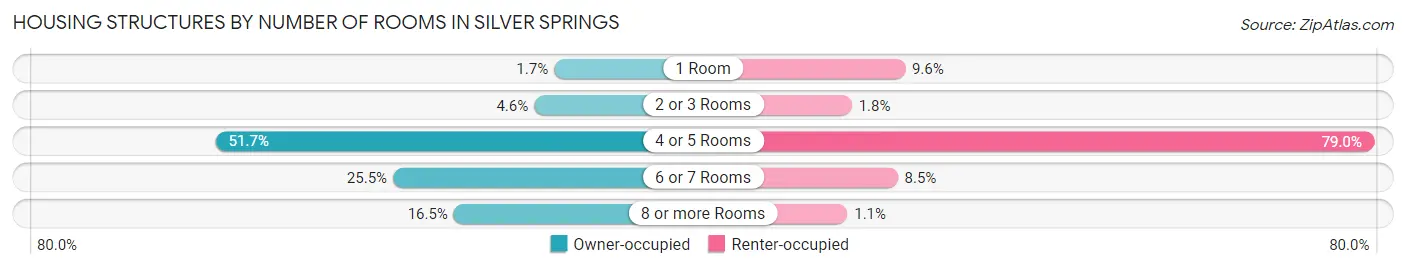
| Number of Rooms | Owner-occupied | Renter-occupied |
| 1 Room | 31 (1.7%) | 44 (9.6%) |
| 2 or 3 Rooms | 86 (4.6%) | 8 (1.8%) |
| 4 or 5 Rooms | 966 (51.7%) | 361 (79.0%) |
| 6 or 7 Rooms | 476 (25.5%) | 39 (8.5%) |
| 8 or more Rooms | 308 (16.5%) | 5 (1.1%) |
| Total | 1,867 (100.0%) | 457 (100.0%) |
Housing Structure by Heating Type in Silver Springs
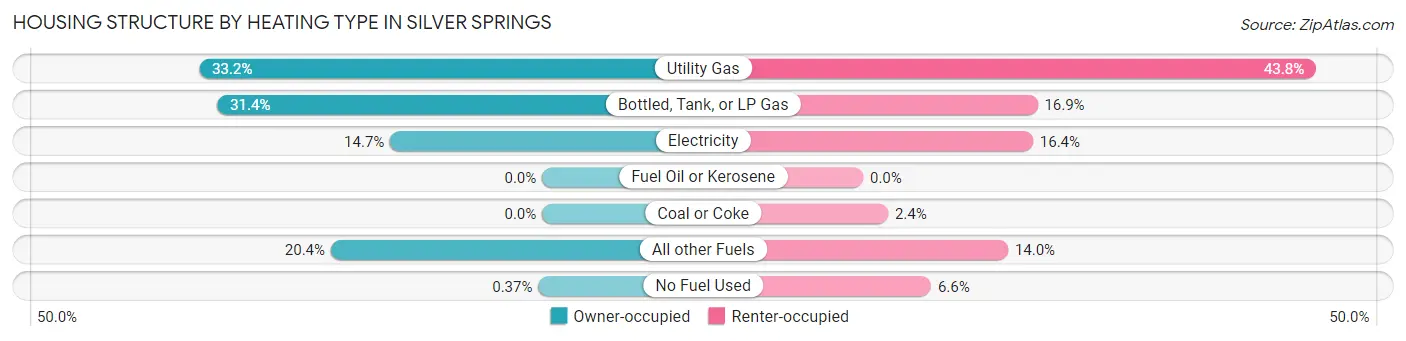
| Heating Type | Owner-occupied | Renter-occupied |
| Utility Gas | 619 (33.2%) | 200 (43.8%) |
| Bottled, Tank, or LP Gas | 586 (31.4%) | 77 (16.9%) |
| Electricity | 274 (14.7%) | 75 (16.4%) |
| Fuel Oil or Kerosene | 0 (0.0%) | 0 (0.0%) |
| Coal or Coke | 0 (0.0%) | 11 (2.4%) |
| All other Fuels | 381 (20.4%) | 64 (14.0%) |
| No Fuel Used | 7 (0.4%) | 30 (6.6%) |
| Total | 1,867 (100.0%) | 457 (100.0%) |
Household Vehicle Usage in Silver Springs
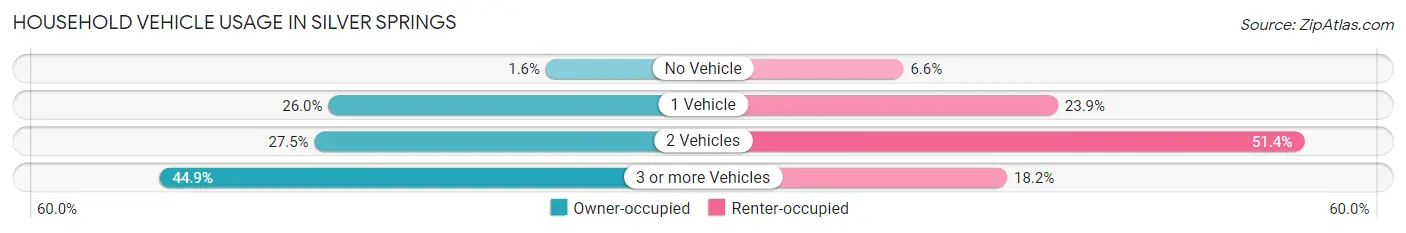
| Vehicles per Household | Owner-occupied | Renter-occupied |
| No Vehicle | 30 (1.6%) | 30 (6.6%) |
| 1 Vehicle | 485 (26.0%) | 109 (23.8%) |
| 2 Vehicles | 514 (27.5%) | 235 (51.4%) |
| 3 or more Vehicles | 838 (44.9%) | 83 (18.2%) |
| Total | 1,867 (100.0%) | 457 (100.0%) |
Real Estate & Mortgages in Silver Springs
Real Estate and Mortgage Overview in Silver Springs
| Characteristic | Without Mortgage | With Mortgage |
| Housing Units | 838 | 1,029 |
| Median Property Value | $184,100 | $271,500 |
| Median Household Income | $29,435 | $76 |
| Monthly Housing Costs | $354 | $4 |
| Real Estate Taxes | $591 | $20 |
Property Value by Mortgage Status in Silver Springs
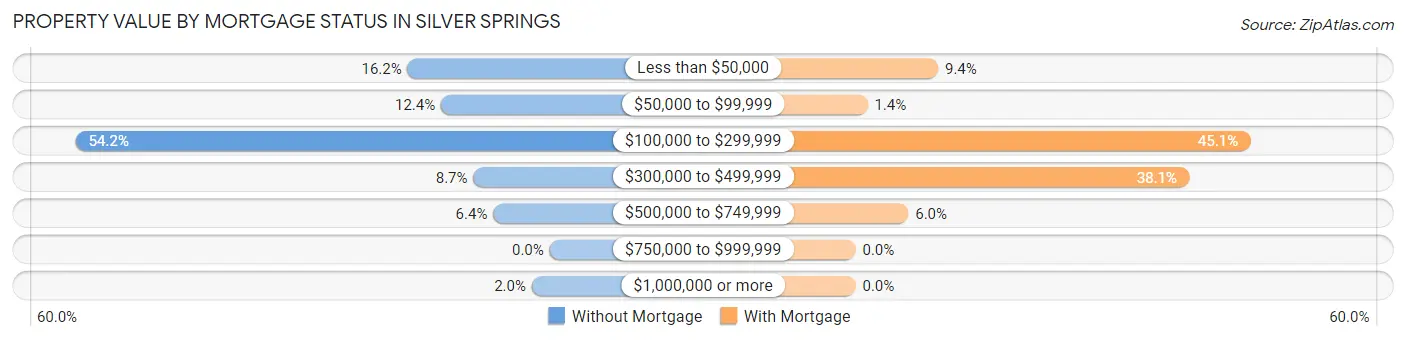
| Property Value | Without Mortgage | With Mortgage |
| Less than $50,000 | 136 (16.2%) | 97 (9.4%) |
| $50,000 to $99,999 | 104 (12.4%) | 14 (1.4%) |
| $100,000 to $299,999 | 454 (54.2%) | 464 (45.1%) |
| $300,000 to $499,999 | 73 (8.7%) | 392 (38.1%) |
| $500,000 to $749,999 | 54 (6.4%) | 62 (6.0%) |
| $750,000 to $999,999 | 0 (0.0%) | 0 (0.0%) |
| $1,000,000 or more | 17 (2.0%) | 0 (0.0%) |
| Total | 838 (100.0%) | 1,029 (100.0%) |
Household Income by Mortgage Status in Silver Springs
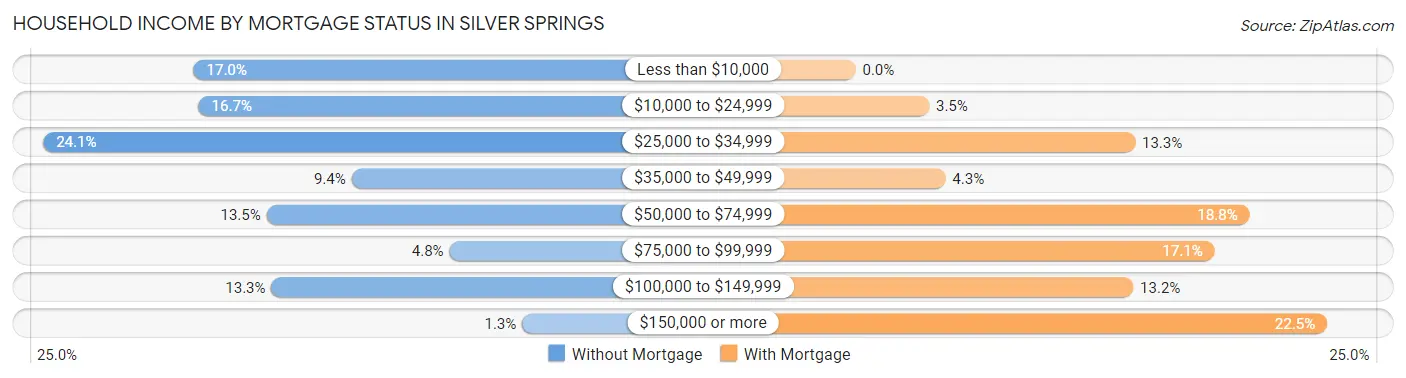
| Household Income | Without Mortgage | With Mortgage |
| Less than $10,000 | 142 (17.0%) | 0 (0.0%) |
| $10,000 to $24,999 | 140 (16.7%) | 36 (3.5%) |
| $25,000 to $34,999 | 202 (24.1%) | 137 (13.3%) |
| $35,000 to $49,999 | 79 (9.4%) | 44 (4.3%) |
| $50,000 to $74,999 | 113 (13.5%) | 193 (18.8%) |
| $75,000 to $99,999 | 40 (4.8%) | 176 (17.1%) |
| $100,000 to $149,999 | 111 (13.3%) | 136 (13.2%) |
| $150,000 or more | 11 (1.3%) | 231 (22.5%) |
| Total | 838 (100.0%) | 1,029 (100.0%) |
Property Value to Household Income Ratio in Silver Springs
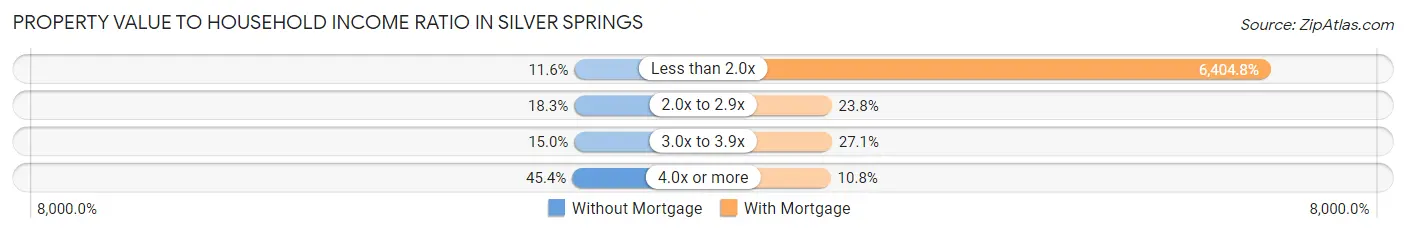
| Value-to-Income Ratio | Without Mortgage | With Mortgage |
| Less than 2.0x | 97 (11.6%) | 65,905 (6,404.8%) |
| 2.0x to 2.9x | 153 (18.3%) | 245 (23.8%) |
| 3.0x to 3.9x | 126 (15.0%) | 279 (27.1%) |
| 4.0x or more | 380 (45.4%) | 111 (10.8%) |
| Total | 838 (100.0%) | 1,029 (100.0%) |
Real Estate Taxes by Mortgage Status in Silver Springs
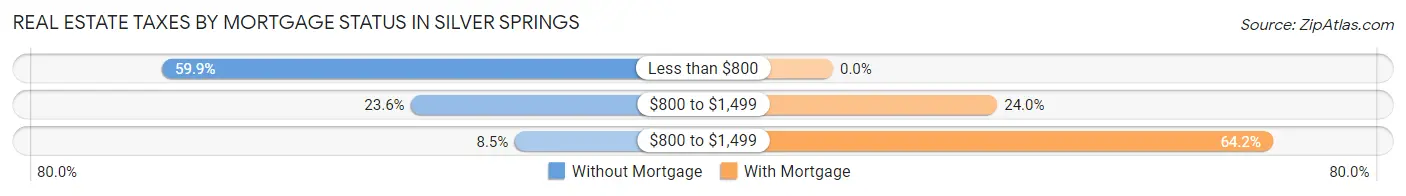
| Property Taxes | Without Mortgage | With Mortgage |
| Less than $800 | 502 (59.9%) | 0 (0.0%) |
| $800 to $1,499 | 198 (23.6%) | 247 (24.0%) |
| $800 to $1,499 | 71 (8.5%) | 661 (64.2%) |
| Total | 838 (100.0%) | 1,029 (100.0%) |
Health & Disability in Silver Springs
Health Insurance Coverage by Age in Silver Springs
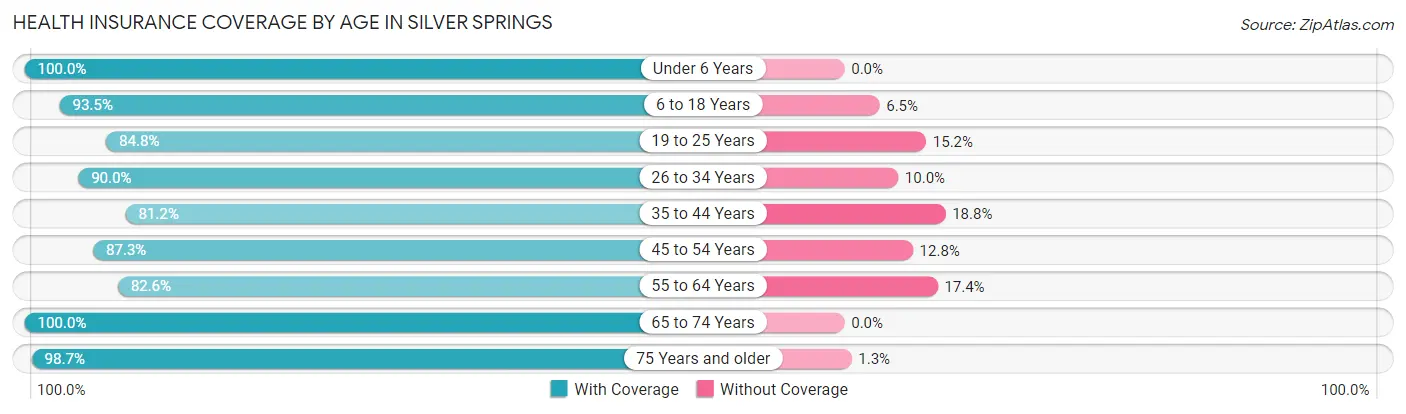
| Age Bracket | With Coverage | Without Coverage |
| Under 6 Years | 119 (100.0%) | 0 (0.0%) |
| 6 to 18 Years | 544 (93.5%) | 38 (6.5%) |
| 19 to 25 Years | 223 (84.8%) | 40 (15.2%) |
| 26 to 34 Years | 405 (90.0%) | 45 (10.0%) |
| 35 to 44 Years | 578 (81.2%) | 134 (18.8%) |
| 45 to 54 Years | 520 (87.3%) | 76 (12.8%) |
| 55 to 64 Years | 918 (82.6%) | 193 (17.4%) |
| 65 to 74 Years | 817 (100.0%) | 0 (0.0%) |
| 75 Years and older | 448 (98.7%) | 6 (1.3%) |
| Total | 4,572 (89.6%) | 532 (10.4%) |
Health Insurance Coverage by Citizenship Status in Silver Springs
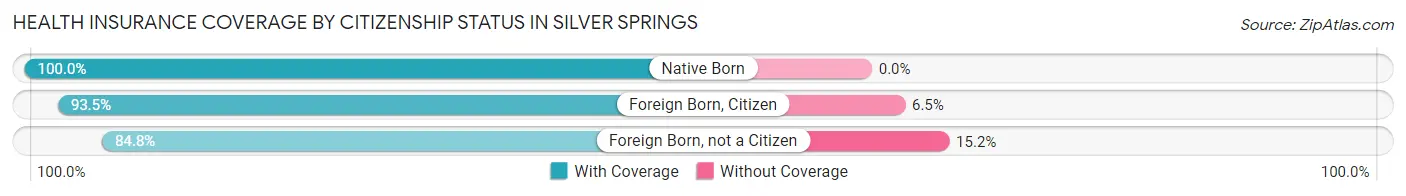
| Citizenship Status | With Coverage | Without Coverage |
| Native Born | 119 (100.0%) | 0 (0.0%) |
| Foreign Born, Citizen | 544 (93.5%) | 38 (6.5%) |
| Foreign Born, not a Citizen | 223 (84.8%) | 40 (15.2%) |
Health Insurance Coverage by Household Income in Silver Springs
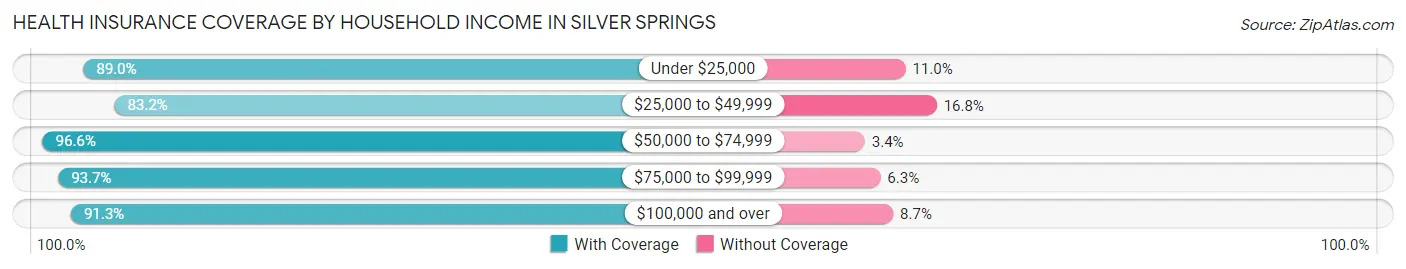
| Household Income | With Coverage | Without Coverage |
| Under $25,000 | 704 (89.0%) | 87 (11.0%) |
| $25,000 to $49,999 | 1,294 (83.2%) | 262 (16.8%) |
| $50,000 to $74,999 | 801 (96.6%) | 28 (3.4%) |
| $75,000 to $99,999 | 491 (93.7%) | 33 (6.3%) |
| $100,000 and over | 1,282 (91.3%) | 122 (8.7%) |
Public vs Private Health Insurance Coverage by Age in Silver Springs
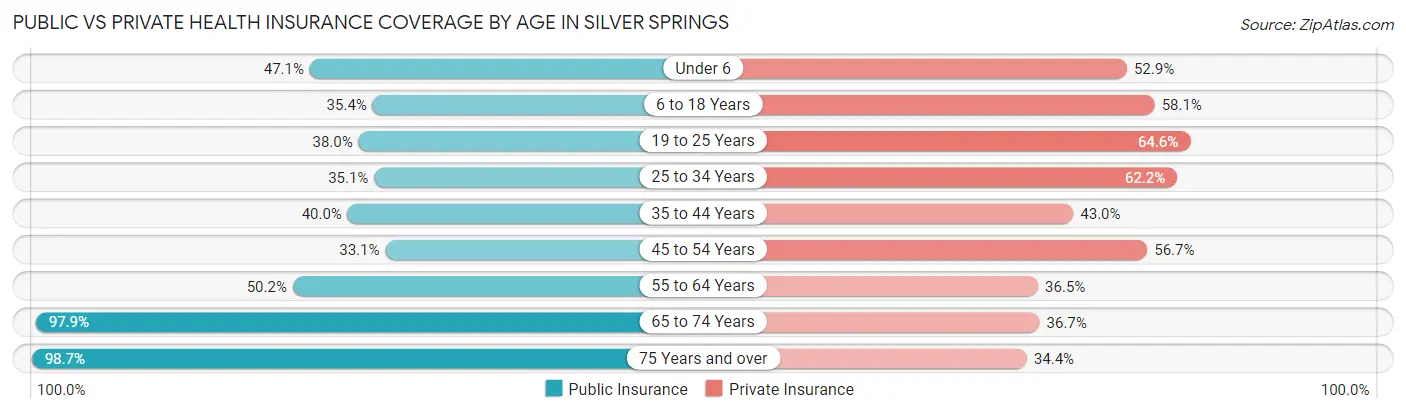
| Age Bracket | Public Insurance | Private Insurance |
| Under 6 | 56 (47.1%) | 63 (52.9%) |
| 6 to 18 Years | 206 (35.4%) | 338 (58.1%) |
| 19 to 25 Years | 100 (38.0%) | 170 (64.6%) |
| 25 to 34 Years | 158 (35.1%) | 280 (62.2%) |
| 35 to 44 Years | 285 (40.0%) | 306 (43.0%) |
| 45 to 54 Years | 197 (33.1%) | 338 (56.7%) |
| 55 to 64 Years | 558 (50.2%) | 405 (36.4%) |
| 65 to 74 Years | 800 (97.9%) | 300 (36.7%) |
| 75 Years and over | 448 (98.7%) | 156 (34.4%) |
| Total | 2,808 (55.0%) | 2,356 (46.2%) |
Disability Status by Sex by Age in Silver Springs
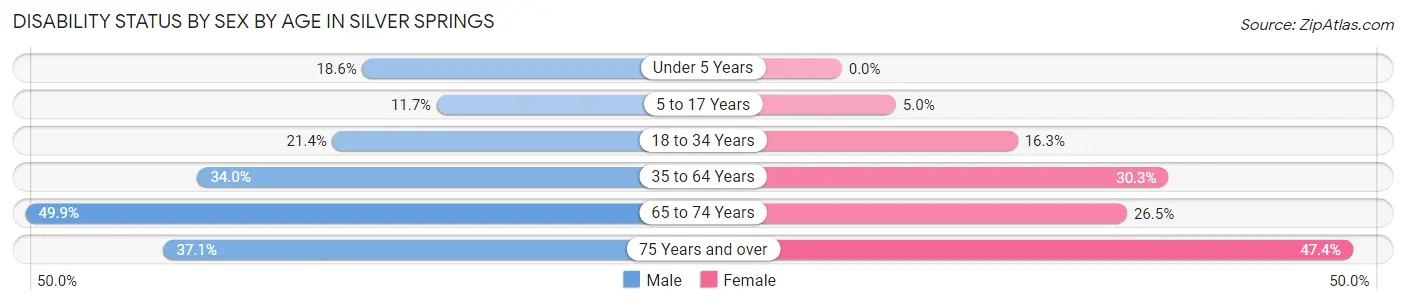
| Age Bracket | Male | Female |
| Under 5 Years | 11 (18.6%) | 0 (0.0%) |
| 5 to 17 Years | 38 (11.7%) | 12 (5.0%) |
| 18 to 34 Years | 103 (21.4%) | 41 (16.3%) |
| 35 to 64 Years | 456 (34.0%) | 326 (30.3%) |
| 65 to 74 Years | 238 (49.9%) | 90 (26.5%) |
| 75 Years and over | 69 (37.1%) | 127 (47.4%) |
Disability Class by Sex by Age in Silver Springs
Disability Class: Hearing Difficulty
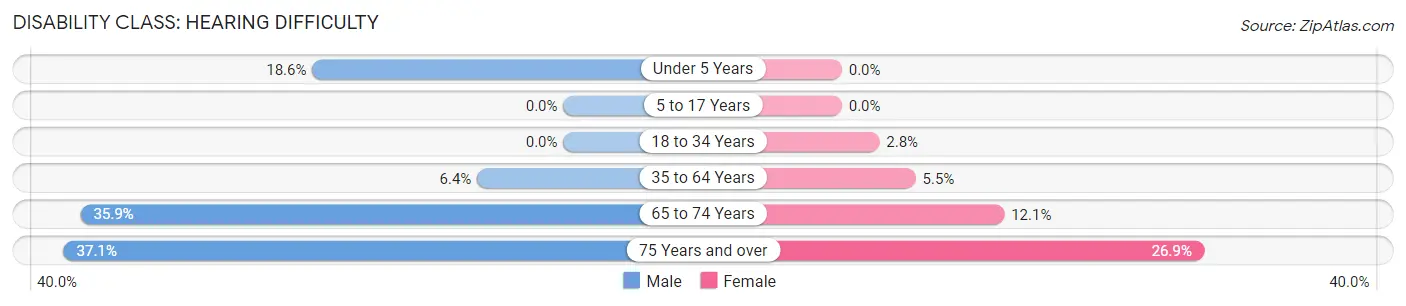
| Age Bracket | Male | Female |
| Under 5 Years | 11 (18.6%) | 0 (0.0%) |
| 5 to 17 Years | 0 (0.0%) | 0 (0.0%) |
| 18 to 34 Years | 0 (0.0%) | 7 (2.8%) |
| 35 to 64 Years | 86 (6.4%) | 59 (5.5%) |
| 65 to 74 Years | 171 (35.8%) | 41 (12.1%) |
| 75 Years and over | 69 (37.1%) | 72 (26.9%) |
Disability Class: Vision Difficulty
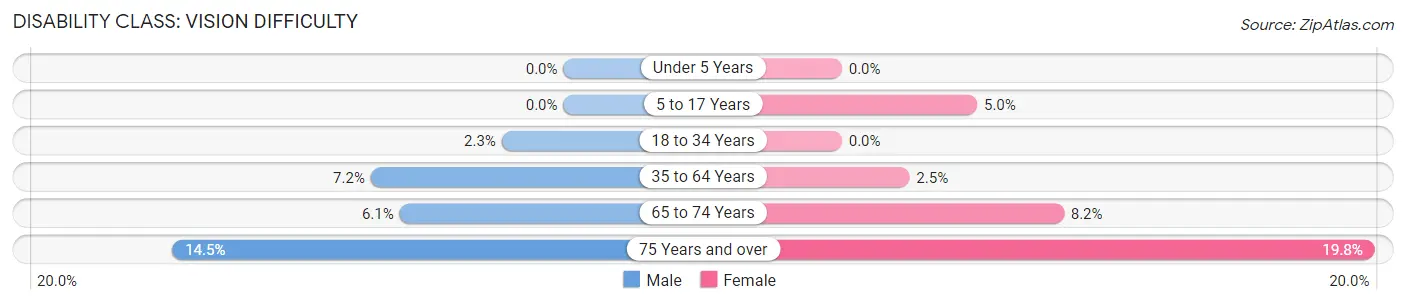
| Age Bracket | Male | Female |
| Under 5 Years | 0 (0.0%) | 0 (0.0%) |
| 5 to 17 Years | 0 (0.0%) | 12 (5.0%) |
| 18 to 34 Years | 11 (2.3%) | 0 (0.0%) |
| 35 to 64 Years | 96 (7.1%) | 27 (2.5%) |
| 65 to 74 Years | 29 (6.1%) | 28 (8.2%) |
| 75 Years and over | 27 (14.5%) | 53 (19.8%) |
Disability Class: Cognitive Difficulty
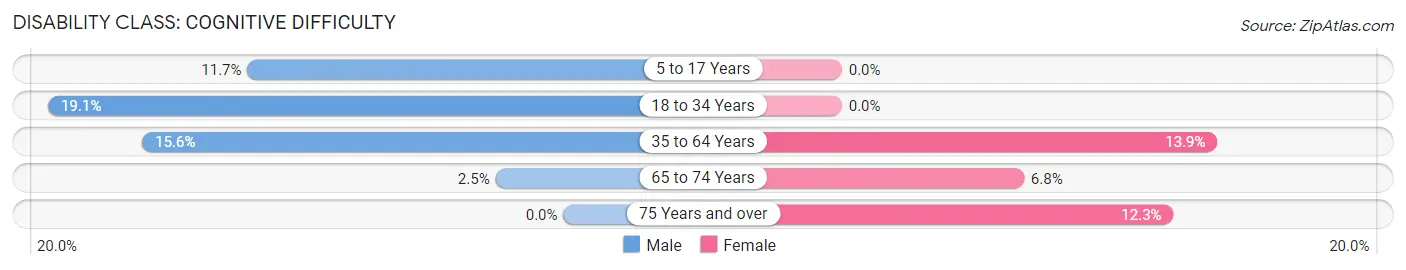
| Age Bracket | Male | Female |
| 5 to 17 Years | 38 (11.7%) | 0 (0.0%) |
| 18 to 34 Years | 92 (19.1%) | 0 (0.0%) |
| 35 to 64 Years | 210 (15.6%) | 150 (13.9%) |
| 65 to 74 Years | 12 (2.5%) | 23 (6.8%) |
| 75 Years and over | 0 (0.0%) | 33 (12.3%) |
Disability Class: Ambulatory Difficulty
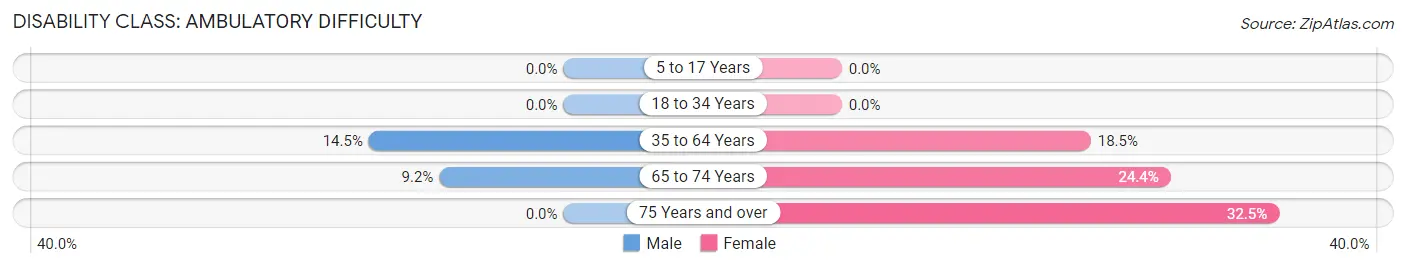
| Age Bracket | Male | Female |
| 5 to 17 Years | 0 (0.0%) | 0 (0.0%) |
| 18 to 34 Years | 0 (0.0%) | 0 (0.0%) |
| 35 to 64 Years | 194 (14.4%) | 199 (18.5%) |
| 65 to 74 Years | 44 (9.2%) | 83 (24.4%) |
| 75 Years and over | 0 (0.0%) | 87 (32.5%) |
Disability Class: Self-Care Difficulty
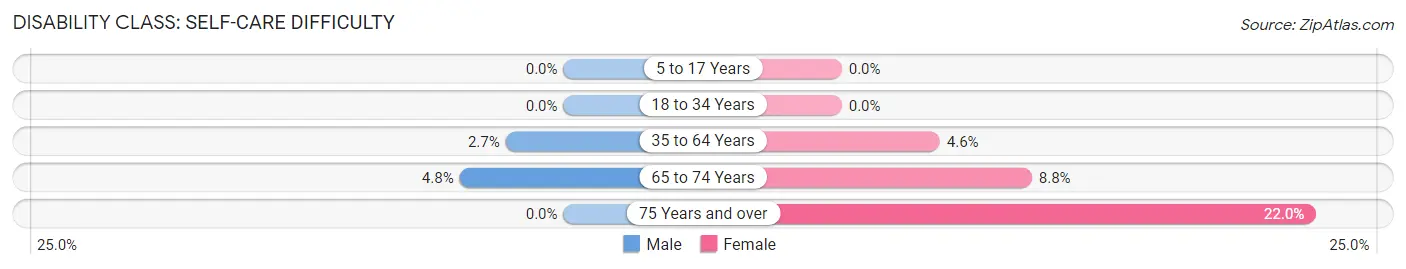
| Age Bracket | Male | Female |
| 5 to 17 Years | 0 (0.0%) | 0 (0.0%) |
| 18 to 34 Years | 0 (0.0%) | 0 (0.0%) |
| 35 to 64 Years | 36 (2.7%) | 49 (4.5%) |
| 65 to 74 Years | 23 (4.8%) | 30 (8.8%) |
| 75 Years and over | 0 (0.0%) | 59 (22.0%) |
Technology Access in Silver Springs
Computing Device Access in Silver Springs
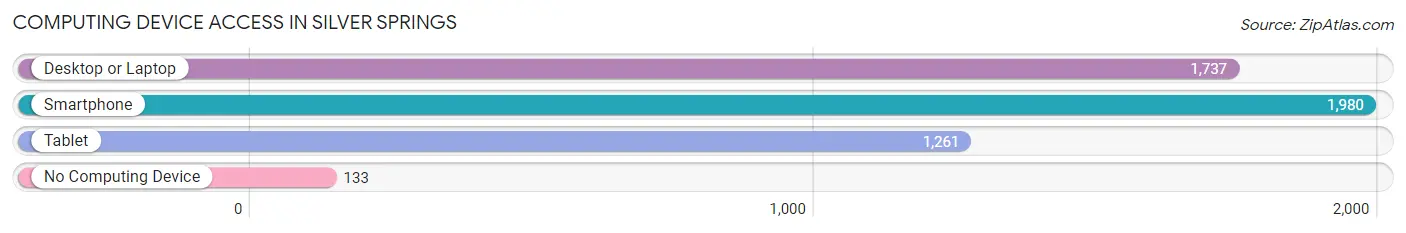
| Device Type | # Households | % Households |
| Desktop or Laptop | 1,737 | 74.7% |
| Smartphone | 1,980 | 85.2% |
| Tablet | 1,261 | 54.3% |
| No Computing Device | 133 | 5.7% |
| Total | 2,324 | 100.0% |
Internet Access in Silver Springs
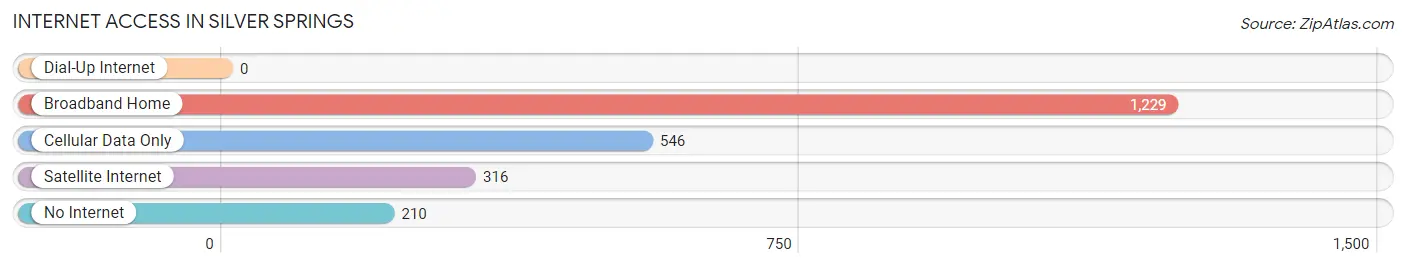
| Internet Type | # Households | % Households |
| Dial-Up Internet | 0 | 0.0% |
| Broadband Home | 1,229 | 52.9% |
| Cellular Data Only | 546 | 23.5% |
| Satellite Internet | 316 | 13.6% |
| No Internet | 210 | 9.0% |
| Total | 2,324 | 100.0% |
Silver Springs Summary
Introduction
Silver Springs is a small unincorporated community located in Lyon County, Nevada. It is situated in the western part of the state, approximately 30 miles east of Carson City and about 50 miles southeast of Reno. The community is located along the banks of the Carson River and is surrounded by the majestic Sierra Nevada Mountains. Silver Springs is a rural community with a population of approximately 2,000 people. The town is known for its natural beauty and its proximity to the nearby Pyramid Lake, which is a popular destination for fishing, camping, and other outdoor activities.
History
Silver Springs was first settled in the late 1800s by ranchers and farmers who were attracted to the area by the abundance of water and the fertile soil. The town was officially established in 1876 and was named after the nearby Silver Springs, which was a popular destination for travelers and settlers. The town quickly grew and by the early 1900s, it had become a bustling community with a variety of businesses, including a hotel, a general store, and a post office.
In the early 1900s, the town was also home to a number of saloons and gambling halls, which attracted visitors from all over the region. The town was also known for its wild horse races, which were held on the main street. In the 1920s, the town experienced a period of growth and prosperity, as the nearby railroad line was extended to the town. This allowed for the transportation of goods and services to and from the town, which further increased its economic activity.
Geography
Silver Springs is located in the western part of Nevada, approximately 30 miles east of Carson City and about 50 miles southeast of Reno. The town is situated along the banks of the Carson River and is surrounded by the majestic Sierra Nevada Mountains. The town is located in a semi-arid climate, with hot summers and cold winters. The average annual temperature is around 50 degrees Fahrenheit, with temperatures ranging from the low 30s in the winter to the high 90s in the summer.
The town is located in a valley, which is surrounded by mountains on all sides. The nearby Pyramid Lake is a popular destination for fishing, camping, and other outdoor activities. The lake is also home to a variety of wildlife, including bald eagles, ospreys, and other birds.
Economy
Silver Springs is a rural community with a population of approximately 2,000 people. The town is known for its natural beauty and its proximity to the nearby Pyramid Lake, which is a popular destination for fishing, camping, and other outdoor activities. The town is also home to a variety of businesses, including a hotel, a general store, and a post office.
The town is also home to a number of small businesses, including a gas station, a restaurant, and a grocery store. The town is also home to a number of agricultural operations, including cattle ranches and farms. The town is also home to a number of manufacturing operations, including a furniture factory and a metal fabrication plant.
Demographics
As of the 2010 census, the population of Silver Springs was 2,000 people. The racial makeup of the town was 94.2% White, 0.7% African American, 0.7% Native American, 0.7% Asian, 0.3% Pacific Islander, and 2.3% from other races. The median household income was $37,500, and the median family income was $41,250. The per capita income was $17,500.
Conclusion
Silver Springs is a small unincorporated community located in Lyon County, Nevada. It is situated in the western part of the state, approximately 30 miles east of Carson City and about 50 miles southeast of Reno. The community is located along the banks of the Carson River and is surrounded by the majestic Sierra Nevada Mountains. Silver Springs is a rural community with a population of approximately 2,000 people. The town is known for its natural beauty and its proximity to the nearby Pyramid Lake, which is a popular destination for fishing, camping, and other outdoor activities. The town is also home to a variety of businesses, including a hotel, a general store, and a post office. The town is also home to a number of small businesses, including a gas station, a restaurant, and a grocery store. The town is also home to a number of agricultural operations, including cattle ranches and farms. The town is also home to a number of manufacturing operations, including a furniture factory and a metal fabrication plant. As of the 2010 census, the population of Silver Springs was 2,000 people. The racial makeup of the town was 94.2% White, 0.7% African American, 0.7% Native American, 0.7% Asian, 0.3% Pacific Islander, and 2.3% from other races. The median household income was $37,500, and the median family income was $41,250. The per capita income was $17,500.
Common Questions
What is Per Capita Income in Silver Springs?
Per Capita income in Silver Springs is $27,693.
What is the Median Family Income in Silver Springs?
Median Family Income in Silver Springs is $52,679.
What is the Median Household income in Silver Springs?
Median Household Income in Silver Springs is $47,584.
What is Income or Wage Gap in Silver Springs?
Income or Wage Gap in Silver Springs is 20.2%.
Women in Silver Springs earn 79.8 cents for every dollar earned by a man.
What is Inequality or Gini Index in Silver Springs?
Inequality or Gini Index in Silver Springs is 0.45.
What is the Total Population of Silver Springs?
Total Population of Silver Springs is 5,117.
What is the Total Male Population of Silver Springs?
Total Male Population of Silver Springs is 2,882.
What is the Total Female Population of Silver Springs?
Total Female Population of Silver Springs is 2,235.
What is the Ratio of Males per 100 Females in Silver Springs?
There are 128.95 Males per 100 Females in Silver Springs.
What is the Ratio of Females per 100 Males in Silver Springs?
There are 77.55 Females per 100 Males in Silver Springs.
What is the Median Population Age in Silver Springs?
Median Population Age in Silver Springs is 52.6 Years.
What is the Average Family Size in Silver Springs
Average Family Size in Silver Springs is 2.9 People.
What is the Average Household Size in Silver Springs
Average Household Size in Silver Springs is 2.2 People.
How Large is the Labor Force in Silver Springs?
There are 1,923 People in the Labor Forcein in Silver Springs.
What is the Percentage of People in the Labor Force in Silver Springs?
43.0% of People are in the Labor Force in Silver Springs.
What is the Unemployment Rate in Silver Springs?
Unemployment Rate in Silver Springs is 9.0%.